
Institut für Mathematik - uni-augsburg.de · test data (available from the authors). One data set...
21
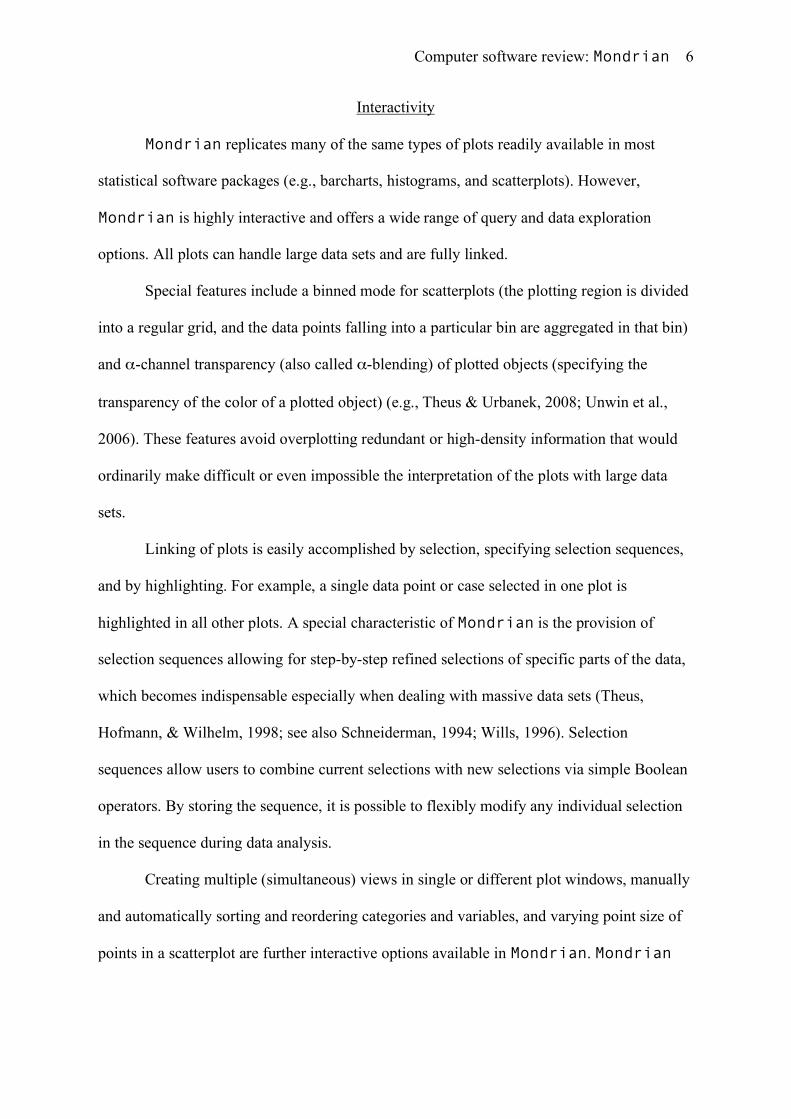
U n i v e r s i t ä t A u g s b u r g Institut für Mathematik Ali ¨ Unl¨ u, Anatol Sargin Interactive Visualization of Assessment Data: The Software Package Mondrian Preprint Nr. 04/2008 — 06. Februar 2008 Institut f¨ ur Mathematik, Universit¨ atsstraße, D-86 135 Augsburg http://www.math.uni-augsburg.de/
Transcript of Institut für Mathematik - uni-augsburg.de · test data (available from the authors). One data set...

U n i v e r s i t ä t A u g s b u r g
Institut fürMathematik
Ali Unlu, Anatol Sargin
Interactive Visualization of Assessment Data: The Software PackageMondrian
Preprint Nr. 04/2008 — 06. Februar 2008Institut fur Mathematik, Universitatsstraße, D-86 135 Augsburg http://www.math.uni-augsburg.de/

Impressum:
Herausgeber:
Institut fur MathematikUniversitat Augsburg86135 Augsburghttp://www.math.uni-augsburg.de/forschung/preprint/
ViSdP:
Ali UnluInstitut fur MathematikUniversitat Augsburg86135 Augsburg
Preprint: Samtliche Rechte verbleiben den Autoren c© 2008

[Submitted to: Applied Psychological Measurement]
Running Head: Computer software review: Mondrian
Interactive visualization of assessment data: The software package Mondrian
Ali Ünlü and Anatol Sargin
Department of Mathematics, University of Augsburg, Germany
January 17, 2008
Correspondence to: Ali Ünlü Department of Mathematics University of Augsburg Universitätsstrasse 14 D-86159 Augsburg Germany Phone: +49 821 598-2236 Fax: +49 821 598-2200 Email: [email protected]

Computer software review: Mondrian 2
Abstract
Mondrian is state-of-the-art statistical data visualization software featuring modern
interactive visualization techniques for a wide range of data types. This paper reviews the
capabilities, functionality, and interactive properties of this software package. Key features
of Mondrian are illustrated with data from the Programme for International Student
Assessment (PISA) and for item analysis applications.
Keywords: Mondrian; R; Data visualization software; Interactive graphics;
Spineplot; Item analysis; Empirical Item Response Function; Distractor Analysis;
Differential Item Functioning; Programme for International Student Assessment (PISA) data

Computer software review: Mondrian 3
Introduction
Data visualization is a vital tool in decision support. Graphics are widely used in
modern applied statistics, because they are easy to create, convenient to use, and they can
present information effectively (e.g., Cook & Swayne, 2007; Unwin, Theus, & Hofmann,
2006; Wilkinson, 2005; Young, Valero-Mora, & Friendly, 2006). Visualizations, however,
are often static (e.g., Emerson, 1998), merely utilized for the presentation rather than the
exploration of data. Interactive statistical data visualization, on the other hand, is a powerful
alternative for the detection of structural patterns and regularities in the data. Interactive
graphics become indispensable especially when analyzing large and complex data sets, in
which case statistical modeling and methodologies, generally, fail to account for the
complexity of the data satisfactorily (e.g., Unwin, Volinsky, & Winkler, 2003).
This review evaluates Mondrian, a state-of-the-art, interactive data visualization
software developed by Theus (2002a, 2002b). A forthcoming book by Theus and Urbanek
(2008) thoroughly discusses applications of the software Mondrian to a number of real
data examples. Mondrian is a stand-alone package with a wide range of graphics and
interactive features, and has been developed in the programming language Java. It is
platform independent and is freely available for Windows, Mac OS X, and UNIX, by
download from Mondrian’s web sites at http://www.rosuda.org/Mondrian/ or
http://mondrian.theusrus.de/. These web sites in particular contain a tutorial
and sample data sets that can be loaded and tested with Mondrian. (Whereas on Mac OS
X a suitable Java virtual machine will be pre-installed, Windows users may have to install
a recent Java runtime environment from Sun Microsystems at
http://www.sun.com/, if not already installed. On UNIX one needs to download the
jar-file of Mondrian, and start it manually using the command mymachine> java –
jar Mondrian.jar.)

Computer software review: Mondrian 4
Data management capabilities
Mondrian in principle has no practical limitations on the size of data sets that can
be managed. The software can load and export data in local tab-delimited ASCII files and
also connect directly to distributed or online databases via the JDBC interface. Another
useful feature of Mondrian is the simplicity with which it allows to generate new variables
from the initial ones of the loaded data set, (a) by calculating functions of selected variables
(such as the sum or ratio of two variables, or the logarithm of a variable), or (b) by deriving
variables from selections or color assignments.
Plotting capabilities
Mondrian implements interactive graphics for a wide range of data types including
missing value plots, and plots for:1
(a) categorical data: (weighted) barcharts and spineplots (Hummel, 1996), (weighted)
mosaic plots and their variations ‘same bin size’ (each cell is allocated the same amount of
space, and the information is reduced to the binary case of whether a cell is or is not empty),
‘fluctuation diagram’ (each cell is allocated the same amount of space, and the cell with the
maximum frequency fills its space completely, thus fixing the scale for the rest of the
diagram), and ‘multiple barchart’ (each cell is allocated the same amount of space, and only
the heights of the bars in the cells are scaled) (Friendly, 1994; Hartigan & Kleiner, 1981;
Hofmann, 1998, 2000, 2007), and double decker plots (instead of alternately splitting the x
and y axes as in a mosaic plot, only the x axis is used) (Hofmann, 2007; Hofmann &
Wilhelm, 2001);
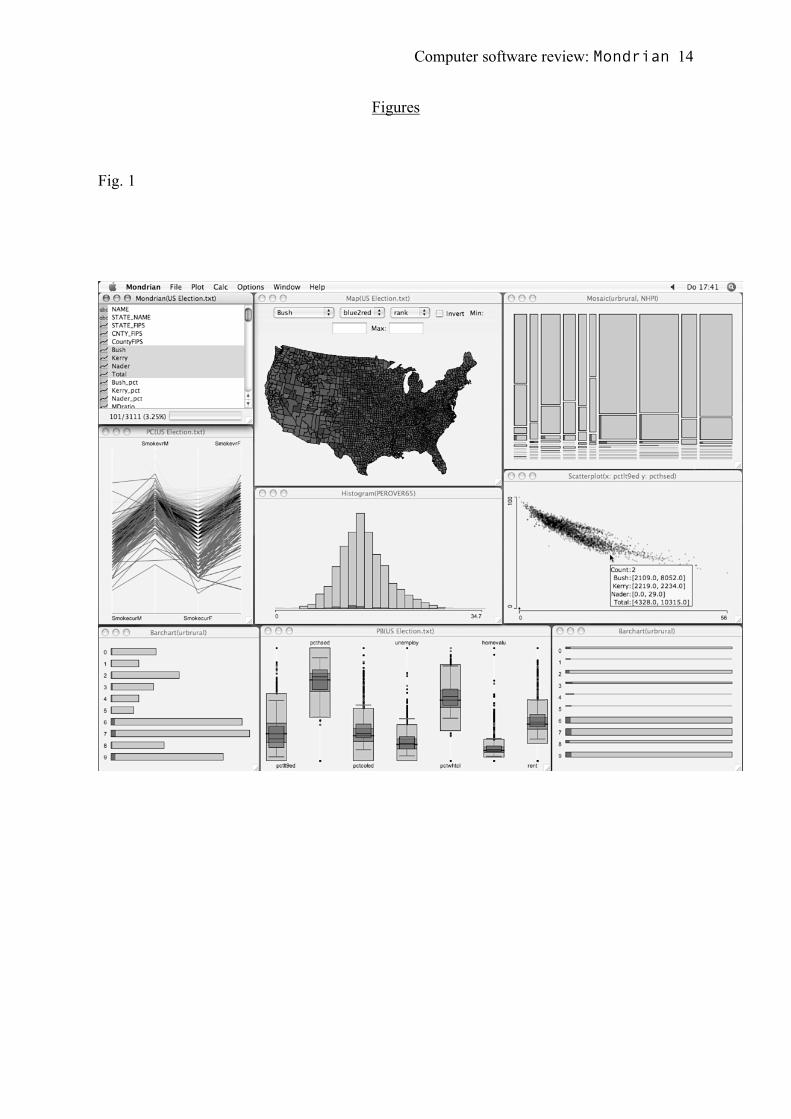
1 Some of the following plot types are shown in the figures that we present. There are examples of a choropleth map, mosaic plot,
parallel coordinate plot, histogram, scatterplot, barchart, parallel boxplot, and spineplot in Figure 1, in respective order, top down from left to right. Examples of barcharts and spineplots can also be found in Figures 2-4. Throughout this review, special care is taken to provide a comprehensive list of references for detailed information and further reading on the concepts and issues that we mention or discuss.

Computer software review: Mondrian 5
(b) continuous data: (weighted) histograms and spinograms (all bars are normalized
to have the same height, with proportional widths) (cf. Hofmann & Theus, under revision),
scatterplots and scatterplot matrices, parallel coordinate plots (Inselberg, 1985, 1998;
Wegman, 1990), parallel boxplots, and boxplots y by x;
(c) geographical data: choropleth maps (maps with color-shadings to represent
quantities) (Carr, Olsen, Courbois, Pierson, & Carr, 1998; Carr, Zhang, & Li, 2002; Dykes,
MacEachren, & Kraak, 2005).
All types of plots can handle missing values (coded as NA in the input file). Missing
data can even be included as a separate group. For example, when plotting categorical data,
missing values constitute an extra group, and the associated plot object is colored white.
Figure 1 provides a gallery screenshot from Mondrian that illustrates some of the
aforementioned plot types.2
[Insert Fig. 1 about here]
Mondrian can fully interact with the R statistical computing environment (R
Development Core Team, 2006; http://www.r-project.org/) to enhance data
analysis with statistical procedures.3 This interaction between Mondrian and R provides
additional plotting capabilities including: (a) density estimation; (b) smoothing using R
functions such as loess() and regression splines with confidence intervals; (c)
multidimensional scaling; and (d) principal component analysis.
Mondrian also includes a model navigator for the stepwise graphical building of
loglinear models using mosaic plots (Theus & Lauer, 1999). Table 1 summarizes key
features of Mondrian.
[Insert Table 1 about here]
2 For black and white reproduction all figures in this review are presented in gray scales only. 3 Requires connection to Rserve, a freely accessible TCP/IP server.
Computer software review: Mondrian 6
Interactivity
Mondrian replicates many of the same types of plots readily available in most
statistical software packages (e.g., barcharts, histograms, and scatterplots). However,
Mondrian is highly interactive and offers a wide range of query and data exploration
options. All plots can handle large data sets and are fully linked.
Special features include a binned mode for scatterplots (the plotting region is divided
into a regular grid, and the data points falling into a particular bin are aggregated in that bin)
and α-channel transparency (also called α-blending) of plotted objects (specifying the
transparency of the color of a plotted object) (e.g., Theus & Urbanek, 2008; Unwin et al.,
2006). These features avoid overplotting redundant or high-density information that would
ordinarily make difficult or even impossible the interpretation of the plots with large data
sets.
Linking of plots is easily accomplished by selection, specifying selection sequences,
and by highlighting. For example, a single data point or case selected in one plot is
highlighted in all other plots. A special characteristic of Mondrian is the provision of
selection sequences allowing for step-by-step refined selections of specific parts of the data,
which becomes indispensable especially when dealing with massive data sets (Theus,
Hofmann, & Wilhelm, 1998; see also Schneiderman, 1994; Wills, 1996). Selection
sequences allow users to combine current selections with new selections via simple Boolean
operators. By storing the sequence, it is possible to flexibly modify any individual selection
in the sequence during data analysis.
Creating multiple (simultaneous) views in single or different plot windows, manually
and automatically sorting and reordering categories and variables, and varying point size of
points in a scatterplot are further interactive options available in Mondrian. Mondrian

Computer software review: Mondrian 7
also allows for standard, logical, and censored zooming, and color brushing (persistent
assignment of colors; for instance, to mark outliers more permanently).
Mondrian’s help system includes a reference card that summaries all keyboard and
mouse shortcuts, for the Windows and Mac OS X operating systems; for instance,
including information on how to export graphics. However, the reference card is not mature,
for instance not allowing for changing the size, copying parts, or even adding new entries.
Sample graphics and applications4
Some of the key features of Mondrian are next illustrated with part of empirical
data from the 2003 Programme for International Student Assessment (PISA;
http://www.pisa.oecd.org) using two data sets with multiple-choice or open format
test data (available from the authors). One data set contains item responses by 317 German
students on a 12-item dichotomously scored, mathematical literacy test . This data set also
included a sex variable coded as 1 = female or 2 = male. The other data set contains item
responses by another set of 327 German students on another 5-item polytomously scored,
mathematical literacy test.
An interesting application of Mondrian might be to conduct a visual item analysis.
For example, Figure 2 shows side-by-side spineplots (upper plots) for two items (Items 6 and
7 of the first data set) where the proportions of correct responses (horizontal axes) are plotted
as a function of the number-correct (total) scores (vertical axes). The marginal absolute
correct and incorrect values are displayed as barcharts below the spineplots. This type of
depiction provides an empirical item response function plot and also suggests a positive
linear relationship between the conditional correct item response proportions and the total
scores. This type of plot could be supplemented with a smoothing function, if desired.
4 This section has greatly benefited from comments made by Professor Richard M. Luecht.

Computer software review: Mondrian 8
[Insert Fig. 2 about here]
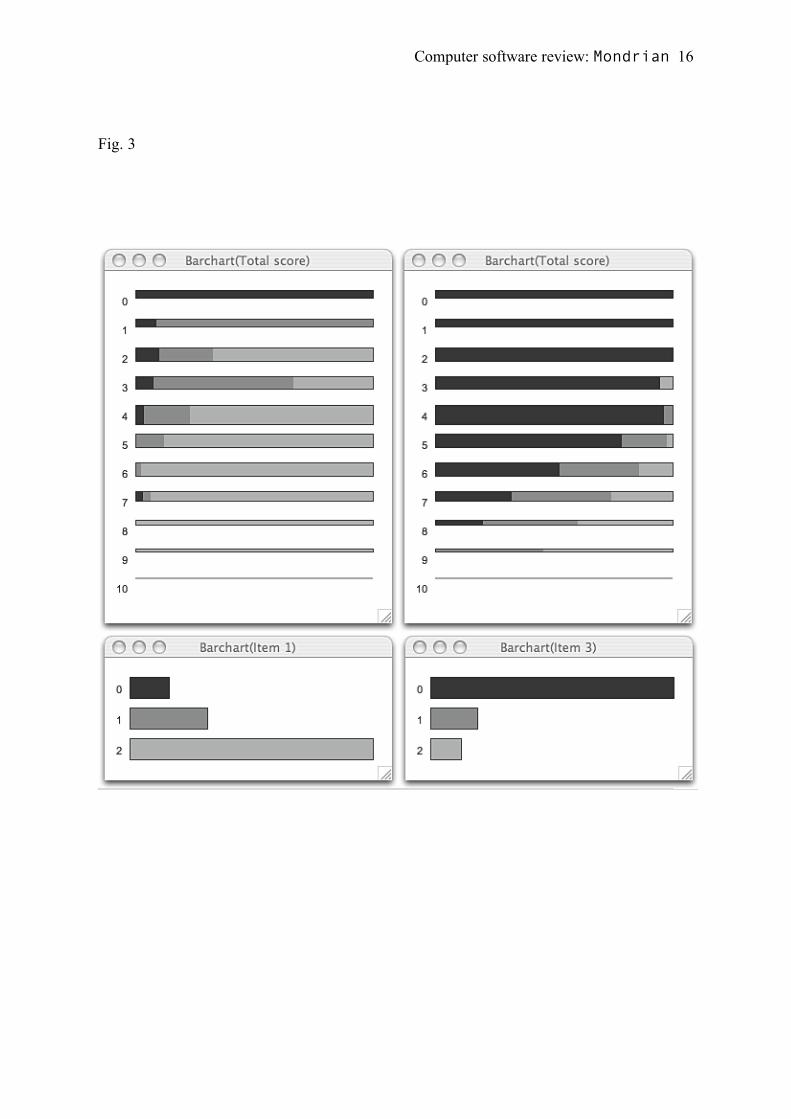
Figure 3 provides a corresponding visual ‘distractor analysis’ that shows the
proportions of examinees responding to each response category for two items (Items 1 and 3
of the second data set), with the proportions again conditional on number-correct (total)
score. This type of visual analysis might detect particular incorrect distractors that are
proportionally more attractive for examinees within particular regions of the total score
scale.
[Insert Fig. 3 about here]
Figure 4 displays the separate proportion-correct bars for one item (Item 4 of the first
data set) as a function of the total score for males and females. This type of graphic provides
a crude visual analysis of differential item functioning or DIF (e.g., Holland and Wainer,
1993). In this type of plot, we do not get an aggregate measure of DIF, but perhaps a better
indication of where along the total score scale, if anyplace, the two sex groups, matched on
total score, differ in their apparent response to a particular item. This example does not
imply that Mondrian would replace conventional DIF analyses, however, it could certainly
supplement the information provided to test developers or item editors for items flagged as
demonstrating significant DIF.
[Insert Fig. 4 about here]
Conclusions
This review is intended to inform and encourage people working in such disciplines
as psychometrics and, even broader, quantitative psychology, to take advantage of the most
current techniques in the field of interactive graphics. As illustrated by the exemplar graphics
of assessment data, the latter can provide a way of better understanding the data and

Computer software review: Mondrian 9
supporting the process of model building, which shall be a useful supplement to the applied
work of a variety of measurement professionals and researchers.
Mondrian can do quite well, in this respect. Different views demonstrated by
graphics implemented in Mondrian help users to interactively and flexibly see, with
relatively low investment of time to become proficient, particular aspects of their data.
Besides being available for free, the software package Mondrian is constantly updated to
cover recent developments in the research on interactive graphics. It is intuitive and easy to
use, and features many powerful capabilities for the efficient analysis of (even very large)
data.
Acknowledgments
We thank Professor Antony R. Unwin for introducing us to interactive graphics and
the software Mondrian, for motivating us to write this review, and for his helpful
comments on a first draft of the manuscript. Thanks are also given to Martin Theus for his
invaluable expertise and help that he provided us, and to Waqas Ahmed Malik for fruitful
discussions about Mondrian. We are grateful to Professor Mark L. Davison, Editor in
Chief, for his work on this review. In particular, we are deeply indebted to Professor Richard
M. Luecht, Computer Software Review Editor. His critical and valuable comments and
suggestions have improved the manuscript greatly.

Computer software review: Mondrian 10
References
Carr, D.B., Olsen, A.R., Courbois, J.-Y.P., Pierson, S.M., & Carr, D.A. (1998). Linked
micromap plots: Named and described. Statistical Computing & Statistical Graphics
Newsletter, 9, 24-32.
Carr, D.B., Zhang, Y., & Li, Y. (2002). Dynamically conditioned choropleth maps.
Statistical Computing & Statistical Graphics Newsletter, 13, 2-7.
Cook, D., & Swayne, D. (2007). Interactive and dynamic graphics for data analysis. New
York: Springer.
Dykes, J.A., MacEachren, A.M., & Kraak, M.-J. (Eds.) (2005). Exploring geovisualization.
Amsterdam: Elsevier.
Emerson, J.W. (1998). Mosaic displays in S-Plus: A general implementation and a case
study. Statistical Computing & Statistical Graphics Newsletter, 9, 17-23.
Friendly, M. (1994). Mosaic displays for multi-way contingency tables. Journal of the
American Statistical Association, 89, 190-200.
Hartigan, J.A., & Kleiner, B. (1981). Mosaics for contingency tables. In W.F. Eddy (Ed.),
Computer science and statistics: Proceedings of the thirteenth symposium on the
interface (pp. 268-273). New York: Springer.
Hofmann, H. (1998). Simpson on board the Titanic? Interactive methods for dealing with
multivariate categorical data. Statistical Computing & Statistical Graphics
Newsletter, 9, 16-19.
Hofmann, H. (2000). Exploring categorical data: Interactive mosaic plots.
Metrika, 51, 11-26.
Hofmann, H. (2007). Mosaic plots and their variants. In C.H. Chen, W. Haerdle, & A.R.
Unwin (Eds.), Handbook of data visualization. Heidelberg: Springer.

Computer software review: Mondrian 11
Hofmann, H., & Theus, M. (under revision). Interactive graphics for visualizing conditional
densities. Journal of Computational and Graphical Statistics.
Hofmann, H., & Wilhelm, A.F.X. (2001). Visual comparison of association rules.
Computational Statistics, 16, 399-415.
Holland, P.W., & Wainer, H. (1993). Differential item functioning. Hillsdale, NJ: Lawrence
Erlbaum Associates.
Hummel, J. (1996). Linked bar charts: Analysing categorical data graphically.
Computational Statistics, 11, 23-33.
Inselberg, A. (1985). The plane with parallel coordinates. The Visual Computer, 1, 69-91.
Inselberg, A. (1998). Visual data mining with parallel coordinates. Computational Statistics,
13, 47-63.
R Development Core Team (2006). R: A language and environment for statistical computing
(ISBN 3-900051-07-0). Vienna, Austria: R Foundation for Statistical Computing.
Schneiderman, B. (1994). Dynamic queries for visual information seeking. IEEE Software,
11, 70-77.
Theus, M. (2002a). Interactive data visualization using Mondrian. Statistical Computing &
Statistical Graphics Newsletter, 13, 11-13.
Theus, M. (2002b). Interactive data visualization using Mondrian. Journal of Statistical
Software, 7 (11).
Theus, M., Hofmann, H., & Wilhelm, A.F.X. (1998). Selection sequences – interactive
analysis of massive data sets. Computing Science and Statistics, 29, 439-444.
Theus, M., & Lauer, S.R.W. (1999). Visualizing loglinear models. Journal of Computational
and Graphical Statistics, 8, 396-412.
Theus, M., & Urbanek, S. (2008). Interactive graphics for data analysis. London: CRC
Press.

Computer software review: Mondrian 12
Unwin, A.R., Theus, M., & Hofmann, H. (2006). Graphics of large datasets. New York:
Springer.
Unwin, A.R., Volinsky, C., Winkler, S. (2003). Parallel coordinates for exploratory
modelling analysis. Computational Statistics & Data Analysis, 43, 553-564.
Wegman, E.J. (1990). Hyperdimensional data analysis using parallel coordinates. Journal of
the American Statistical Association, 85, 664-675.
Wilkinson, L. (2005). The grammar of graphics (2nd ed.). New York: Springer.
Wills, G.J. (1996). Selection: 524,288 ways to say “this is interesting”. Proceedings of
InfoVis ’96, IEEE symposium on information visualization (pp. 54-60). IEEE
Computer Society Press.
Young, F.W., Valero-Mora, P.M., & Friendly, M. (2006). Visual statistics: Seeing data with
dynamic interactive graphics. Hobken, NJ: Wiley.

Computer software review: Mondrian 13
Figure captions and notes
Fig. 1. Gallery Screenshot from Mondrian
Note. Data on the 2004 United States presidential election, which for instance can be
downloaded from Mondrian’s web sites, are used to produce the individual plots.
Fig. 2. Empirical Item Response Functions: Barcharts for Items 6 and 7 (Lower
Plots) and Corresponding Spineplots for the Total Score (Upper Plots)
Note. In the barcharts the examinees solving that particular item are color brushed. In
the spineplots the proportions of correct responses are plotted as a function of the number-
correct (total) scores.
Fig. 3. Distractor Analysis: Barcharts for Items 1 and 3 (Lower Plots) and
Corresponding Spineplots for the Total Score (Upper Plots)
Note. In the barcharts the examinees responding to a particular category of the items
are color brushed. The proportions of examinees responding to each response category,
conditional on total score, are depicted in the spineplots.
Fig. 4. Differential Item Functioning: Barcharts for Item 4 (Lower Plots) and Sex
(Middle Plots) and Corresponding Spineplots for the Total Score (Upper Plots)
Note. In the lower barcharts the males and females solving that item are color
brushed. Their fractions of the total number of males and females are depicted in the middle
plots. The spineplots display the separate proportion-correct bars as a function of the total
score for males and females.
Computer software review: Mondrian 14
Figures
Fig. 1

Computer software review: Mondrian 15
Fig. 2
Computer software review: Mondrian 16
Fig. 3

Computer software review: Mondrian 17
Fig. 4
Tables

Computer software review: Mondrian 18
Table 1
Key Features of Mondrian
Interactivity Plot Data type R
functionality
Plot variation
Linking Querying Zooming α
blending
Binned
mode
Missing
value plot
Categorical,
continuous
— — Available Standard Standard — —
Barchart Categorical — Weighted barchart,
spineplot
Available Standard Standard — —
Mosaic plot Categorical — Fluctuation diagram,
multiple barchart,
same bin size,
double decker plot
Available Standard Standard,
censored
— —
Histogram Continuous Density
estimation
Weighted histogram,
spinogram
Available Orientation,
standard
Standard — —
Scatterplot Continuous Smoothing:
least square,
loess,
splines
Scatterplot matrix Available Orientation,
standard,
extended
Standard,
logical
Available Available
Parallel
coordinate
plot
Continuous — Parallel boxplot Available Standard,
Extended
Standard Available —
Note. Other plots implemented in Mondrian are boxplots y by x and choropleth maps. All plots can handle missing values and are
fully linked. Linking of plots is realized via selections, selection sequences, and highlighting. Mondrian also allows for the
interactive options of creating multiple (simultaneous) views in single or different plot windows, manually and automatically sorting
and reordering categories and variables, color brushing, and point size variation of points in a scatterplot. Further R functionalities of
Mondrian (R computations callable in Mondrian) are multidimensional scaling and principal component analysis. Mondrian
includes a model navigator for the graphical building of loglinear models using mosaic plots. Eventually, new variables can be
generated from the initial ones given in the loaded data set. (Orientation querying: gives the location of the mouse pointer in the
coordinate system of a plot; standard querying: gives basic information associated with an object of a plot; extended querying: gives
additional information, not only related to the variables used in a plot, but to other information about an object of the plot. Standard

Computer software review: Mondrian 19
zooming: the display is magnified; logical zooming: as magnification increases, more detail is shown; censored zooming: in ceiling-
censored zooming objects are magnified up to a limit, in floor-censored zooming objects smaller than a size are not displayed.)


![[XLS] · Web view317. 317. 317. 317. 316 239. 316 239. 315 94. 315 94. 86. 86. 86. 398. 426. 426. 426. 316 239. 316 239. 317. 317. 317. 315 94. 315 94.](https://static.fdocuments.net/doc/165x107/5abaa3447f8b9a567c8bbc2d/xls-view317-317-317-317-316-239-316-239-315-94-315-94-86-86-86-398.jpg)


