Insource Co., Ltd. Q2 FY2018 Consolidated Financial …“solicitation activities”) and neither...
36
マスター タイトルの書式設定 Copyright © Insource Co., Ltd. All rights reserved. 0 Copyright © Insource Co., Ltd. All rights reserved. Insource Co., Ltd. Q2 FY2018 Consolidated Financial Results (Three months ended March 31,2019)
Transcript of Insource Co., Ltd. Q2 FY2018 Consolidated Financial …“solicitation activities”) and neither...

マスター タイトルの書式設定
Copyright © Insource Co., Ltd. All rights reserved. 0
Copyright © Insource Co., Ltd. All rights reserved.
Insource Co., Ltd.
Q2 FY2018 Consolidated Financial Results (Three months ended March 31,2019)

マスター タイトルの書式設定
Copyright © Insource Co., Ltd. All rights reserved. 1
Disclaimer Regarding Forward-looking Statements
• This report contains estimates and forecasts pertaining to the future plans and business results of Insoruce Co., Ltd. Such statements are
based on information available at the time of the report’s production and based on potential risks and uncertainties. Actual results may
differ materially from estimates and forecasts contained herein.
• Unless otherwise noted, financial statements contained herein are presented in accordance with generally accepted accounting
principles in Japan.
• The Company assumes no obligation to update or revise any forward-looking statements to reflect events or circumstances after the
date on which the statements are made or to reflect new information, changes in our expectations or the occurrence of anticipated or
unanticipated events or circumstances.
• Information in this report regarding companies other than the Company is quoted from public and other sources. We do not guarantee
the accuracy of this information.
• This report does not constitute an invitation or solicitation of an offer to subscribe for or purchase any securities (herein referred to as
“solicitation activities”) and neither this report nor anything contained herein shall form the basis for any contract or commitment
whatsoever.

マスター タイトルの書式設定
Copyright © Insource Co., Ltd. All rights reserved. 2
Contents
Chap. 01 Q2 FY2018 Consolidated Results
Chap. 02 FY2018 Progress Report
<Appendix> About Insource
マスター タイトルの書式設定
Copyright © Insource Co., Ltd. All rights reserved. 3
Chap. 01 Q2 FY2018 Consolidated Results

マスター タイトルの書式設定
Copyright © Insource Co., Ltd. All rights reserved. 4
Q2 FY2018 Consolidated Financial Highlights
■Net sales:
■Gross profit:
Increased by 23.2% (+481 million yen) YOY to 2,555 million yen.
The breakdown consists of 1,482 million yen (+16.2%) for On-Site Training,
627 million yen (+26.3 % ) for Open Seminars and 445 million yen (+48.2%)
for Other Businesses.
Increased by 32.9% (+140 million yen) YOY to 567 million yen.
Operating profit margin increased by 1.6 points YOY to 22.2 %.
■Operating profit:
Increased by 25.1% (+357 million yen) YOY to 1,781 million yen.
Gross profit margin increased by 1.1 points YOY to 69.7 %.
1
Other businesses, such as IT service, e-learning courses and video production
projects were highly demanded.
■Point:

マスター タイトルの書式設定
Copyright © Insource Co., Ltd. All rights reserved. 5
Consolidated Profit Loss Statement ① (Overview) 2
Net sales
(YOY)
1,654 (+357)
2,073 (+419)
2,555 (+481)
+23.2% 5,600 (Progression rate: 45.6%)
Gross profit (YOY)
1,085 (+215)
1,423 (+337)
1,781 (+357)
+25.1% 3,900 (Progression rate: 45.7%)
(Gross profit margin) (65.6%) (68.6%) (69.7%) (+1.1p) (69.6%)
Operating profit (YOY)
234 (+30)
427 (+192)
567 (+140)
+32.9% 1,160 (Progression rate: 48.9%)
(Operating profit margin) (14.2%) (20.6%) (22.2%) (+1.6p) (20.7%)
Ordinary profit (YOY)
250 (+48)
419 (+168)
565 (+146)
+34.9% 1,150 (Progression rate: 49.2%)
Net profit (YOY)
164 (+35)
283 (+118)
372 (+89)
+31.7% 750 (Progression rate: 49.7%)
1H FY16
(Actual)
1H FY17
(Actual)
1H FY18
(Actual)
FY18
(Forecast) YOY
Unit: million yen ■Net sales increased by 23.2% to 2,555 million yen.
■Gross profit margin increased by 1.1 points YOY to 69.7%.

マスター タイトルの書式設定
Copyright © Insource Co., Ltd. All rights reserved. 6
Net Sales & Gross Profit (by business) 3
Whole
Business
Net sales (YOY)
1,654 ( +357)
2,073 (+419)
2,555 (+481)
+23.2% 5,600 (Progression rate:45.6%)
Gross profit 1,085 1,423 1,781 +25.1% 3,900 (Progression rate:45.7%)
(Gross profit margin) (65.6%) (68.6%) (69.7%) (+1.1p) (69.6%)
On-Site
Training
Net sales (YOY)
1,100 ( +158)
1,276 (+175)
1,482 (+206)
+16.2% 3,300 (Progression rate:44.9%)
Gross profit 794 933 1,062 +13.9% 2,340 (Progression rate:45.4%)
(Gross profit margin) (72.1%) (73.1%) (71.7%) (▲1.4p) (70.9%)
Open
Seminars
Net sales (YOY)
358 (+106)
497 (+139)
627 (+130)
+26.3% 1,460 (Progression rate:43.0%)
Gross profit 202 319 388 +21.7% 990 (Progression rate:39.2%)
(Gross profit margin) (56.5%) (64.1%) (61.8%) (▲2.3p) (67.8%)
Other
Businesses
Net sales (YOY)
195 (+91)
300 (+105)
445 (+144)
+48.2% 840 (Progression rate:53.0%)
Gross profit 89 171 329 +92.7% 570 (Progression rate:57.9%)
(Gross profit margin) (45.6%) (57.0%) (74.1%) (+17.1p) (67.9%)
1H FY16
(Actual)
1H FY17
(Actual)
1H FY18
(Actual)
FY18
(Forecast) YOY
Unit: million yen
* Our gross profit margins by business were not audited by Ernst & Young ShinNihon LLC.

マスター タイトルの書式設定
Copyright © Insource Co., Ltd. All rights reserved. 7
4
1,100 1,276
1,482
358
497
627
195
300
445
1H FY16(Actual)
1H FY17(Actual)
1H FY18(Actual)
61.6%
24.0%
14.5% 1,654
2,073
66.5%
21.6%
11.8%
58.0%
24.6%
17.4%
Operating profit
progress rate
567 1,160
48.9%
FY18
(Forecast)
234 592
39.6%
FY16
(Actual)
427 937
45.5%
FY17
(Actual)
1H FY18
(Actual)
1H FY16
(Actual)
1H FY17
(Actual)
Sales composition
ratio by business
2,555
24.7%
23.3%
23.1%
21.5%
22.4%
22.5%
27.0%
26.9%
54.4%
26.9%
27.4%
0.0%
FY16 Composition ratio
FY17 Composition ratio
FY18 Progress rate
1Q 2Q 3Q 4Q
4,536
3,585
<Forecast>
5,600
1,055 1,018
884 769 967 963
1,294 1,261
Composition ratio
and progress rate of
sales by quarter
1,220 1,242
■ Other Businesses
■ Open Seminars ■ On-Site Training
■3Q ■1Q ■2Q ■4Q
Sales Composition Ratio & Operating Profit Progress Rate
Unit: million yen
% represents composition ratio % represents progress rate
Unit: million yen
Unit: million yen

マスター タイトルの書式設定
Copyright © Insource Co., Ltd. All rights reserved. 8
Consolidated Profit and Loss Statement ② 5
Total personnel
expenses 659 768 926 +157 +20.5% 2,100
(Total personnel
expenses rate) (77.5%) (77.1%) (76.3%) - - -
Rent expenses 52 57 62 +4 +8.5% ―
Office & system
expenses 46 55 80 +25 +45.7% ―
Other expenses 91 114 143 +29 +25.6% ―
Total SG&A
expenses 851 996 1,213 +217 +21.8% 2,740 (SG&A expense ratio) (51.5%) (48.0%) (47.5%) - - (48.9%)
Breakdown of
SG&A
Net sales 1,654 2,073 2,555 +481 +23.2% 5,600
Gross profit 1,085 1,423 1,781 +357 +25.1% 3,900
Gross profit
margin 65.6% 68.6% 69.7% +1.1p - 69.6%
Transition of
gross profit
* Total personnel expenses include wages, recruitment, training, and benefit expenses.
1H FY16
(Actual)
1H FY17
(Actual)
1H FY18
(Actual)
FY18
(Forecast) YOY
Unit: million yen
1H FY16
(Actual)
1H FY17
(Actual)
1H FY18
(Actual)
FY18
(Forecast) YOY
・Transition of Gross Profit
・Breakdown of SG&A expenses

マスター タイトルの書式設定
Copyright © Insource Co., Ltd. All rights reserved. 9
6
Current assets 1,941 3,434 3,194 ▲240 ▲7.0%
Fixed assets 402 524 691 +167 +32.0%
Total assets 2,343 3,959 3,886 ▲72 ▲1.8%
Current
liabilities 808 979 1,177 +197 +20.1%
Fixed liabilities 98 89 89 ±0 ▲0.5%
Net assets 1,436 2,889 2,620 ▲269 ▲9.3%
Total liabilities
and net assets 2,343 3,959 3,886 ▲72 ▲1.8%
Consolidated Balance Sheet
FY16
(Actual)
FY17
(Actual)
1H FY18
(Actual) YOY FY17 vs. 1H FY18
Unit: million yen
■Current assets: Cash and deposits decreased primarily due to the acquisition of treasury stock and the further investment in our affiliates. ■Net assets: Decreased due to the acquisition of treasury stock, which was negatively recorded as net assets.

マスター タイトルの書式設定
Copyright © Insource Co., Ltd. All rights reserved. 10
Net sales 1,100 1,276 1,482 +16.2% 3,300 (Progression rate: 44.9%)
Gross profit* 794 933 1,062 +13.9% 2,340 (Progression rate: 45.4%)
(Gross profit margin) (72.1%) (73.1%) (71.7%) (▲1.4p) (70.9%)
Total number of
trainings
conducted (times)
5,287 6,083 6,853 +770 16,100 (Progression rate: 42.6%)
Average unit
price (Thousand yen)
204.1 210.0 216.4 +6.4 205.0
Total number of
contents by category (types)
2,333 2,582 2,701 +119 2,800 (Progression rate: 27.5%)
On-Site Training 7
1H FY16
(Actual)
1H FY17
(Actual)
1H FY18
(Actual) FY18
(Forecast) YOY
Unit: million yen
FY16
(Actual)
FY17
(Actual)
1H FY18
(Actual)
FY18
(Forecast) YOY
* Our gross profit margins by business were not audited by Ernst & Young ShinNihon LLC.
■IT and AI/RPA workshops for productivity improvement are highly demanded.
■The average unit price per training rose due to increased orders from private companies in Tokyo area.
マスター タイトルの書式設定
Copyright © Insource Co., Ltd. All rights reserved. 11
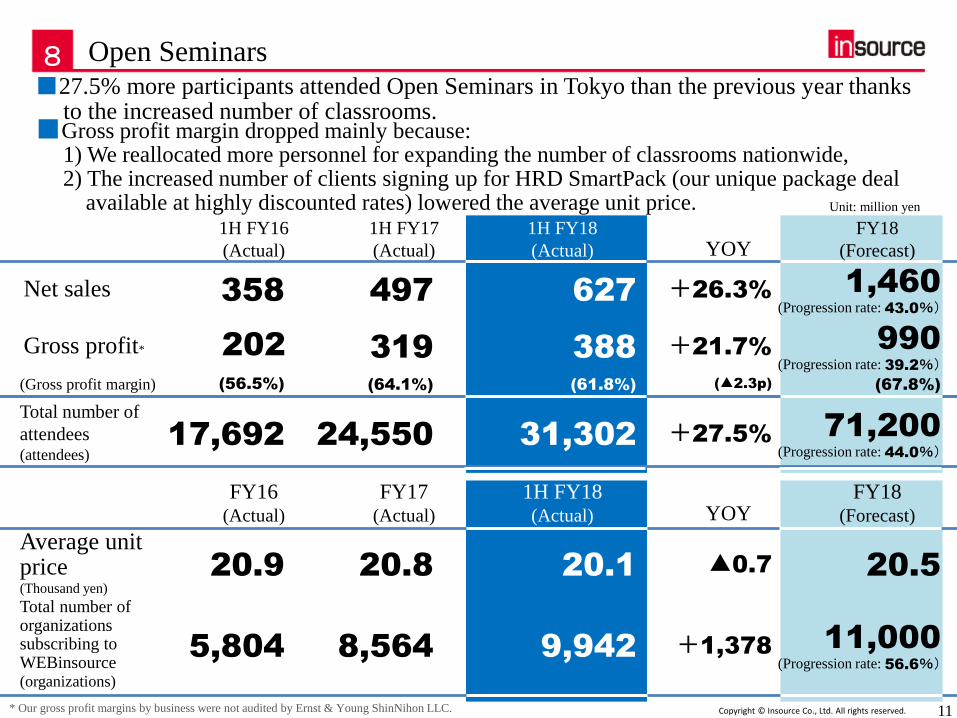
■Gross profit margin dropped mainly because: 1) We reallocated more personnel for expanding the number of classrooms nationwide, 2) The increased number of clients signing up for HRD SmartPack (our unique package deal available at highly discounted rates) lowered the average unit price.
Open Seminars 8
Net sales 358 497 627 +26.3% 1,460 (Progression rate: 43.0%)
Gross profit* 202 319 388 +21.7% 990 (Progression rate: 39.2%)
(Gross profit margin) (56.5%) (64.1%) (61.8%) (▲2.3p) (67.8%)
Total number of
attendees (attendees)
17,692 24,550 31,302 +27.5% 71,200 (Progression rate: 44.0%)
Average unit price (Thousand yen)
20.9 20.8 20.1 ▲0.7 20.5 Total number of organizations subscribing to WEBinsource (organizations)
5,804 8,564 9,942 +1,378 11,000 (Progression rate: 56.6%)
* Our gross profit margins by business were not audited by Ernst & Young ShinNihon LLC.
1H FY16
(Actual)
1H FY17
(Actual)
1H FY18
(Actual)
FY18
(Forecast) YOY
Unit: million yen
FY16 (Actual)
FY17 (Actual)
1H FY18 (Actual)
FY18 (Forecast) YOY
■27.5% more participants attended Open Seminars in Tokyo than the previous year thanks to the increased number of classrooms.

マスター タイトルの書式設定
Copyright © Insource Co., Ltd. All rights reserved. 12
* From October 2018 to March 2019 * The figures above show preliminary figures on our On-Site Training and Open Seminars.
* Figures above in parentheses indicate changes from the same period of the previous fiscal year.
サービス
・IT and AI/RPA workshops for productivity improvement are highly demanded. IT workshops (+84.8% YOY) account for 12.0% of 1H FY2018 sales growth.
・Logical thinking trainings by job function from young employees to junior managers are highly demanded. Logical thinking trainings (+40.6% YOY) account for 10.0% of 1H FY2018 sales growth.
・Trainings for managerial positions (business improvement/risk management/ compliance/harassment prevention) are highly demanded. Problem-solving/business improvement trainings (+40.3% YOY) account for 9.1% of 1H FY2018 sales growth.
・ On-Site Training: Demands are steadily growing throughout the country, especially in Kanto area increased by 11.0% YOY, In Kansai/Chu-Shikoku areas are contributed to sales growth, which account for 26.0% of 1H FY2018. ・ Open Seminars: Demands are steadily growing in Tokyo area (+25.1% YOY). In addition, demands are significantly growing in other areas (+about 30.0% each).
・Demands from the following industries are growing: - Telecom/IT service industries (+42.6% YOY)
- Pharmaceutical industry (+57.1% YOY)
- Trading firms (+48.4% YOY) ・Demand from the retail/service/hospitality (B-to-C) industries decreased (-5.8% YOY).
■Key Factors of Sales Growth in Our Training Business
Services
Clients
Areas
Training Business(On-Site Training & Open Seminars) 9

マスター タイトルの書式設定
Copyright © Insource Co., Ltd. All rights reserved. 13
Other Businesses ① ___Net Sales & Gross Profit 10
Net sales 195 300 445 +48.2% 840 (Progression rate: 53.0%)
IT service 53 142 250 +76.4% 400
e-Learning /
Video
production 70 85 126 +49.3% 290
Consulting 71 72 36 ▲49.2% 150
Gross profit* 89 171 329 +92.7% 570 (Gross profit margin) (45.8%) (57.0%) (74.1%) (+17.1p) (67.9%)
(Progression rate: 57.9%)
<Breakdown>
1H FY16
(Actual)
1H FY17
(Actual)
1H FY18
(Actual)
FY18
(Forecast) YOY
Unit: million yen
* Our gross profit margins by business were not audited by Ernst & Young ShinNihon LLC.
■Gross profit margin significantly increased by 74.1% YOY to 329 mainly because: 1) Sales of Leaf (highly profitable in-house platform) increased, 2) We put more emphasis on profitability than sales volume in Stress Check Support Service.
■Mitemo’s e-Learning courses and video production projects are highly demanded.

マスター タイトルの書式設定
Copyright © Insource Co., Ltd. All rights reserved. 14
Total number of
organizations
implementing Stress Check
Support Service
(organizations)
58 148 172 +24 200 (Progression rate: 86.0%)
Total number of video
production and consulting
services(projects) 63 79 115 +36 ―
Total numbers of e-learning
(STUDIO & STUDIO Powered by
Leaf) subscription IDs per year
(IDs)
ー 21,059 23,346 +2,287 ―
Total number of
organizations subscribing
to “Leaf” (organizations) 51 92 132 +40 140
(Progression rate: 83.3%)
Total number of
organizations using on-the-
web appraisal form service
(organizations)
- 26 37 +11 ―
Other Businesses ② ___KPIs 11
1H FY16 (Actual)
1H FY17 (Actual)
1H FY18 (Actual) YOY
FY16 (Actual)
FY17 (Actual)
End of 1H FY18 (Actual) YOY
Cumulative number
at the end of 1H
*1 The number of Stress Check Support implemented in 1H FY2018 is based on the number of orders delivered.
*2 The annual total number of e-learning subscription IDs was based on the active subscription IDs from FY2018 on.
FY18 (Forecast)
FY18 (Forecast)
Cumulative number
at the end of 1H
■The number of Leaf subscribers (organizations) significantly increased by 40 YOY to 172.
■The number of video production and consulting projects increased by 36 YOY to 115.

マスター タイトルの書式設定
Copyright © Insource Co., Ltd. All rights reserved. 15
12 Other Businesses③ Key Factors of Sales Growth
RPA implementation/utilization workshops for productivity
improvement are highly demanded.
・ RPA Utilization Support
・ Expansion of Assessment Service
Skill Survey Skill Survey for young/mid-level employees has been fully launched since June 2018.
Skill Survey for junior/senior managers has been fully launched since October 2018.
・ Establish effective training systems by measuring individual skills.
Total no. of
Respondents:
*As of March 31, 2019
数値要更新 ・The total number of Leaf subscribers (organizations) in acquired 1H FY2018
reached 40 while the total number of clients acquired in FY2017 was 49.
・In Stress Check Support Service, we acquired more orders from private companies. (As of March 31, we already delivered 172 orders (+24.6% (+24 orders) YOY).)
Consulting
service
&
Others
IT
Services
■Key Factors of Sales Growth in Our Other Businesses
・ The number of video production/consulting projects significantly increased by 36 YOY. (The total number of video production/consulting projects in 1H FY2018 reached 115 while the total number of those in 1H 2017 was 24.)
・The total number of active contract IDs considerably increased by 2,287.
e-Learning
/Video
production
7,799 (197 organizations)
Total no. of AI/RPA-
related services
implemented: 2,220 (415 organizations)

マスター タイトルの書式設定
Copyright © Insource Co., Ltd. All rights reserved. 16
Chap. 02 FY2018 Progress Report

マスター タイトルの書式設定
Copyright © Insource Co., Ltd. All rights reserved. 17
FY2018: More sustainable growth is expected 1
2.4 2.5 2.3
0.0
2.0
4.0
Dec 2018 Jan 2019 Feb 2019
■Breakdown of clients by industry
20.4%
16.3%
13.0% 12.3%
8.0%
6.1%
6.1%
5.3%
3.0% 2.9% 1.3% 5.3% ■Manufacturing
■Govern- ment /Public admini- strations
■Others 5.3% ■Utility service 1.3%
■Transportation/Warehouse 2.9%
■Finance/Banking 3.0%
■ Logistics / Trading
■Educational services/
Academic institution
■Health/Medical
■Construction/
Real state
■Telecommunications
/IT services
■Service/Hospitality
■Market share Total yearly expenses
organizations outsourced
training programs
(Off-JT programs):
Our expected net
sales of FY2018*1
5.6 billion yen
(1.4%) About 391.9 billion yen *2
・
■Transition of overall unemployment rate
More and more companies are striving to raise productivity by utilizing training programs and e-learning courseware.
・Overall unemployment rate in February 2019 was 2.3 percent.
Labor shortage in Japan has reached a new level of severity.
*Source: “Labor Force Survey” by Statistics Bureau , Ministry of Internal Affairs and Communications
We do not only offer training programs, but also provide
optional products and various services.
In addition, Insource has engaged in staffing agency/
service business.
・Insource has over 27,000 clients and over 9,900 WEBinsource subscribers.
*Breakdown of clients by industry who used our services from June 2003 to March 2019
*1 Our net sales: FY2018 consolidated net sales (forecast)
*2 This figure is calculated based on Basic Survey of Human Resources Development issued in 2018 and
Labor Force Survey issued in 2018 by Ministry of Health, Labour and Welfare.
・Broad and Diverse Range of Clients.
Insource will offer more services to organizations that are
unaffected by economic downturn, such as local
governments, hospitals, and schools.
・Insource has about 1.4 percent market share in the
training industry (a growing market).

マスター タイトルの書式設定
Copyright © Insource Co., Ltd. All rights reserved. 18
■Insource will aim at a CAGR of 20% between FY2018 and FY2020.
Mid-Term Management Plan___Numerical Targets
Net sales (YOY)
4,536 (+951)
5,600 (+1,064)
7,070 (+1,470)
8,750 (+1,680)
+24.5%
Gross profit (YOY)
3,096 (+693)
3,900 (+804)
4,950 (+1,050)
6,150 (+1,200)
+25.7%
Operating
profit (YOY)
937 (+345)
1,160 (+223)
1,410 (+250)
1,750 (+340) +23.1%
(Gross profit margin) (20.7%) (20.7%) (19.9%) (20.0%)
Net profit (YOY)
635 (+223)
750 (+115)
945 (+195)
1,180 (+235)
+22.9%
FY20
<Target> CAGR
FY18 - FY20
FY17
(Actual)
FY18
(Forecast)
FY19
<Target>
Unit: million yen
■In FY2020, Insource will aim at an increase of net sales to 8,750 million yen and
operating profit to 1,750 million yen.
2

マスター タイトルの書式設定
Copyright © Insource Co., Ltd. All rights reserved. 19
Mid-Term Management Plan___ 3 Major Strategies 3
戦略②
5 classrooms were added to Tokyo Seminar Room (December 2018)
3 classrooms will be added to Kawasaki Seminar Room (April 2019)
・Yokohama Branch was merged with Shinagawa Office to open Kawasaki Seminar Room (March 2019)
WEBinsource subscribers increased 9,942 (organizations) (March 2019)
Appeal to more clients
By putting the essence of OODA Loop* into practice, Insource will take new approaches
while flexibly adapting to today's ever changing and challenging business environment
ahead of the competition. *For details on OODA Loop, see page 34
Tailor-made trainings (launched in February 2019)
・Our consultants collect and analyze cases of clients’ past successes and failures.
・By incorporating the analyses into our training curriculum, we will help clients learn how to win success in business.
Sales Skill Assessment Service (launched in March 2019)
・Sales Skill Assessment classifies qualifications and abilities required for ”sales power” into 8 categories
(24 items) by process.
・Appropriately measure strengths and challenges of each salesperson.
■We will continue to gain more market share for steady and sustainable growth.
Strategy ①
Strategy ②
Strategy ③
Expanding content lineup
Strengthening change management

マスター タイトルの書式設定
Copyright © Insource Co., Ltd. All rights reserved. 20
4 FY2018 Topics: KPIs
(Changes) (Changes)
FY17
(Actual)
End of 1H FY18
(Actual)
Progression rate of
1H FY18 to
FY18(Forecast)
End of FY18
(Forecast)
Total number of business sites 20 19 (-1)
0% 22 (+2)
Total number of organizations
subscribing to WEBinsource 8,564 9,942
(+1,378) 56.6% 11,000
(+2,436)
Total number of content types for on-site training programs
2,582 2,701 (+119)
54.6% 2,800 (+218)
Total number of content types for open seminars
2,292 2,504 (+212)
ー ー
Total number of permanent
classrooms
32 37 (+5)
83.3% 38
(+6)
Total number of webpages 11,341 13,351
(+2,010) 81.7% 13,800
(+2,459)
Total number of webpages ranked
No.1 in Google search 270 207
(-63) ー ー
KPI’s point
Expected to increase
by 3 in April (Kawasaki)
We needed to reallocate personnel for expanding the number of classrooms nationwide.
We are acquiring over 200 new subscribers (organizations) on a monthly basis.
The number of page views decreased due to the change of Google’s algorithm.
To increase the number, we will keep on posting content-rich articles.
Content development is up and running. We are developing over 20 in-house
contents on a monthly basis.
Business sites
WEBinsource
Contents
Webpages ranked
No. 1 on Google Search

マスター タイトルの書式設定
Copyright © Insource Co., Ltd. All rights reserved. 21
KPI’s point and Number of employees by FY 5
※ As of the end of March 2019 (Consolidated)
FY17
(Actual)
End of 1H FY18
(Actual)
Progression rate of
1H FY18 to
FY18(Forecast)
End of FY18
(Forecast)
Total number of employees 379 410 (+31)
32.3% 475 (+96)
Total number of Full-time employees 249 264 (+15)
29.4% 300 (+51)
Total number of Part-time employees 130 146 (+16)
35.6% 175 (+45)
188 227 249 264 300
91 96
130 146
175
FY2015(Actual)
FY2016(Actual)
FY2017(Actual)
1H FY2018(Actual)
FY2018<Forecast>
■Full-timers
■Part-timers
279 323
379 410
475 Transition of quarterly number
of employees
22 incoming employees
(consolidated)
(April 2019)

マスター タイトルの書式設定
Copyright © Insource Co., Ltd. All rights reserved. 22
<Appendix> About Insource
22

マスター タイトルの書式設定
Copyright © Insource Co., Ltd. All rights reserved. 23
1
・Company name Insource Co., Ltd. ・Representative
director and president Takayuki Funahashi
・Date of foundation November, 2002 ・Capital 800,623 thousand yen
・Headquarters Kandabashi Park Bldg. 5F 1-19-1 Kanda Nishiki-cho, Chiyoda-ku. Tokyo
・Affiliated companies Mitemo Co., Ltd, Rashiku Corporation, MIRAISOUZOU & COMPANY, Inc.,
Insource Digital Academy Cooperation, Double Work Management Co., Ltd
・Branch Offices &
Business Sites
21 places nationwide (as of March 31, 2019)
Company Profile
Hokkaido
Branch Tohoku
Branch
Yokohama
Branch
Nagoya
Branch
Kyoto Office
Osaka
Branch
Kobe Office
Chu-Shikoku
Branch
Kyushu
Branch
Niigata
Office
・Head Office ・Head Office Annex, Tokyo
・Surugadai Office ・Urawa Office
・Makuhari Office ・Ikebukuro Office
(Kanto Branch)
・Shinjuku Office ・Shibuya Office
・Nihonbashi Office ・Hamamatsucho Office
・Machida Office
(April 2019)

マスター タイトルの書式設定
Copyright © Insource Co., Ltd. All rights reserved. 24
2 * Figures in parentheses indicate percentage of FY2018sales.
Business Activities
On-Site Training
Open Seminars
Other Businesses
Offer on-site trainings tailored to organizations’ needs
Offer open seminars that each person from
various organizations can attend
■Annual total number of trainings conducted:
■Annual total number of attendees:
14,231 453,091 (YOY: +1,815) (YOY: +56,767)
*From April 2018 to March 2019
62,700 8,158 (YOY: +1,581) (YOY: +13,014)
■Annual total number of attendees in FY2017:
■Annual total number of trainings conducted:
*The numbers above include trainings and attendees via
our online classroom system, “Enkaku Real”
■e-Learning / Video production
■Consulting
・Assessment
・IT adoption in human resource and general administration departments
・Stress check support service
■Staffing & Recruitment Services
Insource has established Double Work Management Co. , Ltd. ,
(jointly owned company with Mediaflag Co. , Ltd.) in
November 2018.
・Staffing services for (potential) returners, short-time workers with regular employment.
・Recruitment promotion
・AI/RPA utilization support
・Security service
・Establishment (operation) of personnel appraisal
・CS (customer satisfaction) surveys, etc.
■IT Services
Insource Digital Academy Cooperation
(April 2019)
(58.0%) (17.4%)
(24.6%)
*From April 2018 to March 2019

マスター タイトルの書式設定
Copyright © Insource Co., Ltd. All rights reserved. 25
3
■Hands-on approach: Attendees can make the most use of what they have learned immediately and change their behaviors in a favorable way.
Benefits of Insource’s Services
■Insource’s training programs consist of exercises (60%) coupled with
lectures (40%).
We can offer clients the best suitable trainings tailored to each industry, business and job function.
Insource is actively offering informative and practical training programs that
meet clients’needs, challenges and business objectives.
Training Business (On-Site Training & Open Seminars)
Other Businesses (IT Services, Assessment, e-Learning, etc.)
■Mainly through trainings, we are offering various services for every worker to find fulfillment in their careers. In addition, we will aim to offer one-stop services essential for personnel and administration management.
Offers edutainment contents created by education professionals
We can offer a wide range of training-related services with knowledge about human resource development.
IT Services
Assessment
e-Learning
Integrates every service line on our in-house platform, ‘Leaf’, including training scheduling, stress checking and personnel appraisal.
Visualize worker’s performance which can apply to human resource strategies, including (but not limited to) training, recruitment, assignment, promotion.
Exercises Lectures

マスター タイトルの書式設定
Copyright © Insource Co., Ltd. All rights reserved. 26
4 Insource’s 4 Pillars to achieve high profitability
■”Strong client base” + ”Mixed approach”
A wide range of industries
Strong client base
Insource has a broad range of clients, including private sectors across
various industries, public sectors, hospitals, welfare services and
universities.
With our specialized division of content creations, Insource can offer
a wide range of training programs while maintaining and improving
training quality.
Robust in-house developed
Contents
・Streamlining sales activities through web marketing and in-house
CRM (customer relationship management) platform.
・Opening more offices across the country to offer the best
suitable options tailored to each client's needs.
Linkage of sales force and
digital marketing
Strong sales power
Insource has abundant IT/AI engineers who can develop various
services and improve business processes which allows flexible
decisions at high speed.
In-house IT systems and
AI-driven tools
Information
Technologies
Mixed approach to keep high profitability by sharing information cross-functionally.
1
2
3
4

マスター タイトルの書式設定
Copyright © Insource Co., Ltd. All rights reserved. 27
4 Major Pillars to achieve our goals and visions 1
Inquiries via
our website
Update our website
New needs and opportunities
Acquire new WEBinsource
subscribers
Sales representatives
Develop new trainings & new
services
Our services
On-Site
Training
Other
Businesses
Open
Seminars
Systematic cross-functional cooperation through IT utilization
No. of Designers: 17* No. of Content creators: 115*
A wide range of industries
Strong client base
Robust in-house developed
Contents
Linkage of sales force and digital marketing
Strong sales power
In-house IT systems and AI-driven tools
Information Technologies
1 2 3 4
No. of Sales reps (nationwide): 123*
*As of March 31, 2019

マスター タイトルの書式設定
Copyright © Insource Co., Ltd. All rights reserved. 28
Strong Client Base 5
■Number of clients:
27,097 organizations
■Total number of WEBinsource subscribers
(YOY: +1,378)
9,942 organizations
WEBinsource
▶ With WEBinsource, clients can sign up online for Open
Seminars at discounted prices. Clients can also apply online
for our affiliated companies' training programs, books, etc.
More and more clients are implementing WEBinsource as
an employee training infrastructure. This is leading to
increase in the number of Open Seminar attendees.
■Annual total number of
attendees:
■Annual total number of
trainings conducted:
(YOY: +3,396)
515,791 22,389 *From October 2017 to September 2018
*On-site trainings plus open seminars
*Total number of clients who used
our services from June 2003
to March 2019.
(YOY: +3,965 organizations)
(YOY: +69,781)
*From April 2018 to March 2019
*On-site trainings plus open seminars
A wide range of industries
Strong client base
Insource has a broad range of clients, including private sectors across various industries, public sectors, hospitals, welfare services and universities.
*As of March 31, 2019
■Breakdown of clients by industry
20.4%
16.3%
13.0% 12.3%
8.0%
6.1%
6.1%
5.3%
3.0% 2.9% 1.3% 5.3% ■Manufacturing
■Govern- ment /Public admini- strations
■Others 5.3% ■Utility service 1.3%
■Transportation/Warehouse 2.9%
■Finance/Banking 3.0%
■ Logistics / Trading
■Educational services/
Academic institution
■Health/Medical
■Construction/
Real state
■Telecommunications
/IT services
■Service/Hospitality

マスター タイトルの書式設定
Copyright © Insource Co., Ltd. All rights reserved. 29
Approach ① ___Contents 6
Our specialized division develops and creates training contents so that Insource trainers can focus on providing high quality trainings with attendees.
■In-house content creation
Content creators
115
Sales reps
123
Trainers
286
Clients
・Insource developed more than 200 new contents in FY2017. We will also develop over 200 new contents in FY2018.
・Insource can achieve smooth cross-functional collaborations internally and externally by saving developed contents
on the internal database.
95.5% * From April 2018 to March 2019
* The rates above are calculated based on our questionnaire results.
94.2% ■Positive feedback rate (trainings):
■Positive feedback rates from training attendees
Robust in-house developed
Contents
■On-Site Training
(+119 YOY) 2,701
■Open Seminars
(+212 YOY)
2,504
<Number of training types> Systematic development system and content database
By separating content creation from other tasks and creating content database, Insource is achieving high profits while maintaining and improving training quality.
■Positive feedback rate (trainers):
With our specialized division of content creations, Insource can offer a wide range of training programs while maintaining and improving training quality
Unit: persons *As of March 31, 2019

マスター タイトルの書式設定
Copyright © Insource Co., Ltd. All rights reserved. 30
Approach ② ___Strong Sales Power 7
■Combining various approaches to effectively reach wider clients
■Open Seminar classrooms:
19 7 locations 37 classrooms
・Sales calls by sales representatives
・Outbound activities: Sending e-mail newsletters on a regular basis
・Inbound activities: Enriching the quality and quantity of web contents
By combining various approaches,
clients can imagine Insource right
away when in their needs.
■Total number of
Digital marketers:
■Webpages ranked No. 1 on
Google search: 207 pages
123
15
■Business sites:
■In-house developed CRM system, "Plants 12" manage clients' information and transaction logs.
・Streamline sales activities by making the most use of relationships with clients and transaction logs.
■Webpages:
13,351 pages
Linkage of sales force and
digital marketing
Strong sales power
■Total number of
Sales representatives:
・Opening more offices nationwide to offer the best suitable options tailored to each client's needs.
・Streamlining sales activities through web marketing and in-house
CRM (customer relationship management) platform.
*As of March 31, 2019

マスター タイトルの書式設定
Copyright © Insource Co., Ltd. All rights reserved. 31
8
■In line with social trends, Insource is actively developing a broad range of IT-related services, including AI and RPA (robotic process automation).
■Our in-house SEs developed an online human resource support system,“Leaf”.
Approach ③ __In-House Development of IT/AI Platforms
・“Leaf” improves not only Insource but also client`s productivity
In-house IT systems and AI-driven
tools
Information Technologies
■Total number of
IT engineers:
2 51 5
■Total number of
AI engineers:
■Total number of
network security professionals:
Insource has abundant IT/AI engineers who can develop various services and improve business processes which allows flexible decisions at high speed.
*As of March 31, 2019

マスター タイトルの書式設定
Copyright © Insource Co., Ltd. All rights reserved. 32
Diverse Workforce 9
Foreign nationals (including
naturalized
citizens)
3 Seniors (aged over 60) 14 LGBTs 3 Handicapped 10
*As of March 31, 2019 (consolidated)
Now actively recruiting more
seniors
■Insource’s diverse workforce creates various services.
Total Female employees
Total number
of employees *2
410 235
(57.3%)
Total number
of managerial
positions 101
20
(19.8%)
Workforce by job function: Insource consists of highly qualified, diverse specialists.
・Legal employment rate: 2.2%
・Actual employment rate: 2.05%
Handicapped employment rate:
3.2% *3
(Source: Ministry of Health, Labour and Welfare
“ 2018 Handicapped Persons' Employment Status)
Ratio of female employees in managerial
positions:
13.2% *1
(2017; Source: The Gender Equality
Bureau of the Cabinet Office)
*1 Administrative and managerial workers include board members, managers or above, administrative civil servants.
*2 Directors, auditors and corporate officers are excluded.
*3 Non-consolidated (Insource only)
Content
Creators 115
Sales
Representatives 123 IT Engineers 51 Designers 17
Digital
marketers 15
AI /RPA
Engineers 5
network security
professionals 2

マスター タイトルの書式設定
Copyright © Insource Co., Ltd. All rights reserved. 33
10
Information is an inexhaustible source of ideas. The more information is used, the more its value increases and its benefits are realized. The fresher information is, the higher its value. We share information useful to us immediately on a companywide basis.
You have to have tremendous courage to take on new challenges, but challenges make you grow. Keeping away from challenges is unfavorable for us. Failure should not be blamed, but be analyzed carefully to understand what went wrong and how we can use it to grow us.
Insource Group consists of people with different characteristics and backgrounds. By sharing the common vision with the diverse workforce and fully exercising their abilities, we are offering new business/service lines in a timely manner.
Speed and concentration empower us to create great achievement. Our diverse members reciprocally support each other as partners in a flexible and timely manner.
Forge ahead with perseverance and patience
We believe that we can reach breakthrough as long as we never give up and keep moving forward. By achieving our small goals one by one with patience and consistency, we can accumulate positive results.
Combination of speed and concentration creates great achievement
Ensure that everyone shares useful information companywide
Support people who take on challenges with passion
Respect for diversity
Insource Culture ___Flexibility and Adaptability

マスター タイトルの書式設定
Copyright © Insource Co., Ltd. All rights reserved. 34
Flexibility and Adaptability 11
We are steadily achieving our goals by flexibly changing the strategy
depending on situations and implementing “P+OODA Loop” at high
speed.
DO: Practice OODA Loop
決断
決断
決断
決断
決断
PLAN : Mid-Term
Management Plan,
“Road to Next 2021”
■Practicing OODA Loop Under a definite management policy, experienced leaders will act at high speed:
①Observe ⇒ ②Orient ⇒ ③Decide ⇒ ④Act
Insource is incorporating the essence of OODA Loop into its training programs. *What is OODA Loop?
OODA Loop is a simple practical framework inspired by US Marine
Corps’ decision-making process. By practicing OODA Loop, you can
deal flexibly with changing situations at high speed.
Changing
situation
OODA Loop

マスター タイトルの書式設定
Copyright © Insource Co., Ltd. All rights reserved. 35
ESG Policy 12
22 types
15 subjects ( 20 contents)
Cooperate with World Grand Prix
Social
Governance
Environment
March, 2019
■Our business goals are to provide solutions to social issues with everyone engaged in work.
Implementing career development education
Developing recurrent education contents
Sponsoring Japan Blind Football Association
Total number of training contents: 3 types
Annual total number of trainings conducted: 22,389 times
*As of March 31, 2019
*As of March 31, 2019
Active sales promotion of trainings related to compliance and e-learning courseware:
Compliance, private information protection act, labor management,
subcontracting act, copyright act, introduction to information security,
risk management, etc.
Total number of
training contents
e-Learning
*As of March 31, 2019
*As of March 31, 2019
Active disclosure of non-financial information on a monthly basis
■Newly developed training programs
■No. of on-site trainings conducted
■No. of Open Seminar attendees
■No. of WEBinsource subscribers
■ No. of Leaf monthly paying subscribers (organizations)
Company-wide power saving / LED installation