![IRMPD Spectra of Protonated Hydroxybenzaldehydes: Evidence of … · 2021. 4. 19. · Barbara Chiavarino,*[a] Otto Dopfer,[b] Maria Elisa Crestoni,[a] Davide Corinti,[a] Philippe](https://static.fdocuments.net/doc/165x107/613dd6be2809574f586e37a6/irmpd-spectra-of-protonated-hydroxybenzaldehydes-evidence-of-2021-4-19-barbara.jpg)
Insights from first principles molecular dynamics …ssiweb/papers/dimeether-final.pdf · IRMPD...
16
Insights from first principles molecular dynamics studies toward infrared multiple-photon and single-photon action spectroscopy: Case study of the proton-bound dimethyl ether dimer Xiaohu Li, 1 David T. Moore, 2 and Srinivasan S. Iyengar 3,a 1 Department of Chemistry, Indiana University, 800 E. Kirkwood Ave., Bloomington, Indiana 47405, USA 2 Department of Chemistry, Lehigh University, Bethlehem, Pennsylvania 18015, USA 3 Department of Chemistry and Department of Physics, Indiana University, 800 E. Kirkwood Ave., Bloomington, Indiana 47405, USA Received 3 January 2008; accepted 7 March 2008; published online 13 May 2008 We have used finite temperature ab initio molecular dynamics simulations in conjunction with computation of critical quantum nuclear effects to probe the differences between single-photon argon tagged action spectral results and infrared multiple-photon dissociation experiments for a proton bound molecular ion system. We find that the principal difference between the results in these experimental techniques is essentially that of cluster temperature. The multiple-photon dissociation experiments conducted using room temperature ions reflect a larger degree of conformational freedom compared to the colder single-photon argon tagged action spectral results. Our ab initio molecular dynamics simulation techniques accurately capture the effects of conformational sampling, adequately reproduce both spectra, and can be utilized to assign the dynamically averaged finite temperature spectra. © 2008 American Institute of Physics. DOI: 10.1063/1.2903446 I. INTRODUCTION In recent years, there has been great interest in the experimental 1–11 and theoretical 12–30 studies of hydrogen bonded cluster systems. For example, protonated, hydroxide as well as neutral water clusters have been studied in detail due to their fundamental role in biological 31–35 and con- densed phase 36 chemical systems. In general, hydrogen bonded systems are of critical interest in a wide range of areas including materials, 37,38 atmospheric, 21,22,24–26,39–42 biological, 31–35 condensed phase, 43–46 and gas-phase cluster chemistry. 1,6,8–11,21,22,24–26 Experimental studies on vibrational properties of hydro- gen bonded cluster systems have blossomed due to the de- velopment of sophisticated cluster-based measurement tech- niques such as argon-tagged single photon action spectral methods 11,30 and the infrared multiple-photon dissocia- tion 7,10,47–50 IRMPD approach. Both gas phase single- photon and multiple-photon vibrational action spectroscopic techniques have been crucial in deciphering the precise sig- natures that contribute to dynamics and spectroscopy in hy- drogen bonded systems. However, the accurate computa- tional modeling of the processes involved in these experiments requires the polarizability of the hydrogen bonding environment 7,8 and the changing bonding topography 6,21,22,28,29,44 to be considered, on account of the fluxional nature of hydrogen bonding systems. This renders the problem attractive to ab initio quantum mechanical treat- ment. There have been several theoretical methods utilized to treat such problems 1,6,8,21,22,25,26,28,29,51–62 with varying de- grees of success. The issue is further complicated by the fact that single-photon and multiple-photon experiments, them- selves seem to not always provide transparently consistent results in many cases. 7,8,10,11 In this paper, we demonstrate how finite temperature ab initio molecular dynamics AIMD simulations can be utilized to model and understand single-photon argon-tagged vibrational spectral results as well as vibrational properties obtained from noncoherent multiple-photon dissociation pro- cesses. We consider here a case study of a proton bound diether: Me 2 O 2 H + see Fig. 1a, which has recently been studied using both single photon 11 and multiple photon techniques. 10 This system is a prototypical organic system similar in form to the fundamental protonated Zundel cation, H 5 O 2 + , which has been the subject of much recent experimen- tal and theoretical debate. 6–8,27–30 The differences between the single-photon and multiple-photon experimental spectra for the Zundel cation, 6,7 seem similar to that in the diether system discussed here see Figure 1b, but one might, a priori, expect the proton bound diether to be less compli- cated to simulate using theoretical models, on account of the expected lower coupling between the shared and peripheral protons that are now separated by a stable CO linkage. How- ever, even here single- and multiple-photon experiments pro- vide interesting differences that are analyzed in detail as part of this paper. The spectra in Fig. 1b are reproduced from previous experiments. 10,11 The IRMPD spectra are generally broad as compared to the single photon spectra obtained from argon tagging of the molecular ion. Furthermore, the single-photon experiment displays a doublet at 1000 cm -1 , which is not reproduced in harmonic treatment. This aspect is very much reminiscent of a similar result recently reported for the Zundel cation. 10,11,27 Both argon tagging and IRMPD are examples of action spectroscopy, based on fragmentation a Author to whom correspondence should be addressed. Electronic mail: [email protected]. THE JOURNAL OF CHEMICAL PHYSICS 128, 184308 2008 0021-9606/2008/12818/184308/16/$23.00 © 2008 American Institute of Physics 128, 184308-1 Author complimentary copy. Redistribution subject to AIP license or copyright, see http://jcp.aip.org/jcp/copyright.jsp
Transcript of Insights from first principles molecular dynamics …ssiweb/papers/dimeether-final.pdf · IRMPD...
Insights from first principles molecular dynamics studies toward infraredmultiple-photon and single-photon action spectroscopy: Case studyof the proton-bound dimethyl ether dimer
Xiaohu Li,1 David T. Moore,2 and Srinivasan S. Iyengar3,a�
1Department of Chemistry, Indiana University, 800 E. Kirkwood Ave., Bloomington, Indiana 47405, USA2Department of Chemistry, Lehigh University, Bethlehem, Pennsylvania 18015, USA3Department of Chemistry and Department of Physics, Indiana University, 800 E. Kirkwood Ave.,Bloomington, Indiana 47405, USA
�Received 3 January 2008; accepted 7 March 2008; published online 13 May 2008�
We have used finite temperature ab initio molecular dynamics simulations in conjunction withcomputation of critical quantum nuclear effects to probe the differences between single-photonargon tagged action spectral results and infrared multiple-photon dissociation experiments for aproton bound molecular ion system. We find that the principal difference between the results in theseexperimental techniques is essentially that of cluster temperature. The multiple-photon dissociationexperiments conducted using room temperature ions reflect a larger degree of conformationalfreedom compared to the colder single-photon argon tagged action spectral results. Our ab initiomolecular dynamics simulation techniques accurately capture the effects of conformationalsampling, adequately reproduce both spectra, and can be utilized to assign the dynamically averagedfinite temperature spectra. © 2008 American Institute of Physics. �DOI: 10.1063/1.2903446�
I. INTRODUCTION
In recent years, there has been great interest in theexperimental1–11 and theoretical12–30 studies of hydrogenbonded cluster systems. For example, protonated, hydroxideas well as neutral water clusters have been studied in detaildue to their fundamental role in biological31–35 and con-densed phase36 chemical systems. In general, hydrogenbonded systems are of critical interest in a wide range ofareas including materials,37,38 atmospheric,21,22,24–26,39–42
biological,31–35 condensed phase,43–46 and gas-phase clusterchemistry.1,6,8–11,21,22,24–26
Experimental studies on vibrational properties of hydro-gen bonded cluster systems have blossomed due to the de-velopment of sophisticated cluster-based measurement tech-niques such as argon-tagged single photon action spectralmethods11,30 and the infrared multiple-photon dissocia-tion7,10,47–50 �IRMPD� approach. Both gas phase single-photon and multiple-photon vibrational action spectroscopictechniques have been crucial in deciphering the precise sig-natures that contribute to dynamics and spectroscopy in hy-drogen bonded systems. However, the accurate computa-tional modeling of the processes involved in theseexperiments requires the polarizability of the hydrogenbonding environment7,8 and the changing bondingtopography6,21,22,28,29,44 to be considered, on account of thefluxional nature of hydrogen bonding systems. This rendersthe problem attractive to ab initio quantum mechanical treat-ment. There have been several theoretical methods utilized totreat such problems1,6,8,21,22,25,26,28,29,51–62 with varying de-grees of success. The issue is further complicated by the fact
that single-photon and multiple-photon experiments, them-selves seem to not always provide transparently consistentresults in many cases.7,8,10,11
In this paper, we demonstrate how finite temperatureab initio molecular dynamics �AIMD� simulations can beutilized to model and understand single-photon argon-taggedvibrational spectral results as well as vibrational propertiesobtained from noncoherent multiple-photon dissociation pro-cesses. We consider here a case study of a proton bounddiether: �Me2O�2H+ �see Fig. 1�a��, which has recently beenstudied using both single photon11 and multiple photontechniques.10 This system is a prototypical organic systemsimilar in form to the fundamental protonated Zundel cation,H5O2
+, which has been the subject of much recent experimen-tal and theoretical debate.6–8,27–30 The differences betweenthe single-photon and multiple-photon experimental spectrafor the Zundel cation,6,7 seem similar to that in the diethersystem discussed here �see Figure 1�b��, but one might, apriori, expect the proton bound diether to be less compli-cated to simulate using theoretical models, on account of theexpected lower coupling between the shared and peripheralprotons that are now separated by a stable CO linkage. How-ever, even here single- and multiple-photon experiments pro-vide interesting differences that are analyzed in detail as partof this paper. The spectra in Fig. 1�b� are reproduced fromprevious experiments.10,11 The IRMPD spectra are generallybroad as compared to the single photon spectra obtainedfrom argon tagging of the molecular ion. Furthermore, thesingle-photon experiment displays a doublet at �1000 cm−1,which is not reproduced in harmonic treatment. This aspectis very much reminiscent of a similar result recently reportedfor the Zundel cation.10,11,27 Both argon tagging and IRMPDare examples of action spectroscopy, based on fragmentation
a�Author to whom correspondence should be addressed. Electronic mail:[email protected].
THE JOURNAL OF CHEMICAL PHYSICS 128, 184308 �2008�
0021-9606/2008/128�18�/184308/16/$23.00 © 2008 American Institute of Physics128, 184308-1
Author complimentary copy. Redistribution subject to AIP license or copyright, see http://jcp.aip.org/jcp/copyright.jsp
induced by the absorption of a single �Ar-tagging� or mul-tiple �IRMPD� infrared photons. A major difference betweenthese two techniques is the temperature of the ions involvedin the experiments and this has an important effect on theobserved spectral result. For example, the ions in an argon-tagged system are created in a supersonic molecular beamexpansion and hence expected to be cold with an estimatedeffective temperature of the order of 100 K or lower.11 TheIRMPD spectra, on the other hand, were recorded from roomtemperature ions.85 Here, we demonstrate the applicability offinite temperature AIMD as a computational tool that helpsprobe in detail, such complex spectroscopic differences, andresolve the spectra from both experimental situations. Thecentral point is that we utilize AIMD to accumulate anensemble-averaged vibrational spectrum representing statis-tical sampling of the conformational space explored by theions at a given temperature, as has been previouslyshown.21,22,25,26,56,63 At higher temperatures, some conforma-tions may have significantly different vibrational frequenc-ies than the global minimum, which manifests as inhomoge-neous broadening with respect to the harmonic spectrum atthe global minimum.
The paper is organized as follows: In Sec. II, the com-putational methods utilized are described. These include ablend of AIMD techniques, electronic structure optimizationsand harmonic frequency calculations, analysis of the quan-tum nuclear structure of the shared proton, and an analysis ofthe intrinsic harmonic modes that contribute to the finite tem-perature spectrum obtained from dynamics. A discussion ofresults is provided in Sec. III and conclusions are given inSec. IV.
II. COMPUTATIONAL METHODOLOGIES
A large number of simulations have been conductedas part of our study employing AIMD techniques, Born–Oppenheimer molecular dynamics �BOMD�,64–67 and atom-centered density matrix propagation �ADMP�,24,68–72 as
implemented within a development version of the Gaussianseries of electronic structure codes.73 These simulations uti-lize the B3LYP hybrid density functional with double-zetapolarized-diffused 6-31+G** basis, as suggested from previ-ous studies21,22,24–26,72,74,75 on similar systems. Geometry op-timization and harmonic frequency calculations are per-formed to assist the decomposition and assignment of spectraobtained from finite temperature AIMD simulations. In addi-tion, we have also investigated the quantum structure of theshared proton.
A time step of 0.5 fs was chosen for all BOMD dynam-ics studies while a fictitious mass-tensor scaling value of0.1 amu bohr2 ��180 a.u.� and a time step of 0.25 fs wereused for ADMP. All AIMD simulations conducted here aremicrocanonical �NVE�, with acceptable fluctuations �notedbelow� in the internal temperature. Since time-correlationfunctions involving nuclear velocities as well as moleculardipoles are utilized here to obtain vibrational properties, aconstant energy simulation with an associated conservedHamiltonian corresponding to the real system is critical. Twodifferent sets of simulations were conducted, one corre-sponding to an average temperature of 68 K ��10 K�, whilethe other corresponding to an average temperature of 270 K��40 K�. The lower temperature simulations are expected tomodel21,22 the argon-tagged single-photon action spectrumexperiments,11 while the higher temperature simulations areexpected to model the IRMPD experiments.10 �This aspect isfurther discussed in Sec. III.� The dynamically averaged vi-brational spectra were computed using Fourier transform ofthe nuclear velocity �represented as FT-VAC� and dipole�FT-DAC� autocorrelation functions. The results for BOMDand ADMP are qualitatively similar; hence, all data providedin the paper are from BOMD simulations.
A. Decomposition of the finite temperature AIMDspectra in terms of harmonic normal modes
It is relatively straightforward to assign the variouspeaks in a harmonic frequency calculation using eigenstatesof the Hessian matrix computed at optimized classicalnuclear geometries. In this section, we introduce an approachto decompose and assign the finite temperature dynamicallyaveraged spectra obtained from the AIMD simulations. SinceAIMD goes beyond the small oscillation limit of harmonicanalysis, the results obtained from such a decomposition arein general different from standard normal mode analysis forcases dominated by anharmonic potentials �as is the case forthe system treated here�.
At frequency �, the kth mass-weighted velocity compo-nent of the jth atom V j,k contributes to the vibrational densityof states as a result of its motion which may be expressed infrequency domain as
V j,k��� =� dt exp�− ı�t�V j,k�t� . �1�
As per the convolution theorem,76 the FT-VAC �and hencethe vibrational density of states� is identical to the sum overall values of j and k of the power spectrum of Eq. �1�. Now,the normal mode vectors, computed at some given geometry,
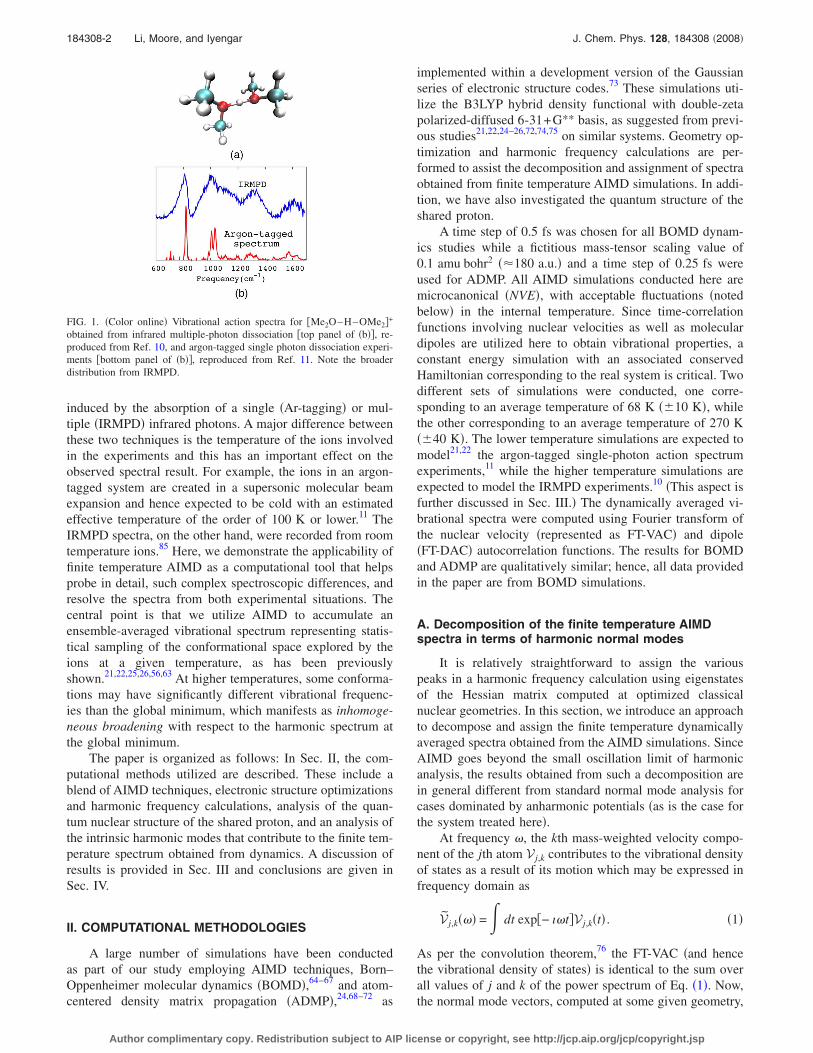
FIG. 1. �Color online� Vibrational action spectra for �Me2O–H–OMe2�+
obtained from infrared multiple-photon dissociation �top panel of �b��, re-produced from Ref. 10, and argon-tagged single photon dissociation experi-ments �bottom panel of �b��, reproduced from Ref. 11. Note the broaderdistribution from IRMPD.
184308-2 Li, Moore, and Iyengar J. Chem. Phys. 128, 184308 �2008�
Author complimentary copy. Redistribution subject to AIP license or copyright, see http://jcp.aip.org/jcp/copyright.jsp
form a complete, orthonormal set since these are eigenstatesof the Hessian matrix. �This includes the �3N−6� vibrationalmodes as well as the six low-frequency modes, which are allconsidered together in the formal analysis in this section.�These vectors signify the direction and �small� amplitudemotion of the N atoms within the harmonic approximation.
Since the 3N dimensional vector V� ���, with componentsgiven by Eq. �1�, also correspond to motion of the N atoms,but at a fixed frequency and finite temperature �since they are
obtained from AIMD simulations�, we may expand V� ��� inthe basis of normal mode vectors as
V� ��� = �i
Ci��� � Hi� , �2�
where H� i represents the ith normal mode vector and Ci���
=H� i · V� ��� is the contribution of the ith normal mode vector
toward nuclear motion at frequency � during the finite tem-perature simulation. The net contribution of the ith normalmode to the vibrational density of states in the frequencyrange ��1 ,�2� may then be written as a superposition of allits contributions inside the frequency range,
Ci��1,�2� = ��
�1
�2
d�Ci���21/2
= ���1
�2
d�Hi� · V� ���21/2
. �3�
To compare contributions from all harmonic modes in agiven frequency range, we analyze the quantity
Ci��1,�2�� ��
i
�Ci��1,�2� 2 �4�
in Sec. III. Equations �2� and �4� may be interpreted as fol-lows. Equation �2� represents a standard projection of a 3Ndimensional vector onto a complete orthonormal set of vec-tors. The components of Eq. �2� are then utilized in Eq. �4� toconstruct the net contribution of mode i in the frequencywindow ��1 ,�2�. This net contribution is essentially theL2-norm of the �-dependent function �Ci��� for all �� ��1 ,�2�. In practice, �1 and �2 are chosen to cover therelevant spectral feature which is determined upon inspectionof the full FT-VAC and FT-DAC spectra. For illustrative pur-poses, we have noted the choice of �1 and �2 explicitly intables later in the paper. Generally, these points are theclosest local minima �or basins� that encompass the spectralfeature of interest.
However, the contribution of mode i described in Eq. �4�is from the velocity spectrum and does not contain informa-tion about dipole �or IR� intensities. While all nuclear mo-tions contribute to the FT-VAC, the dipole spectrum, whichis provided in Sec. III, only contains those spectral featuresof the velocity spectrum that also have substantial dipolefluctuations �as in the experimental situation�. To obtain thecontribution from mode i to the dipole �or IR� spectrum, weutilize the harmonic IR intensities Ii as
Di��1,�2� = Ii
1/2 � Ci��1,�2�. �5�
Again, to compare the relative contributions from all modesin a given frequency range, we analyze the ratio
Di��1,�2�� ��
i
�Di��1,�2� 2 �6�
in Sec. III. The quantity Di��1,�2�2 may be interpreted as
being proportional to the “corrected IR intensity” at a giventemperature. We utilize Eqs. �4� and �6� to probe the differ-ences between the harmonic, high and low temperatureresults in Sec. III.
However, before we proceed with our discussion, wemust note the following caveat: The decompositions de-scribed in Eqs. �2�, �4�, and �6� depend on the choice of the
bases �H� i , and hence the choice of the optimized geometry.For our study on �Me2O–H–OMe2�+, we have carefully ana-lyzed over a hundred starting geometries to ensure that wehave utilized the global minimum geometry in our analysis.For other general problems, an investigation of the Ci
��1,�2�
and Di��1,�2� intensities for multiple optimized geometries
may be necessary before physical conclusions can be derivedfrom the analysis.
B. Shared proton nuclear quantum effects
To probe the effect of finite temperature on �nuclear�quantization of the shared proton in �Me2O–H–OMe2�+, weobtain the shared proton eigenstates using its Hamiltonian inthe coordinate representation,
H�xi,xj;RC� = −�2
2mKk=2�xi,xj� + V�xi;RC��xi,xj
. �7�
Here, the kinetic energy operator Kk=2�xi ,xj� is represented ineach dimension using distributed approximatingfunctionals,77–80
Kk�xi,xj� =1
��2�� − 1
�2��k
�exp�−�xi − xj�2
2�2 ���
n=0
M/2 �− 1
4�n 1
n!H2n+k� xi − xj
�2�� . �8�
The index k defines the desired derivative, and hence k=2for the Hamiltonian in Eq. �7�. The H2n+k are Hermite poly-nomials, �xi is the coordinate representation of the �shared�quantum proton. V�xi ;RC� represents the hydrogen potentialenergy surface computed through hybrid density functionalcalculations performed on a three-dimensional grid of protoncoordinates for chosen snapshots from the AIMD simula-tions. The quantity RC represents the coordinates of all at-oms apart from the shared proton. The dependence ofV�xi ;RC� on RC implies that the proton potential depends on
184308-3 AIMD simulations of action spectra: Dimethyl ether dimer J. Chem. Phys. 128, 184308 �2008�
Author complimentary copy. Redistribution subject to AIP license or copyright, see http://jcp.aip.org/jcp/copyright.jsp

the geometry of the diether system and this aspect is probedby considering snapshots from the AIMD simulations. �A fulldimensional quantum wave-packet propagation treatment ofthe 19-atom system treated here is currently prohibitive.� Therepresentation in Eq. �8�, however, leads to an extremelylarge �million�million� matrix representation for the quan-tum proton Hamiltonian. We obtain the lowest 30 quantumeigenstates by using a very efficient iterative Arnoldi itera-tive diagonalization scheme.56,81–84
The Arnoldi diagonalization process works as follows:First a random initial vector depicting the proton quantumstate is obtained and the sequential action of the Hamiltonianon this starting vector is computed to obtain a family of basisvectors ��i i=0,. . .,M, where M is of the order of 100 �that isvery much smaller than the size of the Hamiltonian matrix�.The family of vectors ��i i=0,. . .,M form a Krylov83 basis. TheHamiltonian is then projected onto the Krylov basis to ob-tained a smaller M �M matrix which can be diagonalizedeasily to obtain the first few eigenstates of the proton. Thecomplexity in this scheme scales as the matrix-vector prod-uct of the shared proton Hamiltonian matrix in Eq. �7� andthe Krylov space vector. This action is greatly simplified bythe fact that Eq. �8� represents a sparse, banded-Toeplitz ma-trix which allows for efficient �O�N�� matrix operations.
In Sec. III, we utilize the decomposition technique dis-cussed in Sec. II A to assign the finite temperature spectralresults and to probe the differences between the results atdifferent temperatures. We also utilize the treatment ofnuclear quantization discussed here, in Sec. II B, to provide aqualitative understanding of the effect of temperature on thespectrum.
III. RESULTS AND DISCUSSION
Harmonic frequencies, obtained at DFT �B3LYP� andMP2 optimized geometries, are presented on the top twopanels of Figs. 2�a� and 2�b�. As noted from the experimentalspectra provided in the bottom panels of these figures, theharmonic calculations do not even qualitatively suggest asource for the observed broadening in the IRMPD spectrum.Furthermore, the doublet at 1000 cm−1 in the argon-taggedaction spectrum �Fig. 2�b�� is also not reproduced by theharmonic calculation. This discrepancy is very similar to thatencountered for the protonated Zundel cation, where again adoublet noted in the argon-tagged action spectrum experi-ment �at �900 cm−1� was not reproduced by harmonicanalysis and by high level quantum calculations.27 As wewill see below, the underlying subtleties that dominatethe Zundel cation also govern the fundamental organic,“Zundel-like” system �Me2O–H–OMe2�+ treated here.
To understand the differences between the harmonicspectral results and the experimental calculations, we con-struct the Fourier transform of dipole and velocity autocor-relation functions �FT-DAC and FT-VAC� from AIMD data.The FT-DAC is presented using the curves labeled AIMD inFigs. 2�a� and 2�b�. The FT-VAC is used later in this sectionto analyze and decompose the finite temperature spectra us-ing the approach described in Sec. II A. The broad feature inthe 1000–1200 cm−1 region in IRMPD is reproduced reason-
ably well by the 270 K AIMD simulation. However, the ad-ditional features in the simulated results at 1000–1200 cm−1
seems to indicate that the effective temperature of the experi-ment is higher than 270 K, which may be consistent withprevious studies.85 The doublet at 1000 cm−1 in the argon-tagged spectrum is noted through a sharp peak at�1038 cm−1 and a broader distribution at �1000 cm−1 in thelower temperature simulation. In addition, the peaks at1600 cm−1 have higher intensity in the 68 K simulation,which is not the case of the argon experiment. These aspectsare probed here through a harmonic mode decomposition ofthe finite temperature spectra and further unraveled through adescription of the quantum nuclear contributions from theshared proton.
In Tables I–V, we expand the finite temperature AIMDspectra using the harmonic normal modes �acquired at aminimum energy B3LYP structure� to obtain the coefficientsCi
��1,�2� and Di��1,�2�, described in Eqs. �4� and �6�. �While the
results for Ci��1,�2� and Di
��1,�2� presented here were obtainedusing the B3LYP optimized geometry and frequencies, we
FIG. 2. �Color online� Finite temperature AIMD, IRMPD �reproduced fromRef. 10�, argon-tagged single photon action spectrum experiments �repro-duced from Ref. 11� and harmonic frequencies for �Me2O�2H+.
184308-4 Li, Moore, and Iyengar J. Chem. Phys. 128, 184308 �2008�
Author complimentary copy. Redistribution subject to AIP license or copyright, see http://jcp.aip.org/jcp/copyright.jsp

have also conducted a similar analysis by using the MP2optimized geometry and frequencies and found good quali-tative agreement between the two results.� The notation usedin Tables I–V, to represent the normal modes, is discussed inthe Appendix. Generally, the normal modes are representedas Hsubscript
superscript, where the subscript indicates the actual normalmode frequency and the superscript is a notation utilized todescribe the atomic motions that constitute the mode �seeAppendix�. This decomposition facilitates an analysis of thenormal mode couplings involved in the finite temperaturesimulations and provides a chemical interpretation for thefinite temperature spectrum in terms of the intrinsic har-monic modes. In addition, while the analysis in Sec. II Aconsiders a complete set of harmonic mode vectors, whichincludes all 3N harmonic modes, it was found that the high-est contributions in Tables I–V arise from the �3N−6� inter-nal modes. In addition, the mode decompositions at differentfrequencies are not expected to be orthogonal. That is,
�i
Ci��1,�2� · Ci
��3,�4�
= ���1
�2
d�Ci���21/2
· ���3
�4
d��Ci����21/2
0.
�9�
Hence, the analysis here does not provide effectiveeigenstates at a given temperature but provides a qualitativedescription of the normal mode couplings that yield the finitetemperature spectrum.
Before we embark upon a detailed analysis of TablesI–V, there are a few general features that we must highlight.First and foremost, we find that both “light” and “dark”modes �i.e., absorbing and nonabsorbing modes� contributeto the intensities displayed in Tables I–V. The light modesare characterized by the larger Di
��1,�2� values, which are pre-sented in parentheses in the tables. The dark modes havelower contributions from Di
��1,�2� and higher contributionsfrom Ci
��1,�2�. �In Tables I–V, the light modes with relativelyhigh Di
��1,�2� intensities are shown in boldface.� The darkmodes contribute to the respective spectra through intensityborrowing via intramolecular vibrational redistribution �IVR�from the light modes. It is further clear upon inspection of alltables that there are four major light modes present in bothhigh and low temperature calculations: H788
OPOA-S–COCS-S,H940
P�–COCS-S, H1297OPOA-S–CH3rock–COCscissor, and H1555
P↖+CH3S-scissor. As
per the notation described in the Appendix, the mode desig-nated as H788
OPOA-S–COCS-S couples an antisymmetric triatomicstretch mode involving the shared proton and the two oxygenatoms �designated as OPOA-S� with the symmetric triatomicstretch mode involving the carbons and oxygens �COCS-S�and occurs at 788 cm−1 in the harmonic calculation. Simi-larly, H940
P�–COCS-S involves a large amplitude shared protonstretch coupled to the ether backbone symmetric stretch. Themode designated as H1297
OPOA-S–CH3rock–COCscissor involves theOPOA-S antisymmetric triatomic stretch mode coupled to me-thyl rock and ether backbone scissor motion, whereas themode H1555
P↖+CH3S-scissor includes the shared proton motion, di-rected away from the oxygen-oxygen axis at an angle of 50°,coupled to a scissor or umbrella motion of the methylgroups. As expected, these are the same major modes that aredisplayed with highest IR intensity in the harmonic spectra inFigs. 2�a� and 2�b�. All of these modes include contributionsfrom the shared proton stretch, on account of the large dipolemodulation associated with such a �polarizing� motion. Inaddition, there are two modes, H1041
COCA-S–P� and H1201etherwag–P�,
that have lower intensities in Figs. 2�a� and 2�b�. Thesemodes contribute as light modes in Tables I–V whenever thecorresponding velocity coefficients Ci
��1,�2� are large. Sec-ond, we find that the band at �800 cm−1 has “innate inten-sity” in both high and low temperature simulations since thisis the spectral region where the modes having high Ci
��1,�2�
values also have high Di��1,�2� values. The rest of the spectral
features have a relatively higher contribution from borrowedintensity. Furthermore, the coefficients for the dark modesgrow as a function of temperature as we see in our discussionbelow.
In Table I, we provide the mode decompositions for thelow end of the spectral region. Both Ci
��1,�2� and Di��1,�2�
coefficients are provided; Di��1,�2� are provided within paren-
theses. We only provide modes with Ci��1,�2�0.15, however
Fig. 3 lists the contributions from all harmonic modes. Thisis coupled to minor contributions from symmetric C–O–Cbackbone stretch motion and O–O stretch. The mode desig-nated as H788
OPOA-S–COCS-S and H940P�–COCS-S constitute the pre-
dominant contribution in this spectral region for high as wellas low temperature simulations. A relatively minor contribu-tion arises in both cases from the coupled motion of theoxygen-oxygen stretch with the COC symmetric stretch. Im-portantly, the results from decomposition of both FT-VACand FT-DAC are consistent in the sense that the coefficients
TABLE I. Analysis of the vibrational harmonic frequency components that contribute in the 800 cm−1 region for both low �68 K� and high temperature�270 K� AIMD spectra. The normal modes are described in the Appendix. The decomposition coefficients obtained from Eqs. �4� and �6�, i.e., �Ci
��1,�2� andDi
��1,�2��, are both provided; Di��1,�2� inside the parentheses. �Threshold for both coefficients are chosen to be 0.15 in all tables.� The light modes, designated
as those having relatively high Di��1,�2� intensities, are boldface.
Harmonic mode decompositions �at 800 cm−1�a
68 K 0.85
�0.93� H788OPOA-S–COCS-S +
0.38
�0.36� H940P�–COCS-S +
0.17
�0.0047� H932OOS–COCS-S
270 K 0.66
�0.87� H788OPOA-S–COCS-S +
0.42
�0.47� H940P�–COCS-S +
0.24
�0.0084� H932OOS–COCS-S +
0.18
�0.0023� H32etherA-twist +
0.17
�0.005� H536OOS–COCS-S
aNote that �1=682 cm−1 and �2=863 cm−1.
184308-5 AIMD simulations of action spectra: Dimethyl ether dimer J. Chem. Phys. 128, 184308 �2008�
Author complimentary copy. Redistribution subject to AIP license or copyright, see http://jcp.aip.org/jcp/copyright.jsp

Ci��1,�2� and Di
��1,�2� are both equally significant in magnitudefor the most dominant modes in this region of the spectrum,which as we see below is not the case for the other spectralregions. Furthermore, as noted in Fig. 3, the critical modesthat contribute to both high and low temperature simulationsthrough Ci
��1,�2� intensities are basically the same, althoughthe distribution of intensities for the higher temperaturesimulation is slightly broad as compared to the low tempera-ture simulation. In addition, it may be noted from Fig. 3 thatthe two modes displaying the lowest Ci
��1,�2� intensities inTable I at 270 K are only slight lower in intensity at 68 K.These results may also be compared to recentexperiments10,50 on a variety of proton bound ether systemswhere it is noted that the nature of the 800 cm−1 feature isroughly conserved over a progression of ether groupsstudied.
Results in the 1000–1200 cm−1 region are provided inTables II and III. In this frequency range, the velocity anddipole contributions are not uniform and modes that have ahigh contribution in the velocity spectrum �characterized bythe larger values of Ci
��1,�2�� may have a far lower dipolecontribution. For example, the coupled O–O stretch, C–O–Csymmetric stretch mode has the most significant velocitycontribution at 1000 cm−1 in the 68 K result �Table II�. How-ever, the corresponding dipole intensity is very weak. Theproton stretch features H788
OPOA-S–COCS-S and H940P�–COCS-S, how-
ever, always display a high dipole intensity. In addition, the
weak H1041COCA-S–P� mode contributes on account of a large
Ci��1,�2� value. As noted before, the sharp doublet in the
argon-tagged action spectrum is fundamentally differentfrom the harmonic spectrum in Fig. 2�b�. The finite tempera-ture simulation reproduces the doublet through the featuresat 1000 and 1038 cm−1 which are analyzed in Table II. Thetwo features are similar and display similar sharp IR inten-sities, on account of contributions from proton stretch modesH788
OPOA-S–COCS-S and H940P�–COCS-S but differ through contribu-
tions from OO stretch and COC symmetric stretch at1000 cm−1 and methyl wag at 1038 cm−1. This aspect is alsoclear from Fig. 4�a�, where the distribution of Ci
��1,�2� inten-sities is presented. This illustrates the coupling between theshared proton stretch and the motion of peripheral atoms.These results are to be compared with recent studies involv-ing multiconfigurational time-dependent Hartree calculationson the Zundel cation,27 where it was noted that the couplingbetween the OH wag motion from the participating watermolecules and the shared proton stretch are responsible forsplitting the 900 cm−1 singlet peak noted earlier in harmoniccalculations, vibrational configuration interaction, and quan-tum Monte Carlo studies.8 Here, again we note a similarcontribution from the COC symmetric stretch and the methylwag, in the most fundamental organic Zundel-like system�Me2O–H–OMe2�+, which results in a splitting of the sharpsinglet at 940 cm−1 reported in the harmonic spectrum. Thisis, however, not a surprise since in larger, more general pro-ton donor-acceptor systems �such as those occurring in manyenzymes86�, this kind of coupled motion is responsible forsecondary isotope effects. Hence, it will be interesting toinvestigate the dependence of such complex, coupledmotions in the generic �R2O–H–OR2��
+ systems for differentR and R� groups at low temperature. This will be explored infuture publications.
From Table III we note a striking similarity between themodes that contribute to the 1012 and 1095 cm−1 regions inthe 270 K spectrum and the 1000 and 1038 cm−1 regions inthe 68 K result. However, as is clear from Table III and alsofrom Fig. 4�b�, there are far greater numbers of harmonicmodes that contribute to the high temperature spectrum ascompared to the lower temperature spectrum. For example,as shown in Fig. 4�b�, the high temperature distributionaround 1000 cm−1 is broader than the low temperature dis-
TABLE II. Analysis of the vibrational harmonic frequency components that contribute in the 1000–1200 cm−1 region for the low temperature �68 K� AIMDspectra. The normal modes are described in the Appendix. The decomposition coefficients obtained from Eqs. �4� and �6�, i.e., Ci
��1,�2� and Di��1,�2�, are both
provided; Di��1,�2� inside the parentheses. �Threshold for both coefficients are chosen to be 0.15 in all tables.� The light modes, designated as those having
relatively high Di��1,�2� intensities, are boldface.
68 K
Frequency Harmonic mode decompositions
1000 cm−1a 0.77
�0.045� H932OOS–COCS-S +
0.49
�0.93� H940P�–COCS-S +
0.15
�0.34� H788OPOA-S–COCS-S +
0.15
�0.072� H1041COCA-S–P�
1038 cm−1b 0.69
�0.44� H1041COCA-S–P� +
0.51
�0.061� H1147CH3wag–P� +
0.32
�0.79� H940P�–COCS-S +
0.14
�0.40� H788OPOA-S–COCS-S
a�1=875 cm−1 and �2=1015 cm−1.b�1=1015 cm−1 and �2=1147 cm−1.
FIG. 3. �Color online� Distribution of Ci��1,�2� for the 800 cm−1 band for low
and high temperature simulations. Note that these plots are only defined fordiscrete values of the horizontal axis, i.e., only at the harmonic frequencies,which explains why the plots are piecewise linear.
184308-6 Li, Moore, and Iyengar J. Chem. Phys. 128, 184308 �2008�
Author complimentary copy. Redistribution subject to AIP license or copyright, see http://jcp.aip.org/jcp/copyright.jsp

TABLE III. Analysis of the vibrational harmonic frequency components that contribute in the 1000–1200 cm−1 region for the high temperature �270 K�AIMD spectra. The normal modes are described in the Appendix. The decomposition coefficients obtained from Eqs. �4� and �6�, i.e., Ci
��1,�2� and Di��1,�2�, are
both provided; Di��1,�2� inside the parentheses. �Threshold for both coefficients are chosen to be 0.15 in all tables.� The light modes, designated as those having
relatively high Di��1,�2� intensities, are boldface.
270 K
Frequency Harmonic mode decompositions
1012 cm−1a 0.67
�0.48� H1041COCA-S–P� +
0.45
�0.038� H932OOS–COCS-S +
0.28
�0.79� H940P�–COCS-S
1095 cm−1b 0.47
�0.87� H940P�–COCS–S +
0.33
�0.16� H1041COCA-S–P� +
0.26
�0.025� H1147CH3wag–P� +
0.25
�0.024� H1157CH3S-wag +
0.19
�0.41� H788OPOA-S–COCS-S
+0.19
�0.078� H1201etherwag–P� +
0.16
�0.066� H1521P� +
0.15
�0.044� H1547P� +
0.15
�0.016� H1194etherwag
1155 cm−1c 0.30
�0.060� H1194etherwag +
0.38
�0.068� H1157CH3S-wag +
0.35
�0.061� H1147CH3wag–P� +
0.28
�0.22� H1201Etherwag–P� +
0.21
�0.35� H1297OPOA-S–CH3rock–COCscissor
+0.24
�0.026� H3192CHstretch +
0.17
�0.030� H1294OOS–CH3wag +
0.17
�0.021� H1497CH3A-scissor–P� +
0.15
�0.63� H788OPOA-S–COCS-S
+0.15
�0.044� H1494CH3S-scissor–P� +
0.15
�0.53� H940P�–COCS-S
a�1=863 cm−1 and �2=1055 cm−1.b�1=1055 cm−1 and �2=1118 cm−1.c�1=1118 cm−1 and �2=1200 cm−1.
FIG. 4. �Color online� Distribution of Ci��1,�2� for the 1000–1200 cm−1 band
for low �a� and high �b� temperature simulations. Note that these plots areonly defined for discrete values of the horizontal axis, i.e., only at the har-monic frequencies, which explains why the plots are piecewise linear.
FIG. 5. �Color online� The distribution of harmonic modes for low and hightemperature simulations is shown in �a�. The vertical axis in �a� representsthe number of states that contribute to the velocity spectrum with Ci
��1,�2�
0.15. The relatively higher population for the 1500 cm−1 band at 68 K isdue to the large density of harmonic mode states in this region. See �b� fora representation of the density of harmonic modes. More than a fourth of the�3N−6� harmonic modes appear inside the 1450–1550 cm−1 window shownin the inset of �b�.
184308-7 AIMD simulations of action spectra: Dimethyl ether dimer J. Chem. Phys. 128, 184308 �2008�
Author complimentary copy. Redistribution subject to AIP license or copyright, see http://jcp.aip.org/jcp/copyright.jsp
tribution in Fig. 4�a�, with significant contributions from thelow as well as high ends of the spectral region.
The higher frequency mode in Table III displays contri-butions from modes such as the ether wag, COC scissor mo-tion, and methyl symmetric wag, which are not seen in anyof the lower spectral regions both at high and low tempera-tures. Furthermore, the higher frequency mode in Table IIImostly contains “dark” modes, which are characterized bylarge Ci
��1,�2� values and relatively small Di��1,�2� values. This
implies that the 1155 cm−1 peak in the 270 K simulationmostly appears due to intensity borrowing from the lightH1297
OPOA-S–CH3rock–COCscissor mode. As the temperature is in-creased, the portion of the potential surface that is sampledduring dynamics may become highly anharmonic, resultingin the coupling of many harmonic modes. This is essentiallyon display for the broad feature extending up to 1200 cm−1
for the higher temperature simulated spectrum and is consis-tent with the interpretation that the broader spectral featuresin the IRMPD spectrum recorded in Ref. 10 result from theintrinsic higher temperature of the ions. To further probe this
aspect, we present in Fig. 5�a� the number of contributingnormal modes with Ci
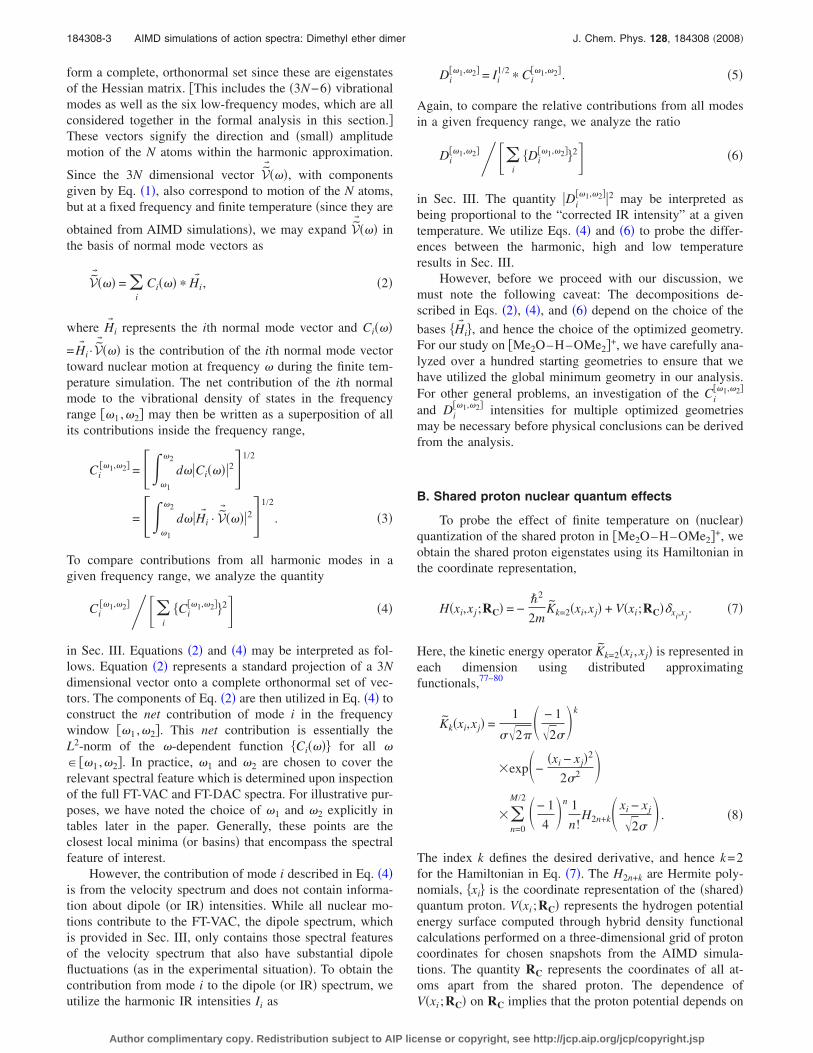
��1,�2�0.15 for the high and low tem-perature AIMD simulations. Clearly, the higher temperaturesimulation is dictated by a far greater number of harmonicmodes as compared to the low temperature result. This canalso be seen from the data in Table IV, which show that thesame principal modes contribute to the 1300 cm−1 region ofboth the 68 and 270 K simulations, but that the higher-temperature spectrum also has contributions from manymore dark modes, as well as two additional light modes.Furthermore, it is clear that essentially all of the intensitybetween 800 and 1300 cm−1 in both simulated spectra is de-rived from the three light modes involving the stretchingmotion of the shared proton �Figs. 6 and 7�.
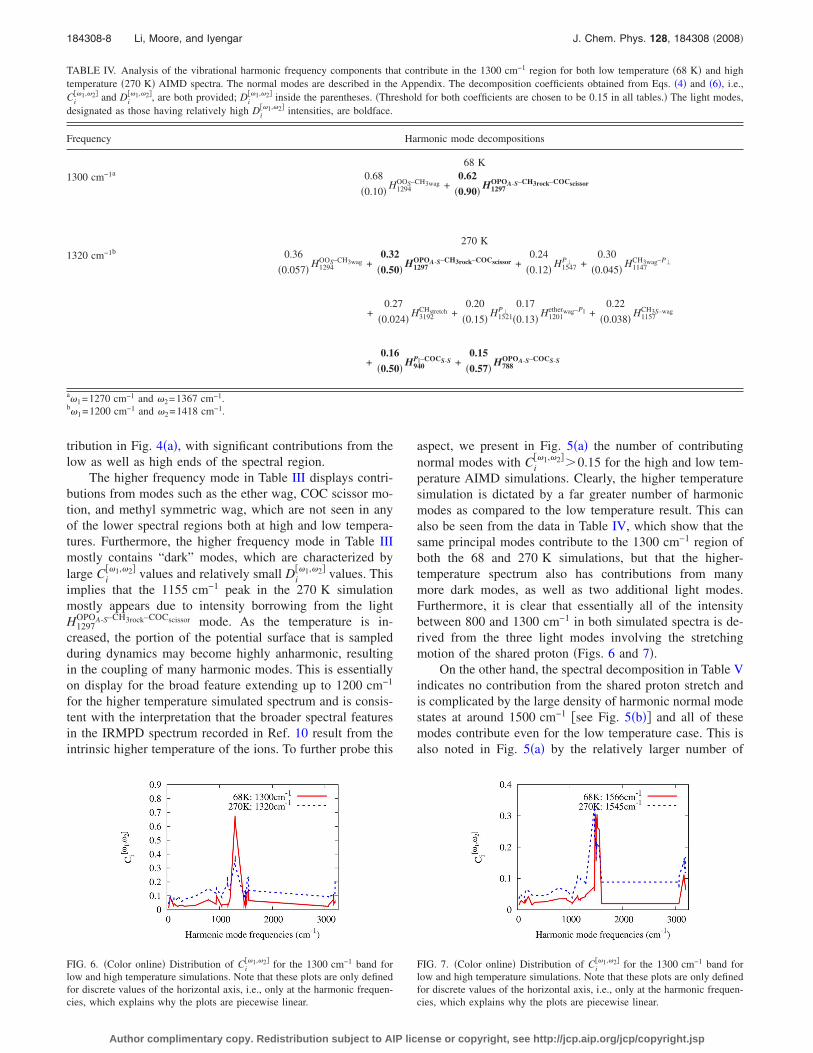
On the other hand, the spectral decomposition in Table Vindicates no contribution from the shared proton stretch andis complicated by the large density of harmonic normal modestates at around 1500 cm−1 �see Fig. 5�b�� and all of thesemodes contribute even for the low temperature case. This isalso noted in Fig. 5�a� by the relatively larger number of
TABLE IV. Analysis of the vibrational harmonic frequency components that contribute in the 1300 cm−1 region for both low temperature �68 K� and hightemperature �270 K� AIMD spectra. The normal modes are described in the Appendix. The decomposition coefficients obtained from Eqs. �4� and �6�, i.e.,Ci
��1,�2� and Di��1,�2�, are both provided; Di
��1,�2� inside the parentheses. �Threshold for both coefficients are chosen to be 0.15 in all tables.� The light modes,designated as those having relatively high Di
��1,�2� intensities, are boldface.
Frequency Harmonic mode decompositions
68 K1300 cm−1a 0.68
�0.10� H1294OOS–CH3wag +
0.62
�0.90� H1297OPOA-S–CH3rock–COCscissor
270 K1320 cm−1b 0.36
�0.057� H1294OOS–CH3wag +
0.32
�0.50� H1297OPOA-S–CH3rock–COCscissor +
0.24
�0.12� H1547P� +
0.30
�0.045� H1147CH3wag–P�
+0.27
�0.024� H3192CHstretch +
0.20
�0.15� H1521P�
0.17
�0.13� H1201etherwag–P� +
0.22
�0.038� H1157CH3S–wag
+0.16
�0.50� H940P�–COCS-S +
0.15
�0.57� H788OPOA-S–COCS-S
a�1=1270 cm−1 and �2=1367 cm−1.b�1=1200 cm−1 and �2=1418 cm−1.
FIG. 6. �Color online� Distribution of Ci��1,�2� for the 1300 cm−1 band for
low and high temperature simulations. Note that these plots are only definedfor discrete values of the horizontal axis, i.e., only at the harmonic frequen-cies, which explains why the plots are piecewise linear.
FIG. 7. �Color online� Distribution of Ci��1,�2� for the 1300 cm−1 band for
low and high temperature simulations. Note that these plots are only definedfor discrete values of the horizontal axis, i.e., only at the harmonic frequen-cies, which explains why the plots are piecewise linear.
184308-8 Li, Moore, and Iyengar J. Chem. Phys. 128, 184308 �2008�
Author complimentary copy. Redistribution subject to AIP license or copyright, see http://jcp.aip.org/jcp/copyright.jsp
modes contributing to the low temperature spectrum at1500 cm−1, as compared to other frequency ranges. This as-pect is also indicative of the fact that the effective tempera-ture of the argon tagged experiments may be lower than68 K. As a result, lower temperature AIMD simulations arecurrently in progress to further refine this region of the spec-trum.
The preceding results provide a detailed description ofthe mechanism of spectral broadening at high temperatures,namely, the anharmonic coupling between harmonic vibra-tional modes and intensity borrowing between light and darkmodes. In the next section, we will study the nuclear quan-tum nature of the “soft” shared proton mode and presentanother qualitative explanation for the spectral broadening interms of the intrinsic potential energy surface experienced bythe shared proton. However, it is already clear that first prin-ciples, finite temperature molecular dynamics can provideinsights into argon-tagged single photon as well as multiplephoton experimental processes. While this has been notedpreviously21,22,25,56,63 for argon-tagged single photon experi-ments, the result is relatively new with respect to the mul-tiple photon �IRMPD� experimental situation. With regardsto comparison of AIMD results with IRMPD, it must benoted that the IRMPD mechanism involves the noncoherent,sequential absorption of multiple photons, with IVR medi-ated randomization of the internal vibrational energy be-tween absorption events. Specifically for the IRMPD spectra
obtained with a free-electron laser47 as the light source in thestudy conducted in Ref. 10, the infrared light typically con-sists of a train of low-intensity ��10 �J� �1 ps micropulseswith approximately 1 ns spacing. This spacing allows fordeexcitation of the resonant mode by IVR in between micro-pulses, and the contribution of nonlinear, multiple-photonprocesses to the IRMPD spectrum is minimal. Thus,although the IRMPD process raises the internal vibrationalenergy of the ions to above the dissociation threshold, thecritical step is the absorption of the first photon, which iswhy the resulting spectra represent the ions at their initialtemperature.
A. Classical and quantum mechanical analysisof the shared proton distribution
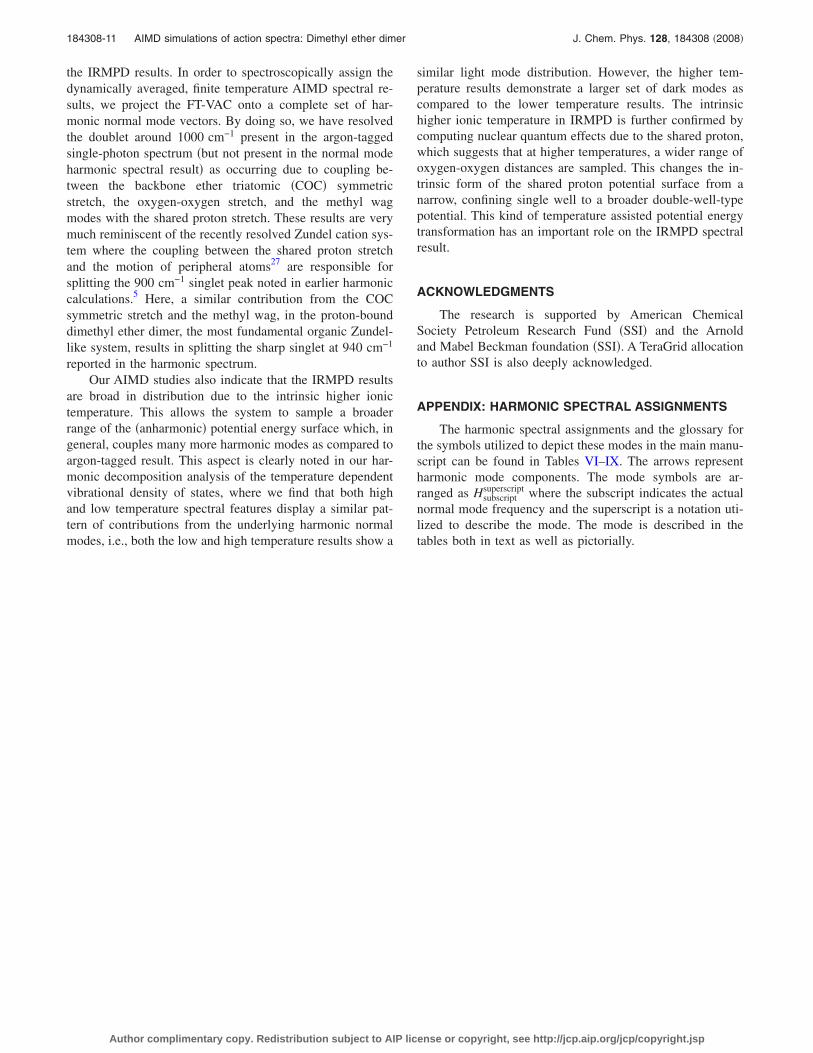
To further probe the effect of temperature on the vibra-tional spectrum, we provide the distribution of oxygen-oxygen �OO� distances sampled during the finite temperatureAIMD studies in Fig. 8. It is clear that the higher temperaturesimulations have a wider OO distribution. Furthermore, aone-dimensional slice of the potential surface encountered bythe shared proton at various OO distances is also shown inred in Fig. 8. As can be seen the shared proton potentialchanges from a steep single well potential for smaller valuesof the OO distance �in the range of 2.3–2.4 Å� to a broad
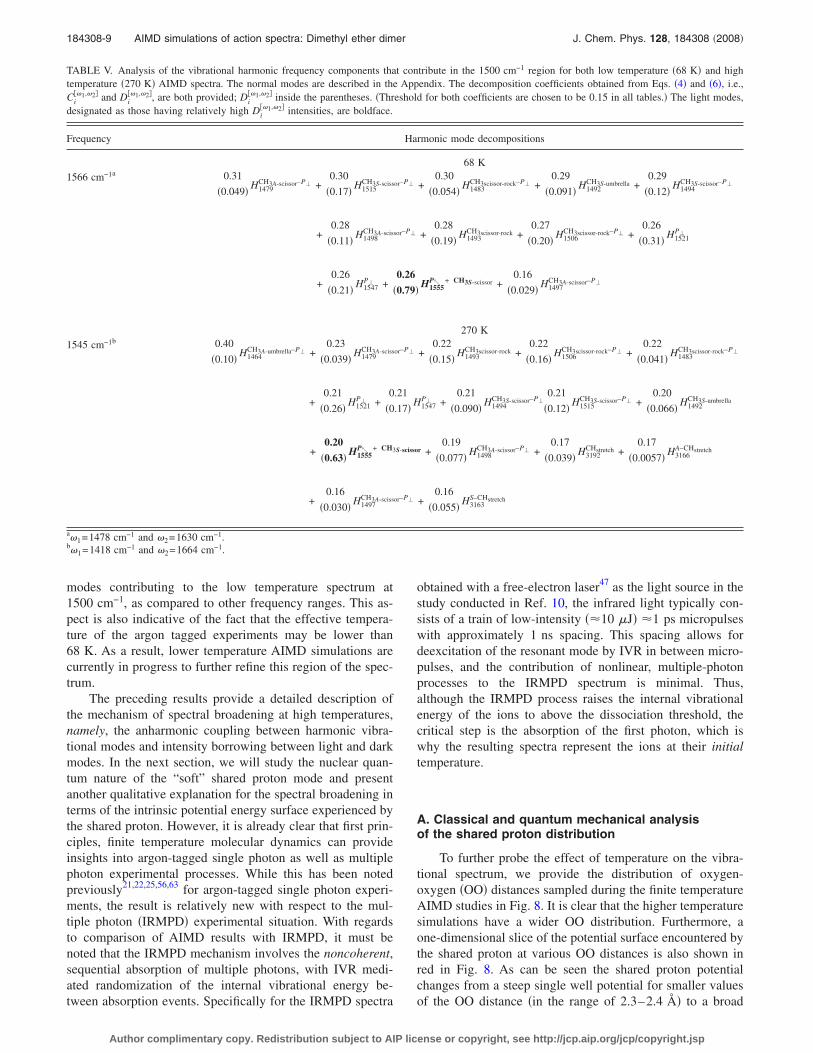
TABLE V. Analysis of the vibrational harmonic frequency components that contribute in the 1500 cm−1 region for both low temperature �68 K� and hightemperature �270 K� AIMD spectra. The normal modes are described in the Appendix. The decomposition coefficients obtained from Eqs. �4� and �6�, i.e.,Ci
��1,�2� and Di��1,�2�, are both provided; Di
��1,�2� inside the parentheses. �Threshold for both coefficients are chosen to be 0.15 in all tables.� The light modes,designated as those having relatively high Di
��1,�2� intensities, are boldface.
Frequency Harmonic mode decompositions
68 K1566 cm−1a 0.31
�0.049� H1479CH3A-scissor–P� +
0.30
�0.17� H1515CH3S-scissor–P� +
0.30
�0.054� H1483CH3scissor-rock–P� +
0.29
�0.091� H1492CH3S-umbrella +
0.29
�0.12� H1494CH3S-scissor–P�
+0.28
�0.11� H1498CH3A-scissor–P� +
0.28
�0.19� H1493CH3scissor-rock +
0.27
�0.20� H1506CH3scissor-rock–P� +
0.26
�0.31� H1521P�
+0.26
�0.21� H1547P� +
0.26
�0.79� H1555P↖ + CH3S-scissor +
0.16
�0.029� H1497CH3A-scissor–P�
270 K1545 cm−1b 0.40
�0.10� H1464CH3A-umbrella–P� +
0.23
�0.039� H1479CH3A-scissor–P� +
0.22
�0.15� H1493CH3scissor-rock +
0.22
�0.16� H1506CH3scissor-rock–P� +
0.22
�0.041� H1483CH3scissor-rock–P�
+0.21
�0.26� H1521P� +
0.21
�0.17� H1547P� +
0.21
�0.090� H1494CH3S-scissor–P�
0.21
�0.12� H1515CH3S-scissor–P� +
0.20
�0.066� H1492CH3S-umbrella
+0.20
�0.63� H1555P↖ + CH3S-scissor +
0.19
�0.077� H1498CH3A-scissor–P� +
0.17
�0.039� H3192CHstretch +
0.17
�0.0057� H3166A–CHstretch
+0.16
�0.030� H1497CH3A-scissor–P� +
0.16
�0.055� H3163S–CHstretch
a�1=1478 cm−1 and �2=1630 cm−1.b�1=1418 cm−1 and �2=1664 cm−1.
184308-9 AIMD simulations of action spectra: Dimethyl ether dimer J. Chem. Phys. 128, 184308 �2008�
Author complimentary copy. Redistribution subject to AIP license or copyright, see http://jcp.aip.org/jcp/copyright.jsp
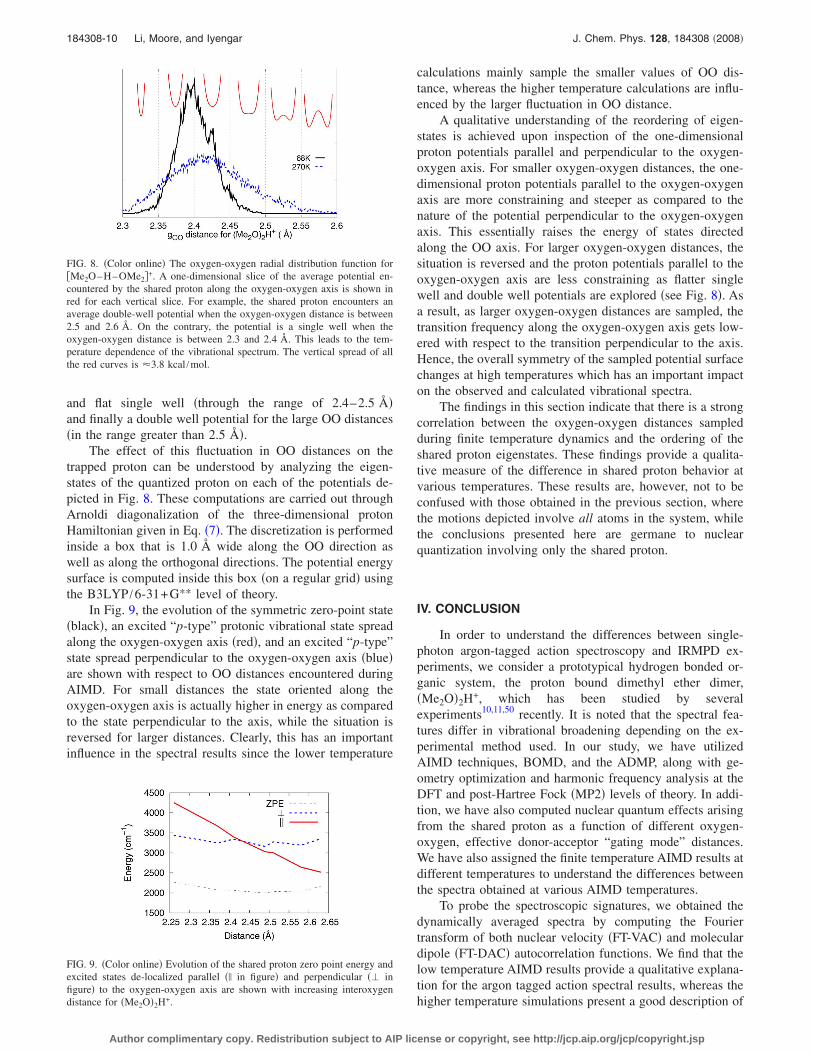
and flat single well �through the range of 2.4–2.5 Å�and finally a double well potential for the large OO distances�in the range greater than 2.5 Å�.
The effect of this fluctuation in OO distances on thetrapped proton can be understood by analyzing the eigen-states of the quantized proton on each of the potentials de-picted in Fig. 8. These computations are carried out throughArnoldi diagonalization of the three-dimensional protonHamiltonian given in Eq. �7�. The discretization is performedinside a box that is 1.0 Å wide along the OO direction aswell as along the orthogonal directions. The potential energysurface is computed inside this box �on a regular grid� usingthe B3LYP /6-31+G** level of theory.
In Fig. 9, the evolution of the symmetric zero-point state�black�, an excited “p-type” protonic vibrational state spreadalong the oxygen-oxygen axis �red�, and an excited “p-type”state spread perpendicular to the oxygen-oxygen axis �blue�are shown with respect to OO distances encountered duringAIMD. For small distances the state oriented along theoxygen-oxygen axis is actually higher in energy as comparedto the state perpendicular to the axis, while the situation isreversed for larger distances. Clearly, this has an importantinfluence in the spectral results since the lower temperature
calculations mainly sample the smaller values of OO dis-tance, whereas the higher temperature calculations are influ-enced by the larger fluctuation in OO distance.
A qualitative understanding of the reordering of eigen-states is achieved upon inspection of the one-dimensionalproton potentials parallel and perpendicular to the oxygen-oxygen axis. For smaller oxygen-oxygen distances, the one-dimensional proton potentials parallel to the oxygen-oxygenaxis are more constraining and steeper as compared to thenature of the potential perpendicular to the oxygen-oxygenaxis. This essentially raises the energy of states directedalong the OO axis. For larger oxygen-oxygen distances, thesituation is reversed and the proton potentials parallel to theoxygen-oxygen axis are less constraining as flatter singlewell and double well potentials are explored �see Fig. 8�. Asa result, as larger oxygen-oxygen distances are sampled, thetransition frequency along the oxygen-oxygen axis gets low-ered with respect to the transition perpendicular to the axis.Hence, the overall symmetry of the sampled potential surfacechanges at high temperatures which has an important impacton the observed and calculated vibrational spectra.
The findings in this section indicate that there is a strongcorrelation between the oxygen-oxygen distances sampledduring finite temperature dynamics and the ordering of theshared proton eigenstates. These findings provide a qualita-tive measure of the difference in shared proton behavior atvarious temperatures. These results are, however, not to beconfused with those obtained in the previous section, wherethe motions depicted involve all atoms in the system, whilethe conclusions presented here are germane to nuclearquantization involving only the shared proton.
IV. CONCLUSION
In order to understand the differences between single-photon argon-tagged action spectroscopy and IRMPD ex-periments, we consider a prototypical hydrogen bonded or-ganic system, the proton bound dimethyl ether dimer,�Me2O�2H+, which has been studied by severalexperiments10,11,50 recently. It is noted that the spectral fea-tures differ in vibrational broadening depending on the ex-perimental method used. In our study, we have utilizedAIMD techniques, BOMD, and the ADMP, along with ge-ometry optimization and harmonic frequency analysis at theDFT and post-Hartree Fock �MP2� levels of theory. In addi-tion, we have also computed nuclear quantum effects arisingfrom the shared proton as a function of different oxygen-oxygen, effective donor-acceptor “gating mode” distances.We have also assigned the finite temperature AIMD results atdifferent temperatures to understand the differences betweenthe spectra obtained at various AIMD temperatures.
To probe the spectroscopic signatures, we obtained thedynamically averaged spectra by computing the Fouriertransform of both nuclear velocity �FT-VAC� and moleculardipole �FT-DAC� autocorrelation functions. We find that thelow temperature AIMD results provide a qualitative explana-tion for the argon tagged action spectral results, whereas thehigher temperature simulations present a good description of
FIG. 8. �Color online� The oxygen-oxygen radial distribution function for�Me2O–H–OMe2�+. A one-dimensional slice of the average potential en-countered by the shared proton along the oxygen-oxygen axis is shown inred for each vertical slice. For example, the shared proton encounters anaverage double-well potential when the oxygen-oxygen distance is between2.5 and 2.6 Å. On the contrary, the potential is a single well when theoxygen-oxygen distance is between 2.3 and 2.4 Å. This leads to the tem-perature dependence of the vibrational spectrum. The vertical spread of allthe red curves is �3.8 kcal /mol.
FIG. 9. �Color online� Evolution of the shared proton zero point energy andexcited states de-localized parallel �� in figure� and perpendicular �� infigure� to the oxygen-oxygen axis are shown with increasing interoxygendistance for �Me2O�2H+.
184308-10 Li, Moore, and Iyengar J. Chem. Phys. 128, 184308 �2008�
Author complimentary copy. Redistribution subject to AIP license or copyright, see http://jcp.aip.org/jcp/copyright.jsp
the IRMPD results. In order to spectroscopically assign thedynamically averaged, finite temperature AIMD spectral re-sults, we project the FT-VAC onto a complete set of har-monic normal mode vectors. By doing so, we have resolvedthe doublet around 1000 cm−1 present in the argon-taggedsingle-photon spectrum �but not present in the normal modeharmonic spectral result� as occurring due to coupling be-tween the backbone ether triatomic �COC� symmetricstretch, the oxygen-oxygen stretch, and the methyl wagmodes with the shared proton stretch. These results are verymuch reminiscent of the recently resolved Zundel cation sys-tem where the coupling between the shared proton stretchand the motion of peripheral atoms27 are responsible forsplitting the 900 cm−1 singlet peak noted in earlier harmoniccalculations.5 Here, a similar contribution from the COCsymmetric stretch and the methyl wag, in the proton-bounddimethyl ether dimer, the most fundamental organic Zundel-like system, results in splitting the sharp singlet at 940 cm−1
reported in the harmonic spectrum.Our AIMD studies also indicate that the IRMPD results
are broad in distribution due to the intrinsic higher ionictemperature. This allows the system to sample a broaderrange of the �anharmonic� potential energy surface which, ingeneral, couples many more harmonic modes as compared toargon-tagged result. This aspect is clearly noted in our har-monic decomposition analysis of the temperature dependentvibrational density of states, where we find that both highand low temperature spectral features display a similar pat-tern of contributions from the underlying harmonic normalmodes, i.e., both the low and high temperature results show a
similar light mode distribution. However, the higher tem-perature results demonstrate a larger set of dark modes ascompared to the lower temperature results. The intrinsichigher ionic temperature in IRMPD is further confirmed bycomputing nuclear quantum effects due to the shared proton,which suggests that at higher temperatures, a wider range ofoxygen-oxygen distances are sampled. This changes the in-trinsic form of the shared proton potential surface from anarrow, confining single well to a broader double-well-typepotential. This kind of temperature assisted potential energytransformation has an important role on the IRMPD spectralresult.
ACKNOWLEDGMENTS
The research is supported by American ChemicalSociety Petroleum Research Fund �SSI� and the Arnoldand Mabel Beckman foundation �SSI�. A TeraGrid allocationto author SSI is also deeply acknowledged.
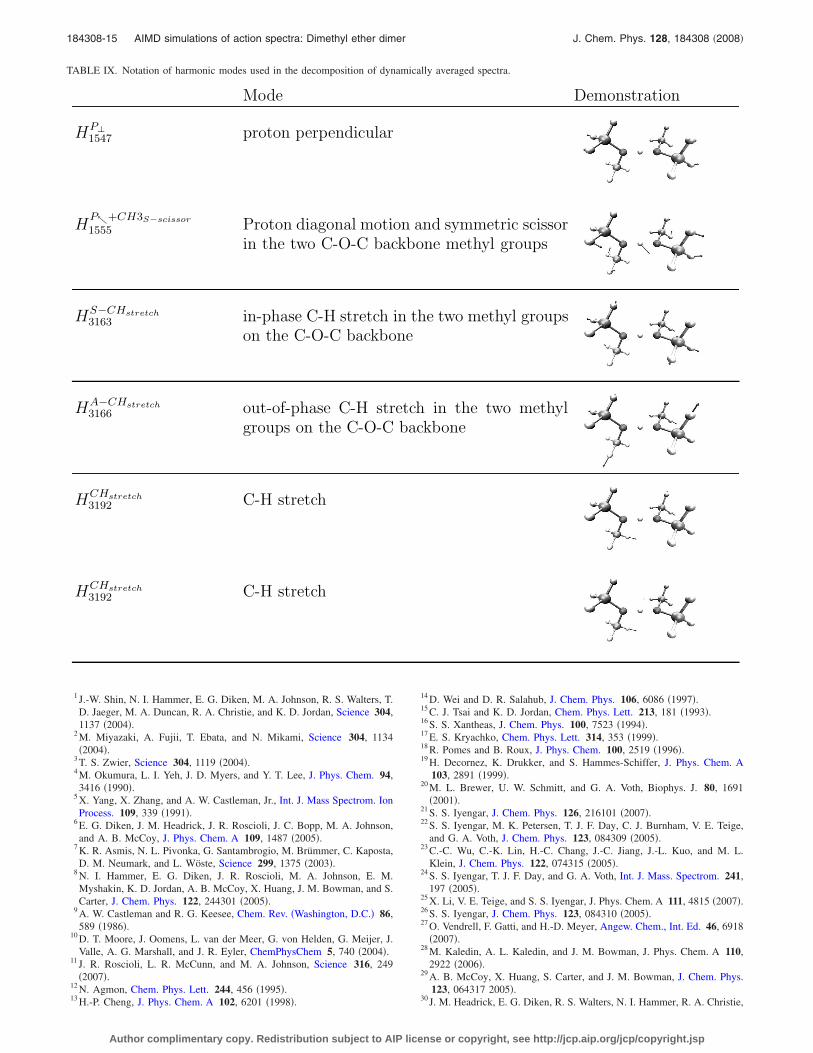
APPENDIX: HARMONIC SPECTRAL ASSIGNMENTS
The harmonic spectral assignments and the glossary forthe symbols utilized to depict these modes in the main manu-script can be found in Tables VI–IX. The arrows representharmonic mode components. The mode symbols are ar-ranged as Hsubscript
superscript where the subscript indicates the actualnormal mode frequency and the superscript is a notation uti-lized to describe the mode. The mode is described in thetables both in text as well as pictorially.
184308-11 AIMD simulations of action spectra: Dimethyl ether dimer J. Chem. Phys. 128, 184308 �2008�
Author complimentary copy. Redistribution subject to AIP license or copyright, see http://jcp.aip.org/jcp/copyright.jsp
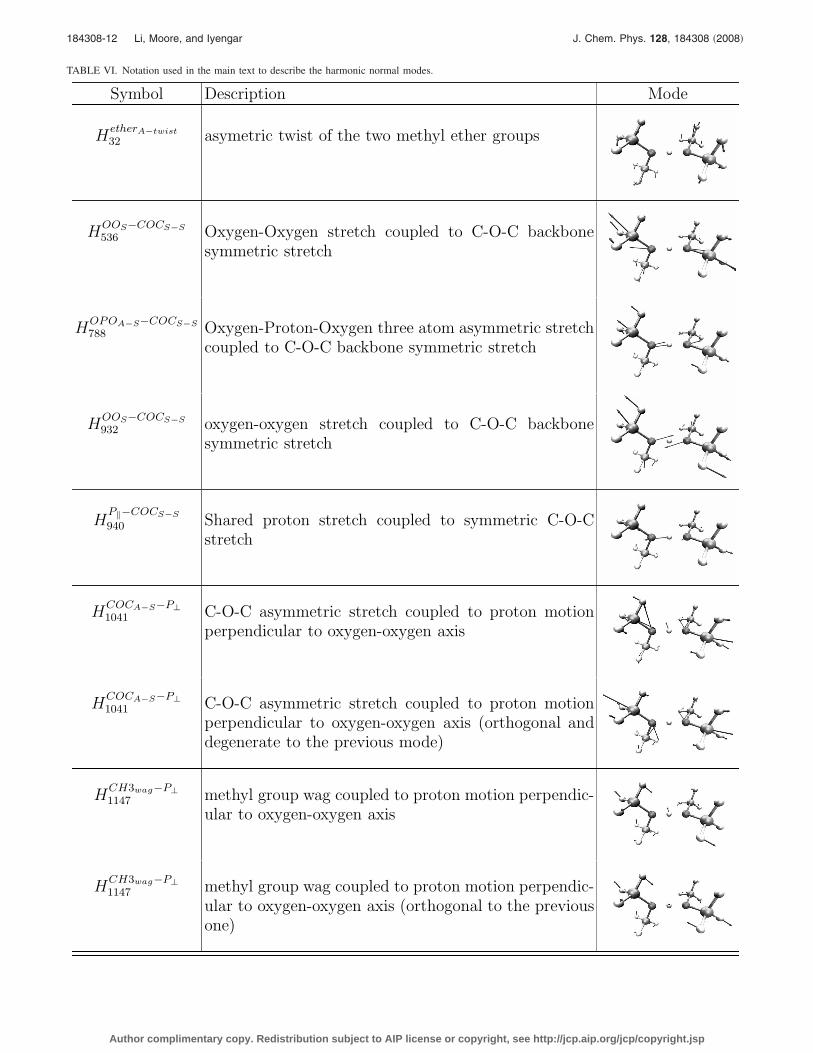
TABLE VI. Notation used in the main text to describe the harmonic normal modes.
Symbol Description Mode
HetherA−twist
32 asymetric twist of the two methyl ether groups
HOOS−COCS−S
536 Oxygen-Oxygen stretch coupled to C-O-C backbonesymmetric stretch
HOPOA−S−COCS−S
788 Oxygen-Proton-Oxygen three atom asymmetric stretchcoupled to C-O-C backbone symmetric stretch
HOOS−COCS−S
932 oxygen-oxygen stretch coupled to C-O-C backbonesymmetric stretch
HP�−COCS−S
940 Shared proton stretch coupled to symmetric C-O-Cstretch
HCOCA−S−P⊥
1041 C-O-C asymmetric stretch coupled to proton motionperpendicular to oxygen-oxygen axis
HCOCA−S−P⊥
1041 C-O-C asymmetric stretch coupled to proton motionperpendicular to oxygen-oxygen axis (orthogonal anddegenerate to the previous mode)
HCH3wag−P⊥
1147 methyl group wag coupled to proton motion perpendic-ular to oxygen-oxygen axis
HCH3wag−P⊥
1147 methyl group wag coupled to proton motion perpendic-ular to oxygen-oxygen axis (orthogonal to the previousone)
184308-12 Li, Moore, and Iyengar J. Chem. Phys. 128, 184308 �2008�
Author complimentary copy. Redistribution subject to AIP license or copyright, see http://jcp.aip.org/jcp/copyright.jsp
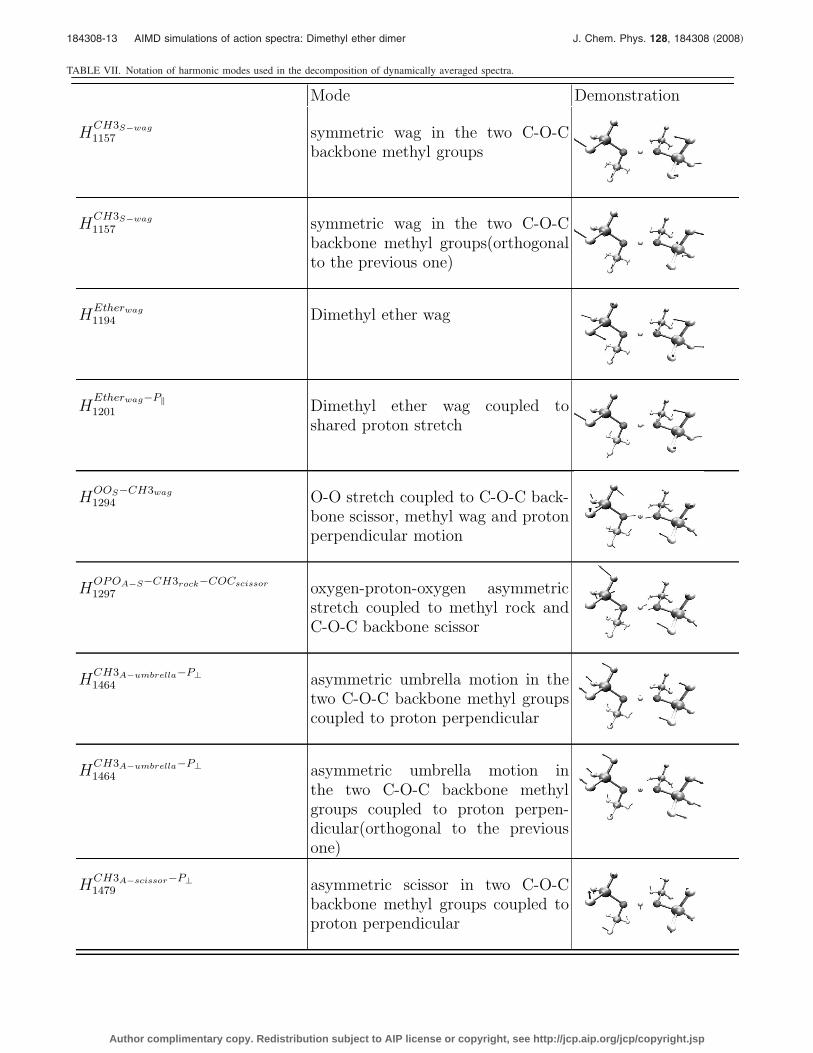
TABLE VII. Notation of harmonic modes used in the decomposition of dynamically averaged spectra.
Mode Demonstration
HCH3S−wag
1157 symmetric wag in the two C-O-Cbackbone methyl groups
HCH3S−wag
1157 symmetric wag in the two C-O-Cbackbone methyl groups(orthogonalto the previous one)
HEtherwag
1194 Dimethyl ether wag
HEtherwag−P�
1201 Dimethyl ether wag coupled toshared proton stretch
HOOS−CH3wag
1294 O-O stretch coupled to C-O-C back-bone scissor, methyl wag and protonperpendicular motion
HOPOA−S−CH3rock−COCscissor
1297 oxygen-proton-oxygen asymmetricstretch coupled to methyl rock andC-O-C backbone scissor
HCH3A−umbrella−P⊥
1464 asymmetric umbrella motion in thetwo C-O-C backbone methyl groupscoupled to proton perpendicular
HCH3A−umbrella−P⊥
1464 asymmetric umbrella motion inthe two C-O-C backbone methylgroups coupled to proton perpen-dicular(orthogonal to the previousone)
HCH3A−scissor−P⊥
1479 asymmetric scissor in two C-O-Cbackbone methyl groups coupled toproton perpendicular
184308-13 AIMD simulations of action spectra: Dimethyl ether dimer J. Chem. Phys. 128, 184308 �2008�
Author complimentary copy. Redistribution subject to AIP license or copyright, see http://jcp.aip.org/jcp/copyright.jsp
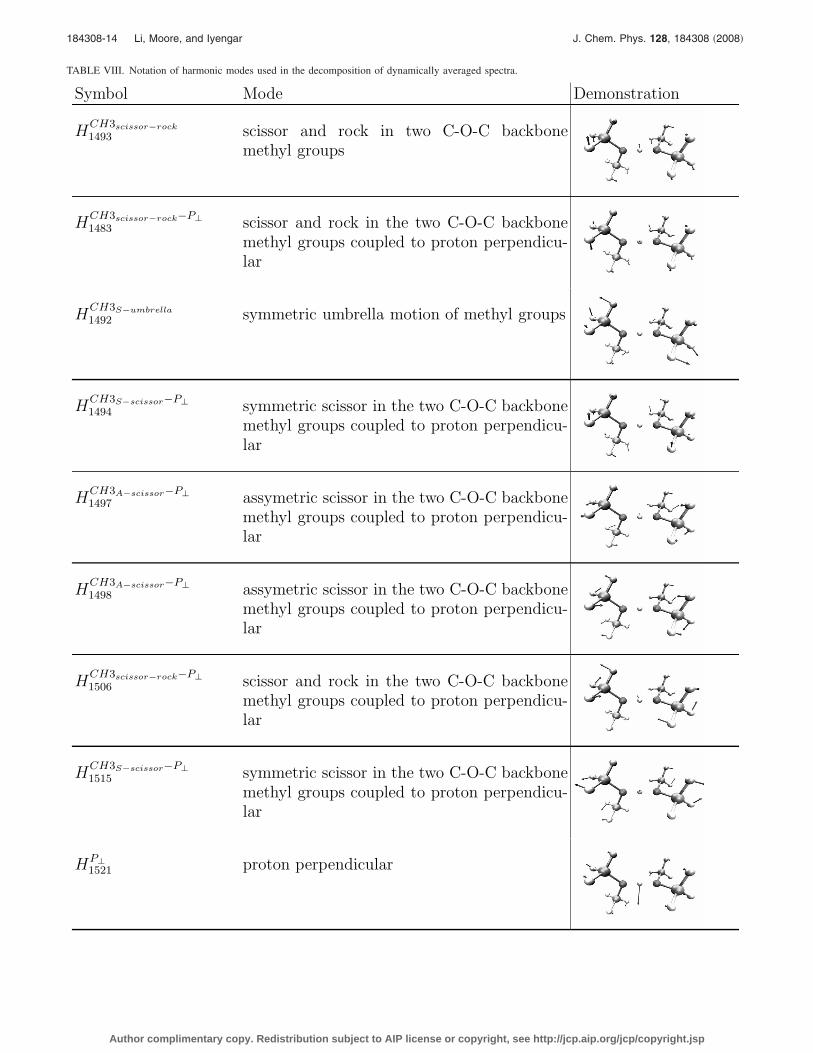
TABLE VIII. Notation of harmonic modes used in the decomposition of dynamically averaged spectra.
Symbol Mode Demonstration
HCH3scissor−rock
1493 scissor and rock in two C-O-C backbonemethyl groups
HCH3scissor−rock−P⊥
1483 scissor and rock in the two C-O-C backbonemethyl groups coupled to proton perpendicu-lar
HCH3S−umbrella
1492 symmetric umbrella motion of methyl groups
HCH3S−scissor−P⊥
1494 symmetric scissor in the two C-O-C backbonemethyl groups coupled to proton perpendicu-lar
HCH3A−scissor−P⊥
1497 assymetric scissor in the two C-O-C backbonemethyl groups coupled to proton perpendicu-lar
HCH3A−scissor−P⊥
1498 assymetric scissor in the two C-O-C backbonemethyl groups coupled to proton perpendicu-lar
HCH3scissor−rock−P⊥
1506 scissor and rock in the two C-O-C backbonemethyl groups coupled to proton perpendicu-lar
HCH3S−scissor−P⊥
1515 symmetric scissor in the two C-O-C backbonemethyl groups coupled to proton perpendicu-lar
HP⊥1521 proton perpendicular
184308-14 Li, Moore, and Iyengar J. Chem. Phys. 128, 184308 �2008�
Author complimentary copy. Redistribution subject to AIP license or copyright, see http://jcp.aip.org/jcp/copyright.jsp
1 J.-W. Shin, N. I. Hammer, E. G. Diken, M. A. Johnson, R. S. Walters, T.D. Jaeger, M. A. Duncan, R. A. Christie, and K. D. Jordan, Science 304,1137 �2004�.
2 M. Miyazaki, A. Fujii, T. Ebata, and N. Mikami, Science 304, 1134�2004�.
3 T. S. Zwier, Science 304, 1119 �2004�.4 M. Okumura, L. I. Yeh, J. D. Myers, and Y. T. Lee, J. Phys. Chem. 94,3416 �1990�.
5 X. Yang, X. Zhang, and A. W. Castleman, Jr., Int. J. Mass Spectrom. IonProcess. 109, 339 �1991�.
6 E. G. Diken, J. M. Headrick, J. R. Roscioli, J. C. Bopp, M. A. Johnson,and A. B. McCoy, J. Phys. Chem. A 109, 1487 �2005�.
7 K. R. Asmis, N. L. Pivonka, G. Santambrogio, M. Brümmer, C. Kaposta,D. M. Neumark, and L. Wöste, Science 299, 1375 �2003�.
8 N. I. Hammer, E. G. Diken, J. R. Roscioli, M. A. Johnson, E. M.Myshakin, K. D. Jordan, A. B. McCoy, X. Huang, J. M. Bowman, and S.Carter, J. Chem. Phys. 122, 244301 �2005�.
9 A. W. Castleman and R. G. Keesee, Chem. Rev. �Washington, D.C.� 86,589 �1986�.
10 D. T. Moore, J. Oomens, L. van der Meer, G. von Helden, G. Meijer, J.Valle, A. G. Marshall, and J. R. Eyler, ChemPhysChem 5, 740 �2004�.
11 J. R. Roscioli, L. R. McCunn, and M. A. Johnson, Science 316, 249�2007�.
12 N. Agmon, Chem. Phys. Lett. 244, 456 �1995�.13 H.-P. Cheng, J. Phys. Chem. A 102, 6201 �1998�.
14 D. Wei and D. R. Salahub, J. Chem. Phys. 106, 6086 �1997�.15 C. J. Tsai and K. D. Jordan, Chem. Phys. Lett. 213, 181 �1993�.16 S. S. Xantheas, J. Chem. Phys. 100, 7523 �1994�.17 E. S. Kryachko, Chem. Phys. Lett. 314, 353 �1999�.18 R. Pomes and B. Roux, J. Phys. Chem. 100, 2519 �1996�.19 H. Decornez, K. Drukker, and S. Hammes-Schiffer, J. Phys. Chem. A
103, 2891 �1999�.20 M. L. Brewer, U. W. Schmitt, and G. A. Voth, Biophys. J. 80, 1691
�2001�.21 S. S. Iyengar, J. Chem. Phys. 126, 216101 �2007�.22 S. S. Iyengar, M. K. Petersen, T. J. F. Day, C. J. Burnham, V. E. Teige,
and G. A. Voth, J. Chem. Phys. 123, 084309 �2005�.23 C.-C. Wu, C.-K. Lin, H.-C. Chang, J.-C. Jiang, J.-L. Kuo, and M. L.
Klein, J. Chem. Phys. 122, 074315 �2005�.24 S. S. Iyengar, T. J. F. Day, and G. A. Voth, Int. J. Mass. Spectrom. 241,
197 �2005�.25 X. Li, V. E. Teige, and S. S. Iyengar, J. Phys. Chem. A 111, 4815 �2007�.26 S. S. Iyengar, J. Chem. Phys. 123, 084310 �2005�.27 O. Vendrell, F. Gatti, and H.-D. Meyer, Angew. Chem., Int. Ed. 46, 6918
�2007�.28 M. Kaledin, A. L. Kaledin, and J. M. Bowman, J. Phys. Chem. A 110,
2922 �2006�.29 A. B. McCoy, X. Huang, S. Carter, and J. M. Bowman, J. Chem. Phys.
123, 064317 2005�.30 J. M. Headrick, E. G. Diken, R. S. Walters, N. I. Hammer, R. A. Christie,
TABLE IX. Notation of harmonic modes used in the decomposition of dynamically averaged spectra.
Mode Demonstration
HP⊥1547 proton perpendicular
HP�+CH3S−scissor
1555 Proton diagonal motion and symmetric scissorin the two C-O-C backbone methyl groups
HS−CHstretch
3163 in-phase C-H stretch in the two methyl groupson the C-O-C backbone
HA−CHstretch
3166 out-of-phase C-H stretch in the two methylgroups on the C-O-C backbone
HCHstretch
3192 C-H stretch
HCHstretch
3192 C-H stretch
184308-15 AIMD simulations of action spectra: Dimethyl ether dimer J. Chem. Phys. 128, 184308 �2008�
Author complimentary copy. Redistribution subject to AIP license or copyright, see http://jcp.aip.org/jcp/copyright.jsp
J. Cui, E. M. Myshakin, M. A. Duncan, M. A. Johnson, and K. Jordan,Science 308, 1765 �2005�.
31 M. M. Teeter, Proc. Natl. Acad. Sci. U.S.A. 81, 6014 �1984�.32 S. Neidle, H. M. Berman, and H. S. Shieh, Nature �London� 288, 129
�1980�.33 L. A. Lipscomb, M. E. Peek, F. X. Zhou, J. A. Bertrand, D. Van Derveer,
and L. D. Williams, Biochemistry 33, 3649 �1994�.34 W. W. Cleland and M. M. Kreevoy, Science 264, 1887 �1994�.35 A. Warshel, A. Papazyan, and P. A. Kollman, Science 269, 102 �1995�.36 V. E. Bondybey and M. K. Beyer, Int. Rev. Phys. Chem. 21, 277 �2002�.37 S. M. Haile, D. A. Boysen, C. R. I. Chisholm, and R. B. Merle, Nature
�London� 410, 910 �2001�.38 M. Iannuzzi and M. Parrinello, Phys. Rev. Lett. 93, 025901 �2004�.39 M. J. McEwan and L. F. Phillips, Chemistry of the Atmosphere �Eward
Arnold, London, 1975�.40 B. J. Gertner and J. T. Hynes, Science 271, 1563 �1996�.41 J. P. Devlin, N. Uras, J. Sadlej, and V. Buch, Nature �London� 417, 269
�2002�.42 J. S. Aloisio and S. Francisco, Acc. Chem. Res. 33, 825 �2000�.43 M. K. Petersen, S. S. Iyengar, T. J. F. Day, and G. A. Voth, J. Phys.
Chem. B 108, 14804 �2004�.44 D. Marx, M. E. Tuckerman, J. Hutter, and M. Parrinello, Nature
�London� 397, 601 �1999�.45 M. E. Tuckerman, D. Marx, and M. Parrinello, Nature �London� 417,
925 �2002�.46 D. Asthagiri, L. R. Pratt, J. D. Kress, and M. A. Gomez, Proc. Natl. Acad.
Sci. U.S.A. 101, 7229 �2004�.47 J. J. Valle, J. R. Eyler, J. Oomens, D. T. Moore, A. F. G. van der Meer, G.
von Helden, G. Meijer, C. L. Hendrickson, A. G. Marshall, and G. T.Blakney, Rev. Sci. Instrum. 76, 023103 �2005�.
48 M. F. Bush, M. W. Forbes, R. A. Jockusch, J. Oomens, N. C. Polfer, R.Saykally, and E. Williams, J. Phys. Chem. A 111, 7753 �2007�.
49 N. L. Pivonka, C. Kaposta, M. Brummer, G. von Helden, G. Meijer, L.Woste, D. M. Neumark, and K. R. Asmis, J. Chem. Phys. 118, 5275�2003�.
50 T. D. Fridgen, P. MacAleese, L. Maitre, T. B. McMahon, P. Boissel, andJ. Lemaire, Phys. Chem. Chem. Phys. 7, 2747 �2005�.
51 M. E. Tuckerman, K. Laasonen, M. Sprik, and M. Parrinello, J. Phys.Chem. 99, 5749 �1995�.
52 W. H. Robertson, E. G. Diken, E. A. Price, J.-W. Shin, and M. A.Johnson, Science 299, 1367 �2003�.
53 E. G. Diken, J. M. Headrick, J. R. Roscioli, J. C. Bopp, M. A. Johnson,A. B. McCoy, X. Huang, S. Carter, and J. M. Bowman, J. Phys. Chem. A109, 571 �2005�.
54 J. Roscioli, E. Diken, M. Johnson, S. Horvath, and A. McCoy, J. Phys.Chem. A 110, 4943 �2006�.
55 C. Swalina and S. Hammes-Schiffer, J. Phys. Chem. A 109, 10410�2005�.
56 I. Sumner and S. S. Iyengar, J. Phys. Chem. A 111, 10313 �2007�.57 J. M. Bowman, Acc. Chem. Res. 19, 202 �1986�.58 R. B. Gerber and M. A. Ratner, J. Chem. Phys. 70, 97 �1988�.59 J. O. Jung and R. B. Gerber, J. Chem. Phys. 105, 10332 �1996�.60 N. Matsunaga, G. M. Chaban, and R. B. Gerber, J. Chem. Phys. 117,
3541 �2002�.
61 J. H. Skone, M. V. Pak, and S. Hammes-Schiffer, J. Chem. Phys. 123,134108 �2005�.
62 B. G. Levine and T. J. Martinez, Annu. Rev. Phys. Chem. 58, 613�2007�.
63 S. S. Iyengar, X. Li, and I. Sumner, Adv. Quantum Chem. 55 �2008�.64 I. S. Y. Wang and M. Karplus, J. Am. Chem. Soc. 95, 8160 �1973�.65 C. Leforestier, J. Chem. Phys. 68, 4406 �1978�.66 K. Bolton, W. L. Hase, and G. H. Peslherbe, Modern Methods for
Multidimensional Dynamics Computation in Chemistry �World Scientific,Singapore, 1998�, p. 143.
67 M. C. Payne, M. P. Teter, D. C. Allan, T. A. Arias, and J. D.Joannopoulos, Rev. Mod. Phys. 64, 1045 �1992�.
68 H. B. Schlegel, J. M. Millam, S. S. Iyengar, G. A. Voth, A. D. Daniels, G.E. Scuseria, and M. J. Frisch, J. Chem. Phys. 114, 9758 �2001�.
69 S. S. Iyengar, H. B. Schlegel, J. M. Millam, G. A. Voth, G. E. Scuseria,and M. J. Frisch, J. Chem. Phys. 115, 10291 �2001�.
70 H. B. Schlegel, S. S. Iyengar, X. Li, J. M. Millam, G. A. Voth, G. E.Scuseria, and M. J. Frisch, J. Chem. Phys. 117, 8694 �2002�.
71 S. S. Iyengar, H. B. Schlegel, G. A. Voth, J. M. Millam, G. E. Scuseria,and M. J. Frisch, Isr. J. Chem. 42, 191 �2002�.
72 S. S. Iyengar and M. J. Frisch, J. Chem. Phys. 121, 5061 �2004�.73 M. J. Frisch, G. W. Trucks, H. B. Schlegel et al., GAUSSIAN 03, Revision
b.02, Gaussian, Inc., Pittsburgh, PA, 2003.74 D. Svozil and P. Jungwirth, J. Phys. Chem. A 110, 9194 �2006�.75 S. Sadhukhan, D. Munoz, C. Adamo, and G. E. Scuseria, Chem. Phys.
Lett. 306, 83 �1999�.76 W. H. Press, S. A. Teukolsky, W. T. Vetterling, and B. P. Flannery, Nu-
merical Recipes in C �Cambridge University Press, New York, 1992�.77 S. S. Iyengar and J. Jakowski, J. Chem. Phys. 122, 114105 �2005�.78 S. S. Iyengar, Theor. Chem. Acc. 116, 326 �2006�.79 D. K. Hoffman, N. Nayar, O. A. Sharafeddin, and D. J. Kouri, J. Phys.
Chem. 95, 8299 �1991�.80 D. J. Kouri, Y. Huang, and D. K. Hoffman, Phys. Rev. Lett. 75, 49
�1995�.81 J. Jakowski, I. Sumner, and S. S. Iyengar, J. Chem. Theory Comput. 2,
1203 �2006�.82 D. C. Sorensen, SIAM J. Matrix Anal. Appl. 13, 357 �1992�.83 G. H. Golub and C. F. van Loan, Matrix Computations �The Johns
Hopkins University Press, Baltimore, 1996�.84 B. N. Parlett and Y. Saad, Linear Algebr. Appl. 88/89, 575 �1987�.85 In Ref. 10, the following steps were involved in formation of the proton
bound diether. First, methyl ether was ionized through electron impact.The ion population is rapidly �within a milliseconds� transferred to pro-tonated methyl ether monomer by ion-molecule reactions, which is thenconverted to the ether dimer through addition of a second pulse of methylether vapor to the trap. Spontaneous, dark dissociation of the dimers isthen utilized to monitor “temperature.” The spontaneous dissociation�smoothly� decays below measurable values within a matter of seconds,which is an indication that the ions had reached �radiative� thermal equi-librium with the blackbody radiation from the �room temperature�vacuum chamber.
86 A. Kohen, R. Cannio, S. Bartolucci, and J. P. Klinman, Nature �London�399, 496 �1999�.
184308-16 Li, Moore, and Iyengar J. Chem. Phys. 128, 184308 �2008�
Author complimentary copy. Redistribution subject to AIP license or copyright, see http://jcp.aip.org/jcp/copyright.jsp


![Interpretation of MS/MS Spectra of Small MoleculesSpectra of Pirimicarb 15 eV 30 eV 25 eV 20 eV C11H19N4O2 239 182 72 Circled ions - odd or even electron ions? [M+H]+and fragments](https://static.fdocuments.net/doc/165x107/5f1ab6d0353ae876f23e973a/interpretation-of-msms-spectra-of-small-molecules-spectra-of-pirimicarb-15-ev-30.jpg)
![IRMPD U -S C - Duquesne University · IRMPD brings the system to the final state of free UO 2 + (Fig. 4g). Curiously, we do not observe [UO 2 (dmso) 1]2+ (m/z = 174) in this sequence.](https://static.fdocuments.net/doc/165x107/5f0a7d5e7e708231d42be394/irmpd-u-s-c-duquesne-university-irmpd-brings-the-system-to-the-final-state-of.jpg)