Insight Brief: Security Analytics to Identify the 12 Indicators of Compromise
10
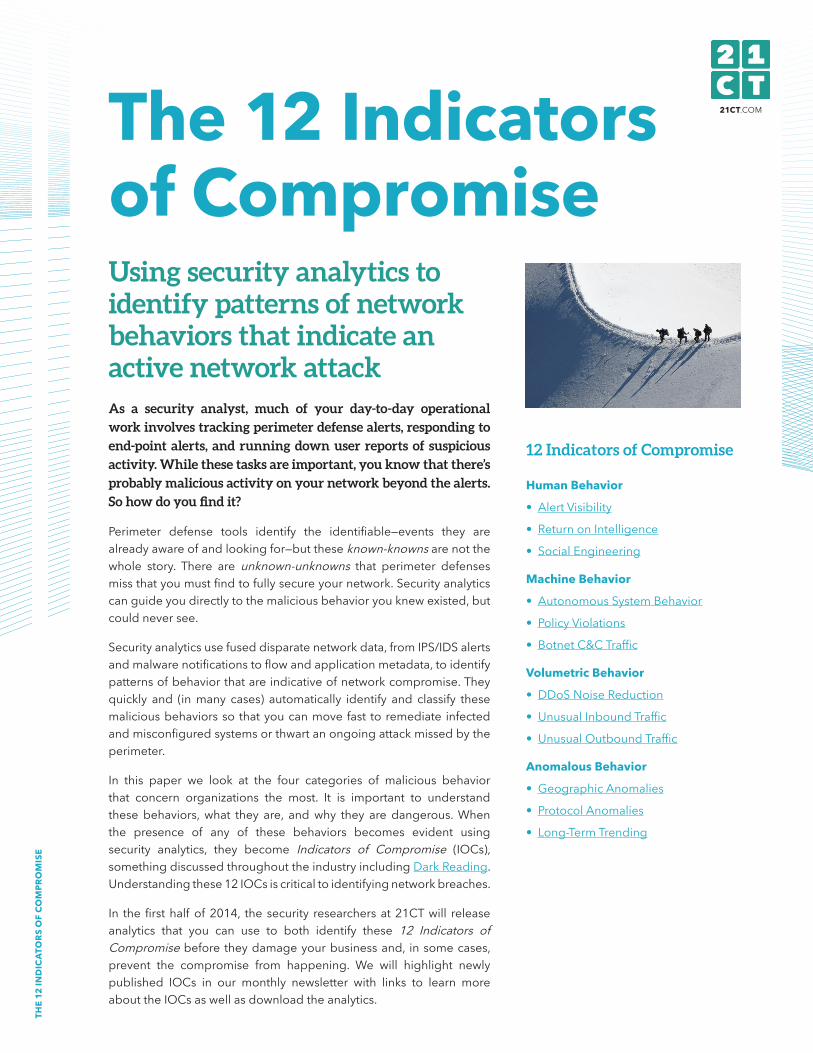
THE 12 INDICATORS OF COMPROMISE 12 Indicators of Compromise Human Behavior • Alert Visibility • Return on Intelligence • Social Engineering Machine Behavior • Autonomous System Behavior • Policy Violations • Botnet C&C Traffic Volumetric Behavior • DDoS Noise Reduction • Unusual Inbound Traffic • Unusual Outbound Traffic Anomalous Behavior • Geographic Anomalies • Protocol Anomalies • Long-Term Trending 21CT.COM Using security analytics to identify patterns of network behaviors that indicate an active network attack As a security analyst, much of your day-to-day operational work involves tracking perimeter defense alerts, responding to end-point alerts, and running down user reports of suspicious activity. While these tasks are important, you know that there’s probably malicious activity on your network beyond the alerts. So how do you find it? Perimeter defense tools identify the identifiable—events they are already aware of and looking for—but these known-knowns are not the whole story. There are unknown-unknowns that perimeter defenses miss that you must find to fully secure your network. Security analytics can guide you directly to the malicious behavior you knew existed, but could never see. Security analytics use fused disparate network data, from IPS/IDS alerts and malware notifications to flow and application metadata, to identify patterns of behavior that are indicative of network compromise. They quickly and (in many cases) automatically identify and classify these malicious behaviors so that you can move fast to remediate infected and misconfigured systems or thwart an ongoing attack missed by the perimeter. In this paper we look at the four categories of malicious behavior that concern organizations the most. It is important to understand these behaviors, what they are, and why they are dangerous. When the presence of any of these behaviors becomes evident using security analytics, they become Indicators of Compromise (IOCs), something discussed throughout the industry including Dark Reading. Understanding these 12 IOCs is critical to identifying network breaches. In the first half of 2014, the security researchers at 21CT will release analytics that you can use to both identify these 12 Indicators of Compromise before they damage your business and, in some cases, prevent the compromise from happening. We will highlight newly published IOCs in our monthly newsletter with links to learn more about the IOCs as well as download the analytics. The 12 Indicators of Compromise
-
Upload
21ct-inc -
Category
Technology
-
view
101 -
download
0
Transcript of Insight Brief: Security Analytics to Identify the 12 Indicators of Compromise
THE
12 IN
DIC
ATO
RS O
F CO
MPR
OM
ISE
12 Indicators of Compromise
Human Behavior
• AlertVisibility
• ReturnonIntelligence
• SocialEngineering
Machine Behavior
• AutonomousSystemBehavior
• PolicyViolations
• BotnetC&CTraffic
Volumetric Behavior
• DDoSNoiseReduction
• UnusualInboundTraffic
• UnusualOutboundTraffic
Anomalous Behavior
• GeographicAnomalies
• ProtocolAnomalies
• Long-TermTrending
21CT.COM
Using security analytics to identify patterns of network behaviors that indicate an active network attackAs a security analyst, much of your day-to-day operational
work involves tracking perimeter defense alerts, responding to
end-point alerts, and running down user reports of suspicious
activity. While these tasks are important, you know that there’s
probably malicious activity on your network beyond the alerts.
So how do you find it?
Perimeter defense tools identify the identifiable—events they arealreadyawareofandlookingfor—buttheseknown-knownsarenotthewhole story. There are unknown-unknowns that perimeter defensesmissthatyoumustfindtofullysecureyournetwork.Securityanalyticscanguideyoudirectlytothemaliciousbehavioryouknewexisted,butcouldneversee.
Securityanalyticsusefuseddisparatenetworkdata,fromIPS/IDSalertsandmalwarenotificationstoflowandapplicationmetadata,toidentifypatternsofbehaviorthatareindicativeofnetworkcompromise.Theyquickly and (inmany cases) automatically identify and classify thesemaliciousbehaviorsso thatyoucanmove fast toremediate infectedandmisconfiguredsystemsorthwartanongoingattackmissedbytheperimeter.
In this paper we look at the four categories of malicious behaviorthat concern organizations the most. It is important to understandthese behaviors,what they are, andwhy they are dangerous.Whenthe presence of any of these behaviors becomes evident usingsecurity analytics, they become Indicators of Compromise (IOCs),somethingdiscussedthroughouttheindustryincludingDarkReading.Understandingthese12IOCsiscriticaltoidentifyingnetworkbreaches.
In thefirsthalfof2014, thesecurity researchersat21CTwill releaseanalytics that you can use to both identify these 12 Indicators ofCompromisebeforetheydamageyourbusinessand, insomecases,prevent the compromise from happening. We will highlight newlypublished IOCs in our monthly newsletter with links to learn moreabouttheIOCsaswellasdownloadtheanalytics.
The 12 Indicators of Compromise
THE
12 IN
DIC
ATO
RS O
F CO
MPR
OM
ISE
Human BehaviorHumanbehaviorasusedhere includesknown-knownandsocialengineeringbehaviors.The known-knowns provide context and visualization around perimeter defense alertsandthreatfeedblacklists,whilesocialengineeringIOCsidentifypatternsofbehaviorthatdeviatefromhumannorms,indicatingpotentialpointsofexploitation.
Alert Visibility
Why Alert Visibility?
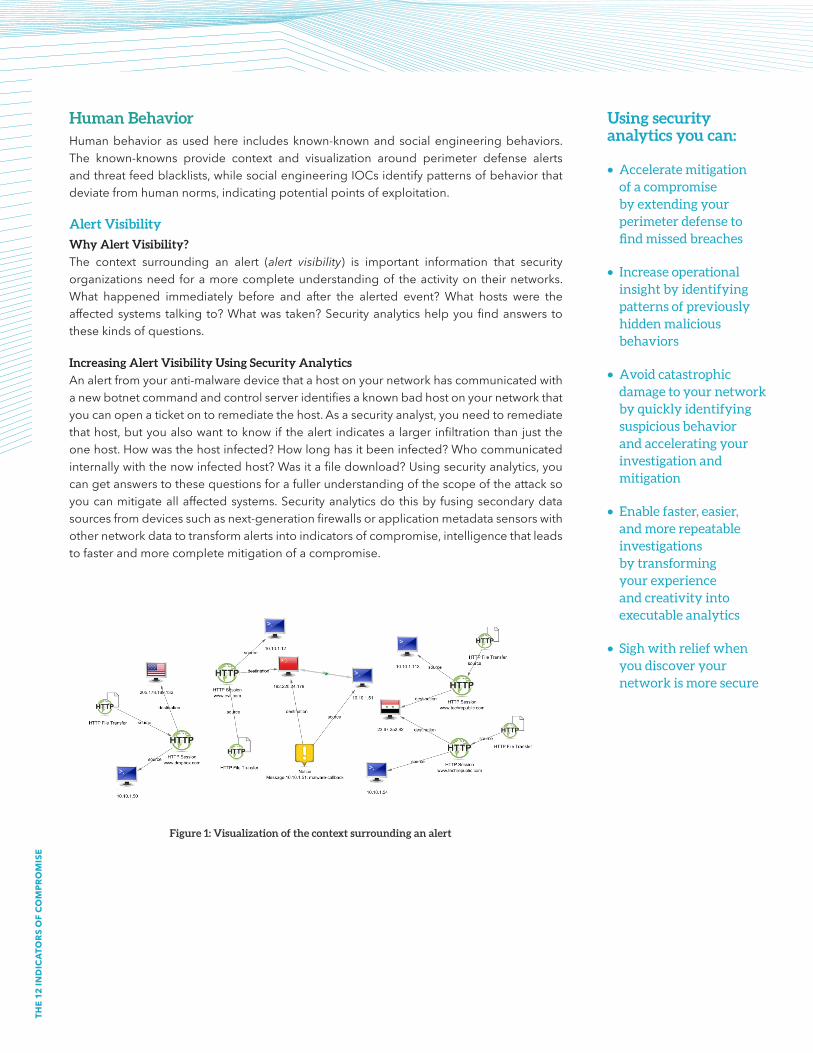
The context surrounding an alert (alert visibility) is important information that securityorganizationsneed foramorecompleteunderstandingof theactivityon theirnetworks.What happened immediately before and after the alerted event?What hosts were theaffectedsystems talking to?Whatwas taken?Securityanalyticshelpyoufindanswers tothesekindsofquestions.
Increasing Alert Visibility Using Security Analytics
Analertfromyouranti-malwaredevicethatahostonyournetworkhascommunicatedwithanewbotnetcommandandcontrolserveridentifiesaknownbadhostonyournetworkthatyoucanopenaticketontoremediatethehost.Asasecurityanalyst,youneedtoremediatethathost,butyoualsowanttoknowifthealertindicatesalargerinfiltrationthanjusttheonehost.Howwasthehostinfected?Howlonghasitbeeninfected?Whocommunicatedinternallywiththenowinfectedhost?Wasitafiledownload?Usingsecurityanalytics,youcangetanswerstothesequestionsforafullerunderstandingofthescopeoftheattacksoyoucanmitigateallaffectedsystems.Securityanalyticsdothisby fusingsecondarydatasourcesfromdevicessuchasnext-generationfirewallsorapplicationmetadatasensorswithothernetworkdatatotransformalertsintoindicatorsofcompromise,intelligencethatleadstofasterandmorecompletemitigationofacompromise.
Using security analytics you can:
• Acceleratemitigationofacompromisebyextendingyourperimeterdefensetofindmissedbreaches
• Increaseoperationalinsightbyidentifyingpatternsofpreviouslyhiddenmaliciousbehaviors
• Avoidcatastrophicdamagetoyournetworkbyquicklyidentifyingsuspiciousbehaviorandacceleratingyourinvestigationandmitigation
• Enablefaster,easier,andmorerepeatableinvestigationsbytransformingyourexperienceandcreativityintoexecutableanalytics
• Sighwithreliefwhenyoudiscoveryournetworkismoresecure
Figure 1: Visualization of the context surrounding an alert

THE
12 IN
DIC
ATO
RS O
F CO
MPR
OM
ISE
Return on Intelligence
Why Return on Intelligence?
Mostsecurityorganizationssubscribetovariousthreatfeedsthatdelivermonthly,weekly,orevendailyupdatesonknownbaddomains,IPaddresses,MD5sums,oremailaddresses.Thesethreatfeedsareapotentiallyrichsourceofintelligence,butgainingoperationalvaluefromthemisoftendifficultandtime-consuming.Theirvaryingformatsarenoteasilymanipulatedorsearchable,andyoucan’tscanthroughthemandquicklyunderstandwhatisimportanttoyouandyourorganization.Withsecurityanalyticsyoucanleveragethefullbenefitofthispowerfulintelligencetogainvisibilityintotheunknown-unknowns.
Enhancing Return on Intelligence Using Security Analytics
OnewaytoutilizetheinformationinthreatfeedswouldbetakeatextdumpofNetFlowrecordsandwriteashellscripttogrepthetextfileforblacklistedIPsthathavebeencommunicatedwith.AnotherwaywouldbetogrepBrosensorlogsfortheMD5sthatmaycomeinfromathreatfeed.However,withattackerscontinuallychangingIPaddresses,even if youcanutilize the information in the threat feed,youstillwon’tdiscoveradditional instancesofanattackfromIPaddressesnotyetknowntobebad.Securityanalyticsprovidethecontextyouneedtotrulyunderstandthebehaviorofyournetwork.Withsecurityanalyticsandthreatfeedsyoucan:
• IdentifyconnectionsbetweeninternalhostsandknownbadexternalIPaddresses
• IdentifyadditionalhoststhatdownloadedthesamefileasthoseconnectingtotheknownbadIPaddresses
• IdentifyadditionalIPaddressesnowknowntobebad
• Reducetime-to-detectionandmitigationbyutilizingtheintelligenceyoucareaboutinthethreatfeed
Withaneasyway togainactionable intelligence from the threat feedsyoualready subscribe to, yousignificantlyimprovetheirvalueandcannowenhanceyoursecuritypostureevenmorebysubscribingtoadditionalthreatfeeds.
Social Engineering
Why Social Engineering?
AccordingtoVerizon’s2013DataBreachInvestigationsReport,nearlyathirdofallbreachesin2012involvedsocialengineering.Andbecausesocialengineeringoftenusescommonlow-techmethodslikeemailsandphonecalls,theseattackscanbesomeofthemostdifficulttoprotectagainst.Humansarenaturallytrustingofeachother,especiallywhentheappropriatecontextexists.Thatsaid,evensocialengineeringleavestracesinyournetworkthatyoucanidentifyusingsecurityanalytics.
Mitigating the Effects of Social Engineering Using Security Analytics
Anemployeereceivesaphonecallfromamaliciousactorwhowarnsofacomputercompromiserequiringimmediateactioninordertopreventcatastrophe.Whilethephonecallisinprogress,atthedirectionofthecaller,theemployeevisitsawebsitethathasneverbeenaccessedbyanyoneinthecorporatenetworkanddownloadsamalware-infectedPDFwiththepricingofthephantomservicesthescammeristryingtosell.
Sincethisphonecallcameintoanofficedeskphone,youhaveaccesstotheSIPlogsandcanseethattheemployeeansweredthephonecall.Thathosthasnowbeencompromised.Usingsecurityanalytics,youcanidentifyapatternoftheattack:anincomingphonenumber(andrelatedinformationsuchasgeographiclocation),anMD5sumofthePDFfile,andthewebdomainwherethedownloadoccurred.Youcanthenusethispatterntosearchforsimilaractivityelsewhereonthenetwork.Inseconds,youcanidentifythethreatandtakestepstomitigateitbysettingupalerts,blockingdomainsandphonenumbers,and—importantly—creatinganalerttoflagtheMD5sumeveniftheattackerchangesphonenumbersanddomains.Furthermore,youcannotifyemployeesoftheattackpatterntomitigatethefront-end risk vector: the human.Using security analytics, you canquicklymitigate the effects of thebreach andincreaseyourdefenseagainstthesameattackinthefuture...orsighwithreliefwhenyoudiscoverthatitwasaone-offattempt.
THE
12 IN
DIC
ATO
RS O
F CO
MPR
OM
ISE
Machine BehaviorMachinebehaviorencompassesallthenetworktrafficandactivityautomaticallygeneratedbyacomputerbeyondtheuser’scontrolorthatviolatescorporatepolicywhetherexplicitorimplied.
Autonomous System Behavior
Why Autonomous System Behavior?
IntheHumanBehaviorcategory,wediscussednetworkactivitytriggeredbysomeexplicithumanaction(byeithertheattackeroranunsuspectingemployee).Butcomputersalsodothingsautonomouslybehindthesceneswithoutexplicituserinteractionsuchasemailretrieval,instantmessagingalerts,andOSupdates.Whileautonomoussystembehaviorisessentialtoauser’snormalday-to-dayactivity, itcanalsomaskpotentiallymaliciousbehavior.Withsecurityanalyticsyoucanquicklyfilteroutnormal autonomous systembehavior tohelp you zero inon the abnormalbehavior thatmay indicate a compromise, soremediationisquickerandmorecomplete.
Identifying Autonomous System Behavior Using Security Analytics
Whenemployeesarriveatworkandturnontheircomputers,aflurryofnetworkconnectionsflowfromtheirmachinesastheydownloademailandsignontothecorporateinstantmessagingserver.AhandfulofHTTPrequestsmaythengooutasemployeespulluptheirpersonalemailorcheckindustrynewssites.Theymayalsolaunchbusinessapplicationslikerevisioncontrolrepositories,financialapplications,orotherdatabases.
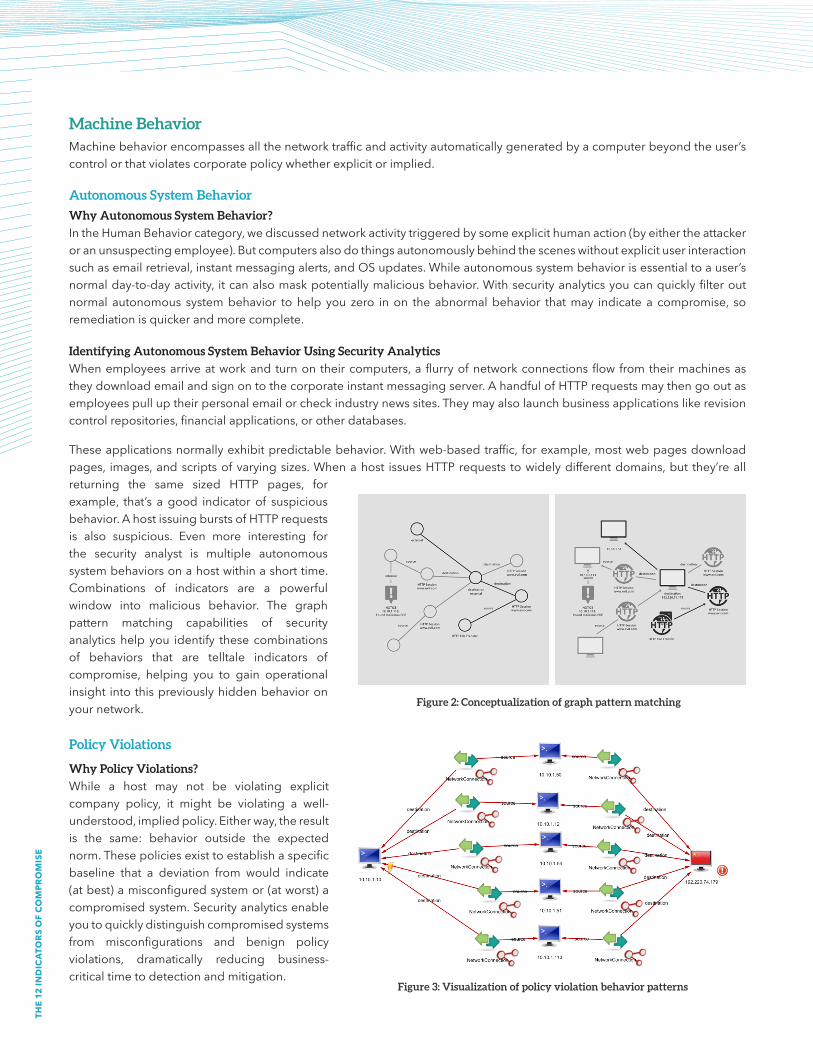
Theseapplicationsnormallyexhibitpredictablebehavior.Withweb-basedtraffic, forexample,mostwebpagesdownloadpages, images,andscriptsofvaryingsizes.Whenahost issuesHTTPrequests towidelydifferentdomains,but they’reallreturning the same sized HTTP pages, forexample, that’s agood indicator of suspiciousbehavior.AhostissuingburstsofHTTPrequestsis also suspicious. Even more interesting forthe security analyst is multiple autonomoussystembehaviorsonahostwithinashorttime.Combinations of indicators are a powerfulwindow into malicious behavior. The graphpattern matching capabilities of securityanalyticshelp you identify these combinationsof behaviors that are telltale indicators ofcompromise, helping you to gain operationalinsight intothispreviouslyhiddenbehavioronyournetwork.
Policy Violations
Why Policy Violations?
While a host may not be violating explicitcompany policy, it might be violating a well-understood,impliedpolicy.Eitherway,theresultis the same: behavior outside the expectednorm.Thesepoliciesexisttoestablishaspecificbaseline that a deviation from would indicate(atbest)amisconfiguredsystemor(atworst)acompromisedsystem.Securityanalyticsenableyoutoquicklydistinguishcompromisedsystemsfrom misconfigurations and benign policyviolations, dramatically reducing business-criticaltimetodetectionandmitigation.
Figure 2: Conceptualization of graph pattern matching
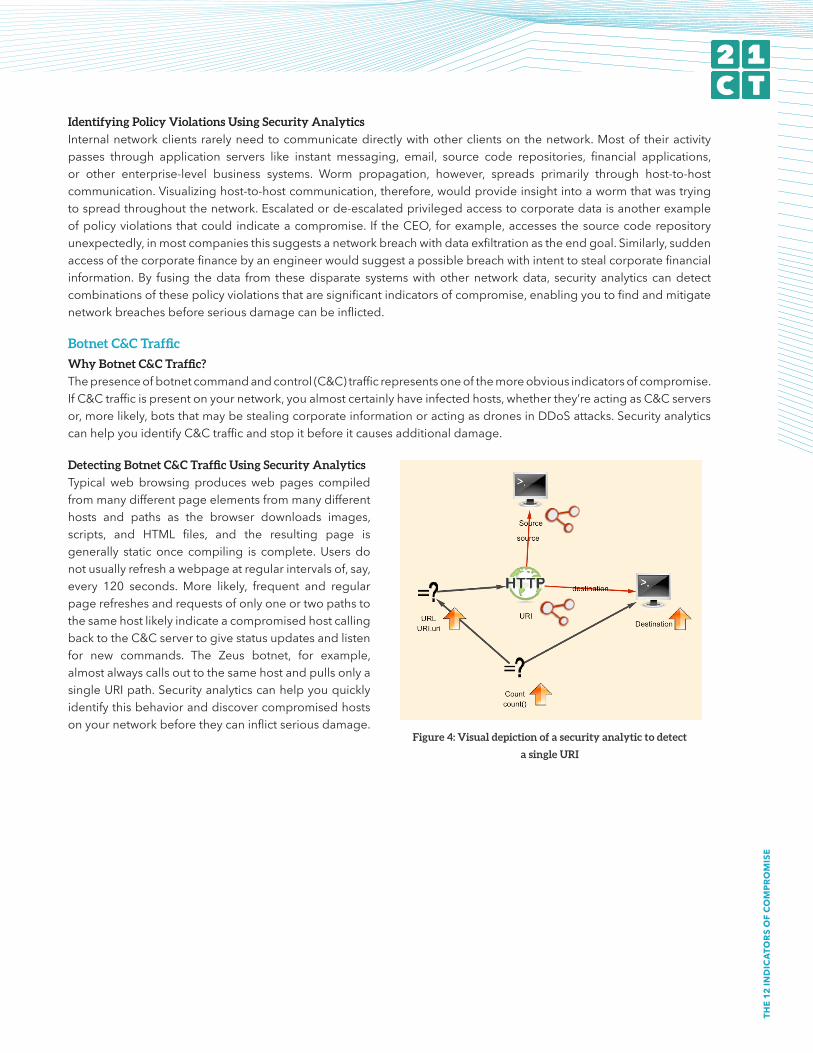
Figure 3: Visualization of policy violation behavior patterns
THE
12 IN
DIC
ATO
RS O
F CO
MPR
OM
ISE
Identifying Policy Violations Using Security Analytics
Internalnetworkclientsrarelyneedtocommunicatedirectlywithotherclientsonthenetwork.Mostof theiractivitypasses through application servers like instant messaging, email, source code repositories, financial applications,or other enterprise-level business systems. Worm propagation, however, spreads primarily through host-to-hostcommunication.Visualizinghost-to-hostcommunication,therefore,wouldprovideinsightintoawormthatwastryingtospreadthroughoutthenetwork.Escalatedorde-escalatedprivilegedaccesstocorporatedataisanotherexampleofpolicyviolationsthatcould indicateacompromise. If theCEO, forexample,accessesthesourcecoderepositoryunexpectedly,inmostcompaniesthissuggestsanetworkbreachwithdataexfiltrationastheendgoal.Similarly,suddenaccessofthecorporatefinancebyanengineerwouldsuggestapossiblebreachwithintenttostealcorporatefinancialinformation.By fusing thedata from thesedisparate systemswithothernetworkdata, security analytics candetectcombinationsofthesepolicyviolationsthataresignificantindicatorsofcompromise,enablingyoutofindandmitigatenetworkbreachesbeforeseriousdamagecanbeinflicted.
Botnet C&C Traffic
Why Botnet C&C Traffic?
Thepresenceofbotnetcommandandcontrol(C&C)trafficrepresentsoneofthemoreobviousindicatorsofcompromise.IfC&Ctrafficispresentonyournetwork,youalmostcertainlyhaveinfectedhosts,whetherthey’reactingasC&Cserversor,morelikely,botsthatmaybestealingcorporateinformationoractingasdronesinDDoSattacks.SecurityanalyticscanhelpyouidentifyC&Ctrafficandstopitbeforeitcausesadditionaldamage.
Detecting Botnet C&C Traffic Using Security Analytics
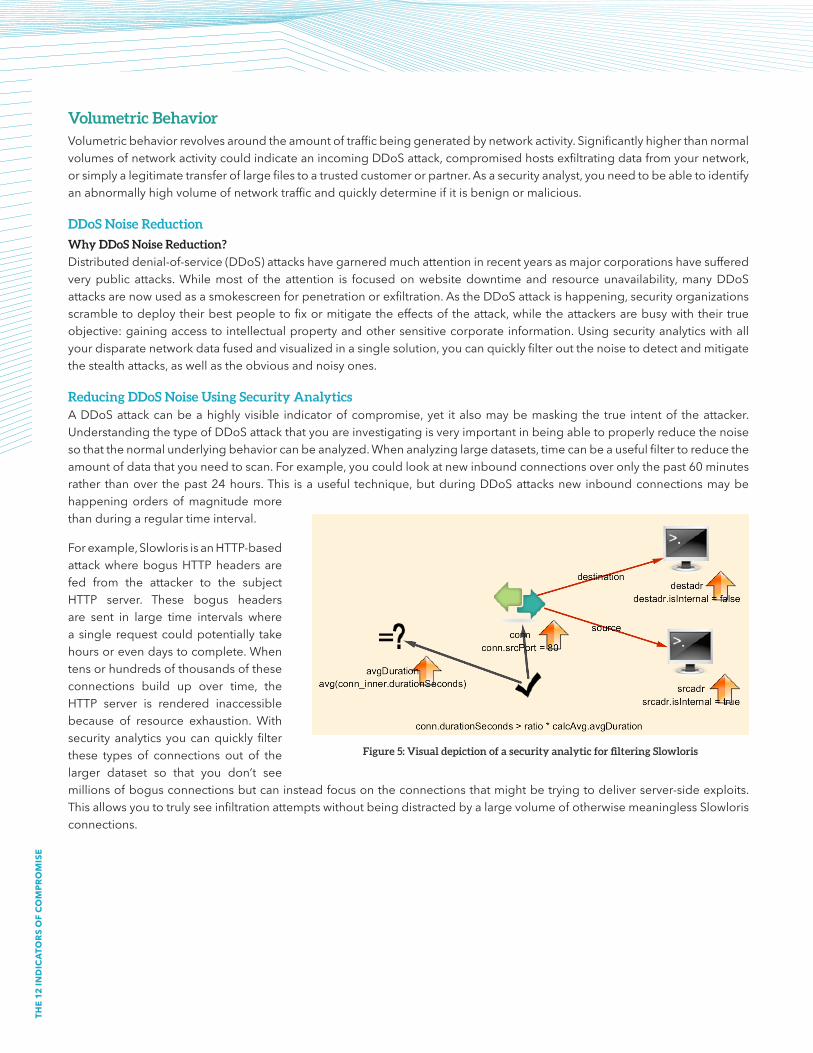
Typical web browsing producesweb pages compiledfrommanydifferentpageelementsfrommanydifferenthosts and paths as the browser downloads images,scripts, and HTML files, and the resulting page isgenerally static once compiling is complete.Users donotusuallyrefreshawebpageatregularintervalsof,say,every 120 seconds. More likely, frequent and regularpagerefreshesandrequestsofonlyoneortwopathstothesamehostlikelyindicateacompromisedhostcallingbacktotheC&Cservertogivestatusupdatesandlistenfor new commands. The Zeus botnet, for example,almostalwayscallsouttothesamehostandpullsonlyasingleURIpath.Securityanalyticscanhelpyouquicklyidentifythisbehavioranddiscovercompromisedhostsonyournetworkbeforetheycaninflictseriousdamage.
Figure 4: Visual depiction of a security analytic to detect
a single URI
THE
12 IN
DIC
ATO
RS O
F CO
MPR
OM
ISE
Volumetric BehaviorVolumetricbehaviorrevolvesaroundtheamountoftrafficbeinggeneratedbynetworkactivity.SignificantlyhigherthannormalvolumesofnetworkactivitycouldindicateanincomingDDoSattack,compromisedhostsexfiltratingdatafromyournetwork,orsimplyalegitimatetransferoflargefilestoatrustedcustomerorpartner.Asasecurityanalyst,youneedtobeabletoidentifyanabnormallyhighvolumeofnetworktrafficandquicklydetermineifitisbenignormalicious.
DDoS Noise Reduction
Why DDoS Noise Reduction?
Distributeddenial-of-service(DDoS)attackshavegarneredmuchattentioninrecentyearsasmajorcorporationshavesufferedverypublic attacks.Whilemost of the attention is focusedonwebsitedowntime and resource unavailability,manyDDoSattacksarenowusedasasmokescreenforpenetrationorexfiltration.AstheDDoSattackishappening,securityorganizationsscrambletodeploytheirbestpeopletofixormitigatetheeffectsoftheattack,whiletheattackersarebusywiththeirtrueobjective:gainingaccesstointellectualpropertyandothersensitivecorporateinformation.Usingsecurityanalyticswithallyourdisparatenetworkdatafusedandvisualizedinasinglesolution,youcanquicklyfilteroutthenoisetodetectandmitigatethestealthattacks,aswellastheobviousandnoisyones.
Reducing DDoS Noise Using Security AnalyticsADDoSattackcanbeahighlyvisible indicatorofcompromise,yet italsomaybemasking the true intentof theattacker.UnderstandingthetypeofDDoSattackthatyouareinvestigatingisveryimportantinbeingabletoproperlyreducethenoisesothatthenormalunderlyingbehaviorcanbeanalyzed.Whenanalyzinglargedatasets,timecanbeausefulfiltertoreducetheamountofdatathatyouneedtoscan.Forexample,youcouldlookatnewinboundconnectionsoveronlythepast60minutesrather thanover thepast24hours.This isauseful technique,butduringDDoSattacksnew inboundconnectionsmaybehappeningorders ofmagnitudemorethanduringaregulartimeinterval.
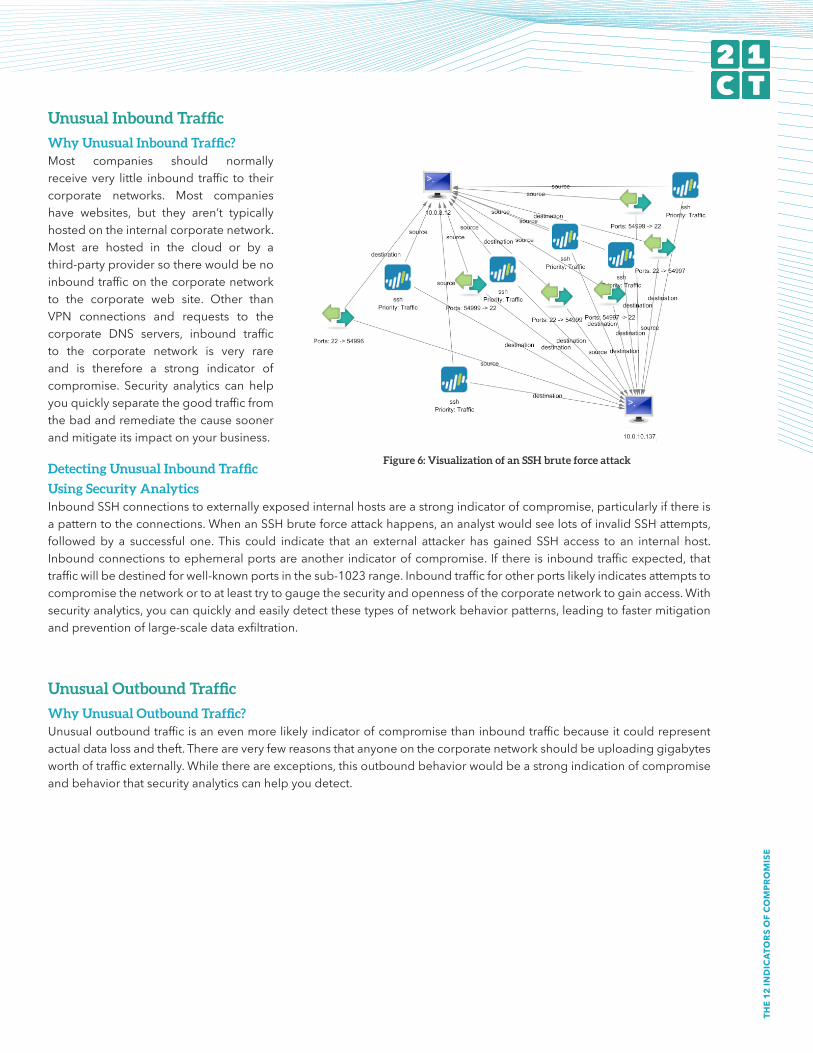
Forexample,SlowlorisisanHTTP-basedattackwherebogusHTTPheadersarefed from the attacker to the subjectHTTP server. These bogus headersare sent in large time intervals whereasingle requestcouldpotentially takehoursorevendaystocomplete.Whentensorhundredsofthousandsoftheseconnections build up over time, theHTTP server is rendered inaccessiblebecause of resource exhaustion. Withsecurity analytics youcanquicklyfilterthese types of connections out of thelarger dataset so that you don’t seemillionsofbogusconnectionsbutcaninsteadfocusontheconnectionsthatmightbetryingtodeliverserver-sideexploits.ThisallowsyoutotrulyseeinfiltrationattemptswithoutbeingdistractedbyalargevolumeofotherwisemeaninglessSlowlorisconnections.
Figure 5: Visual depiction of a security analytic for filtering Slowloris
THE
12 IN
DIC
ATO
RS O
F CO
MPR
OM
ISE
Unusual Inbound Traffic
Why Unusual Inbound Traffic?Most companies should normallyreceive very little inbound traffic to theircorporate networks. Most companieshave websites, but they aren’t typicallyhostedontheinternalcorporatenetwork.Most are hosted in the cloud or by athird-partyprovidersotherewouldbenoinboundtrafficonthecorporatenetworkto the corporate web site. Other thanVPN connections and requests to thecorporate DNS servers, inbound trafficto the corporate network is very rareand is therefore a strong indicator ofcompromise. Security analytics can helpyouquicklyseparatethegoodtrafficfromthebadandremediatethecausesoonerandmitigateitsimpactonyourbusiness.
Detecting Unusual Inbound Traffic
Using Security AnalyticsInboundSSHconnectionstoexternallyexposedinternalhostsareastrongindicatorofcompromise,particularlyifthereisapatterntotheconnections.WhenanSSHbruteforceattackhappens,ananalystwouldseelotsofinvalidSSHattempts,followedby a successful one.This could indicate that an external attacker has gained SSH access to an internal host.Inboundconnectionstoephemeralportsareanother indicatorofcompromise. If thereis inboundtrafficexpected,thattrafficwillbedestinedforwell-knownportsinthesub-1023range.Inboundtrafficforotherportslikelyindicatesattemptstocompromisethenetworkortoatleasttrytogaugethesecurityandopennessofthecorporatenetworktogainaccess.Withsecurityanalytics,youcanquicklyandeasilydetectthesetypesofnetworkbehaviorpatterns,leadingtofastermitigationandpreventionoflarge-scaledataexfiltration.
Unusual Outbound Traffic
Why Unusual Outbound Traffic?Unusualoutboundtrafficisanevenmorelikelyindicatorofcompromisethaninboundtrafficbecauseitcouldrepresentactualdatalossandtheft.Thereareveryfewreasonsthatanyoneonthecorporatenetworkshouldbeuploadinggigabytesworthoftrafficexternally.Whilethereareexceptions,thisoutboundbehaviorwouldbeastrongindicationofcompromiseandbehaviorthatsecurityanalyticscanhelpyoudetect.
Figure 6: Visualization of an SSH brute force attack
THE
12 IN
DIC
ATO
RS O
F CO
MPR
OM
ISE
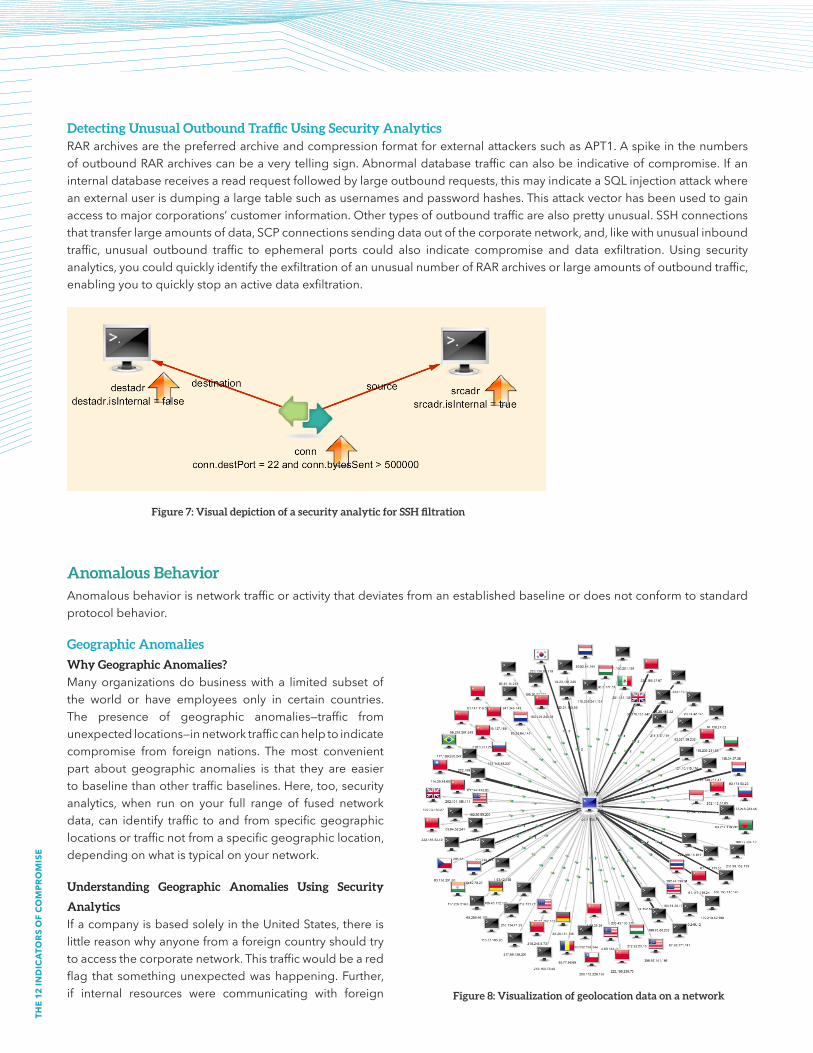
Detecting Unusual Outbound Traffic Using Security AnalyticsRARarchivesarethepreferredarchiveandcompressionformatforexternalattackerssuchasAPT1.AspikeinthenumbersofoutboundRARarchivescanbeaverytellingsign.Abnormaldatabasetrafficcanalsobeindicativeofcompromise.Ifaninternaldatabasereceivesareadrequestfollowedbylargeoutboundrequests,thismayindicateaSQLinjectionattackwhereanexternaluserisdumpingalargetablesuchasusernamesandpasswordhashes.Thisattackvectorhasbeenusedtogainaccesstomajorcorporations’customerinformation.Othertypesofoutboundtrafficarealsoprettyunusual.SSHconnectionsthattransferlargeamountsofdata,SCPconnectionssendingdataoutofthecorporatenetwork,and,likewithunusualinboundtraffic, unusual outbound traffic to ephemeral ports could also indicate compromise and data exfiltration. Using securityanalytics,youcouldquicklyidentifytheexfiltrationofanunusualnumberofRARarchivesorlargeamountsofoutboundtraffic,enablingyoutoquicklystopanactivedataexfiltration.
Anomalous BehaviorAnomalousbehaviorisnetworktrafficoractivitythatdeviatesfromanestablishedbaselineordoesnotconformtostandardprotocolbehavior.
Geographic Anomalies
Why Geographic Anomalies?
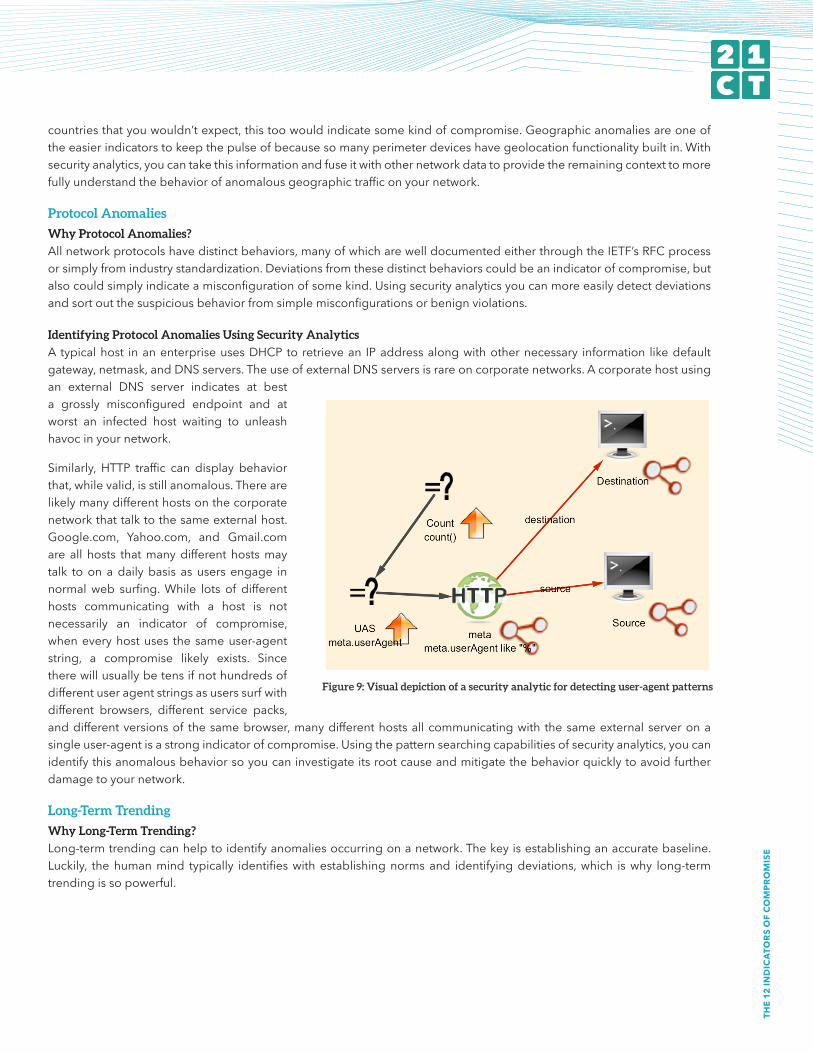
Manyorganizationsdobusinesswith a limited subsetofthe world or have employees only in certain countries.The presence of geographic anomalies—traffic fromunexpectedlocations—innetworktrafficcanhelptoindicatecompromise from foreign nations. The most convenientpart about geographic anomalies is that they are easiertobaselinethanothertrafficbaselines.Here,too,securityanalytics, when run on your full range of fused networkdata, can identify traffic to and from specificgeographiclocationsortrafficnotfromaspecificgeographiclocation,dependingonwhatistypicalonyournetwork.
Understanding Geographic Anomalies Using Security
Analytics
IfacompanyisbasedsolelyintheUnitedStates,thereislittlereasonwhyanyonefromaforeigncountryshouldtrytoaccessthecorporatenetwork.Thistrafficwouldbearedflag that somethingunexpectedwashappening.Further,if internal resources were communicating with foreign Figure 8: Visualization of geolocation data on a network
Figure 7: Visual depiction of a security analytic for SSH filtration
THE
12 IN
DIC
ATO
RS O
F CO
MPR
OM
ISE
countriesthatyouwouldn’texpect,thistoowouldindicatesomekindofcompromise.Geographicanomaliesareoneoftheeasierindicatorstokeepthepulseofbecausesomanyperimeterdeviceshavegeolocationfunctionalitybuiltin.Withsecurityanalytics,youcantakethisinformationandfuseitwithothernetworkdatatoprovidetheremainingcontexttomorefullyunderstandthebehaviorofanomalousgeographictrafficonyournetwork.
Protocol Anomalies
Why Protocol Anomalies?
Allnetworkprotocolshavedistinctbehaviors,manyofwhicharewelldocumentedeitherthroughtheIETF’sRFCprocessorsimplyfromindustrystandardization.Deviationsfromthesedistinctbehaviorscouldbeanindicatorofcompromise,butalsocouldsimplyindicateamisconfigurationofsomekind.Usingsecurityanalyticsyoucanmoreeasilydetectdeviationsandsortoutthesuspiciousbehaviorfromsimplemisconfigurationsorbenignviolations.
Identifying Protocol Anomalies Using Security Analytics
Atypicalhost inanenterpriseusesDHCP to retrievean IPaddressalongwithothernecessary information likedefaultgateway,netmask,andDNSservers.TheuseofexternalDNSserversisrareoncorporatenetworks.Acorporatehostusingan external DNS server indicates at besta grossly misconfigured endpoint and atworst an infected host waiting to unleashhavocinyournetwork.
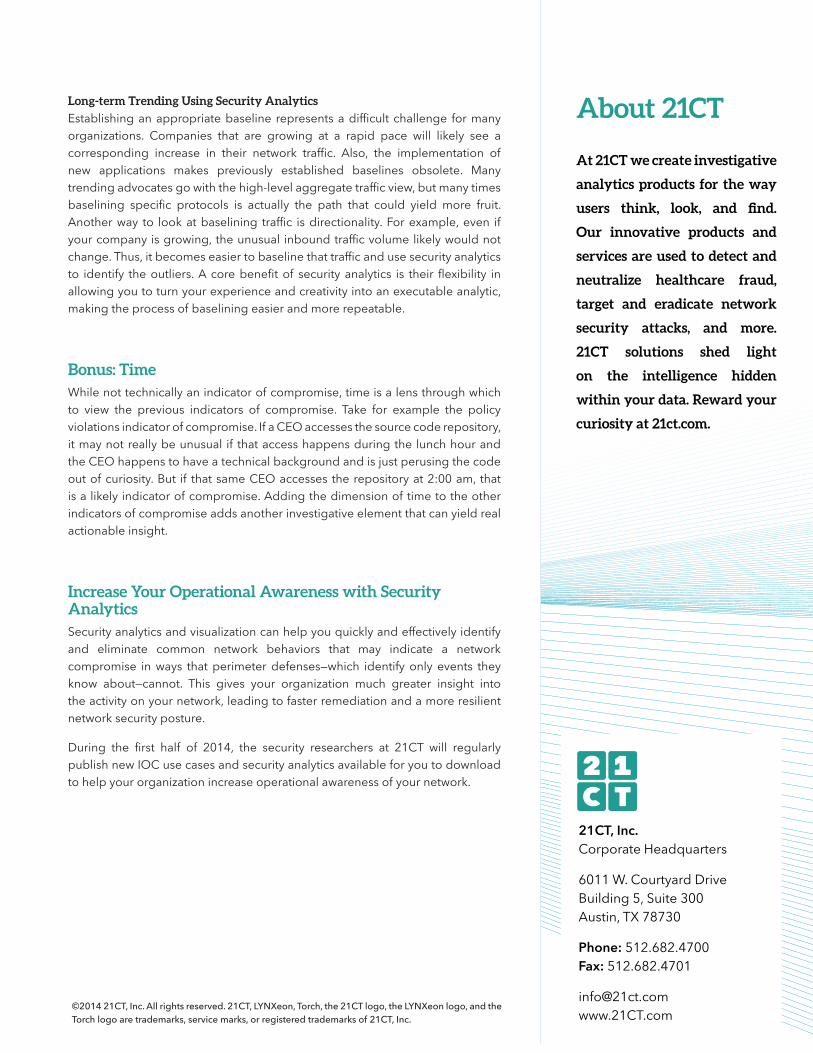
Similarly, HTTP traffic can display behaviorthat,whilevalid,isstillanomalous.Therearelikelymanydifferenthostsonthecorporatenetworkthattalktothesameexternalhost.Google.com, Yahoo.com, and Gmail.comare all hosts thatmanydifferent hostsmaytalk toon adailybasis as users engage innormalweb surfing.While lots of differenthosts communicating with a host is notnecessarily an indicator of compromise,wheneveryhostuses thesameuser-agentstring, a compromise likely exists. Sincetherewillusuallybetensifnothundredsofdifferentuseragentstringsasuserssurfwithdifferent browsers, different service packs,anddifferentversionsof thesamebrowser,manydifferenthostsallcommunicatingwith thesameexternalserveronasingleuser-agentisastrongindicatorofcompromise.Usingthepatternsearchingcapabilitiesofsecurityanalytics,youcanidentifythisanomalousbehaviorsoyoucaninvestigateitsrootcauseandmitigatethebehaviorquicklytoavoidfurtherdamagetoyournetwork.
Long-Term Trending
Why Long-Term Trending?
Long-termtrendingcanhelptoidentifyanomaliesoccurringonanetwork.Thekeyisestablishinganaccuratebaseline.Luckily, thehumanmind typically identifieswithestablishingnormsand identifyingdeviations,which iswhy long-termtrendingissopowerful.
Figure 9: Visual depiction of a security analytic for detecting user-agent patterns
About 21CT
At 21CT we create investigative
analytics products for the way
users think, look, and find.
Our innovative products and
services are used to detect and
neutralize healthcare fraud,
target and eradicate network
security attacks, and more.
21CT solutions shed light
on the intelligence hidden
within your data. Reward your
curiosity at 21ct.com.
©2014 21CT, Inc. All rights reserved. 21CT, LYNXeon, Torch, the 21CT logo, the LYNXeon logo, and the Torch logo are trademarks, service marks, or registered trademarks of 21CT, Inc.
21CT, Inc.Corporate Headquarters
6011 W. Courtyard Drive Building 5, Suite 300 Austin, TX 78730
Phone: 512.682.4700 Fax: 512.682.4701
[email protected] www.21CT.com
Long-term Trending Using Security Analytics
Establishinganappropriatebaseline representsadifficult challenge formanyorganizations. Companies that are growing at a rapid pace will likely see acorresponding increase in their network traffic. Also, the implementation ofnew applications makes previously established baselines obsolete. Manytrendingadvocatesgowiththehigh-levelaggregatetrafficview,butmanytimesbaselining specific protocols is actually the path that could yield more fruit.Anotherway to lookatbaselining traffic isdirectionality.Forexample,even ifyourcompanyisgrowing,theunusual inboundtrafficvolumelikelywouldnotchange.Thus,itbecomeseasiertobaselinethattrafficandusesecurityanalyticsto identify theoutliers.Acorebenefitof securityanalytics is theirflexibility inallowingyoutoturnyourexperienceandcreativityintoanexecutableanalytic,makingtheprocessofbaseliningeasierandmorerepeatable.
Bonus: TimeWhilenottechnicallyanindicatorofcompromise,timeisalensthroughwhichto view the previous indicators of compromise. Take for example the policyviolationsindicatorofcompromise.IfaCEOaccessesthesourcecoderepository,itmaynotreallybeunusual if thataccesshappensduringthelunchhourandtheCEOhappenstohaveatechnicalbackgroundandisjustperusingthecodeoutofcuriosity.But if thatsameCEOaccessestherepositoryat2:00am,thatisalikelyindicatorofcompromise.Addingthedimensionoftimetotheotherindicatorsofcompromiseaddsanotherinvestigativeelementthatcanyieldrealactionableinsight.
Increase Your Operational Awareness with Security AnalyticsSecurityanalyticsandvisualizationcanhelpyouquicklyandeffectivelyidentifyand eliminate common network behaviors that may indicate a networkcompromise inways thatperimeterdefenses—which identifyonly events theyknow about—cannot. This gives your organization much greater insight intotheactivityonyournetwork,leadingtofasterremediationandamoreresilientnetworksecurityposture.
During the first half of 2014, the security researchers at 21CT will regularlypublishnewIOCusecasesandsecurityanalyticsavailableforyoutodownloadtohelpyourorganizationincreaseoperationalawarenessofyournetwork.


![Operation Cloud Hopper - CERT · manager.architectisusa[.]com manager.jetos[.]com maofajapa.3322[.]org ... Operation Cloud Hopper Indicators of Compromise 18 polopurple[.]com](https://static.fdocuments.net/doc/165x107/5b229ed27f8b9a1a398b45e1/operation-cloud-hopper-cert-managerarchitectisusacom-managerjetoscom.jpg)