INSERO QUARTERLY, Q3 2017 · PDF fileshow effect. The positive development is mainly caused by...
33
- Nordic electric vehicle market overview with the latest sales figures, infrastructure overview and the main market tendencies INSERO QUARTERLY, Q3 2017
Transcript of INSERO QUARTERLY, Q3 2017 · PDF fileshow effect. The positive development is mainly caused by...

- Nordic electric vehicle market overview with
the latest sales figures, infrastructure overview
and the main market tendencies
INSERO QUARTERLY, Q3 2017

Market share by brand
CAR SALES
CAR SALES IN TOTALPercentages of cars sold across the Nordics:
NUMBER OF CHARGING PLUGSTotal number of charging plugs across the Nordics:
PHEVs and EVs sold in the Nordics:
Q3 OUTLINE
INSERO QUARTERLY, Q3 2017
PHEVEVTotal sales of cars and vans
67,7%
89,37%
98,9% 94,8%
16,75%
15,6%
4,10%
FinlandNorway
Denmark Sweden
Nordics
1,10%
99,79%
5,75%
4,88%
0,39%
0,70%
2,40%
0,43%
EV
PHEV
DK NO SW FI
48
6.535
2.922
537312
7.325
1.157
151
7.367
CCS
CHAdeMo
Other (≤22kW)
TYPE 2-AC
TESLA SC
2.546
2.114
697
137
53
929
706
223
1.955
3.719
2720
652
7.947
9.568
134
1.177
230
1197898
DK NO SW FI
Others

ABBREVIATIONS AND TERMINOLOGY
Charging plug – Plugs to be inserted in electric vehicles to
charge them
Charging point – Unit/location, which may have
one or more charging plugs
EV – Electric Vehicle (car or van)
PHEV – Plug-in Hybrid Electric Vehicle
BEV – Battery Electric Vehicle
YTD – Year-To-Date
Car segments used in Insero Quarterly:
A-segment = Mini cars (e.g. Fiat 500)
B-segment = Small cars (e.g. Renault Clio)
C-segment = Medium cars (e.g. VW Golf)
D-segment = Large cars (e.g. BMW 3 series)
E-segment = Executive cars (e.g. Mercedes E Class)
J-segment = SUV cars (e.g. BMW X5)
Van-segment = Vans (e.g. VW Transporter)
3INSERO QUARTERLY, Q3 2017
Subscribe to Insero Quarterly
If you like the content of Insero Quarterly and want to
receive it in your inbox every quarter, you just have to fill
out this form.
If you are interested in more detailed analyses, please
contact [email protected]

4INSERO QUARTERLY, Q3 2017
1. EXECUTIVE SUMMARIES – NORDIC AND NATIONAL 5
3. CHARGING INFRASTRUCTURE OVERVIEW 22
4. NATIONAL INCENTIVES FOR ELECTRIC VEHICLES 24
2. NORDIC SALES STATISTICS FROM Q3 2017 11
5. INSERO QUARTERLY THEME: Mobility driven by electricity 26
6. SOURCES & CONTACT US 31
TABLE OF CONTENTS

NORDIC │ WHAT THE LATEST NORDIC FIGURES TELL US
• Total number of electric vehicles stock: 221.780 Check out the figures
• Q3 sales: 21.965 vehicles (record) Check out the figures
• Sales development in Q3: +16.98% (18.777 21.965)
• YTD sales: 59.022 vehicles
• Best selling BEV model: BEV E-Golf with 2.219 in total sales Check out the figures
• Best selling PHEV model: Passat GTE with 2.008 in total sales
• Infrastructure roll out: Combined growth of 4.8% across the Nordics (16.090 16.762) Check out
the figures
• Market leader for EVs in Q3: Volkswagen with 24 % (5.226 registrations in total)
5INSERO QUARTERLY, Q3 2017

DENMARK │ THE MAIN TENDENCIES FROM DENMARK
• Q3 sales: 485 vehicles Check out the figures
• Sales development in Q3: + 223,33 % (150 485)
• YTD sales: 741 vehicles Check out the figures
• Infrastructure roll out: No significant changes in Q3 (2.546 chargers in total) Check out the figures
• Incentives for electric vehicles: Politicians are trying to re-establish EV uptake by freezing upcoming tax regulations until 2018 (or until sales reach 5.000 EV’s). Also, registration tax limit raised to 185.000 kr. Check out more
• Most popular BEV: Renault Zoe (second quarter in a row) Check out more
• Most popular PHEV: Kira Niro (previously Mercedes GLC)
• Other highlights: Q3 2017 manged to increase the total sales of EV’s by 335 vehicles (compared to Q2 2017). Despite being 131 vehicles down compared to Q3 2016, the new tax incentives is starting to show effect. The positive development is mainly caused by strong sales of the Renault Zoe (206) and the new Kira Niro (132).
6INSERO QUARTERLY, Q3 2017

NORWAY │ THE MAIN TENDENCIES FROM NORWAY
• Q3 sales: 16.061 vehicles (record) Check out the figures
• Sales development in Q3: + 15,88 % (13.860 16.061)
• YTD sales: 43.595 vehicles Check out the figures
• Infrastructure roll-out: Increased by 3,4% (9.568 chargers in total) Check out the figures
• Incentives for electric vehicles: A proposal, presented as part of next year’s budget to remove tax exemption of EVs that weigh more than two metric tons, the so called “Tesla tax” Check out the figures
• Most popular BEV: VW E-Golf (second quarter in a row) Check out more
• Most popular PHEV: Mitsubishi Outlander (second quarter in a row)
• Other highlights: Tesla managed to increase its market share by 6,37 % (14,68 % in total and 2.357 new registrations) compared to Q2. The VW E-Golf remain the best-selling EV model in Norway with 2.085 registrations. The new PHEV Volvo XC60 successfully penetrated the Norwegian market with 362 new registrations.
7INSERO QUARTERLY, Q3 2017

SWEDEN │ THE MAIN TENDENCIES FROM SWEDEN
• Q3 sales: 4.637 vehicles (record) Check out the figures
• Sales development in Q3: + 13,67 % (4.079 4.637)
• YTD sales: 9.296 vehicles Check out the figures
• Infrastructure roll-out: Increased by 4,4% (3.719 chargers in total) Check out the figures
• Incentives for electric vehicles: No significant changes were observed in Q3 Check out the figures
• Most popular BEV: Renault Zoe (previously Nissan Leaf) Check out more
• Most popular PHEV: VW Passat GTE (previously Mitsubishi Outlander)
• Other highlights: PHEVs expanded its dominating position. The VW Passat GTE was accountable for 1.202 new EV registrations equal to 25,92 % of the total EV market in Q3 which is 11,09 % more than Q2. The KIA Optima witnessed considerable interest with 661 registrations (14,25% market share) in Q3 compared to the previous 124 in Q2
8INSERO QUARTERLY, Q3 2017

FINLAND │ THE MAIN TENDENCIES FROM FINLAND
Q3 sales: 782 vehicles (record) Check out the figures
Sales development in Q3: + 25,92 % (621 782)
YTD sales: 2.100 vehicles Check out the figures
Infrastructure roll-out: Infrastructure roll-out: No significant in Q3 (929 chargers in total) Check out the
figures
Incentives for electric vehicles: No significant changes in Q3 Check out the figures
Most popular BEV: Tesla Model S (third quarter in a row) Check out more
Most popular PHEV: Mercedes GLC (third quarter in a row)
Other highlights: The Finnish EV market is close to reaching the 800 new registrations mark in one-quarter for the first time. The Mercedes GLC is above 120 new registrations for the third quarter in a row which is the first time a single EV car model accomplishes that in Finland. The BMW models accounts for 22,38 % of the EV registrations in Q3 followed by Mercedes at 18,80 %
9INSERO QUARTERLY, Q3 2017
10INSERO QUARTERLY, Q3 2017
1. EXECUTIVE SUMMARIES – NORDIC AND NATIONAL 5
2. NORDIC SALES STATISTICS FROM Q3 2017 11
TABLE OF CONTENTS
3. CHARGING INFRASTRUCTURE OVERVIEW 22
4. NATIONAL INCENTIVES FOR ELECTRIC VEHICLES 24
5. INSERO QUARTERLY THEME: Mobility driven by electricity 26
6. SOURCES & CONTACT US 31

11
Nordic The Nordic electric vehicle market had another great quarter in Q3 surpassing Q2 2017 with 3.188 vehicles in total with an average market
growth of 18,49% which is significantly more compared the 5,77 % growth in Q2 (Denmark is excluded in the general market growth as they landed at
a 222,33 % growth ratio in Q3).
• The entire EV stock rose with 21.965 vehicles in Q3.
• As a result, the total EV stock grew by 36% in the first two-
quarters of 2017
• The total stock of BEVs and PHEVs has now surpassed 200.000
registrations.
• The total stock of BEVs and PHEVs have more than doubled
since 2015
• Norway achieved 16.000 new registrations for the first time in
one-quarter, ever.
• Q3 raises the bar for EV sales in the Nordic region; Finland EV
sales surpassed Denmark in Q1 and proceeds to do so in Q3 but
the difference is just 297 vehicles. Finland is still 5.646
registrations behind Denmark in total.
• For the period, Norway accounts for 74 % of total sales while
Sweden deems for 19 % followed by Denmark at 5 % closely
accompanied by Finland at 2 %
If you are interested in a more detailed analysis, get in touch with us here
2. SALES STATISTICS │ STOCK OF ELECTRIC AND PLUG-IN HYBRID VEHICLES
NO
FI
SE
DK
5%
74%
19%
DK
NO
FI
SW
2%
16.62229.701
42.29618.529
40.623
74.883
2011
9.905
2012 2013
7.923
7.926
2014 2015
9.893
120.267
2.897 4.988
2016 2017 ytd2017 YTD
10.634
163.862
NO
DK
3.185
100.910
52.565
SW
6.940
2010
FI
2009
5.3873.524 4.227
12.87123.573
162.758
221.780
+36%TOTAL BEV & PHEV REGISTRED 09-2017 YTD
Countries’ share of total EV stock

12
2. SALES STATISTICS │ ANNUAL SALES OF ELECTRIC AND PLUG-IN HYBRID VEHICLES, 2009-2017YTD
74%
21%
4%
SW
NO
DK
1%
FI
NO
FI
SE
DK
Nordic │ Q3 2017 was the best quarter ever, and all Nordic countries managed to progress including Denmark, however the set back after the introduction of registration tax on EVs is still clear. Overall this indicates a promising Q4 and 2017 in total
4.7018.699
13.079 12.595
4.7018.624
20.254
34.260
45.384 43.595
4.741
10.909
2009 2010
1.4742.244
1.659
2.091
2011
523
2012 2013 2014
645
2015
1.967
1.418
2016 2017 ytd2017 YTD
741
8012.907
6.228
27.020
48.345
61.84859.022
BEV & PHEV sales per year
Countries’ share of YTD sales 2017
• Purchase incentives on EVs are still regulating market diffusion;
Danish sales still low as contradictory political actions create
market uncertainty and there is no clear effect of the tax freeze
yet
• Sweden sales continues growing, as they have the biggest
difference between the two quarters with 200 registrations.
• Only 2.826 registrations separates 2017 YTD from surpassing the
total number of registrations in 2016.
• Sweden and Norway drive EV sales in the Nordic region, Finland
keeps its market share compared to the other markets
• The Danish market is expected to gain strength in the upcoming
quarter due to the new tax regulation freeze.
If you are interested in a more detailed analysis, get in touch with us here

13
Nordic │ The Nordic electric vehicle market witnessed record quarters in Norway, Sweden and Finland in Q3, while Danish sales are trying to get back on track due to the tax freeze on EVs in 2017. Consequently, the Danish market managed to grow significantly in Q3 compared to Q2.
2. SALES STATISTICS │ NORDIC OVERVIEW YEAR-TO-DATE AND Q2 2017
3.879
12.5959.296
13.674
4.079
4.637
43.595
33.68613.860
16.061
Q3
782
621
688
Q1 Q2
485 741
2.091
YTD 2017
1.100
1.005
YTD 2016
18.777
18.280
21.965 59.022
45.087
+31%
4.6373.410
3.989
1.800
1.82016.061
11.4115.474
6.598
105
101
616
279
7821.017
Q3 2017
291
233
jul 16
258
aug 16 Q3 2016sep 16
485
334
5.340
7.811
8.814 21.965
15.771
+39%
NO
FI
SE
DK
NO
FI
SE
DK
EV sales YTD 2017
EV sales Q3 2017
• Sales are increasing; Q3 sales beat all previous quarters in 2017
with a noteworthy mark.
• Q3 has been a strong quarter across the Nordic Region except
Denmark who are down 131 registrations compared to Q3 2016
despite noteworthy growth in Q3 2017. Insero does,
nonetheless, expect better sales in the forthcoming quarters of
2017 due to the Danish tax freeze.
• In 2017 Insero expects an increase in sales of more than 25%
compared to 2016 across the Nordic Region. The sale increase is
projected to be driven by the tax freeze in Denmark and positive
EV market penetration in Sweden and Finland and is currently
31 % up compared to YTD numbers 2016.
• Sweden, Finland, and Norway keep delivering; Q3 2017 beats
Q2 2017 with incredible 16,98% despite the Danish market
remaining at a low level.
• All markets except Denmark had September as the best selling
month. In total 8.814 vehicles were sold across the four
countries beating the previous record from June 17 (7.873)
• For the first quarter ever the combined Nordic EV sale
exceeded 21.000 vehicles and is close to surpass 22.000. Both
Q1 and Q2 struggle with surpassing the 19.000 hallmark.
If you are interested in a more detailed analysis, get in touch with us here

14
Nordic │ PHEVs are getting, even more, control in Q3 compared to earlier quarters; already the favored EV type in Finland and Sweden, while popularity is growing in Norway. Range, performance, price and model selection are superior compared to the currently available BEVs.
• PHEVs are the preferred EV type in both Sweden and Finland;
accounting for respectively 78% and 85% of sales. BEVs remain the
preferred EV in Norway, however, PHEVs are steadily becoming more
popular as they now account for 46% of the sales.
• Denmark is the most BEV oriented country measured on market
share. In fact, of the 485 EVs registered in Q3, 64 % was from the BEV
segment
• The total sale increased by 39% from Q3 2016 – Q3 2017 which is 17%
more than Q2
• While PHEVs and BEVs were equally popular in Q2 across the Nordics,
PHEVs seems to have taking a lead by 9 percentages points.
• Nordics; Norway being the market favoring BEVs together with
Denmark while Sweden and Finland prefer PHEVs.
• The PHEVs segment share is expected to grow in 2017 as sales in
Sweden, and Finland are confident, while Norway is adopting more
PHEVs than previously. Furthermore, the new tax policy in Demark is
expected to improve PHEV market share.
• New PHEV models are being introduced such as the Kia Niro
If you are interested in a more detailed analysis, get in touch with us here
46%
54%
BEV
PHEV
2017 Q3 sales by type (BEV/PHEV)
2017 Q3 sales composition
7.430
3.615
11.881
8.734
8.631
1.022
10.084
7.028
312173
Q3 2017FIDK SWNO
663
Q3 2016
21.965
485
4.637
16.061
782
15.762
+39%
BEV
PHEV
2. SALES STATISTICS │ NATIONAL SALES FIGURES BY SALES TYPE 2017 YTD

15
Denmark │ Purchase incentives regulate EV uptake; sales increase significantly between Q2 and Q3 2017 but still remain below previous quarters in 2016, as the Danish tax on EVs remains at 20% in 2017. Tesla sales increased but remain at a low level.
2. SALES STATISTICS │ NATIONAL SALES FIGURES BY SEGMENTS YEAR-TO DATE 2017
67(9%)
Van-segment A-segment
B-segment270
(36%)
PHEV
56(8%)0%
C-segmentD-segment
20(3%)
E-segment
20(3%)
J-segment
267(36%)
41(6%)
E-segment
11(2%)
206(42%)
29(6%)
A-segment
B-segment
44(9%)
Van-segment
15(3%)
C-segment
J-segment
173(36%)
PHEV-segment
7(1%)
EV sales Q3 2017
Segments’ share of YTD sales 2017
The sales figures are divided into segments (numbers above and percentages below)
• B and PHEV segments are driving Danish EV sales in Q3.
• PHEV-segment managed to increase its market share with 5 %, the
growth is mainly driven by the new Kia Niro which accounts for 27% of
the total registrations.
• B-segment gains ground with a 8 % increase compared to Q2, Renault
Zoe, accounts for 42 % of the total registrations in Denmark.
• Tesla also had a good quarter compared to previous sales; sales
increased to 26 vehicles for the entire quarter compared to only 12 in
Q2.
• The B-segment had the largest increase in market share and went
from 25 to 36 % mainly caused by high sales of Renault Zoe in June
(206).
• VW E-UP is the most popular model in the A-segment
• The PHEV-segment and B-segment is now equally popular.
• Sales are expected to increase across all segments as the market
becomes more stabilized with the introduction of 20 % tax freeze
If you are interested in a more detailed analysis, get in touch with us here

16
Norway │raises the bar; PHEV-segments continue to thrive with the introduction of VOLVO XC60 and KIA Niro increasing its market
share in the EV segment with 3 % compared to Q2. For the first time, Tesla managed to sell more than 2.300 cars in on quarter caused
by strong figures alone in September with the S and X models selling 2.003 vehicles combined.
2. SALES STATISTICS │ NATIONAL SALES FIGURES BY SEGMENTS YEAR-TO-DATE 2017
2%(1.026)
A-segment
J-segment
6%(2.425) 14.908
(34%)
2.023(5%)
B-segment
C-segment
E-segment
D-segment2.694(6%)
19.827(45%)
PHEV-segment
2%(692)
Van-segment
368(2%)
1.170(7%)
232(1%) 5.010
(31%)
A-segment
664(4%)
B-segment
PHEV-segment
C-segment
D-segment
E-segment1.187(7%)
J-segment
7.430(46%)
Van-segment
Segments’ share of YTD sales 2017
EV sales Q3 2017
The sales figures are divided into segments (numbers above and percentages below)
• The C-segment is down by 2% compared to Q2, while the PHEV
segment remains at the previous level.
• The E and J-segment both managed to increase its market slightly
compared to the total segment’s share of 2017, up 3 % compared to
Q2.
• Both the B, J, and A-segment witnessed no negative or positive
development in Q3
• If you are interested in a more detailed analysis, get in touch with us here
• Norway raise the bar once again; For the eighth consecutive quarter,
Norway bypassed the former record set in Q2 at 13.860 with
impressive 16.061 new registrations in Q3.
• The Norwegian market managed to gain newfound momentum, as
the sales development increased by 15,88 % between Q2-Q3 which is
significantly more than the previous level in Q1-Q2 at 1,36 %
• The PHEV and C-segment continue to dominate the market despite a
6 % drop of the total registrations compared to Q2. Positive growth
development of 5% combined in the J and E segment mainly causes
the decline in the PHEV segment

17
Sweden │breaks its previous record with 558 registrations and is just short of the 5.000 hallmark. The PHEV segment is close to obtaining 80 % market share. Tesla's total market share rises to 2 %. The Volkswagen Passat GTE model dominates the Swedish market with a market share of 25,92 %.
2. SALES STATISTICS │ NATIONAL SALES FIGURES BY SEGMENTS YEAR-TO-DATE 2017
Van-segment
588(5%)
C-segment
1.499(12%)
92(1%)
A-segment
D-segment
660(5%)
B-segment
E-segment
388(3%)
J-segment
9.308(74%)
PHEV-segment
60(0%)
20(0%)
PHEV-segment
98(2%)
A-segment
277(6%)
B-segment
469(10%)
C-segment
E-segment142(3%) J-segment
3.615(78%)
16(0%)
Van-segment
Segments’ share of YTD sales 2017
EV sales Q3 2017
The sales figures are divided into segments (numbers above and percentages below)
• Sweden exceeds its record yet again; sales up 13,67 % with 4.637
registrations compared to the previous record set Q2 2017 at 4.047.
• Sweden continues to favour the PHEV models. The KIA Optima
successfully penetrated the market with a market share of 14,25 % of
the EV segment. .
• Three models account for more than 50 % of the total registrations
VW Passat in Q3 GTE – 25,92%. KIA Optima – 14,25 %) and Mitsubishi
Outlander – 11,34 %
• Focusing on BEVs, Tesla sales increases in Sweden. Both E- and J-
segment saw a positive growth in market share although the C-
segment dropped 5 %
• PHEVs carry on to secure its position in the market and is up 2 %
compared to Q2 and is now responsible for 74 % as of YTD
• Both C, E and J-segment lost shares compared to the previous
quarter, combined they are down 3 %.
• The BEV segment might have an upcoming star as Hyundai IONIQ
achieved to register 165 new vehicles in Q3 which is 79 more than the
PHEV model.
• If you are interested in a more detailed analysis, get in touch with us here

18
Finland │ Continue to improve its movement towards EVs and is close to reaching 800 new registrations in one quarter for the first time. With a market share of only 15 % BEVs and especially models with limited range are unlikely to penetrate the market.
2. SALES STATISTICS │ NATIONAL SALES FIGURES BY SEGMENTS YEAR-TO-DATE 2017
78(4%)
C-segment
A-segment
8(0%)
2%
B-segment
1497%
D-segment
J-segment
1.692(81%)
PHEV-segment
12(1%)
Van-segment
5(1%)
C-segmentB-segmentA-segment
17(2%)
0%
43(5%)
PHEV-segment
E-segment
32(4%)
21(3%)
J-segment
663(85%)
Van-segment
EV sales Q3 2017
Segments’ share of YTD sales 2017
107(5%)
The sales figures are divided into segments (numbers above and percentages below)
• Second best growth rate in the Nordic Region. EV sales grew with
25,92% in Q3 2017compared to Q2 2017.
• PHEVs dominate; account for 85% of registrations in Q3 which is 7 %
more than Q2.
• Driving range seems to be a major issue in Finland; vehicles with short
range account for 8% of sales in Q3.
• The PHEV-segment market share is about to reach the same level as
in 2016 with current numbers being just 3 % down compared to the
segment’s share of 2016.
• All BEV segments, except the J-segment, are expected to lose market
share in Q4 compared to Q3
• If you are interested in a more detailed analysis, get in touch with us here

19Nordic │ PHEV sales are increasing; the preferred EV type in Sweden and Finland and still popular in Norway. Number of car models available positively related to EV sales. Large car models dominate the PHEV segment.
2. SALES STATISTICS │ NORDIC SALES IN THE C- AND PHEV-SEGMENTS
Volvo XC60
141(1%)
BMW 225XE
Outlander
Volvo V60
760(6%)
GOLF GTE
PASSAT GTE2.008(16%)820
(7%)
439(4%)
493(4%)
Volvo V90
AUDI Q7 E-TRON
526(4%)
1.491(12%)
531(4%)
Audi A3 ETRON
295(2%)
778(6%)
702(6%)
932(8%)
BMW 330E
274(2%)
1.794(14%)
BMW X5 40 Ee
Mercedes GLC
397(3%)
Mercedes C350
KIA Optima
Other
Volvo XC90
PHEV-segment sales 2017 Q3
663838
3.615
2.7302.147
1.436
1.3417.430
5.5502.609
2.674
11
199
20
15
Jul May
222
242
Jun
46
Q3 2017
31
282
Q3 2016
11.754
3.195
4.282
4.277
8.593
+37%
DK
FI
NO
SW
2017 Q3 sales by model
4.757(40%)
PHEV JJ-segment
PHEV CC-segment
470(4%)
2.444(21%)
4.210(35%)
D-segment
Other E, F, S2017 Q3 PHEV sales by class
• PHEVs more popular than ever before; PHEV sales had another
winning quarter with a considerable sales increase.
• The quarter started out slow, but sales increased over the period. As a
result, the total sales of PHEVs surpassed Q2 with 1.714 vehicles
• The PHEV segment has an increasing number of popular cars; several
models are close to reach the 1.000 sales mark
• The PHEV segment is dominated by large car models such as the
Passat GTE and Mitsubishi Outlander.
• Volkswagen, BMW and Volvo are the dominating PHEV brands in Q3.
If you are interested in a more detailed analysis, get in touch with us here

20Nordic │ Tesla sales increases. The C-segment is rising, caused by big interest in the Volkswagen E-Golf in Norway.
2. SALES STATISTICS │ NORDIC SALES IN THE E- , J-AND VAN-SEGMENTS
The sales figures are divided into segments (numbers above and percentages below)
1.178
2.155
407
283
238
138
Q3 2016 Q3 2017
1.723
2.676
+55%
Jul
Sep
Aug
MODEL X 1.355(51%)
MODEL S1.321(49%)
E- and J-segment sales Q3 2017
1.4811.847
1.500
2.359752
1.311
5.517
3.733
Q3 2016 Q3 2017
+48%
Focus electric
1.035(19%)
i3
65(1%)
861(16%)
2.170(39%)
E-GOLF
478(9%)
B-CLASS ED
LEAF
619(11%)
HYNDAI IONIQ289(5%)
AMPERA
Aug
Jul
Sep
C-segment sales Q3 2017
• Volkswagen E-Golf sales grows rapidly and are up 10% compared to
Q2
• The BMW I3, Nissan Leaf and Open Ampera declines particularly in
Norway; C-segment is increasing in total
• C-segment is increasing in total and is up 236 vehicles compared to Q2
• Already 55% up compared to Q3 2016, Tesla sales increases heavily
with 75,56% compared to Q2. The development could be explained by
the fear of the potential “Tesla-tax” in Norway.
• Alone in September Tesla registered 2.003 vehicles on the Norwegian
market.
• Tesla Model S is currently the most popular of the two. The X model
accounted for 63% of all registrations in Q2.
If you are interested in a more detailed analysis, get in touch with us here

21INSERO QUARTERLY, Q3 2017
3. CHARGING INFRASTRUCTURE OVERVIEW 22
TABLE OF CONTENTS
4. NATIONAL INCENTIVES FOR ELECTRIC VEHICLES 24
2. NORDIC SALES STATISTICS FROM Q2 2017 11
5. INSERO QUARTERLY THEME: Mobility driven by electricity 26
6. SOURCES & CONTACT US 31
1. EXECUTIVE SUMMARIES – NORDIC AND NATIONAL 5

22
Nordic │ The third quarter of 2017 shows how numbers of charging plugs available set the pace for a possible strong second part of 2017, with an overall charging plug increase of 4,8 % across the markets despite no development in Denmark or Finland
Q3 highlights
• Denmark:
• Total plugs increased by 0,0 %
• Norway:
• Total plugs increased by 3,4 %
• Sweden:
• Total plugs increased by 4,4 %
• Finland:• Total plugs increased by 0,0 %
If you are interested in a more detailed analysis, get in touch with us here
• Disclaimer: No completely accurate numbers exist for the
charging infrastructure figures, however, Insero has been able
to find improved sources including EAFO.eu for the production
of the statistics. Insero has no accurate overview of all the
types of plugs
3.CHARGING INFRASTRUCTURE | PUBLIC CHARGING POINTS AND PLUGS
Number of public charging plugs available (e.g. up to three plugs at one charging point)
134
0
DK
272
71
SW
3.719
FI
929
706
78
119
2.114
98
2.546
137
NO
9.568
697
7.947
1.955
223230
1.177
652
Tesla SC
CCS
ChaDeMo
Normal charge <=22 kW)
Type 2-AC
Number of EVs per charging plug
5,3
11,4
17,1
4,2
FISWNODK

23INSERO QUARTERLY, Q3 2017
4. NATIONAL INCENTIVES FOR ELECTRIC VEHICLES 24
TABLE OF CONTENTS
3. CHARGING INFRASTRUCTURE OVERVIEW 22
2. NORDIC SALES STATISTICS FROM Q3 2017 11
5. INSERO QUARTERLY THEME: Mobility driven by electricity 26
6. SOURCES & CONTACT US 30
1. EXECUTIVE SUMMARIES – NORDIC AND NATIONAL 5

24Nordic │ The Nordic countries have added no new significant incentives in Q3.
5. INCENTIVES | COMPARISON OF NATIONAL ECONOMIC AND CONVENIENCE INCENTIVES
Overview of incentives
Specific incentives
Tax incentives
Financial incentives
Convenience incentives
Denmark
Norway
Sweden
Finland
Tax incentives
Financial incentives
Convenience incentives
Denmark ▪ 80% reduction in registration tax (until end of 2018 or until 5.000 new EVs registrations)
▪ Tax exemption for FCEV▪ Registration tax limit raised to 185.000 kr.
▪ Tax reduction (0,13 EUR per kWh) for businesses
▪ EV subsidies for business and municipalities.
▪ Reserved parking spaces for EVs▪ Differentiated prices
Norway ▪ Registration tax exemption▪ VAT exemption▪ Road tax exemption▪ Reduced company car tax (50%)▪ Exemption from VAT (25%) on leasing
▪ Free parking spaces▪ Toll road exemption▪ Free public charging▪ Higher mileage allowance▪ No charges on ferries
▪ Bus lane driving▪ Reserved parking spaces▪ Fast charging station every 50 km on all
main roads by 2017
Sweden ▪ Vehicle tax exemption for 5 years*▪ Company tax benefits
▪ Super Green Car Rebate. ▪ EV: Max €4,500.▪ PHEV: Max €2,200**
None
Finland ▪ Registration tax reduction (BEV buyer pays 2,5%)
▪ Ownership tax benefits
▪ Cheaper parking/ Free parking None
*all Euro 5 or 6 level emission vehicles**a subsidy of 35% of the price difference between a low-emission vehicle and a comparable conventional vehicle*** New incentivise are highlighted

25INSERO QUARTERLY, Q3 2017
5. INSERO QUARTERLY THEME: EVS30 - Mobility driven by electricity 26
TABLE OF CONTENTS
3. CHARGING INFRASTRUCTURE OVERVIEW 22
2. NORDIC SALES STATISTICS FROM Q3 2017 11
6. SOURCES & CONTACT US 31
1. EXECUTIVE SUMMARIES – NORDIC AND NATIONAL 5
4. NATIONAL INCENTIVES FOR ELECTRIC VEHICLES 24

19THEME SECTION, Q3 2017
THEME Q3 2017:
MOBILITY DRIVEN BY ELECTRICITY: EXPERIENCES FROM THE PAST SIX YEARS“An optimistic future for EVs appears, as there is no convincing strategy to approach climate change without modifying the way we transport our self”

IN THIS THEME SECTION, WE PROVIDE YOU WITH THE LATEST INSIGHTS FROM THE PAST SIX YEARS OF ELECTRIC MOBILITY IN THE NORDICS
Back in 2009, the transportation sector was accountable for 20% of the total carbon
dioxide (CO2) emission in Europe, which motivated the European Commission to set
marks such as 10% renewable transport fuels by 2020 and adjusting the average CO2
emission limits for new automobiles from 130 g to 95 g of CO2. Not unexpected, with the
growing concerns towards climate changes, the advancement of low-carbon and carbon-
free technologies for transportation has been giving a top priority. Considered as one of
the most effective alternatives for internal combustion engines (ICE), electric vehicles will
be essential for reducing emissions in the transport sector and thereby increasing
sustainability. While EVs have been around since the 1800s, it was not until 2011 when
commercial EVs obtained great interest primarily due to environmental affairs, as well as
improvements in battery technology. Originally launched in Japan and the United States
late December 2010, the Nissan Leaf made its way to Europe in 2011. Nissan sought to
make the car appealing to mainstream drivers by giving it a typical five-door hatchback
design and by doing so they lighted a new potential segment. To this day, more than
250.000 Leafs have been sold worldwide, more than 24.000 in the Nordics. At the same
time, several large scale national and international research projects regarding EVs
started, seeking to explore new possibilities as well as improve the knowledge of the
technology. These usable models and the higher awareness suddenly made the incentives
in Denmark and Norway relevant for private people and companies, persuading them to
invest in EVs.
A milestone was reached in 2015, as the sales of electric vehicles reached the
important mark of 1% of the markets share worldwide. Additionally, 2015 also became the
year where the quantity of EVs exceeded the 1 million target, ending at 1.26 million in
total (IEA, 2016).
Since then the curve rose steeply, and in around one year the figures multiplied to 2 million
by the end of 2016. The increase form a limited number of EVs to 2 million world wide has
caught the attention of almost all car manufactures today. But to put matters into
perspective, there are more than 1 billion ICE powered vehicles globally. In terms of market
share, the Nordics are leading the curve compared to the general worldwide level with
current a EV registration share of 10,63% (Q3 2017), mainly caused by strong sales in Norway
for the past years, which is incontestably the most successful country worldwide to adopt
EVs. Over the past six years the average annual increase of new registered EVs across the
Nordic markets is 80%.
This annual incease will unavoidably slowdown in the future as the total number of EVs
increases in the Nordics. Historically speaking, the transition from ICE to electric vehicles has
been driven by the BEV segment mainly in Norway. However, PHEV being the most popular
type of EV in both Sweden and Finland, has for the past quarters seen an increase in market
share in both Denmark and Norway. By the end of Q3 2017 the sales composition had tilted
towards the PHEV segment with a 54% market share. This movement towards the PHEV
segment is primarily driven by range performance, cheaper price and model variety.
27THEME SECTION │MOBILITY DRIVEN BY ELECTRICITY: EXPERIENCES FROM THE PAST SIX YEARS

The key players in EV sales in the Nordics, have mainly for the period consisted of
large European and Asian car manufactures, but an estimated amount of 28 different
companies have been a part of the market contributing in the milestone of 200.000 EV
registrations. The three largest companies measured on car registrations in the Nordics
from 2013-present time is Volkswagen, Nissan and Tesla. Manufacturers have followed
different approaches to developing EV models. The “conversion” approach adds the new
technology to an existing model while the “purpose” approach involves a new vehicle
design. Volkswagen managed to execute the “conversion” approach successfully
transforming several of their favorite ICE models to new EVs such as the E-Golf and Passat
GTE. Over the past years, first movers such as Renault and Nissan, who both chose the
“purpose” approach, lost momentum as other manufacturers introduced a more
substantial and enhanced assortment of EV models in different price categories. Where the
Nissan Leaf at the end of 2013 had a 47,29% market share in the Nordics, it now accounts
for 6,61%. The current market share varies from each country. In Q3 2017, the sales of EVs
represented 1,1% in Denmark, 6,2% in Sweden, 0,2 % in Finland and 33,3% in Norway. Few
EV models are currently available compared to ICE vehicles. However, almost every car
manufacturer now includes 1 or more EVs in their portfolio, with each producer launching
at least one new model each year. Small and medium-sized dominate the BEV-market,
where mid-size and large SVs dominate the PHEV-market
History implies market isn’t yet competitive, as purchase prices vary
significantly between different models, depending on electric driving range, vehicle size,
and brand, and perhaps most importantly market. One crucial thing learned from the past
six years is the fact that the EV market across all the Nordics is hugely fragile and widely
depends on government incentives and purchasing subsides. The purchases of EVs plunged
in Denmark at the beginning of 2016 caused by the progressive phasing out of tax breaks on
EVs. This decision more or less eliminated the demand for serval quarters going from 624
new registrations in Q1 2015 followed by 242 the year after to just 106 in Q1 2017.
Although, on April 18, 2017, having taken note of the declines in registrations, the authority
chose to adjust the tax laws again. The subsides dictates the market. Norway, for example,
has seen a high demand for BEVs in past years, although recent changes to Norwegian EV
subsidies saw a substantial shift in 2015 towards PHEVs which, as a consequence, grew 164%
from 2015 to 2016 while BEV only managed to gain 6% (IEA 2017). The transition to a post-
subsidy era is a significant threat to the whole EV market. The question is, will history repeat
itself as seen in Denmark? The timing of the movement will inevitably have an impact.
Despite the environmental gains and increasing quantity of available EV
models, users remain, to some extent, unconvinced to acquire an EV, in fact, there are
numerous causes why they continue to be unwilling. These reasons essentially focus on
cost, user requirements, limited information and technological uncertainty compared to ICE
vehicles. Concentrating on costs, an EV can be up to several thousand € costlier than the
equivalent ICE model even with substantial subsides.
28THEME SECTION │MOBILITY DRIVEN BY ELECTRICITY: EXPERIENCES FROM THE PAST SIX YEARS
25%
14%
12%12%
11%
5%
5%
5%
7% VOLKSWAGEN4%
RENAULT
TESLA
NISSAN
MITSUBISHI
BMW
MERCEDES-BENZ
VOLVO
AUDIOther
EV market share by brand from 2013-present time

Caused by the expensive battery among other reasons, the price difference proceeds to be a
significant barrier despite considerable progress towards increase of efficiency and lowering
production costs. Furthermore, most buyers tend to concentrate on purchase prices while
overlooking the reduced running costs such as maintenance and electricity vs petrol prices.
Questions regarding the duration of existing fiscal incentives are also a barrier, as the value
gained from, e.g. free charging and parking spots, is impossible to monetize as the
incentives are at constant risk of being removed. Even though the assortment of EVs is
improving with most OEMs now contributing, there is still a significant gap between the
number of models within the ICE and EV segment. Also, generated by the restrained market
seize, most models are limited on customization options resulting in limited possibilities to
reduce prices by removing equipment. Potential customers acknowledge two main causes
for why they would hesitate to invest in an EV alternatively of an ICE vehicle. First, EVs are
not meeting the daily requirements, especially concerning range and charging boundaries.
Despite the fact that the driving range of most EVs is more than adequate for most
commuting, customers nevertheless overestimate their minimum requirements. Secondly,
despite being more than 150 years old, the technology is still deemed almost new and
consequently underdeveloped. It's believed that significant elements of the technology are
uncertain such as charging availability and cost of ownership. Battery life and duration is,
nonetheless, the most critical area as this question remains associated with high costs.
Buyers are anxious that the battery degradation will result in a huge drop in residual value.
Mitigated by years of optimization and improvement, before-mentioned risks does not
affect ICE vehicle ownership and is therefore, consequently, considered tolerable.
An optimistic future for EVs appears, as there is indeed no convincing strategy to
approach climate change without changing Transportation. Movements are happening
within the EV segment, from being regarded as exclusive for the rich or idealists just
recently, to now becoming accepted by all social groups. A series of recent statements, by
car OEM's and world leaders, offer a genuine commitment
A series of recent statements, by car OEM's and world leaders, offer a genuine commitment
to the transformation process of the transport sector towards a more environmentally
orientated future. Analysts from Bloomberg predict that electric vehicles will become price
competitive with ICE vehicles even with the absence of government subsidies in 2022. The
commitment requires actions, auto OEM's such as Tesla, Volkswagen and Volvo are
currently preparing a series of new and innovative EV models with a focus, on price
reduction and more functional design compared to the predecessors. Volvo stated that they
plan to sell a total of 1 million electrified cars by 2025, where the number now is 10.380 in
the Nordics. Volvo also proclaimed the end of the solely combustion engine-powered car by
2019, however, they did not provide a timetable on when they plan to turn off the internal-
combustion engines finally (Guardian Media Group, 2017). The Volkswagen emissions
scandal raised awareness on the high levels of pollution being emitted by ICE vehicles,
especially diesels models. It could be argued that the scandal showed that limits of the
possiblities with the diesel and petrol technology. As a result of the scandal, several
European counties including, England, Germany, France while the Netherlands consider
legal restrictions on ICE vehicles in the future
29THEME SECTION │MOBILITY DRIVEN BY ELECTRICITY: EXPERIENCES FROM THE PAST SIX YEARS
CAR SALES IN TOTALPercentages of cars sold across the Nordics Q3 2017:
PHEVEVTotal sales of cars and vans
67,7%
89,37%
98,9% 94,8%
16,75%
15,6%
4,10%
FinlandNorway
Denmark Sweden
Nordics
1,10%
99,79%
5,75%
4,88%
0,39%
0,70%
2,40%
0,43%
As a consequence of the Paris Agreement, Norway has the most aggressive plans as they
intend to go 100 % zero-emissions by 2030 while Germany and other countries push to end
sales of gas and diesel cars by 2030.
Skeptics may regard those statements as wishful thinking. Everything considered, just 1.1 %
(10,63 % in the Nordics) of all new cars registered globally in 2016 were EVs. Furthermore,
several of the more popular EV models are still noteworthy expensive to buy compared to
the fossil-fuel version of the same vehicle. EVs still encounter challenges, however, they
managed to gain ground significantly quicker than was believed possible just a few years
back. In 2016, there were two million EVs registered worldwide, up 60 percent from 2015,
according to International Energy Agency (IEA). In the same period, the EVs registered in the
Nordics rose 61% from 100.910 to 162.758. The expense of batteries, the most costly
component of the vehicle, declined by more than 50 % between 2012 and 2016, according
to IEA. Researchers state the price of EVs will be at equivalent level with ICE vehicles if
battery prices approach the 85€ per kilowatt-hour mark, which by experts is assumed likely
to happen in just a few years, especially when Tesla indicates that they are capable of
producing batteries at the 110€ mark. Also, Toyota intends to commercialize solid-state EV
batteries by the early 2020s (GTM,2017).
Not all industries will embrace the movement from ICE to EV transportation. The fossil fuel
segment will most likely have a defensive market strategy as their business base will be
disrupted by the new market conditions (Forbes, 2017) . However, anyone who considers
doing business within the vehicle industry in the future will transfer themselves across to
electrification sooner or later.
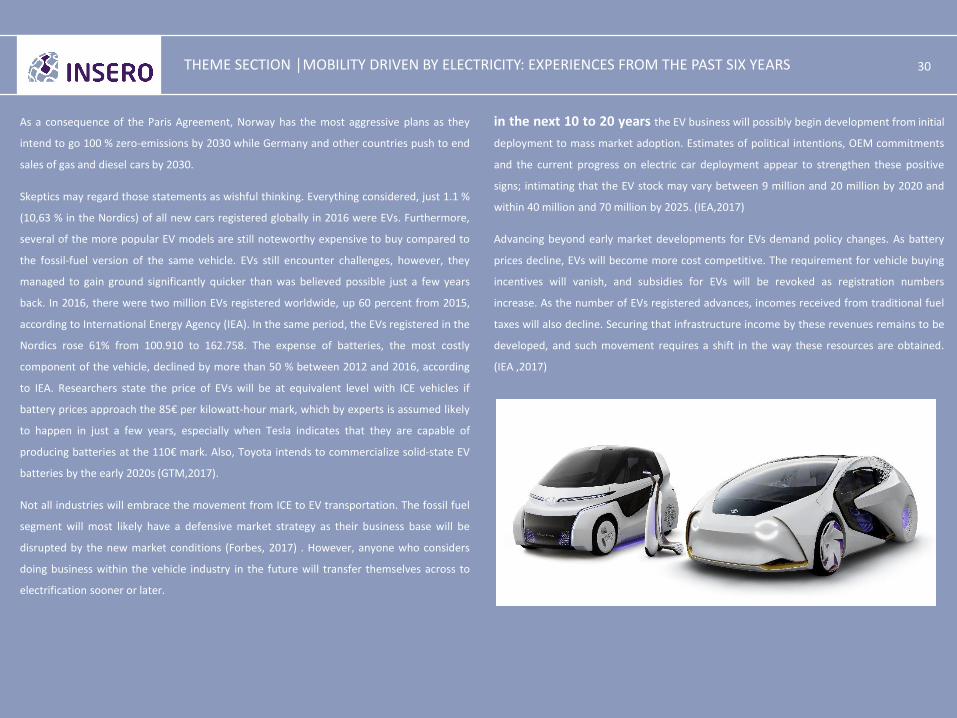
in the next 10 to 20 years the EV business will possibly begin development from initial
deployment to mass market adoption. Estimates of political intentions, OEM commitments
and the current progress on electric car deployment appear to strengthen these positive
signs; intimating that the EV stock may vary between 9 million and 20 million by 2020 and
within 40 million and 70 million by 2025. (IEA,2017)
Advancing beyond early market developments for EVs demand policy changes. As battery
prices decline, EVs will become more cost competitive. The requirement for vehicle buying
incentives will vanish, and subsidies for EVs will be revoked as registration numbers
increase. As the number of EVs registered advances, incomes received from traditional fuel
taxes will also decline. Securing that infrastructure income by these revenues remains to be
developed, and such movement requires a shift in the way these resources are obtained.
(IEA ,2017)
30THEME SECTION │MOBILITY DRIVEN BY ELECTRICITY: EXPERIENCES FROM THE PAST SIX YEARS

31INSERO QUARTERLY, Q3 2017
6. SOURCES & CONTACT US 31
TABLE OF CONTENTS
3. CHARGING INFRASTRUCTURE OVERVIEW 22
2. NORDIC SALES STATISTICS FROM Q3 2017 11
1. EXECUTIVE SUMMARIES – NORDIC AND NATIONAL 5
4. NATIONAL INCENTIVES FOR ELECTRIC VEHICLES 24
5. INSERO QUARTERLY THEME: EVS30 - Mobility driven by electricity 26

32Nordic │ During the compilation of Insero Quarterly, we have used the various sources listed below. Thanks!
For more information, feel free to contact us today.
SALES STATISTICS:
▪ BIL Sweden
▪ Oplysningsrådet for Veitrafikken AS
▪ TRAFI – Liikenteen Turvallisuusvirasto
▪ De Danske Bilimportører
CHARGING INFRASTRUCTURE AND EV INCENTIVES:
▪ E.ON Denmark, Clever, CleanCharge
▪ NOBIL
▪ PowerCircle
▪ HELEN
▪ Statens vegvesen Norway
▪ Skatteverket Sweden
▪ Transportstyrelsen Sweden
▪ Energistyrelsen Denmark
▪ TRAFI Liikenteen Turvallisuusvirasto
6. SOURCES & CONTACT US
CONTACT US
Subscribe to Insero Quarterly
If you like the content of Insero Quarterly and want to receive it in
your inbox every quarter, you can do so by filling out this form.
If you are interested in a more detailed analysis, get in touch with:
JENS CHRISTIAN MORELL LODBERG HØJCheif Innovator, E-Mobility
Phone: + 45 4112 5558E-mail: [email protected]

INTRODUCTION TO INSERO QUARTERLY
What is Insero Quarterly? A quarterly publication visually presenting and analysing:• Nordic electric vehicle (EV) and plug-in hybrid electric vehicle (PHEV) sales on a
quarterly basis, including Denmark, Norway, Sweden and Finland.• Overview of the charging infrastructure roll-out in the individual countries.• Status on the national EV incentives.• Cross-border price comparisons on specific EV models and conventional cars in
several car segments, including vans.• Theme section on relevant E-mobility related topics. This time it is a political
status on banning fossil-fueled cars.
Who is Insero Quarterly for?Insero Quarterly looks at the Nordic EV and PHEV market at a glance. If you need further information or market analysis, don’t hesitate to ask us. Our insight in the Nordic market is unparalleled. Here are some examples of what we can do:• Analyse the market potential for specific vehicles or types of vehicles• Derive data on customer preferences• Go-to-Market strategies for small to medium sized vehicle manufacturers• Analyse incentives and causality, and how it will influence your business• Industry mapping and technology reports• Strategic transport planning / economic and emission analysis• Component reports• V2X technology and business case analysis.
Why is Insero Quarterly relevant for my business?Insero Quarterly provides an unprecedented and continuously updated overview of the Nordic e-mobility market situation, which in turn leads to:• Concrete market data to form a basis for a strategic / product decision• Cohesive market insights• A common work of reference for the industry across the Nordic countries
Behind Insero QuarterlyInsero offers new solutions, projects and education within energy and ICT. We are leading experts on intelligent software, energy and e-mobility. We offer a variety of consultancy services ranging from operational consultancy to strategic analyses and
complete business strategies within e-mobility.
Smart Grid and V2XThis area is a core competence for Insero. We have worked extensively in R&D projects, living labs and consulting within this field for several years and use our knowledge and insights to help the energy sector, OEMs and SME vehicle manufacturers understand the business case and exploiting it.
Mobility and strategyE-Mobility is starting to penetrate several mobility markets along with other alternative fuels which will structurally change the way mobility works. We specialise in analysing mobility patterns and identifying sweet spots where new fuel types can contribute greatly to a mobility solution that is better integrated.
NEXT EDITIONThe next edition of Insero Quarterly (Q4 2017) will be out in early January 2018.
33INSERO QUARTERLY, Q3 2017
DISCLAIMER
The figures behind the statistical output in this publication are obtained from sources which we believe to be reliable. However, we accept no legal liability of any kind for the publication contents, nor any information contained therein, nor conclusions drawn from it by any part. Insero accepts no responsibility for the consequences of any actions resulting from the information in this publication.
All rights reserved. The publication may not be reproduced, stored in a retrieval system, or transmitted in any form or by any means without the prior consent of the publishers. Content may be used as long as Insero is clearly and visibly credited.