*LR+ = sensitivity/(1 – specificity); LR- = (1 – sensitivity)/specificity.

Discussion Paper No. 745
INPUT SPECIFICITY AND PRODUCT
DIFFERENTIATION
Noriaki Matsushima and
Tomomichi Mizuno
June 2009
The Institute of Social and Economic Research Osaka University
6-1 Mihogaoka, Ibaraki, Osaka 567-0047, Japan

Input specificity and product differentiation∗
Noriaki Matsushima†
Institute of Social and Economic Research, Osaka University
Tomomichi Mizuno
Competition Policy Research Center, Japan Fair Trade Commission
June 17, 2009
Abstract
Using a simple product differentiation model with elastic demands, we investigate the
relationship between differentiation strategies and vertical relations. Depending on the
competitive structure in the upstream market, three differentiation patterns (maximum,
minimum and partial differentiation) can appear in equilibrium even though each down-
stream firm freely determines the degree of product differentiation. When downstream
firms must incur positive investment costs to differentiate their products, they tend to do
so if the upstream market is competitive.
JEL classification numbers: L13.
Key words: oligopoly, product differentiation, upstream firm, input specificity
∗We would like to thank Masamichi Kawano, Toshihiro Matsumura, Keizo Mizuno, Dan Sasaki and theseminar participants at Kwansei Gakuin University and the Applied Economics Workshop (Tohoku University)for their helpful comments. The first author gratefully acknowledges financial support from a Grant-in-Aid forEncouragement of Young Scientists from the Japanese Ministry of Education, Science and Culture. Needlessto say, we are responsible for any remaining errors. The views expressed herein are those of the authors andshould not be interpreted as those of the Japan Fair Trade Commission.
†Corresponding author: Noriaki Matsushima, Institute of Social and Economic Research, Osaka Uni-versity, Mihogaoka 6-1, Ibaraki, Osaka 567-0047, Japan. Phone: +81-6-6877-1111 (Ex. 9170). E-mail:[email protected]
1 Introduction
Manufacturers often have relationships with many input suppliers. For instance, in the aircraft
industry, the jet (turboprop) engine and aircraft industries are vertically related. To produce
a differentiated product, aircraft firms must procure suitable but costly equipment. Engine
companies also have relations with many buyers, and potentially with all of them (Bonaccorsi
and Giuri (2001)). In the automobile industry, Toyota procures electric parts from many
input suppliers, including Denso, which is one of the largest auto part manufacturers.1 Denso
sometimes supplies other automobile manufacturers, for instance Daimler Chrysler. Thus, its
electrical parts may be used in automobiles from different manufacturers.
When manufacturers produce (horizontally) differentiated products, they sometimes face
constraints that stem from the technological capacities of suppliers. When those manufactur-
ers are able to negotiate with many suppliers of suitable inputs, they can procure those inputs
at reasonable prices. In contrast, when there are only a few suppliers of suitable inputs, the
manufacturers must pay higher prices. That is, competitiveness in input markets affects the
procurement conditions of manufacturers.
Because decisions on product positioning (differentiation), which is an important strategic
tool of firms, are influenced by such buyer–supplier relationships,2 some researchers investi-
gate the relationship between differentiation strategies and vertical relations. Using Hotelling
location models, Brekke and Straume (2004) and Matsushima (2004, 2008) discuss how up-
stream units affect the differentiation strategies of downstream firms.3 In Brekke and Straume
(2004), firms acquire inputs through bilateral monopoly relations with suppliers. They show
1 Ahmadjian and Lincoln (2001) research the vertical relationship between Toyota and Denso.
2 There are many studies on product positioning decisions. See, for instance, Hotelling (1929), d’Aspremont
et al. (1979), Hauser and Shugan (1983), Vandenbosch and Weinberg (1995), and Sayman, Hoch, and Raju
(2002).
3 Barcena-Ruiz and Casado-Izaga (2008) incorporate the sequential move of upstream prices (wages) into
the model of Brekke and Straume (2004). Using a Hotelling location model, Erkal (2007) also investigates how
the buyer–supplier relationship affects differentiation strategies.
1

that the existence of upstream suppliers enhances the degree of product differentiation. In
Matsushima (2004, 2008), each upstream firm that locates in a linear city engages in price
competition for the business of downstream firms. To supply one unit of input to a down-
stream firm, each upstream firm incurs a transport cost quadratic in distance. These papers
show that the degree of product differentiation decreases as the coefficient of the quadratic
transport cost incurred by each upstream firm increases. Although the settings of Brekke and
Straume (2004) and Matsushima (2004, 2008) are only slightly different, those papers provide
quite different results.
Although those researchers provide interesting insights into the relationship between dif-
ferentiation strategies and vertical relations, they only consider markets in which downstream
firms compete in price (strategic complement). Moreover, consumer demand is inelastic in
their models because they use Hotelling models. It is not obvious how vertical relations af-
fect the differentiation strategies of downstream firms when such firms compete in quantity
(strategic substitute). The aim of this paper is to investigate this problem. Moreover, a
further contribution of this paper is that our model succeeds in merging the previous three
papers into a simple duopoly model with elastic demand functions.
The model setting of the paper is as follows. There are two upstream and two down-
stream firms. Each downstream firm produces a differentiated final product, and must buy
an input from the upstream firms. Each downstream firm determines the degree of prod-
uct differentiation (denoted by γ). Each firm must incur investment costs to differentiate its
product (product R&D). We consider two cases concerning the competitive environment of
upstream firms. First, each upstream firm has a bilateral monopoly relation with its buyer (a
downstream firm). Second, each upstream firm faces competitive forces that can potentially
deprive it of its trade with its downstream partner. To supply one unit of input to a down-
stream firm, the potential suppliers must incur two additional marginal costs (k + τdi) that
depend on the degree of product R&D that the downstream firm undertakes (di ∈ [0, 1/2],
2

1− d1 − d2 = γ), where k and τ are positive constants. We can interpret the additional costs
of potential suppliers as being the conversion cost from the product of the upstream firm into
an input suitable for the downstream firm. After purchasing its input from an upstream firm,
each downstream firm sets the quantity to be supplied.
We show that when the investment cost for product R&D is zero, maximum differentiation
appears in equilibrium if k is large or τ is small. If k is small and τ is large, minimum
differentiation appears. If k has an intermediate value and τ is large, only one downstream
firm engages in product R&D. We also show that both minimum and maximum differentiation
appear in equilibrium if k is small and τ has an intermediate value. Moreover, we show that
when the investment cost for product R&D is positive, minimum differentiation tends to
appear in equilibrium if each upstream firm has a bilateral monopoly relation with its buyer
(a downstream firm). A slight difference in product R&D technologies leads to quite different
equilibrium outcomes in product differentiation. Those results are somewhat different from
Brekke and Straume (2004) and Matsushima (2004, 2008), and provide additional insights
into the discussion of the relationship between product differentiation and vertical relations.
The setting and the results of this paper are related to the case of the aircraft industry.4
There are two major firms in this industry, Airbus and Boeing. Those firms rely heavily on
firm-specific inputs (engines, wings, horizontal stabilizers) produced by independent manu-
facturers. For instance, Rolls Royce and CFM International (a joint venture between GE
and the French company Snecma) make highly specific turbofan engines for airplanes. Rolls
Royce made the Trent XWB turbofan engine to meet the specific requirements of the Airbus
A350 XWB family, and developed the Trent 900 series exclusively to power the new Airbus
A380. Furthermore, CFM International designed the CFM56-3 turbofan engine exclusively
for Boeing aircraft.5 Under the procurement condition, Airbus and Boeing have considered
4 This paragraph is based on the discussions in Beelaerts van Blokland et al. (2008), Nalebuff (2002), Esty
and Ghemawat (2002), and Tombak (2006).
5 In reality, these engine manufacturers sometimes supply both Airbus and Boeing if possible.
3

whether their products should be differentiated. At one time, Airbus and Boeing produced
highly differentiated aircraft (A380 and Boeing 787), however at other times, they produced
less-differentiated aircraft (the A340 and Boeing 747(777)) and competed directly.6 From this
real world example, we can say that the technological constraints of input suppliers crucially
affect the differentiation strategies of the two aircraft firms.
This paper is closely related to that of Lin and Saggi (2002). Using linear demand functions
with product differentiation, they discuss the relationship between process and product R&D.7
We add vertical relations to their model, and our motivation is quite different from theirs. Our
main concern is how the existence of upstream firms and competition between them affects
the differentiation strategies of downstream firms.8
The paper proceeds as follows. The next section outlines the basic environment. Section
3 provides an analysis of the model. Section 4 discusses the relationship between vertical
relations and differentiation strategies. Finally, Section 5 offers some concluding remarks.
6 The A3XX (which was rechristened the A380) program was formally launched in December 2000. After
that event, Boeing abandoned the Sonic Cruise development program and launched the 787 program because
of concerns about fuel efficiency in the ailing airline industry in 2002. Therefore, the A380 and Boeing 787
are highly differentiated. In 1987, Airbus launched the A330 and A340 airframes, which were designed to
compete with the Boeing 747 on medium- to long-distance routes. Boeing then postponed the 7J7 project to
develop a short-range 150-seat aircraft (which has the potential to differentiate its product line from that of
the large-scale intercontinental commercial jet market) and then developed the 777 airframe with technological
features, seating capacity and range similar to those of the A340.
7 Most subsequent studies of Lin and Saggi (2002) also focus on the complementarity of process and product
R&D, which is not the focus of this paper. See, for instance, Mantovani (2006) and Braun (2008).
8 There are discussions on how vertical structure affects incentives of upstream and/or downstream firms for
innovative activities. Given vertical market structures and competition environments, Ishii (2004) and Milliou
(2004) discuss spillover effects of R&D investments. Banerjee and Lin (2003), Brocas (2003), and Buehler
and Schmutzler (2008) focus on the relation of vertical market structure and cost-reducing investment in
oligopoly. These papers do not discuss how the existence of upstream firms affects the differentiation strategies
of downstream firms. Pepall and Norman (2001) also consider vertical relationships and product differentiation.
They consider vertical mergers and vertical foreclosure, but not endogenous product differentiation. In their
model, the degree of product differentiation of the downstream firms is exogenous.
4

2 The model
We consider a market with two downstream and two upstream firms. There is only one factor
of production, which we refer to as the input. Each firm produces a differentiated final good
in a constant-returns-to-scale process where one unit of the input becomes one unit of the
final good. Each downstream firm can perform this conversion at no cost.
We assume that the two downstream firms compete in quantity. Now let xi denote i’s
sales. The inverse demand function of firm i is given by
pi = 1 − xi − γxj , i = 1, 2, i = j. (1)
where pi is the price of the final good produced by i, and γ(∈ [0, 1]) indicates the degree of
product differentiation between the products. The lower the value of γ, the higher the degree
of product differentiation. The value of γ is determined by each firm’s investment in product
R&D, denoted by di (i = 1, 2).
We consider the downstream firm’s investments in product R&D. Following the setting in
Lin and Saggi (2002),9 we assume that the value of γ is determined by each downstream firm’s
investment in product R&D, denoted by di (i = 1, 2). The extent of product differentiation
is γ = 1 − (d1 + d2), and 0 ≤ di ≤ 1/2. The cost of product R&D is given by F (di), F ′ ≥ 0,
F ′′ ≥ 0.
Let zi denote the amount of input supplied by the supplier of firm i. Each input supplier
sets a wholesale price wi to maximize its profit function (without loss of generality, we assume
that the marginal cost is normalized to zero):
πUi = wizi, i = 1, 2. (2)
The fact that the input suppliers unilaterally set the wholesale prices implies that they possess
full bargaining power.9 See also Braun (2008), Cellini and Lambertini (2002), Lambertini et al. (1998), Rosenkranz (2003), and
Weiss (2003).
5

In this paper, we consider two cases concerning the technologies of upstream firms:
1. Neither upstream firm faces a competitor.
2. Each upstream firm faces competitors that are potentially able to supply the downstream
firms. If a competitor incurs a marginal cost, fi = τdi + k, it is able to supply input to
downstream firm i, where τ and k are positive constants, and di is the level of product
R&D engaged in by downstream firm i (i = 1, 2).
In the first case, each upstream firm is in a monopoly position with respect to its trading
partner, similar to the setting in Brekke and Straume (2004). In the second case, upstream
firms face potentially harmful competitive forces, which include rival upstream firms supplying
the downstream firm (that is, upstream firms i and j are potential competitors (i = 1, 2, i =
j)). For instance, as mentioned in the introduction, while Rolls Royce and CFM International
supply highly specific turbofan engines exclusively to Airbus and Boeing, respectively, these
engine suppliers are both potential suppliers of either Airbus or Boeing (in reality, these
engine manufacturers sometimes supply both Airbus and Boeing). Following the setting in
Matsushima (2004, 2008), we assume that the marginal cost fi is increasing in the degree of
product R&D, which is related to the degree of product differentiation. This case is a slightly
modified version of Matsushima (2004, 2008).10
We can interpret the first case as a special case of the second one. When k is sufficiently
high, potential competitors do not dare to supply inputs to a downstream firm because the
marginal cost is prohibitively high. Because the first case is technically simpler than the
second, we show both cases separately.
To summarize, we model the game structure as follows.
1. Each downstream firm engages in product R&D.
10 This setting is somewhat similar to that of Aiura and Sato (2008), who discuss the differentiation strategies
of firms in a Hotelling model.
6

2. Each upstream input supplier sets its wholesale price.
3. Given these prices, each firm simultaneously decides on a quantity to supply.
3 Analysis
3.1 No potential supplier
In this case, there is no potential competitor to the upstream firms. Upstream firm i unilat-
erally offers its wholesale price wi (i = 1, 2) to downstream firm i.
The profits of downstream firms 1 and 2 are:
πD1 ≡ (1 − x1 − γx2 − w1)x1 − F (d1), πD2 ≡ (1 − x2 − γx1 − w2)x2 − F (d2). (3)
The first-order conditions lead to:
x1 =2 − γ − 2w1 + γw2
4 − γ2, x2 =
2 − γ − 2w2 + γw1
4 − γ2. (4)
The profits of the input suppliers are:
πU1 =w1(2 − γ − 2w1 + γw2)
4 − γ2, πU2 =
w2(2 − γ − 2w2 + γw1)4 − γ2
. (5)
The first-order conditions lead to:
w1 = w2 =2 − γ
4 − γ. (6)
The equilibrium profits of the downstream and the upstream firms are:
πDi =4
(4 − γ)2(2 + γ)2− F (di) (i = 1, 2), πU1 = πU2 =
2(2 − γ)(4 − γ)2(2 + γ)
. (7)
3.2 Potential suppliers
In this case, potential suppliers can supply inputs to both downstream firms. If fi = τdi +k is
insufficiently large, upstream firm i faces the constraint that its wholesale price for downstream
firm i cannot exceed fi because other potential suppliers can undercut its wholesale price to
7

downstream firm i. Therefore, when we consider the determination of wholesale prices, we
must take into account the constraints.
The profits of downstream firms 1 and 2 are:
πD1 = (1 − x1 − γx2 − w1)x1 − F (d1), πD2 = (1 − x2 − γx1 − w2)x2 − F (d2). (8)
The first-order conditions lead to:
x1 =2 − γ − 2w1 + γw2
4 − γ2, x2 =
2 − γ − 2w2 + γw1
4 − γ2. (9)
The profits of the input suppliers are:
πU1 =w1(2 − γ − 2w1 + γw2)
4 − γ2, s.t. w1 ≤ f1, (10)
πU2 =w2(2 − γ − 2w2 + γw2)
4 − γ2, s.t. w2 ≤ f2. (11)
Without loss of generality, we assume that f1 ≥ f2, that is, d1 ≥ d2. In other words, the effort
of firm 1 in product R&D is more significant than that of firm 2. The first-order conditions
lead to:
w1 = k + τd1, w2 = k + τd2, if k ≤ k1,
w1 =2 − γ + γk + γτd2
4, w2 = k + τd2, if k1 < k ≤ k2,
w1 = w2 =2 − γ
4 − γ, if k2 < k,
(12)
where k1 ≡ 2 − γ − τ(4d1 − γd2)4 − γ
, k2 ≡ 2 − γ − τ(4 − γ)d2
4 − γ.
8

The equilibrium profits of the downstream and the upstream firms are:
(1)
πD1 =
((2 − γ)(1 − k) − 2τd1 + γτd2)2
(2 − γ)2(2 + γ)2− F (d1),
πD2 =((2 − γ)(1 − k) − 2τd2 + γτd1)2
(2 − γ)2(2 + γ)2− F (d2),
if k ≤ k1,
(2)
πD1 =
(2 − γ + γk + γτd2)2
4(2 − γ)2(2 + γ)2− F (d1),
πD2 =((8 − γ2)(1 − k) − 2γ − (8 − γ2)τd2)2
16(2 − γ)2(2 + γ)2− F (d2),
if k1 < k ≤ k2,
(3)
πD1 =
4(4 − γ)2(2 + γ)2
− F (d1),
πD2 =4
(4 − γ)2(2 + γ)2− F (d2),
if k2 < k.
(13)
(1)
πU1 =
(k + τd1)((2 − γ)(1 − k) − 2τd1 + γτd2)(2 − γ)(2 + γ)
,
πU2 =(k + τd2)((2 − γ)(1 − k) − 2τd2 + γτd1)
(2 − γ)(2 + γ),
if k ≤ k1,
(2)
πU1 =
(2 − γ + γk + γτd2)8(2 − γ)(2 + γ)
,
πU2 =(k + τd2)((8 − γ2)(1 − k) − 2γ − (8 − γ2)τd2)
4(2 − γ)(2 + γ),
if k1 < k ≤ k2,
(3)
πU1 =
2(2 − γ)(4 − γ)2(2 + γ)
,
πU2 =2(2 − γ)
(4 − γ)2(2 + γ),
if k2 < k.
(14)
4 Endogenous product differentiation
We now discuss how each downstream firm determines its products positions.
4.1 No investment cost (F = 0)
We now suppose that F = 0 for any di (i = 1, 2). Each downstream firm freely sets γ =
1 − d1 − d2 to maximize its own profit. We consider two cases: that with no competing
potential supplier and that with potential suppliers.
9

4.1.1 No potential supplier
Differentiating πDi with respect to di, we have:
∂πD1
∂d1=
∂πD2
∂d2=
16(d1 + d2)(3 − d1 − d2)3(3 + d1 + d2)3
≥ 0. (15)
Therefore, each downstream firm chooses di = 1/2 (i = 1, 2).
Proposition 1 When there is no potential competitor for either upstream firm, if F = 0 for
any di (i = 1, 2), d1 = d2 = 1/2 in equilibrium.
4.1.2 Potential suppliers
To clarify the analysis, we now restrict the choices of the downstream firms. We tentatively
assume that each downstream firm has only two options, di = 0 and di = 1/2 (i = 1, 2).
Because of the simplification, the game is reduced to a simple 2×2 matrix. In the main text,
we only solve the 2 × 2 matrix. Fortunately, we can show that the equilibrium outcomes
derived by the 2 × 2 matrix really appear as equilibrium outcomes in the game in which
each downstream firm freely sets di ∈ [0, 1/2] (i = 1, 2).11 Roughly speaking, in this setting,
the profit functions of the downstream firms are convex with respect to di. Therefore, the
boundaries, di = 0 and di = 1/2, may be the best candidates.
There are three cases, depending on the endogenous and exogenous variables: (1) k ≤ k1,
(2) k1 < k ≤ k2, and (3) k2 < k (see equation (12)). When each firm chooses di = 0
(i = 1, 2), that is, γ = 1, the first case appears if k ≤ 1/3 and the third case appears if
1/3 < k. When one downstream firm chooses di = 0 and another chooses dj = 1/2 (i = 1, 2,
i = j), that is, γ = 1/2, the first case appears if k ≤ (3 − 4τ)/7, the second case appears if
(3−4τ)/7 < k ≤ 3/7, and the third case appears if 3/7 < k. When each firm chooses di = 1/2
(i = 1, 2), that is, γ = 0, the first case appears if k ≤ (1 − τ)/2 and the third case appears if
(1 − τ)/2 < k. We summarize the discussion in the following figure.11 The calculus is highly complex but does not provide any economic information. The calculus is available
from the authors on request.
10

*************************
Figure 1 here
*************************
In Figure 1, (1), (2), and (3) refer to the equation number in equation (13) that applies to each
region. For instance, suppose that the values of k and τ are in region (e). When d1 = d2 = 0,
the third profit function (3) in equation (13) applies; when di = 0 and dj = 1/2, the second
profit function (2) in equation (13) applies; when d1 = d2 = 1/2, the first profit function (1) in
equation (13) applies. The payoff matrix is described in Table 1 (note that, γ = 1− d1 − d2).
*************************
Table 1 here
*************************
In region (e), both firms choose di = 1/2 (i = 1, 2) in equilibrium if k > 15τ − 3, otherwise
a firm chooses di = 0 and another firm chooses dj = 1/2 (i = 1, 2, i = j) in equilibrium. We
can apply this argument to all eight regions. Solving the payoff matrices for the eight regions,
we have Proposition 2.
Proposition 2 When there are potential competitors for the upstream firms, if F = 0 for
any di (i = 1, 2), depending on the exogenous values (k and τ), the following outcome appears
in equilibrium:
d1 = d2 = 1/2 if
k ≤ 33/109 and k ≤ (6 − 19τ)/6 or33/109 ≤ k ≤ 12/31 and k ≥ 15τ − 3 or12/31 ≤ k,
d1 = 0 d2 = 1/2 if 1/3 ≤ k ≤ 12/31 and k ≤ 15τ − 3,
d1 = d2 = 0 if k ≤ 1/3 and k ≥ 1 − 4τ.
(16)
Proof: See Appendix.
The result is summarized in Figure 2.
11

*************************
Figure 2 here
*************************
We now mention the intuition behind Proposition 2. In this setting, when a downstream
firm enhances its degree of product differentiation (increases in di), it has a benefit and a
cost. The benefit stems from the mitigation of competition between the downstream firms.
The cost stems from the increase in its procurement cost if the competitive force of potential
suppliers (their marginal costs are k + τdi) is effective.
When τ is small, because the increase in di is less effective in increasing the procurement
cost (k + τdi), both downstream firms enhance the degree of product differentiation (see the
left side in Figure 2).
When k is small (k ≤ 1/3), there can be two equilibria if τ is in the medium range
((1− k)/4 ≤ τ ≤ 6(1− k)/19 if k < 33/109, (1− k)/4 ≤ τ ≤ (k + 3)/15 if 33/109 ≤ k < 1/3).
That is, strategic complementarity concerning the strategies of product differentiation exists
(see the lower central area in Figure 2). When a downstream firm engages in product R&D,
this investment mitigates the competition between the downstream firms and enhances the
profits of both. The increase in the profit of the downstream firm that does not engage in
product R&D provides greater incentive to do so. On the other hand, when a downstream
firm does not engage in product R&D, the profit levels of both downstream firms are not
large. Because of the limited profitability, product R&D undertaken by a downstream firm
does not compensate for the increase in its procurement cost k + τdi. Therefore, if τ is in the
medium range, two equilibrium outcomes can appear.
If k is small and τ is sufficiently large, no downstream firm engages in product R&D
because the increase in the procurement cost (k + τdi) is significant (see the lower right side
of Figure 2).
When k is large, another interesting property can appear. Before we mention this property,
12

we explain the relationship between wholesale prices and the value of k. In this model, k = 1/3
is a critical value concerning the strategies of product differentiation. If k is larger than 1/3,
potential suppliers do not function as a constraint on upstream firms when downstream firms
do not engage in product R&D (that is, d1 = d2 = 0 and γ = 1 − d1 − d2 = 1). From
the discussion of Section 3.1, when each upstream firm monopolistically supplies input, the
wholesale price is wi = (2 − γ)/(4 − γ) = 1/3, which is smaller than k if no downstream firm
engages in product R&D (d1 = d2 = 0).
When k is larger than 1/3 but is insufficiently large, if a downstream firm engages in
product R&D, the price set by the upstream firm that supplies to another downstream firm
becomes binding because the increase in the degree of product differentiation enhances the
incentive for the upstream firms to set their prices at higher levels. This is because wi in
(6) is decreasing in γ. Because the price of the upstream firm that supplies the nonengaging
downstream firm (call it firm i) is binding, the wholesale price for firm i is positively correlated
with the value of di. This feature of the wholesale price diminishes the incentive of firm i to
engage in product R&D. Therefore, if k is in the medium range (1/3 < k < 12/31) and the
value of τ is large (τ > (k + 3)/15), only one downstream firm engages in product R&D (see
the upper right side of Figure 2). In this case, the profit of the engaging downstream firm is
smaller than that of the nonengaging downstream firm.
4.2 Positive investment cost
From the discussion in the previous subsection, one may conclude that the degree of product
differentiation is large even when k is large. We now show that this conclusion is not always
true.
Following the discussion of Lin and Saggi (2002), we now suppose that each downstream
firm has to incur an investment cost for its product R&D. We now specify the investment cost
as F (di) = cd2i /2. The marginal investment cost is F ′(di) = cdi.
13

4.2.1 No potential supplier
Substituting γ = 1 − (d1 + d2) into πD1 and πD2, we have:
πDi =4
(3 + d1 + d2)2(3 − d1 − d2)2− cd2
i /2, (i = 1, 2). (17)
Differentiating πDi with respect to di, we have:
∂πDi
∂di=
16(d1 + d2)(3 + d1 + d2)3(3 − d1 − d2)3
− cdi. (18)
We now provide three equilibrium outcomes that include minimum differentiation. Given
that d2 = 0, the marginal benefit from the investment (the partial derivative of ΠD1 ≡
πD1 + F (d1)) is zero when d1 = 0.
*************************
Figure 3 here
*************************
If c is large enough, firm 1 also chooses d1 = 0. We have the following proposition:
Proposition 3 Suppose that F (di) = cd2i /2 for any di ∈ [0, 1/2] (i = 1, 2). d1 = d2 = 0 is
an equilibrium outcome if c > 2272/99225 ≃ 0.02230. The profits of the downstream and the
upstream firms are:
πDi =481
, πUi =227
. (19)
Proof: Given that d2 = 0, differentiating πD1 with respect to d1, we have,
∂πD1
∂d1
∣∣∣∣d2=0
=d1(16 − c(3 − d1)3(3 + d1)3)
(3 − d1)3(3 + d1)3. (20)
Because (3 − d1)3(3 + d1)3 is decreasing in d1 ∈ [0, 1/2], the partial derivative is (i) always
positive or (ii) negative (resp. positive) if d1 is small (resp. large) or (iii) always negative.
Therefore, the net profit of firm 1 is maximized when d1 = 0 or d1 = 1/2. If d1 = 0 maximizes
14
the net profit, d1 = d2 = 0 is an equilibrium outcome. When d1 = 0, the net profit is 4/81.
When d1 = 1/2, it is (512 − 1225c)/9800. A simple calculation (4/81 − (512 − 1225c)/9800)
leads to this proposition. Q.E.D.
Given that d2 = 1/2, the marginal benefit from firm 1’s investment is always positive (see
Figure 4).
*************************
Figure 4 here
*************************
If c is small enough, firm 1 also chooses d1 = 1/2. We have the following proposition:
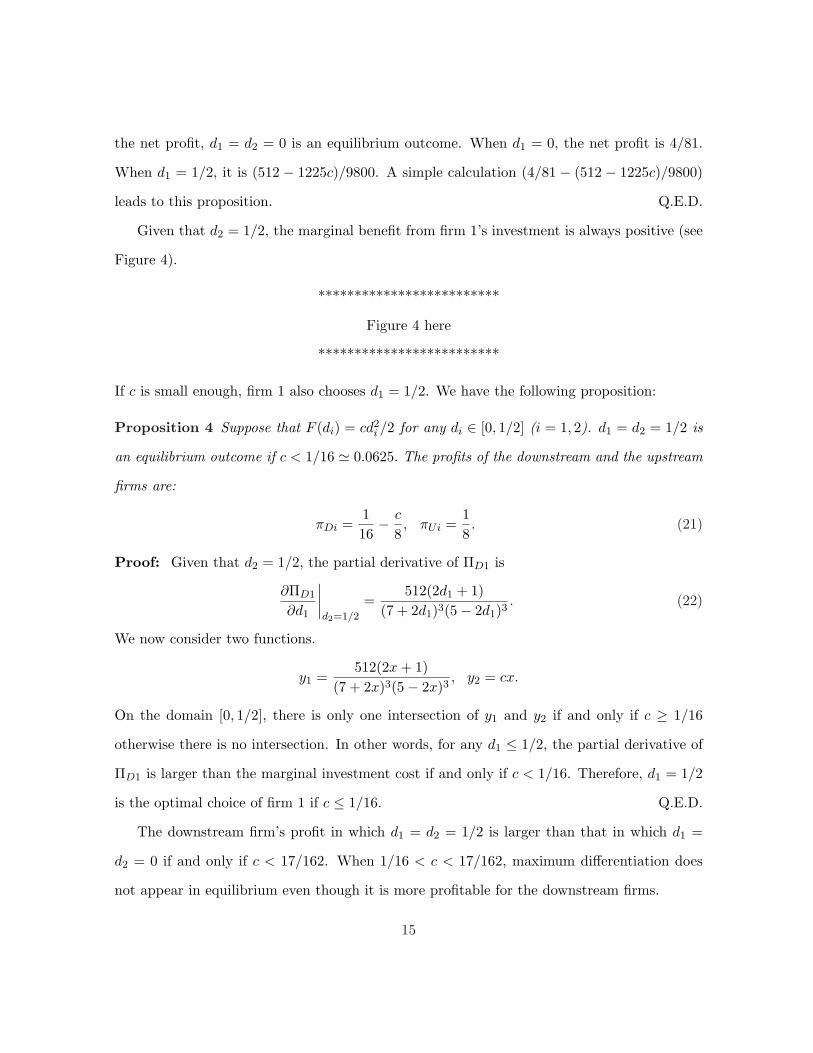
Proposition 4 Suppose that F (di) = cd2i /2 for any di ∈ [0, 1/2] (i = 1, 2). d1 = d2 = 1/2 is
an equilibrium outcome if c < 1/16 ≃ 0.0625. The profits of the downstream and the upstream
firms are:
πDi =116
− c
8, πUi =
18. (21)
Proof: Given that d2 = 1/2, the partial derivative of ΠD1 is
∂ΠD1
∂d1
∣∣∣∣d2=1/2
=512(2d1 + 1)
(7 + 2d1)3(5 − 2d1)3. (22)
We now consider two functions.
y1 =512(2x + 1)
(7 + 2x)3(5 − 2x)3, y2 = cx.
On the domain [0, 1/2], there is only one intersection of y1 and y2 if and only if c ≥ 1/16
otherwise there is no intersection. In other words, for any d1 ≤ 1/2, the partial derivative of
ΠD1 is larger than the marginal investment cost if and only if c < 1/16. Therefore, d1 = 1/2
is the optimal choice of firm 1 if c ≤ 1/16. Q.E.D.
The downstream firm’s profit in which d1 = d2 = 1/2 is larger than that in which d1 =
d2 = 0 if and only if c < 17/162. When 1/16 < c < 17/162, maximum differentiation does
not appear in equilibrium even though it is more profitable for the downstream firms.
15

For intermediate values of c, there can be another symmetric equilibrium. We now suppose
that d1 = d2 = x. The first-order condition of each firm is
32x
(3 + 2x)3(3 − 2x)3− cx = 0 → xe ≡ 1
2
√9 − 2
(4c
)1/3
. (23)
We can show that given dj = xe, the optimal choice of firm i is di = dj = xe. In this case,
the profits of the downstream and upstream firms are (see Figure 5):
πDi =4
(3 + 2xe)2(3 − 2xe)2− c(xe)2
2, πUi =
2(1 + 2xe)(3 + 2xe)2(3 − 2xe)
. (24)
*************************
Figure 5 here
*************************
Figure 6 provides an example in which multiple equilibria appear when c is an intermediate
value. In Figure 6, given that dj = 1/10, the optimal choice of firm i is also di = 1/10.
Moreover, given that dj = 1/2, the optimal choice of firm i is also di = 1/2. Both cases can
appear as equilibrium outcomes. xe has an interesting property. As the coefficient of the
marginal investment cost increases, xe increases.
*************************
Figure 6 here
*************************
Summary The above discussion is summarized in Figure 7.
*************************
Figure 7 here
*************************
This result is in contrast with that in Brekke and Straume (2004). Using a Hotelling location
model with upstream units, they show that the existence of those upstream units enhances
16
the degree of product differentiation.12 In our setting, however, upstream units may diminish
the degree of product differentiation. To prove that the statement is true, we reconsider the
setting of Lin and Saggi (2002) (there is no upstream unit). In their model, the profit of
each (downstream) firm and the marginal gain of product innovation are (we assume that the
marginal cost is h and the demand functions are the same ones discussed here):
πi =(1 − h)2
(3 − di − dj)2,
∂πi
∂di=
2(1 − h)2
(3 − di − dj)3, i = j. (25)
Because the marginal gain from the product innovation is positive for any dj ∈ [0, 1/2], the
equilibrium investment levels must be positive for any c (note that the marginal cost of the
investment is cdi). Therefore, we find that if c is large, the existence of upstream units
diminishes the degree of product differentiation.
4.2.2 Potential suppliers
In this part, our main focus is the comparison between the case in which each upstream firm
monopolistically supplies its input, and that in which it faces potential input suppliers. We
only discuss region (a) in the previous subsection. That is, for any di ∈ [0, 1] the first equation
in equation (13) applies. Substituting γ = 1 − (d1 + d2) into πD1 in equation (13), we have:
πD1 =((1 + d1 + d2)(1 − k) − (2d1 − d2 + d1d2 + d2
2)τ)2
(3 − d1 − d2)2(1 + d1 + d2)2− cd2
1/2. (26)
Differentiating πDi with respect to di, we have:
∂πD1
∂d1=
2((1 + d1 + d2)(1 − k) − (2d1 − d2 + d1d2 + d22)τ)
(3 − d1 − d2)3(1 + d1 + d2)3(27)
×((1 + d1 + d2)2(1 − k) − (6 + 2d21 + (9 − 2d1 + d2
1)d2 − 2(2 − d1)d22 + d3
2)τ) − cd1.
12 Note that, in their model, there is no investment cost for product innovation. Even though we introduce
the product innovation costs discussed here into their model, the main result of their paper holds. That is,
upstream units enhance the degree of product differentiation in Brekke and Straume (2004).
17

Given that d2 = 0, if the partial derivative is strictly positive, then the optimal value of d1 is
positive. Substituting d2 = 0 into the partial derivative, we have:
∂πD1
∂d1
∣∣∣∣d2=0
=2((1 + d1)(1 − k) − 2d1τ)
27
× ((1 − k + 2τ)d21 + 2(1 − k)d1 + (1 − k − 6τ)) − cd1. (28)
If k + 6τ < 1, when d1 = 0, this is positive for any c(> 0). From the discussion, we have the
following proposition:
Proposition 5 If k + 6τ < 1, the value of γ is lower than 1 for any c.
The small values of k and τ mean that upstream market competition is intense. In other words,
if the procurement conditions for the downstream firms are preferable, the downstream firms
tend to differentiate their products.
5 Concluding remarks
Using a simple product differentiation model with elastic demands, we investigate the relation-
ship between differentiation strategies and vertical relations. Depending on the competitive
structure in the upstream market, three differentiation patterns (maximum, minimum, and
partial) can appear in equilibrium even though each downstream firm freely determines the
degree of product differentiation. These results are somewhat different from those of previous
studies (Brekke and Straume (2004) and Matsushima (2004, 2008)) that discuss how upstream
units affect the differentiation strategies of downstream firms. Our model provides additional
insights into the relationship between product differentiation and vertical relations.
We only consider the quantity-setting model. If we employed a price-setting model, the
competition structure in the downstream market would be quite different. Although a price-
setting model is more complex than the quantity-setting model employed in this paper, in-
vestigating a price-setting model may be considered for future research.
18

References
Ahmadjian, C. L. and J. R. Lincoln. 2001. Keiretsu, governance, and learning: Case studies
in change from the Japanese automotive industry. Organization Science 12, pp. 683–701.
Aiura, H. and Y. Sato. 2008. Welfare properties of spatial competition with location depen-
dent costs. Regional Science and Urban Economics 38, pp. 32–48.
Banerjee, S. and P. Lin. 2003. Downstream R&D, raising rivals’ costs, and input price
contracts. International Journal of Industrial Organization 21, pp. 79–96.
Barcena-Ruiz, J.C. and F.J. Casado-Izaga. 2008. Timing of endogenous bargaining over costs
and firms’ locations. Journal of Economics 95, pp. 149–166.
Beelaerts van Blokland, W.W.A., W.J.C. Verhagen, and S.C. Santema. 2008. The effects of
co-innovation on the value-time curve: A quantitative study on product level. Journal of
Business Market Management 2, pp. 5–24.
Belleflamme, P. and E. Toulemonde. 2003. Product differentiation in successive vertical
oligopolies. Canadian Journal of Economics 36, pp. 523–545.
Bonaccorsi, A. and P. Giuri. 2001. The long-term evolution of vertically-related industries.
International Journal of Industrial Organization 19, pp. 1053–83.
Buehler, S. and A. Schmutzler. 2008. Intimidating competitors—Endogenous vertical in-
tegration and downstream investment in successive oligopoly. International Journal of
Industrial Organization 26, pp. 247–265.
Braun, S. 2008. Economic integration, process and product innovation, and relative skill
demand. Review of International Economics 16, pp. 864–873.
Brekke, K. and O.R. Straume. 2004. Bilateral monopolies and location choice. Regional
Science and Urban Economics 34, pp. 275–288.
19

Brocas, I. 2003. Vertical integration and incentives to innovate. International Journal of
Industrial Organization 21, pp. 457–488.
Cellini, R. and L. Lambertini. 2002. A differential game approach to investment in product
differentiation. Journal of Economic Dynamics and Control 27, pp. 51–62.
d’Aspremont, C., J.J. Gabszewicz, and J.-F. Thisse. 1979. On Hotelling’s ‘stability in com-
petition’. Econometrica 47, pp. 1145–1150.
Eaton, B. C. and N. Schmitt. 1994. Flexible manufacturing and market structure. American
Economic Review 84, pp. 875–888.
Erkal, N. 2007. Buyer-supplier interaction, asset specificity, and product choice. International
Journal of Industrial Organization 25, pp. 988–1010.
Esty, B. and P. Ghemawat. 2002. Airbus vs. Boeing in superjumbos: A case of failed
preemption. HBS Strategy Unit Working Paper No. 02-061.
Hauser, J.R. and S.M. Shugan. 1983. Defensive marketing strategies. Marketing Science 2,
pp. 319–60.
Hotelling, H. 1929. Stability in competition. Economic Journal 39, pp. 41–57.
Ishii, A. 2004. Cooperative R&D between vertically related firms with spillovers. International
Journal of Industrial Organization 22, pp. 1213–1235.
Lambertini, L., S. Poddar, and D. Sasaki. 1998. Standardization and the stability of collusion.
Economics Letters 58, pp. 303–310.
Lin, P. and K. Saggi. 2002. Product differentiation, process R&D, and the nature of market
competition. European Economic Review 46, pp. 201–211.
Matsushima, N. 2004. Technology of upstream firms and equilibrium product differentiation.
International Journal of Industrial Organization 22, pp. 1091–1114.
20

Matsushima, N. 2008. Vertical mergers and product differentiation. Journal of Industrial
Economics, forthcoming.
Mantovani, A. 2006. Complementarity between product and process innovation in a monopoly
setting. Economics of Innovation and New Technology 15, pp. 219–234.
Milliou, C. 2004. Vertical integration and R&D information flow: is there a need for ‘fire-
walls’? International Journal of Industrial Organization 22, pp. 25–43.
Nalebuff, B. 2002. Bundling and the GE-Honeywell Merger. Yale School of Management,
Working Paper 22.
Norman, G. and J.-F. Thisse. 1999. Technology choice and market structure: strategic aspect
of flexible manufacturing. Journal of Industrial Economics 47, pp. 345–372.
Pepall, L. and G. Norman. 2001. Product differentiation and upstream–downstream relations.
Journal of Economics and Management Strategy 10, pp. 201–233.
Roller, L.-H. and M.M. Tombak. 1993. Competition and investment in flexible technologies.
Management Science 39, pp. 107–114.
Rosenkranz, S. 2003. Simultaneous choice of process and product innovation when consumers
have a preference for product variety. Journal of Economic Behavior and Organization 50,
pp. 183–201.
Sayman, S., S.J. Hoch, and J.S. Raju. 2002. Positioning of store brands. Marketing Science
21, pp. 378–397.
Tombak, M.M. 2006. Strategic asymmetry. Journal of Economic Behavior and Organization
61, pp. 339–350.
Vandenbosch, M.B. and C.B. Weinberg. 1995. Product and price competition in a two-
dimensional vertical differentiation model. Marketing Science 14, pp. 224–249.
21

Weiss, P. 2003. Adoption of product and process innovations in differentiated markets: The
impact of competition. Review of Industrial Organization 23, pp. 301–314.
22

Table 1: An example of a payoff matrix
d2 = 0 d2 = 1/2d1 = 0 4/81 (3 + k)2/225
4/81 (27 − 31k)2/3600d1 = 1/2 (27 − 31k)2/3600 (2 − 2k − τ)2/16
(3 + k)2/225 (2 − 2k − τ)2/16
23

τ
k
0 1/2
1/2
1/3
3/7(g) (h)
(d) (e) (f)
(b)(c)
(a)
Region di = 0 di = 0, dj = 1/2 di = 1/2(a) (1) (1) (1)(b) (1) (2) (1)(c) (1) (2) (3)(d) (3) (1) (1)(e) (3) (2) (1)(f) (3) (2) (3)(g) (3) (3) (1)(h) (3) (3) (3)
Figure 1: The relationship between k, τ , and the profit functions in Eq. (13).
24

0.1 0.2 0.3 0.4 0.5Τ
0.1
0.2
0.3
0.4
0.5
k
H1�2,1�2L
H1�2,0L
H0,0L
H1�2,1�2L
H0,0L
0.1 0.2 0.3 0.4 0.5Τ
0.1
0.2
0.3
0.4
0.5
k
Figure 2: The equilibrium outcome.
25

di
∂ΠDi/∂di
0
0.01
0.005
0.5
Figure 3: The marginal benefit from firm 1’s investment (d2 = 0).
26

di
∂ΠD1/∂di
0
0.015
0.5
0.03
Figure 4: The partial derivative of πD1 (d2 = 1/2).
27

D(di = xe)
D(di = 0.5)
D(di = 0)
0.056
0.054
0.052
0.050
0.0450.050
0.055 0.060c
U
0.12
0.11
0.10
0.09
0.08
0.0450.050
0.055 0.060
U
U(di = 0.5)
U (di = xe)
U (di = 0)
c
(downstream firm) (upstream firm)
Figure 5: The profits of the downstream and the upstream firms.
28

di0
0.015
0.5
0.03
0.1
∂ΠDi/∂di, cdi
∂ΠDi/∂di (d2 = 0.5)
∂ΠDi/∂di (d2 = 0.1)
cdi
Figure 6: Complementarity between the choices of di (c = 15625/351232).
29

227299225
116
c0
di
0.5
32729
Figure 7: Multiple equilibria
30

Technical appendix
Proof of Proposition 2 We must verify the equilibrium outcomes in the eight regions in
Figure 1.
Region (a): The values of k and τ are in region (a). For any di (i = 1, 2), the first profit
function (1) in equation (13) applies. The payoff matrix is described as follows (note that,
γ = 1 − d1 − d2 and we assume that F (di) = 0 in this section):
d2 = 0 d2 = 1/2
d1 = 0(1 − k)2
94(3 − 3k − 2τ)2
225(1 − k)2
9(6 − 6k + τ)2
225
d1 = 1/2(6 − 6k + τ)2
225(2 − 2k − τ)2
164(3 − 3k − 2τ)2
225(2 − 2k − τ)2
16
Given that d2 = 0, firm 1 also chooses d1 = 0 if
(1 − k)2
9− 4(3 − 3k − 2τ)2
225=
(k − (1 − 4τ))(11 − 11k − 4τ)225
≥ 0.
We find that both firms choose di = 0 (i = 1, 2) in equilibrium if k ≥ 1 − 4τ . Given that
d2 = 1/2, firm 1 also chooses d1 = 1/2 if
(2 − 2k − τ)2
16− (6 − 6k + τ)2
225=
(6 − 19τ − 6k)(54 − 54k − 11τ)3600
≥ 0.
We find that both firms choose di = 1/2 (i = 1, 2) in equilibrium if k ≤ (6−19τ)/6. From the
discussion, we find that no case in which only one firm chooses di = 0 appears in equilibrium
because there is no k that satisfies both k ≤ 1 − 4τ and k ≥ (6 − 19τ)/6.
Region (b): The values of k and τ are in region (b). When d1 = d2 = 0 or d1 = d2 = 1/2,
the first profit function (1) in equation (13) applies. When di = 0 and dj = 1/2 (i = 1, 2,
i = j), the second profit function (2) in equation (13) applies. The payoff matrix is described
as follows (note that, γ = 1 − d1 − d2 and we assume that F (di) = 0 in this section):
31

d2 = 0 d2 = 1/2
d1 = 0(1 − k)2
9(3 + k)2
225(1 − k)2
9(27 − 31k)2
3600
d1 = 1/2(27 − 31k)2
3600(2 − 2k − τ)2
16(3 + k)2
225(2 − 2k − τ)2
16
Given that d2 = 0, firm 1 also chooses d1 = 0 if
(1 − k)2
9− (3 + k)2
225=
8(2 − k)(1 − 3k)225
≥ 0.
We find that both firms choose di = 0 (i = 1, 2) in equilibrium for any k and τ . Given that
d2 = 1/2, firm 1 also chooses d1 = 1/2 if
(2 − 2k − τ)2
16− (27 − 31k)2
3600=
(3 − 15τ + k)(57 − 61k − 15τ)3600
≥ 0.
We find that both firms choose di = 1/2 (i = 1, 2) in equilibrium if k ≥ 15τ − 3. Given that
d2 = 0, firm 1 chooses d1 = 1/2 if
(1 − k)2
9− (3 + k)2
225=
8(2 − k)(1 − 3k)225
≤ 0
(2 − 2k − τ)2
16− (27 − 31k)2
3600=
(3 − 15τ + k)(57 − 61k − 15τ)3600
≤ 0.
We find that only one firm chooses di = 0 in equilibrium if k = 1/3 and τ ≥ 2/9.
Region (c): The values of k and τ are in region (c). When d1 = d2 = 0, the first profit
function (1) in equation (13) applies. When di = 0 and dj = 1/2 (i = 1, 2, i = j), the second
profit function (2) in equation (13) applies. When d1 = d2 = 1/2, the third profit function (3)
in equation (13) applies. The payoff matrix is described as follows (note that, γ = 1− d1 − d2
and we assume that F (di) = 0 in this section):
32

d2 = 0 d2 = 1/2
d1 = 0(1 − k)2
9(3 + k)2
225(1 − k)2
9(27 − 31k)2
3600
d1 = 1/2(27 − 31k)2
3600116
(3 + k)2
225116
Given that d2 = 0, firm 1 also chooses d1 = 0 if
(1 − k)2
9− (3 + k)2
225=
8(2 − k)(1 − 3k)225
≥ 0.
We find that both firms choose di = 0 (i = 1, 2) in equilibrium for any k and τ . Given that
d2 = 1/2, firm 1 also chooses d1 = 1/2 if
116
− (27 − 31k)2
3600= −(42 − 31k)(12 − 31k)
3600≥ 0.
We find that no case in which both firms choose di = 1/2 (i = 1, 2) appears in equilibrium.
Given that d2 = 0, firm 1 chooses d1 = 1/2 if
(1 − k)2
9− (3 + k)2
225=
8(2 − k)(1 − 3k)225
≤ 0,
116
− (27 − 31k)2
3600= −(42 − 31k)(12 − 31k)
3600≤ 0.
We find that only one firm chooses di = 0 in equilibrium if k = 1/3.
Region (d): The values of k and τ are in region (d). When d1 = d2 = 0, the third profit
function (3) in equation (13) applies. In the remaining cases, the first profit function (1) in
equation (13) applies. The payoff matrix is described as follows (note that, γ = 1 − d1 − d2
and we assume that F (di) = 0 in this section):
33

d2 = 0 d2 = 1/2
d1 = 0481
4(3 − 3k − 2τ)2
225481
(6 − 6k + τ)2
225
d1 = 1/2(6 − 6k + τ)2
225(2 − 2k − τ)2
164(3 − 3k − 2τ)2
225(2 − 2k − τ)2
16
Given that d2 = 0, firm 1 also chooses d1 = 0 if
481
− 4(3 − 3k − 2τ)2
225= −4(14 − 9k − 6τ)(4 − 9k − 6τ)
2025≥ 0.
Because k ≤ (3 − 4τ)/7 in this region, the above inequality does not hold. We find that no
case in which both firms choose di = 0 (i = 1, 2) appears in equilibrium. Given that d2 = 1/2,
firm 1 also chooses d1 = 1/2 if
(2 − 2k − τ)2
16− (6 − 6k + τ)2
225=
(6 − 19τ − 6k)(54 − 54k − 11τ)3600
≥ 0.
We find that both firms choose di = 1/2 (i = 1, 2) in equilibrium for any k and τ . Given that
d2 = 0, firm 1 chooses d1 = 1/2 if
481
− 4(3 − 3k − 2τ)2
225= −4(14 − 9k − 6τ)(4 − 9k − 6τ)
2025≤ 0,
(2 − 2k − τ)2
16− (6 − 6k + τ)2
225=
(6 − 19τ − 6k)(54 − 54k − 11τ)3600
≤ 0.
We find that no case in which only one firm chooses di = 0 appears in equilibrium.
Region (e): The values of k and τ are in region (e). When d1 = d2 = 0, the third profit
function (3) in equation (13) applies. When di = 0 and dj = 1/2 (i = 1, 2, i = j), the second
profit function (2) in equation (13) applies. When d1 = d2 = 1/2, the first profit function (1)
in equation (13) applies. The payoff matrix is described as follows (note that, γ = 1− d1 − d2
and we assume that F (di) = 0 in this section):
34

d2 = 0 d2 = 1/2
d1 = 0481
(3 + k)2
225481
(27 − 31k)2
3600
d1 = 1/2(27 − 31k)2
3600(2 − 2k − τ)2
16(3 + k)2
225(2 − 2k − τ)2
16
Given that d2 = 0, firm 1 also chooses d1 = 0 if
481
− (3 + k)2
225= −(3k − 1)(19 + 3k)
2025≥ 0.
We find that both firms choose di = 0 (i = 1, 2) in equilibrium if k = 1/3. Given that
d2 = 1/2, firm 1 also chooses d1 = 1/2 if
(2 − 2k − τ)2
16− (27 − 31k)2
3600=
(3 − 15τ + k)(57 − 61k − 15τ)3600
≥ 0.
We find that both firms choose di = 1/2 (i = 1, 2) in equilibrium if k ≥ 15τ − 3. Given that
d2 = 0, firm 1 chooses d1 = 1/2 if
481
− (3 + k)2
225= −(3k − 1)(19 + 3k)
2025≤ 0,
(2 − 2k − τ)2
16− (27 − 31k)2
3600=
(3 − 15τ + k)(57 − 61k − 15τ)3600
≤ 0.
We find that only one firm chooses di = 0 in equilibrium if k ≤ 15τ − 3.
Region (f): The values of k and τ are on region (f). When d1 = d2 = 0 or d1 = d2 = 1/2,
the third profit function (3) in equation (13) applies. When di = 0 and dj = 1/2 (i = 1, 2,
i = j), the second profit function (2) in equation (13) applies. The payoff matrix is described
as follows (note that, γ = 1 − d1 − d2 and we assume that F (di) = 0 in this section):
35

d2 = 0 d2 = 1/2
d1 = 0481
(3 + k)2
225481
(27 − 31k)2
3600
d1 = 1/2(27 − 31k)2
3600116
(3 + k)2
225116
Given that d2 = 0, firm 1 also chooses d1 = 0 if
481
− (3 + k)2
225= −(3k − 1)(19 + 3k)
2025≥ 0.
We find that both firms choose di = 0 (i = 1, 2) in equilibrium if k = 1/3. Given that
d2 = 1/2, firm 1 also chooses d1 = 1/2 if
116
− (27 − 31k)2
3600=
(42 − 31k)(31k − 12)3600
≥ 0.
We find that both firms choose di = 1/2 (i = 1, 2) in equilibrium if k ≥ 12/31. Given that
d2 = 0, firm 1 chooses d1 = 1/2 if
481
− (3 + k)2
225= −(3k − 1)(19 + 3k)
2025≤ 0,
116
− (27 − 31k)2
3600=
(42 − 31k)(31k − 12)3600
≤ 0.
We find that only one firm chooses di = 0 in equilibrium if 1/3 ≤ k ≤ 12/31.
Region (g): The values of k and τ are in region (g). When d1 = d2 = 0 or di = 0 and
dj = 1/2 (i = 1, 2, i = j), the third profit function (3) in equation (13) applies. When
d1 = d2 = 1/2, the first profit function (1) in equation (13) applies. The payoff matrix is
described as follows (note that, γ = 1−d1−d2 and we assume that F (di) = 0 in this section):
36

d2 = 0 d2 = 1/2
d1 = 0481
641225
481
641225
d1 = 1/264
1225(2 − 2k − τ)2
1664
1225(2 − 2k − τ)2
16
Given that d2 = 0, firm 1 also chooses d1 = 0 if
481
− 641225
= − 28499225
≥ 0.
We find that no case where both firms choose di = 0 (i = 1, 2) appears in equilibrium. Given
that d2 = 1/2, firm 1 also chooses d1 = 1/2 if
(2 − 2k − τ)2
16− 64
1225=
(102 − 70k − 35τ)(38 − 70k − 35τ)19600
≥ 0.
Because k ≤ (1 − τ)/2 in this region, the above inequality always holds. We find that both
firms choose di = 1/2 (i = 1, 2) in equilibrium for any τ and k. Given that d2 = 0, firm 1
chooses d1 = 1/2 if
481
− 641225
= − 28499225
≤ 0,
(2 − 2k − τ)2
16− 64
1225=
(102 − 70k − 35τ)(38 − 70k − 35τ)19600
≤ 0.
We find that no case where only one firm chooses di = 0 appears in equilibrium.
Region (h): The values of k and τ are in region (h). For any di , the third profit function (3)
in equation (13) applies. The payoff matrix is described as follows (note that, γ = 1− d1 − d2
and we assume that F (di) = 0 in this section):
d2 = 0 d2 = 1/2d1 = 0 4/81 64/1225
4/81 64/1225d1 = 1/2 64/1225 1/16
64/1225 1/16
37

We find that both firms choose di = 1/2 (i = 1, 2) in equilibrium for any k and τ . The other
two cases do not appear in equilibrium.
38