Inpatient Flow Management in a Singaporean Hospital - Georgia
42
Jim Dai, Pengyi Shi Georgia Institute of Technology, USA Ding Ding University of International Business & Economics, China James Ang, Mabel Chou NUS Business School, Singapore Xin Jin, Joe Sim National University Hospital, Singapore Inpatient Flow Management in a Singaporean Hospital
Transcript of Inpatient Flow Management in a Singaporean Hospital - Georgia

Jim Dai, Pengyi Shi Georgia Institute of Technology, USA
Ding Ding University of International Business & Economics, China
James Ang, Mabel Chou NUS Business School, Singapore
Xin Jin, Joe Sim National University Hospital, Singapore
Inpatient Flow Management in a
Singaporean Hospital

Overview Empirical study
Inpatient flow management
Performance comparison after an early discharge policy Waiting time for admission to ward
Stabilize hourly waiting time performance
A stochastic network model
Allocation delays
Overflow policy
Endogenous service times
What-if analysis
Factors help to stabilize waiting time
2

Capacity and source of admission
Patients from 4 admission sources competing for inpatient beds
Total inpatient beds
~600
3
General Wards
ED-GW patients
ICU-GW patients
SDA patients
Elective patients
66.9 (65%)
18.5 (18%)
9.13 (9%)
9.12 (9%)

Patient distribution
4

Key performance measures
Waiting time for admission to ward (Jan 08 – Jun 09)
Waiting time = admission time – bed request time
Average: 2.82 hour
6.52% of ED-GW patients wait more than 6 hours to get a bed
“x-hour service level”: Fraction of ED-GW patients
waiting more than x hours
Ministry of Health (MOH) monitors 10-hour service level
(0.80%)
Hospital managers also care about the 6-hour service level
5

Time dependency
Waiting time depends on patient’s bed request time
Jan 08 – Jun 09
Can we stabilize?
6
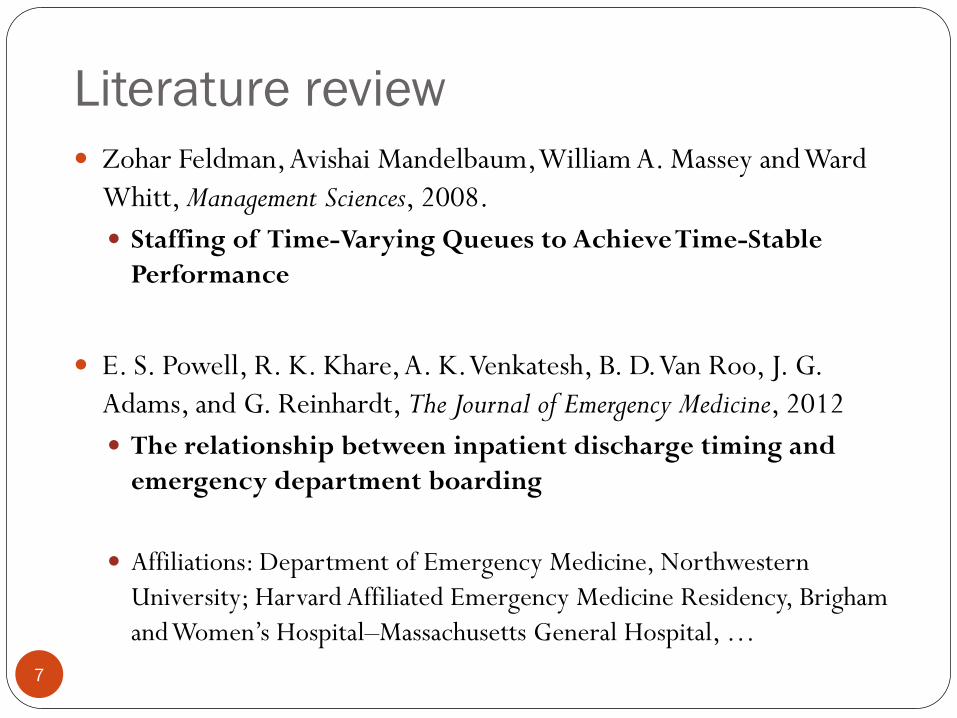
Literature review
7
Zohar Feldman, Avishai Mandelbaum, William A. Massey and Ward
Whitt, Management Sciences, 2008.
Staffing of Time-Varying Queues to Achieve Time-Stable
Performance
E. S. Powell, R. K. Khare, A. K. Venkatesh, B. D. Van Roo, J. G.
Adams, and G. Reinhardt, The Journal of Emergency Medicine, 2012
The relationship between inpatient discharge timing and
emergency department boarding
Affiliations: Department of Emergency Medicine, Northwestern
University; Harvard Affiliated Emergency Medicine Residency, Brigham
and Women’s Hospital–Massachusetts General Hospital, …

Bed request rate and arrivals to ED
8
ED-GW patient’s bed request rate (green curve) depends on arrival
rate to ED (blue curve)
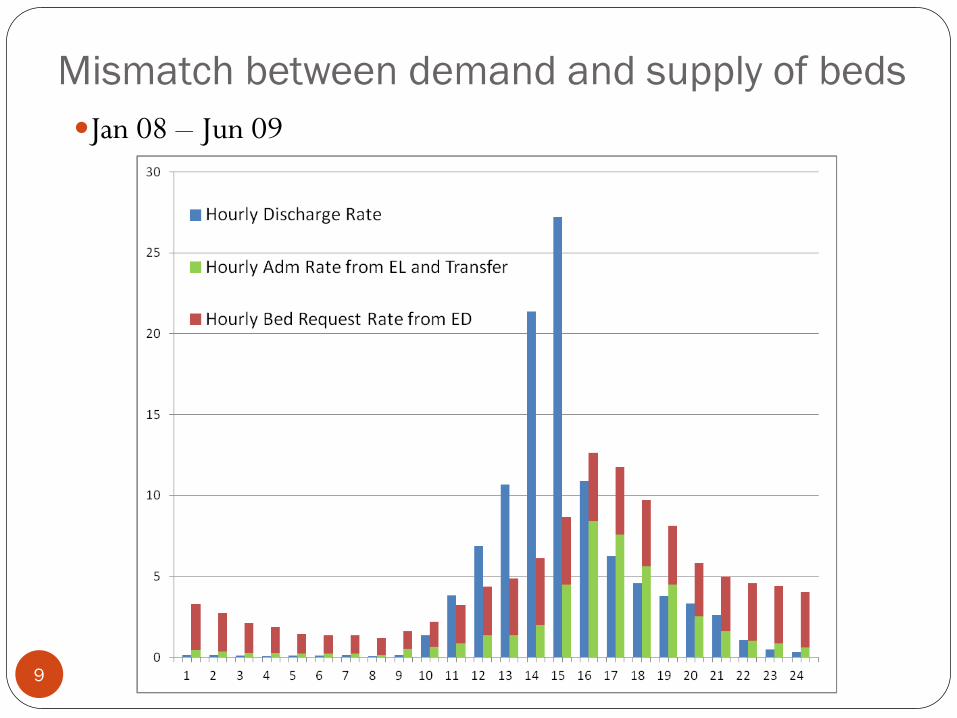
Mismatch between demand and supply of beds
Jan 08 – Jun 09
9
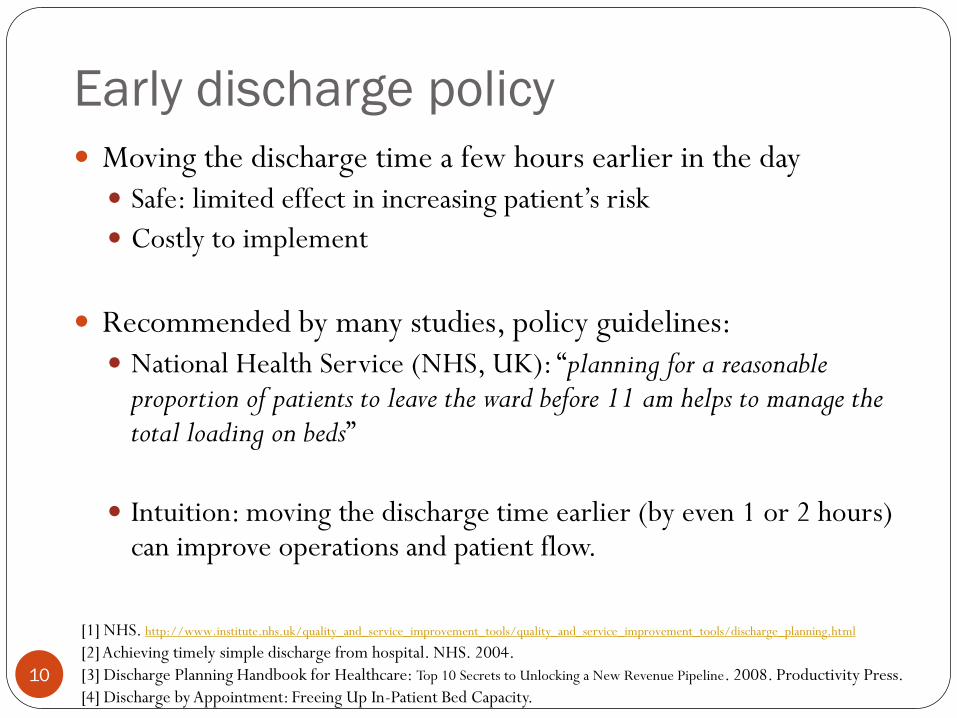
Early discharge policy
10
Moving the discharge time a few hours earlier in the day
Safe: limited effect in increasing patient’s risk
Costly to implement
Recommended by many studies, policy guidelines:
National Health Service (NHS, UK): “planning for a reasonable proportion of patients to leave the ward before 11 am helps to manage the total loading on beds”
Intuition: moving the discharge time earlier (by even 1 or 2 hours) can improve operations and patient flow.
[1] NHS. http://www.institute.nhs.uk/quality_and_service_improvement_tools/quality_and_service_improvement_tools/discharge_planning.html
[2] Achieving timely simple discharge from hospital. NHS. 2004.
[3] Discharge Planning Handbook for Healthcare: Top 10 Secrets to Unlocking a New Revenue Pipeline. 2008. Productivity Press.
[4] Discharge by Appointment: Freeing Up In-Patient Bed Capacity.

Data The hospital implemented early discharge policy since July 2009
Study two periods of data
Jan 2008 to Jun 2009 (Period 1)
13% before noon
Jan 2010 to Dec 2010 (Period 2)
26% before noon
Is early discharge policy helpful?
Empirical analyses
Use model to evaluate
Key performance measures in the two periods
Waiting time statistics (quality)
Overflow rate (cost)
11
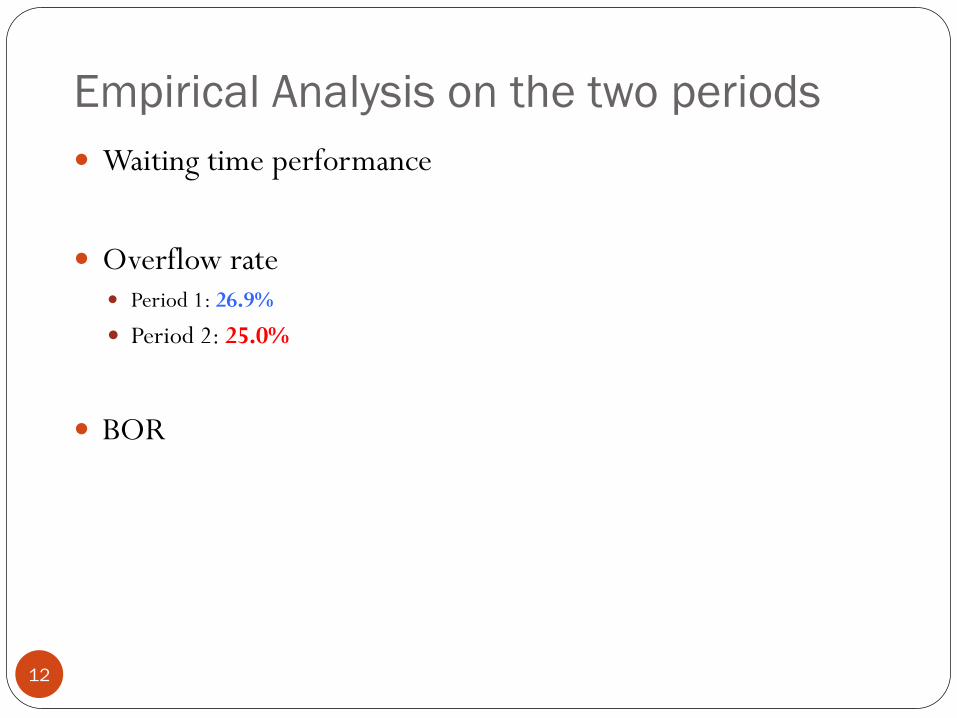
Empirical Analysis on the two periods
12
Waiting time performance
Overflow rate Period 1: 26.9%
Period 2: 25.0%
BOR
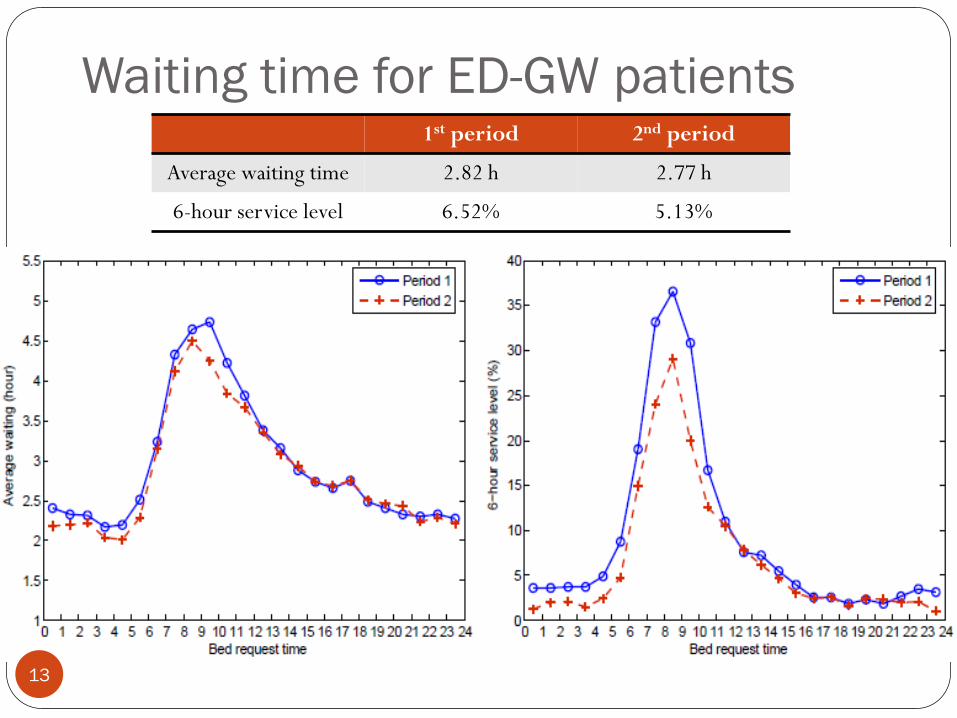
Waiting time for ED-GW patients
13
1st period 2nd period
Average waiting time 2.82 h 2.77 h
6-hour service level 6.52% 5.13%
Challenges
14
Does the modest improvement come from the early discharge?
More importantly, is any operational policy that can stabilize
the waiting time?

Unstable Environment Both arrival volume and capacity increases during 2008 to 2010
Bed occupancy rate (BOR) reduces in the Period 2 Period 1: 90.3%
Period 2: 87.6%
Need a model to help evaluate the effect of early discharge 15

A stochastic model
Multi-class, multi-server pool system
Each server pool is either dedicated to one class of customer or
flexible to serve two and more classes of customers
Periodic arrival
4 types of arrival (ED-GW, Elective, ICU-GW, SDA) for each
specialty
A novel service time model
And other key components
16

Simulation replicates most performance measures
Hourly waiting time performances
17
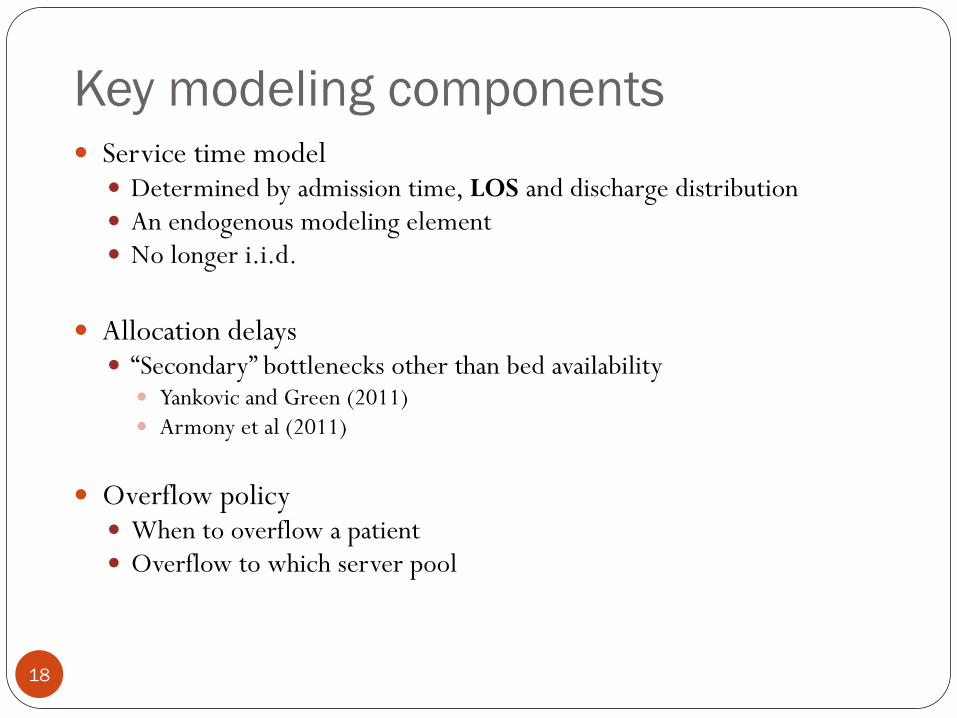
Key modeling components
18
Service time model Determined by admission time, LOS and discharge distribution An endogenous modeling element No longer i.i.d.
Allocation delays “Secondary” bottlenecks other than bed availability Yankovic and Green (2011)
Armony et al (2011)
Overflow policy When to overflow a patient Overflow to which server pool
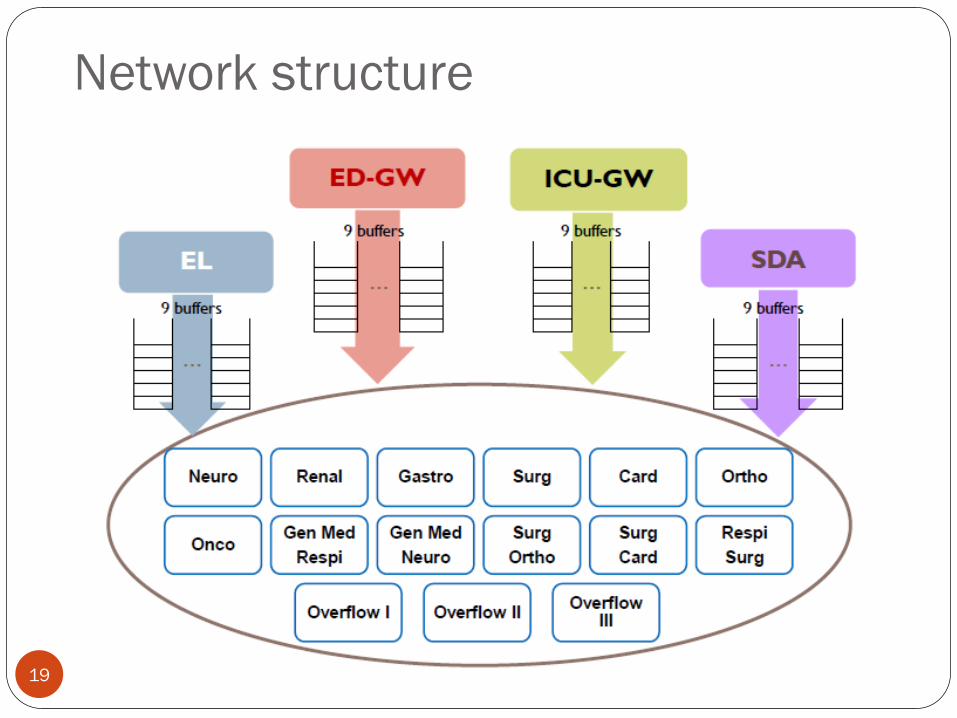
Network structure
19

0 2 4 6 8 10 12 14 16 18 200
0.05
0.1
0.15
0.2
0.25
Period 1
Period 2
Length of Stay (LOS)
= Discharge day – Adm day
Service time model Service time model
Service time = Discharge time – Admission time
= LOS + Dis hour – Adm hour
LOS distribution
Average is ~ 5 days
Depend on admission source
and specialty
20
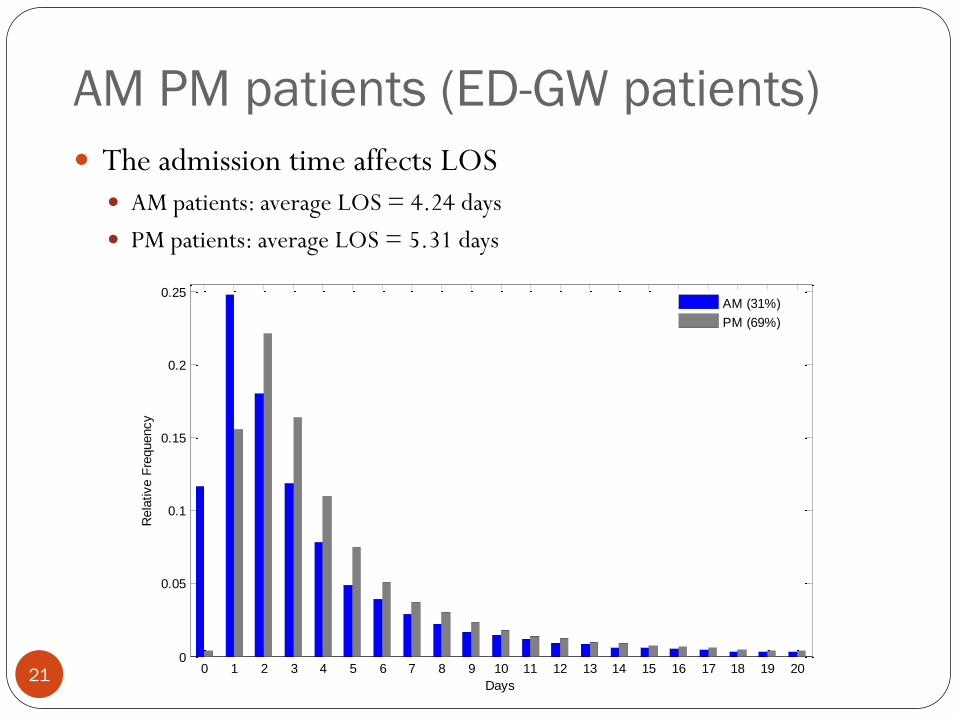
AM PM patients (ED-GW patients)
21
The admission time affects LOS AM patients: average LOS = 4.24 days
PM patients: average LOS = 5.31 days
0 1 2 3 4 5 6 7 8 9 10 11 12 13 14 15 16 17 18 19 200
0.05
0.1
0.15
0.2
0.25
Days
Rela
tive F
requency
AM (31%)
PM (69%)
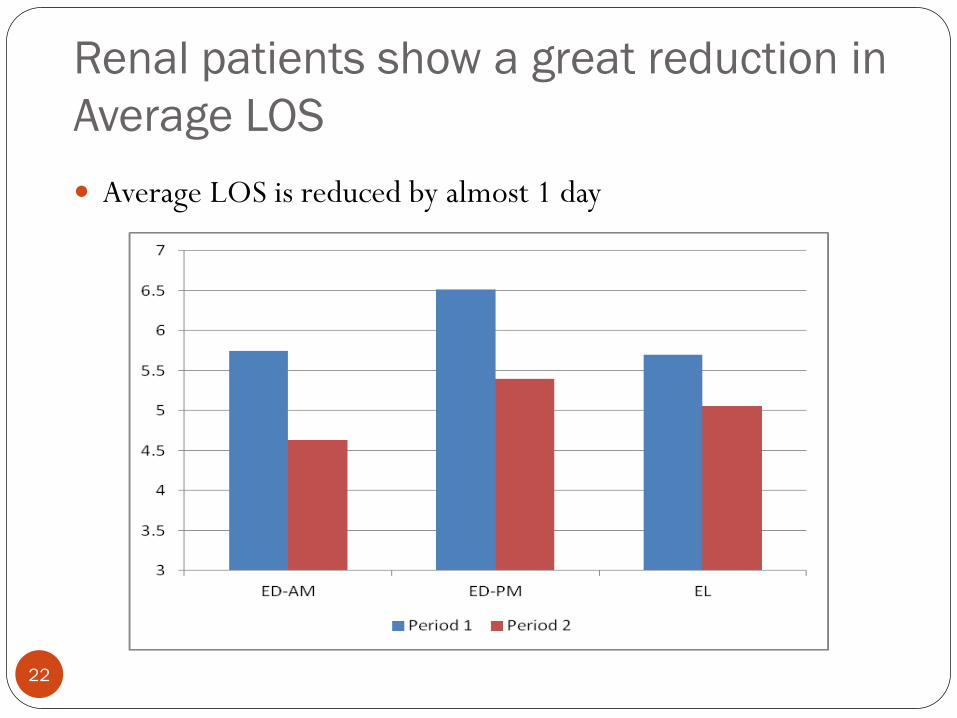
Renal patients show a great reduction in
Average LOS
22
Average LOS is reduced by almost 1 day

Verify the service time model Service time model
Service time = LOS + Discharge hour – Adm hour
Matching empirical
(a) Empirical (b) Simulation output
0 2 4 6 8 10 12 14 16 18 200
0.02
0.04
0.06
0.08
0.1
0.12
0.14
0.16
0.18
histogram of service time
0 2 4 6 8 10 12 14 16 18 200
0.02
0.04
0.06
0.08
0.1
0.12
0.14
0.16
0.18
histogram of service time
23

Pre- and post-allocation delays Patient experiences additional delays upon arrival and when a
bed is allocated
Pre-allocation delay
BMU search/negotiate for beds
Post-allocation delay
Delays in ED discharge
Delays in the transportation
Delays in ward admission
Must model bed turnover
component
If not, hourly queue length
does not match (right figure) 24

Time-dependent allocation delays The mean of allocation delay depends on when it is initiated
Use log-normal distribution
Pre-allocation delay
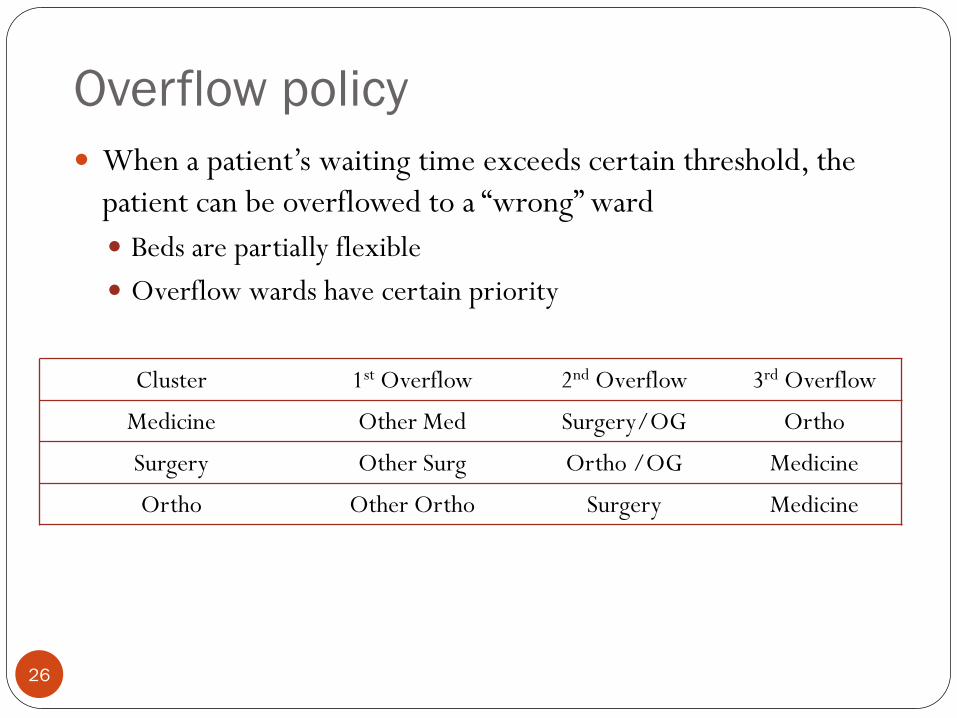
Overflow policy
26
When a patient’s waiting time exceeds certain threshold, the
patient can be overflowed to a “wrong” ward
Beds are partially flexible
Overflow wards have certain priority
Cluster 1st Overflow 2nd Overflow 3rd Overflow
Medicine Other Med Surgery/OG Ortho
Surgery Other Surg Ortho /OG Medicine
Ortho Other Ortho Surgery Medicine

Dynamic overflow policy
Fixed threshold
Threshold: 4.0 h
Dynamic threshold
Threshold: 0.5 h for arrival between
7 pm and 7 am (next day); 5.0 h for
others
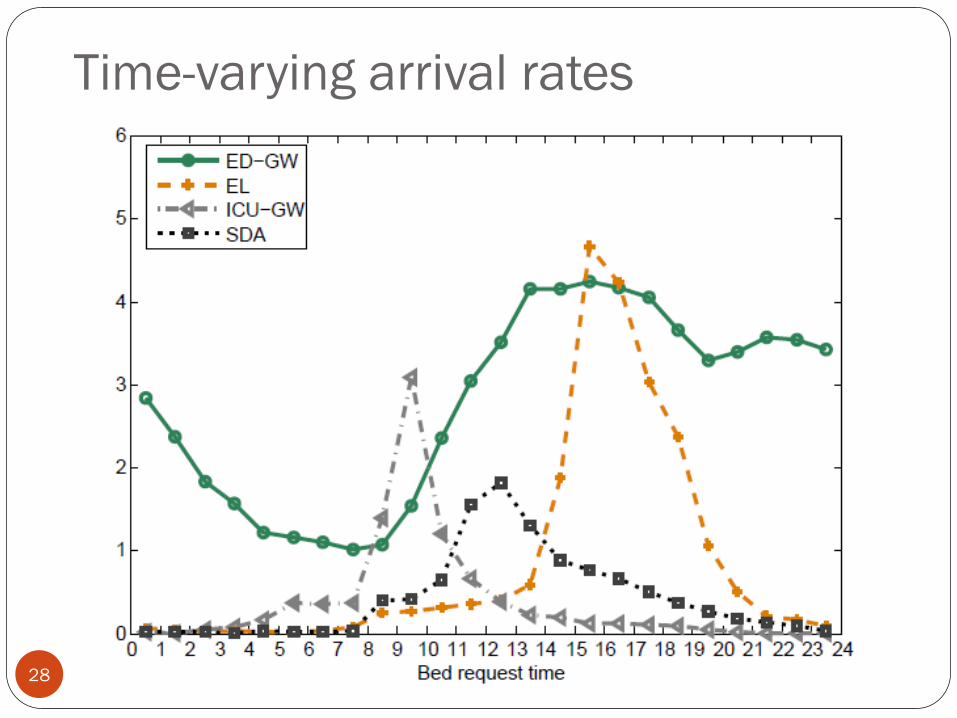
Time-varying arrival rates
28
Simulation results
29
Whether early discharge policy is beneficial or not
What-if analysis
Simulation results
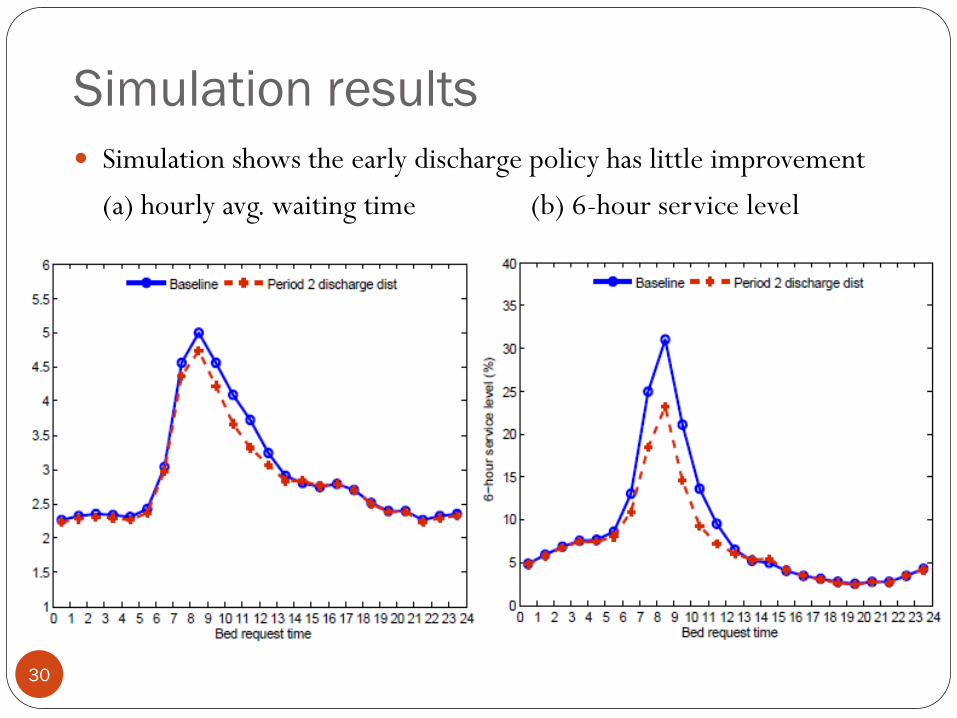
Simulation shows the early discharge policy has little improvement
(a) hourly avg. waiting time (b) 6-hour service level
30

Aggressive early discharge policy
31

Aggressive early discharge + smooth
allocation delay
32
Waiting time performances can be stabilized
(a) hourly avg. waiting time (b) 6-hour service level

Only use aggressive early discharge
33
Cannot be stabilized
(a) hourly avg. waiting time (b) 6-hour service level
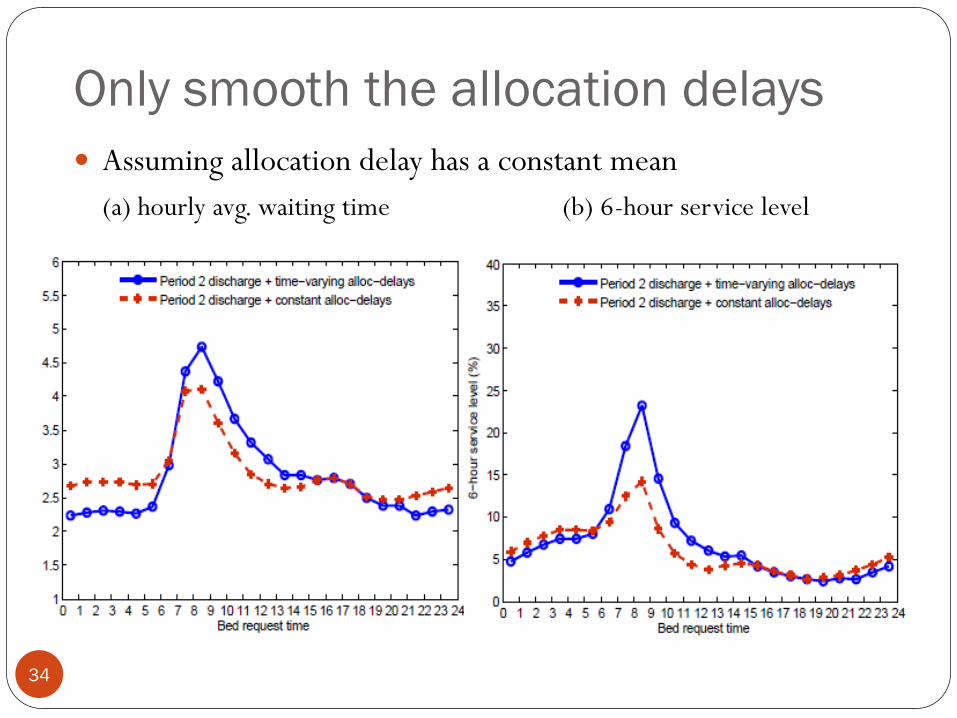
Only smooth the allocation delays
34
Assuming allocation delay has a constant mean
(a) hourly avg. waiting time (b) 6-hour service level
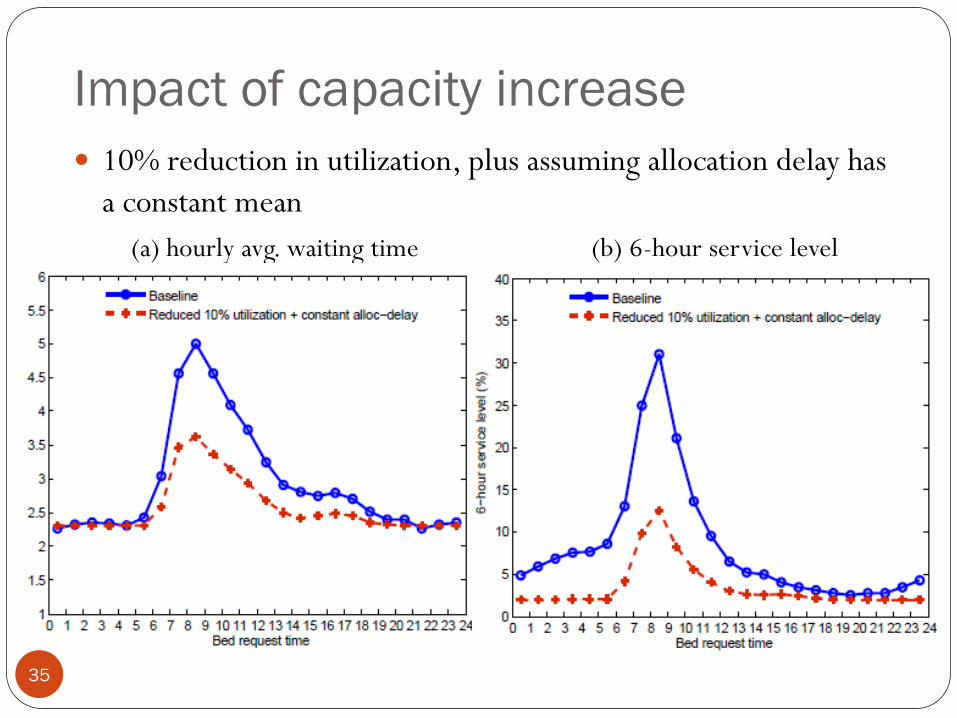
Impact of capacity increase
35
10% reduction in utilization, plus assuming allocation delay has
a constant mean
(a) hourly avg. waiting time (b) 6-hour service level
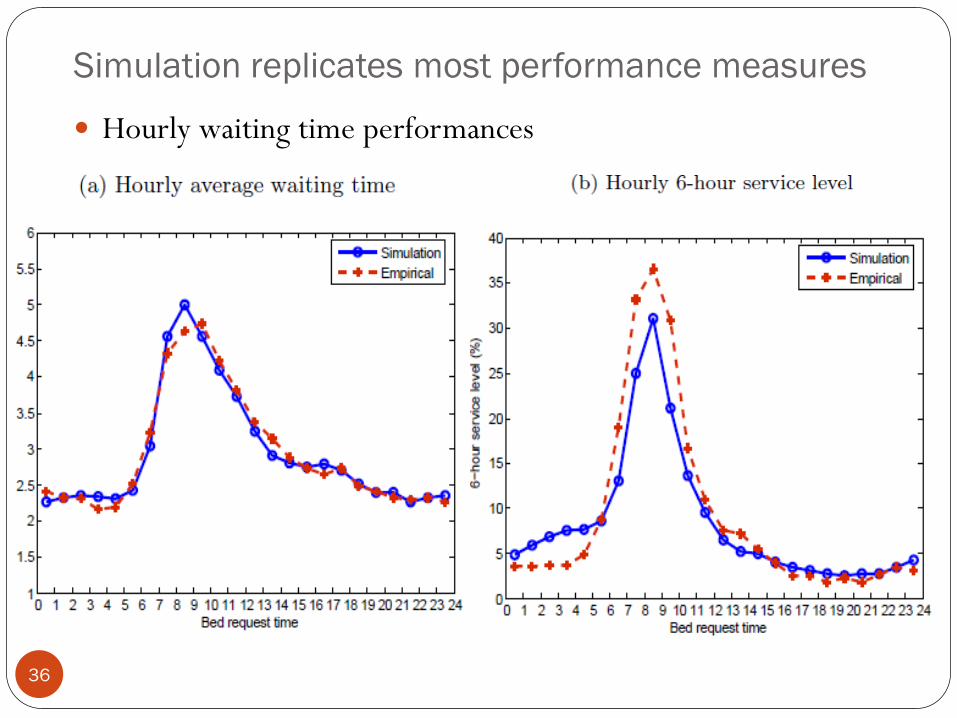
Simulation replicates most performance measures
Hourly waiting time performances
36
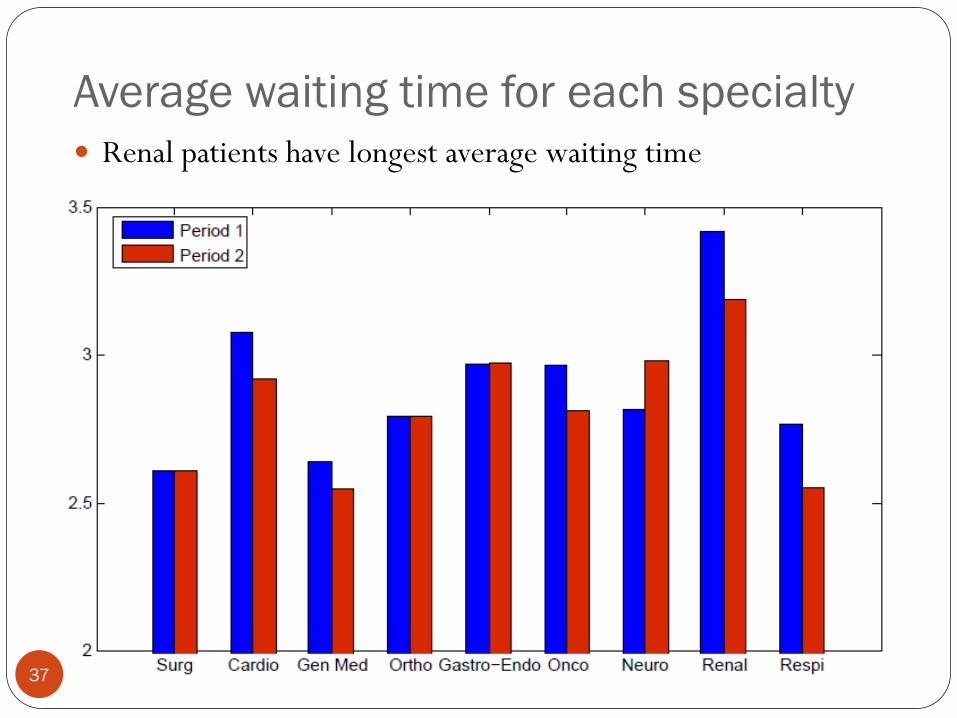
Average waiting time for each specialty
37
Renal patients have longest average waiting time
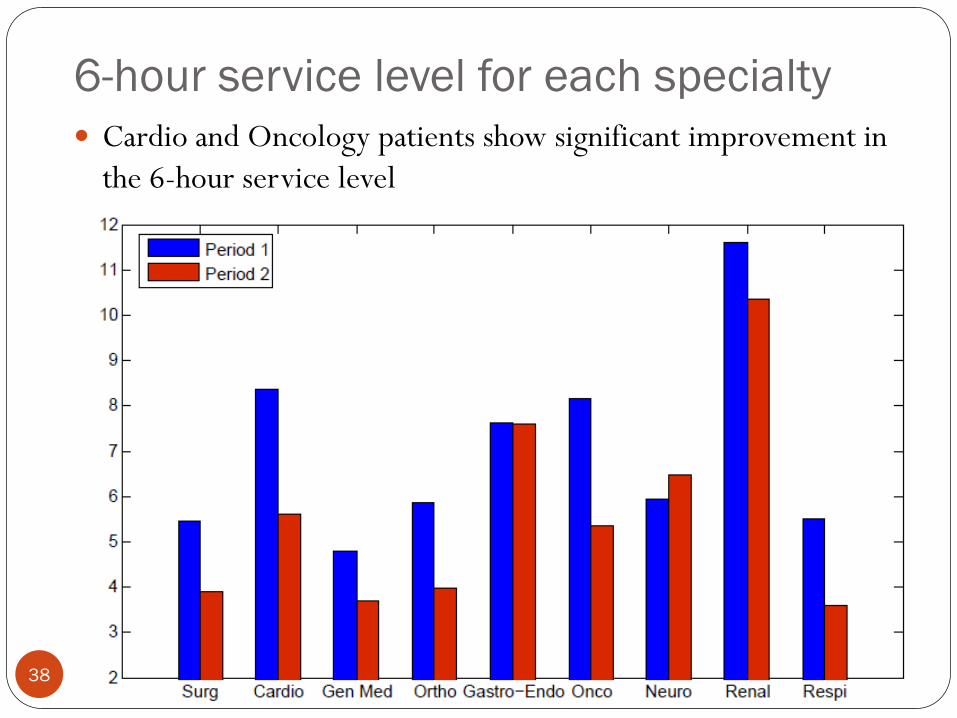
6-hour service level for each specialty
38
Cardio and Oncology patients show significant improvement in
the 6-hour service level

Overflow rate
39
Overall overflow rate reduces in Period 2
Summary
Conduct an empirical study of patient flow of the entire
inpatient department
Build and calibrate a stochastic model to evaluate the impact of
discharge distribution on waiting for admission to ward
Identify allocation delays as a second source of bottlenecks
Staffing appropriately in BMU, ED and Ward
Achieve stable waiting time by aggressive early discharge +
smooth allocation delay
40
Limitations
41
Simulation cannot fully calibrate with the overflow rate
Bed class (A, B, C)
Gender mismatch
Hospital acquired infections
Example: a female Surg patient has to be overflowed to a Med ward, since
the only available Surg beds are for males
Day-of-week phenomenon
Admission and discharge both depends on the day of week
LOS depends on admission day
Performances (BOR, waiting time) varies among days
42
Questions?