Inorganic green pigments: investigation of historical and ...
98
VILNIUS UNIVERSITY CENTRE FOR PHYSICAL SCIENCES AND TECHNOLOGY Eglė GRAŽĖNAITĖ Inorganic green pigments: investigation of historical and synthesis of novel pigments by sol-gel method DOCTORAL DISSERTATION Physical Sciences, Chemistry 03P VILNIUS 2018
Transcript of Inorganic green pigments: investigation of historical and ...

VILNIUS UNIVERSITY
CENTRE FOR PHYSICAL SCIENCES AND TECHNOLOGY
Eglė
GRAŽĖNAITĖ
Inorganic green pigments: investigation
of historical and synthesis of novel
pigments by sol-gel method
DOCTORAL DISSERTATION
Physical Sciences,
Chemistry 03P
VILNIUS 2018
2
This dissertation was written between 2013 and 2017 at Vilnius University.
Scientific supervisors:
Prof. dr. Aldona Beganskienė (Vilnius University, Physical Sciences,
Chemistry – 03P) (2013.10.01 – 2016.10.18)
Prof. habil. dr. Aivaras Kareiva (Vilnius University, Physical Sciences,
Chemistry – 03P) (2016.10.19 – 2017.09.30)
Scientific consultant:
Prof. RNDr. Jiří Pinkas (Masaryk University, Physical Sciences,
Chemistry – 03P) (2013.10.01 – 2017.09.30)
3
VILNIAUS UNIVERSITETAS
FIZINIŲ IR TECHNOLOGIJOS MOKSLŲ CENTRAS
Eglė
GRAŽĖNAITĖ
Žalieji neorganiniai pigmentai: istorinių
tyrimas ir naujų sintezė zolių-gelių
metodu
DAKTARO DISERTACIJA
Fiziniai mokslai,
Chemija 03P
VILNIUS 2018
4
Disertacija rengta 2013 – 2017 metais Vilniaus universitete.
Moksliniai vadovai:
Prof. dr. Aldona Beganskienė (Vilniaus universitetas, fiziniai mokslai,
chemija – 03P) (2013.10.01 – 2016.10.18)
Prof. habil. dr. Aivaras Kareiva (Vilniaus universitetas, fiziniai mokslai,
chemija – 03P) (2016.10.19 – 2017.09.30)
Mokslinis konsultantas:
Prof. dr. Jiří Pinkas (Masaryko universitetas, fiziniai mokslai, chemija –
03P) (2013.10.01 – 2017.09.30)
5
CONTENTS
LIST OF ABBREVIATIONS ........................................................................ 6
INTRODUCTION .......................................................................................... 7
1. LITERATURE SURVEY .............................................................. 9
1.1. Brief review of inorganic historical pigments ...................................... 9
1.2. The history and application of ceramic glazes ................................... 11
1.3. Historical and novel inorganic green pigments .................................. 15
1.4. The chemical structure of spinels ....................................................... 18
1.5. Sol-gel processing .............................................................................. 19
1.6. Basics of the sonochemical synthesis ................................................ 23
2. EXPERIMENTAL SECTION...................................................... 25
2.1. Chemicals and materials .................................................................... 25
2.2. Synthesis methods .............................................................................. 25
2.2.1. Sol-gel synthesis ......................................................................... 26
2.2.2. Sonochemical synthesis .............................................................. 26
2.2.3. Synthesis of ceramic glazes ........................................................ 27
2.3. Characterisation techniques ............................................................... 28
3. RESULTS AND DISCUSSION .................................................. 31
3.1. Characterisation of analogous to historical green pigments, their glaze
mixtures and ceramic glazes ......................................................................... 31
3.1.1. EDX analysis .............................................................................. 31
3.1.2. XRD analysis .............................................................................. 31
3.1.3. FTIR spectroscopy ..................................................................... 36
3.1.4. Morphological features of analogous to historical green pigments
and their ceramic glazes .......................................................................... 39
3.2. Synthesis and characterisation of Co1–xMxCr2O4 pigments and glazes43
3.2.1. Synthesis by sol-gel method ....................................................... 43
3.2.2. Synthesis by sonochemical method ............................................ 51
3.2.3. Morphological and colourimetric characterisation of pigments
and their corresponding glazes ................................................................ 56
3.3. Sol-gel synthesis and characterisation of CoCr2–xLnxO4 pigments and
glazes ............................................................................................................ 66
3.4. Sol-gel synthesis and characterisation of CoCr2–xGaxO4 pigments and
glazes ............................................................................................................ 77
CONCLUSIONS .......................................................................................... 81
LIST OF PUBLICATIONS.......................................................................... 83
ACKNOWLEDGEMENTS ......................................................................... 85
REFERENCES ............................................................................................. 87
6
LIST OF ABBREVIATIONS
at% atomic percent;
a.u. arbitrary units;
CIELab colour characterisation method, recommended by
Commission Internationale de l’Eclairage by measuring
parameters L*, a*, and b*.
CMYK colour model used in colour printing (cyan, magenta, yellow,
and key – black);
DR-UV Diffuse reflectance UV/Vis spectroscopy;
DTG Derivative thermogravimetry;
EDTA Ethylenediaminetetraacetic acid;
EDX Energy-dispersive X-ray spectroscopy;
FTIR Fourier-transform infrared spectroscopy;
FWHM Full width at half maximum;
ICP-OES Inductively coupled plasma optical emission spectrometry;
NIR Near-infrared region;
OM Optical microscopy;
PR pigment, derived by coprecipitation synthesis method;
SEM Scanning electron microscopy;
SG pigment, derived by sol-gel synthesis method;
SN pigment, derived by sonochemical synthesis method;
TG Thermogravimetry;
UV/Vis Ultraviolet/Visible region;
wt% weight percent;
XPS X-ray photoelectron spectroscopy;
XRD X-ray powder diffraction.
7
INTRODUCTION
The historical artefacts are witnesses and educators of our history, culture
and mastership of foretime handicraftsmen. The interest in investigation of
the heritage objects is gradually growing since the end of 19th century.
Luckily, versatile (from humanitarian to fundamental) examination of the
artefacts is finally a common knowledge. The first thing we usually notice
on the object is colours, and therefore the pigments excite great attraction of
the researchers.
Pigments and dyes are used since prehistoric times and are developed in
these days for various techniques from paints (oil, tempera, lime,
watercolour, gouache, acrylics, etc.) for canvas, wood, fresco, body art, and
others to colouring agents of more delicate ceramics and ceramic glazes. The
colouring of the glazes is generally achieved by adding colouring oxides,
which are transition metal oxides. The colouring of ceramic glazes is often
unpredictable due to the dependence on the firing conditions (atmosphere,
temperature) and the glaze matrix itself, since some transition metals can
form different oxides at different oxidation states [1]. In other words, the
colour performance of pigments depends notably on their thermal stability,
chemical reactivity towards the glaze components and also on the
coordination state of the transition metal ions [2, 3]. However, reaction with
and/or dissolution of the pigment in the glaze cannot be effectively
anticipated and prevented. As a result, the same pigment can produce
different colours in different glazes [3]. Fortunately, the most beautiful and
resistant colours can be attained by using oxides of spinel crystal structure,
because spinels tend less to change molecularly during firing, especially at
high temperatures [4-12].
However, the majority of inorganic pigments with vital colours contain
toxic metals, such as Pb, Hg, Cu, Co, etc. It is necessary to develop new and
safe pigments with the same or even better properties. In this study, the main
investigations were focused on green inorganic pigments, since until now
there was no thorough and classified research in this field to the best of our
knowledge. Green pigments can be based on copper, iron, chromium, cobalt,
and other metals, which emphasize the originality, uniqueness and
complexity of the investigation. The main scientific novelty of this doctoral
dissertation is the development of pigments and corresponding ceramic
glazes having different shade of bluish-green colours by variation of
transition or lanthanide metal and its concentration. The second scientific
novelty is the case of CoGa2O4 employment as a ceramic pigment for the
first time to our knowledge.
8
The aim of this PhD thesis was to investigate the analogous pigments to
historical green pigments and to develop novel cobalt chromite based
pigments and compare their abilities to colour corresponding ceramic glazes.
For this reason, the tasks of the present thesis were formulated as follows:
1. Investigation of analogous to historical green pigments and their
lead-based glazes using XRD analysis and FTIR spectroscopy.
2. Investigation and comparison of properties of new cobalt chromite
based pigments Co1–xMxCr2O4 (M = Ni2+
, Cu2+
, Zn2+
) (x = 0–1) synthesised
by sol-gel and sonochemical methods.
3. Synthesis and characterisation of lead-based and lead-free glazes
with sol-gel derived Co1–xMxCr2O4 (M = Ni2+
, Cu2+
, Zn2+
) pigments.
4. Sol-gel synthesis and investigation of new lanthanide-doped cobalt
chromite based pigments CoCr2–xLnxO4 (Ln = Tm3+
and Yb3+
) (x = 0–0.5).
5. Synthesis and characterisation of lead-free glazes with obtained
CoCr2–xLnxO4 (Ln = Tm3+
and Yb3+
) pigments.
6. Sol-gel synthesis and investigation of new gallium-doped cobalt
chromite based pigments CoCr2-xGaxO4 (x = 0–2).
7. Synthesis and characterisation of lead-free glazes with obtained
CoCr2-xGaxO4 (x = 0–2) pigments.
9
1. LITERATURE SURVEY
1.1. Brief review of inorganic historical pigments
Pigments and dyes are used since the prehistoric times. Naturally, the
colours of nature were used either from minerals in the earth (inorganic) or
from the plants and animals (organic). The majority of inorganic pigments
are brighter and last longer than organic ones. The earliest employments of
the pigments are found as prehistoric paintings in the caves. Mostly used
pigments were earth pigments (red, yellow, brown ochres – iron oxides in
various states of hydration; green earths, having a complex silicate structure
containing aluminium, iron, magnesium and potassium ions, were used less
frequently due to its relative rarity) and carbon blacks (soot, charcoal). The
other used black pigment was manganese oxide MnO2. In the era of great
Egypt, Mesopotamia and China civilisations (circa 4000 BCE), the variety of
more vivid colours was introduced, causing the rise of the first manufactured
pigments. Natural pigments included green malachite (CuCO3∙Cu(OH)2),
blue azurite (2CuCO3∙Cu(OH)2) and lapis lazuli (Na8[Al6Si6O24]Sn), red
cinnabar (HgS), reddish yellow to orange realgar (As4S4), and yellow
orpiment (As2S3). The most famous and probably the oldest of synthesised
pigments was Egyptian blue (CaCuSi4O10) – first produced circa 3000 BCE.
The Chinese discovered a similar product Han purple (BaCuSi2O6) and Han
blue (BaCuSi4O10). Vermilion, the pigment made from the powdered mineral
cinnabar, alternatively was produced by the Chinese by mixing mercury with
molten sulphur and heating the mixture to produce the compound [13-17].
The influence of the Egyptians was significant in the arts and the Greeks
inherited from them the painting palette. However, soon they started to
create a new group of artificial pigments, such as white lead
(2Pb(CO3)2∙Pb(OH)2), red lead (Pb3O4), and yellow lead massicot (PbO).
The Romans used inorganic pigments employed by the Egyptians and
Greeks and later it spread throughout the whole Europe [15, 16]. In the
Middle Ages (500–1000 CE) the preparation of relatively pure natural
pigments was improved, however, the traces of impurities still remained.
Fortunately, it helps to identify the minerals from which pigments were
made and to ascertain roughly their geographical origin [13]. In the early
Renaissance, the technique of purification of lapis lazuli and the extraction
of resultant ultramarine was developed. Natural ultramarine is very
expensive, yet still produced in small quantities for artists today by a very
similar method to that used in the Renaissance. Other main pigments
discovered in the Renaissance were lead tin yellow (SnO∙SiO2∙PbO) [15],
10
Naples yellow (Pb(SbO3)2 or PbSbO4), and brown umbers (hydrated iron and
manganese oxides) [16].
The biggest breakthrough in production of artificial and synthetic
pigments came with the 18th and 19
th centuries and industrial manufactory.
The artists’ palette became richer with more brilliant colours than ever
before. Invented pigments of new blue, green, yellow, and other shades
partly took the place of pigments with not so expressive colours and in some
cases the harmful ones. However, the desire for original colours introduced
even more deadly pigments. Prussian, or Berlin blue (Fe4[Fe(CN)6]3∙(14-
16)H2O) was accidentally synthesised by Diesbach in 1704. Poisonous
Scheele’s green (CuHAsO3 or Cu(AsO2)2∙nCu(OH)2∙mH2O) was introduced
in 1775, cobalt green (CoO∙nZnO) was developed by Rinmann in 1780.
Cobalt blue (CoAl2O4) oxides were first obtained by Leithner in 1775.
Thenard introduced the manufactory of this pigment in 1802 and only in 5
years the production of it started in France followed shortly by Germany and
Norway. It partially replaced another blue cobalt pigment smalt (cobalt
containing potassium glass), which was popular in Europe since the 14th
century. Ceruleum (CoO∙nSnO2), a sky blue pigment, firstly synthesised by
Hoepfner in 1789, was seemingly forgotten, until the 1850s–60s, when it
was reintroduced and marketed by Rowney & Co. Other developed cobalt
pigments, such as cobalt yellow aureolin (K3Co(NO2)6∙nH2O, by Fisher,
1831) and cobalt violet (Co3(AsO4)2 first mentioned in 1855; Co3(PO4)2 by
Salvetat in 1859; CoNH4PO4∙H2O), despite their beautiful colours, never
gained the importance of cobalt blue. Another alluring green pigment called
Schweinfurt green, also known as emerald green or Paris green
(Cu(CH3COO)2∙3Cu(AsO2)2), was introduced in 1814 by Russ and Sattler
from Schweinfurt, Germany. Moreover, in the earlier 19th century, the
alternate materials for lead white were invented. Synthetic barium sulfate
BaSO4, blanc fixe, was used since 1830, especially as extender, and zinc
white ZnO was introduced slightly later, which became the main
replacement. In 1828, the tremendous invention was independently made by
two chemists, Guime and Gmelin, giving slightly different synthesis routes
for reasonably low-priced synthetic ultramarine. Next greatly significant
group of the pigments is chromium pigments. Most significant among these
are the various chromates, which vary in colour from yellow, orange, red and
purple to brown and green, and the green oxide and oxide hydrate. The most
notable ones from this family are chrome yellow (PbCrO4, or
PbCrO4∙nPbSO4, from light yellow to orange-yellow), zinc yellow
(K2O∙4ZnCrO4∙3H2O), barium yellow (BaCrO4), strontium yellow (SrCrO4),
chrome orange (PbCrO4∙Pb(OH)2), chrome red (nPbCrO4∙mPbO), and green
11
chromium oxide (Cr2O3) first described by Vauquelin in 1809. Viridian
(Cr2O3∙2H2O), having remarkably transparent and brighter green colour than
chromium oxide, was developed by Pannetier about 1838 and quickly
superseded green copper pigments. More yellow and red hues were obtained
by discovering cadmium yellows by Stromeyer in 1819. The colours ranged
from lemon yellow (CdS) to orange. The entrance of synthetic iron oxides,
so-called mars pigments, into pigmentary world from the 18th–19
th centuries
had very important role, since the sources of natural earths were diminishing.
The mars colours differed in a wide range of hues, from yellows, reds,
violets, browns and black, giving the name for the pigment (eg., Mars
violet). Another violet pigment manganese phosphate (NH4)2Mn2(P2O7)2)
was known since 1868(?) and historically named misleading as permanent
mauve [15-18].
The invention and production of new inorganic pigments has never
stopped. During 20th century, there were developed advanced pigments, such
as titanium white (TiO2, 1908), cadmium red (CdS∙nCdSe, 1910), molybdate
orange or red (PbCrO4∙PbMoO4∙PbSO4, 1933), manganese blue
(nBaSO4∙mBaMnO4, 1935), greenish yellow bismuth vanadate (BiVO4,
1970), nickel rutile yellow ((Ti0.85Sb0.10Ni0.05)O2, in the end of the 20th
century) [15-18] and many others.
In modern times, the majority of new inorganic pigments are created by
improving already existing pigments. Substitution of one or few elements in
the chemical structure allows achieving desirable and better properties, such
as superior colour [19], solar absorbing [20, 21] or reflecting [22-24]
characteristics, decreased production cost [19, 25], etc. For the last few
decades, the great attention and effort were put into the reduction of toxicity
of traditional pigments. To accomplish this intention, more common, such as
zinc [25] and aluminium [24], or innovative substitution elements, such as
rare earth elements, could be used. By using lanthanides as dopants vast
gamut of colours could be achieved: various shades of red [26-28], brown
[29, 30], various shades of yellow [31-34], blue [35, 36] and various shades
of violet [37, 38], from yellow to green [39], from yellow to orange red [40].
Naturally, many of created pigments could be used to colour ceramic glazes.
1.2. The history and application of ceramic glazes
Glazes are thin layers of glassy substance fused onto a ceramic surface. In
physical and chemical nature, they are hard, impermeable to gases and
liquids and slightly or entirely insoluble, excepting in strong acids or bases.
Glazes may be transparent, translucent, opaque, colourless or coloured. In
12
many cases, glazes are formed from three main components: (1) silica
(SiO2), a glass former; (2) a flux, a reducer of the melting temperature of the
silica, such as feldspar (aluminosilicate minerals with the general formula
AT4O8, where A = K, Na or Ca; T = Al and Si), whiting (CaCO3), talc, zinc,
ashes, lead, boron, etc., used in their oxide or carbonate forms. The latter two
are used in low-temperature glazes; (3) alumina (Al2O3), a stiffener, used to
increase the viscosity and stability of the glaze. It is more used in the form of
kaolin (Al2O3∙2SiO∙2H2O), feldspar or ball clay, rather than oxide.
To colour the glaze, colouring oxide or other form of the pigment is used.
The most typical metal oxides are of Fe, Cu, Co, Cr, Ni, Mn, Sn and Ti; not
so common oxides are of Sb, V, Cd, Se, Au and U [1, 4, 41]. Glazes may be
classified into these groups:
1. Raw glazes, containing lead: a) with no alumina, where lead is the
only base or with other bases; b) containing Al2O3 and various bases, with
different amounts of lead; containing boron trioxide with or without alkalis
(Na, K, Li).
2. Raw lead-free glazes, containing Al2O3 with various bases: a)
containing alkaline earths (Ca, Sr, Mg, Ba), but no alkalis; b) containing
alkaline earths and alkalis (natural clay slips or synthetic mixtures of
minerals); c) with alkaline earths, alkalis and ZnO; d) with B2O3; e) salt-
glazes, which are the results of the action of the fumes of common white
salt.
3. Fritted glazes, containing lead in addition to other bases: a) without
Al2O3 or B2O3; b) with Al2O3 and B2O3 and with or without alkalis.
4. Fritted lead-free glazes: a) without B2O3; b) with B2O3, where alkalis
are the only bases, or alkalis and alkaline earths are present with or without
zinc; c) containing significant amounts of barium [4].
Stoneware, earthenware and other ceramics have been decorated by
glazes since the ancient times. Remained items and archaeological findings
witness the excellence of the craftsmanship in the use of glazes for both
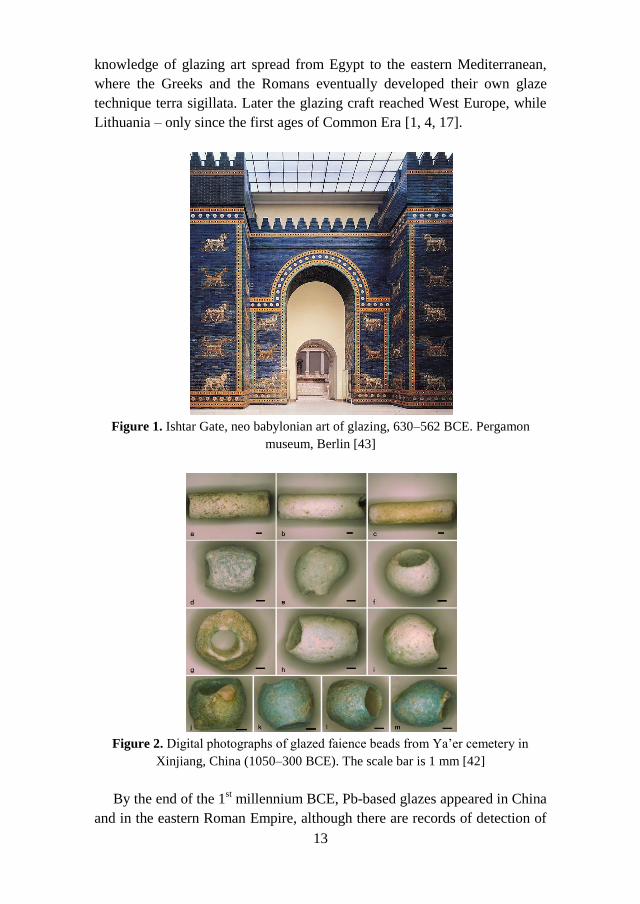
large and small objects [4]. The famous Ishtar Gate and Processional Road
of Babylon is a great example of grand objects (see Fig. 1). Small items
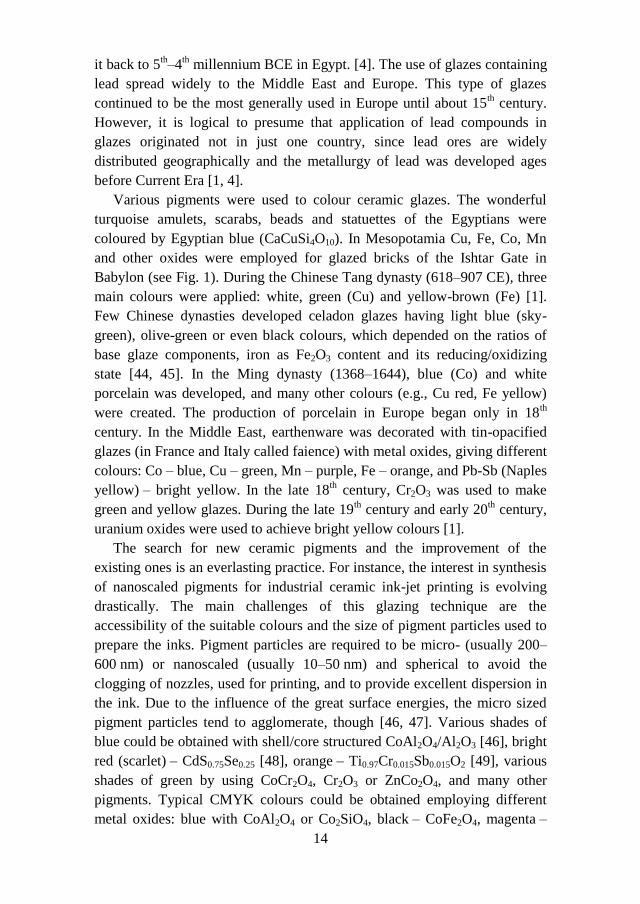
usually were various amulets, beads and other. Fig. 2 demonstrates faience
beads from Ya’er cemetery in Xinjiang, China (1050–300 BCE) [42].
It is believed that the origin of glazing is attributed to the Egyptians as
early as 5th millennium BCE. They created so-called Egyptian paste by
mixing sand with natron, natural mixture of Na salts. As the paste dried, the
salts migrated to the surface and, upon firing, melted and formed glass.
Similar compositions of glazes could be traced in Mesopotamia and India
back to the 3rd
millennium BCE. During the same millennium, the
13
knowledge of glazing art spread from Egypt to the eastern Mediterranean,
where the Greeks and the Romans eventually developed their own glaze
technique terra sigillata. Later the glazing craft reached West Europe, while
Lithuania – only since the first ages of Common Era [1, 4, 17].
Figure 1. Ishtar Gate, neo babylonian art of glazing, 630–562 BCE. Pergamon
museum, Berlin [43]
Figure 2. Digital photographs of glazed faience beads from Ya’er cemetery in
Xinjiang, China (1050–300 BCE). The scale bar is 1 mm [42]
By the end of the 1st millennium BCE, Pb-based glazes appeared in China
and in the eastern Roman Empire, although there are records of detection of
14
it back to 5th–4
th millennium BCE in Egypt. [4]. The use of glazes containing
lead spread widely to the Middle East and Europe. This type of glazes
continued to be the most generally used in Europe until about 15th century.
However, it is logical to presume that application of lead compounds in
glazes originated not in just one country, since lead ores are widely
distributed geographically and the metallurgy of lead was developed ages
before Current Era [1, 4].
Various pigments were used to colour ceramic glazes. The wonderful
turquoise amulets, scarabs, beads and statuettes of the Egyptians were
coloured by Egyptian blue (CaCuSi4O10). In Mesopotamia Cu, Fe, Co, Mn
and other oxides were employed for glazed bricks of the Ishtar Gate in
Babylon (see Fig. 1). During the Chinese Tang dynasty (618–907 CE), three
main colours were applied: white, green (Cu) and yellow-brown (Fe) [1].
Few Chinese dynasties developed celadon glazes having light blue (sky-
green), olive-green or even black colours, which depended on the ratios of
base glaze components, iron as Fe2O3 content and its reducing/oxidizing
state [44, 45]. In the Ming dynasty (1368–1644), blue (Co) and white
porcelain was developed, and many other colours (e.g., Cu red, Fe yellow)
were created. The production of porcelain in Europe began only in 18th
century. In the Middle East, earthenware was decorated with tin-opacified
glazes (in France and Italy called faience) with metal oxides, giving different
colours: Co – blue, Cu – green, Mn – purple, Fe – orange, and Pb-Sb (Naples
yellow) – bright yellow. In the late 18th century, Cr2O3 was used to make
green and yellow glazes. During the late 19th century and early 20
th century,
uranium oxides were used to achieve bright yellow colours [1].
The search for new ceramic pigments and the improvement of the
existing ones is an everlasting practice. For instance, the interest in synthesis
of nanoscaled pigments for industrial ceramic ink-jet printing is evolving
drastically. The main challenges of this glazing technique are the
accessibility of the suitable colours and the size of pigment particles used to
prepare the inks. Pigment particles are required to be micro- (usually 200–
600 nm) or nanoscaled (usually 10–50 nm) and spherical to avoid the
clogging of nozzles, used for printing, and to provide excellent dispersion in
the ink. Due to the influence of the great surface energies, the micro sized
pigment particles tend to agglomerate, though [46, 47]. Various shades of
blue could be obtained with shell/core structured CoAl2O4/Al2O3 [46], bright
red (scarlet) – CdS0.75Se0.25 [48], orange – Ti0.97Cr0.015Sb0.015O2 [49], various
shades of green by using CoCr2O4, Cr2O3 or ZnCo2O4, and many other
pigments. Typical CMYK colours could be obtained employing different
metal oxides: blue with CoAl2O4 or Co2SiO4, black – CoFe2O4, magenta –
15
Au or Cu and yellow – Ti(Cr, Sb)O2, (Ti0.85Ni0.05Nb0.10)O2, Pr-ZrSiO4 [47,
50], and many others. Naturally, all these pigments could be applied for
classical glazing techniques. Novel ceramic pigments are evolved to improve
colour, less toxicity, environmental friendliness, lower production cost and
other features. In most cases obtained pigments characterise few of
mentioned properties, for instance, brighter or more diverse colours and
lower toxicity, greater colours and lower cost, etc. Due to the low toxicity
and their unique optical properties, lanthanides are promising elements for
the preparation of less poisonous pigments. New improved environment
friendly Y2-xMxZr2-yFeyO7-δ pigment series of red-orange (M = Pr) and red
(M = Tb) shade were prepared by polymeric sol-gel method, which could be
applied for ceramic tiles, cool roofing materials and other production [51,
52]. New environmental friendly lanthanide-iron-based oxide reddish brown
pigments Tb3Fe5O12 and PrFeO3 were prepared by sol-gel processing [53].
Environmentally friendly ceramic yellow pigments having the general
formula Y1.86−xMxTb0.14O3−x/2x (M = Ca and/or Zn; x = 0.06–0.64) were
prepared by a modification of Pechini method [31]. Recently, a natural
magnesium aluminium silicate attapulgite (APT) is employed to produce
low-cost pigments with improved colour properties. G. Tian et al. have
prepared hybrid red pigments APT/Fe2O3 by one-pot hydrothermal synthesis
[54], and X. Wang’s research group have produced hybrid yellow
APT/BiVO4 pigments by sol-gel method [19].
1.3. Historical and novel inorganic green pigments
Very wide and interesting area of the pigments is green inorganic
pigments. As it was mentioned before, they can be based on Fe, Cu, Cr, Co,
and other metals. Fe-based pigments usually are earth pigments and are
named by their provenance. These pigments are used since the ancient times
and can be applied in all kinds of art. The main colouring agents are the
green clay minerals celadonite and glauconite [18]. Celadonite is bluish
green dioctahedral mica. Its theoretical composition is
KFe3+
(Mg,Fe2+
)[Si4O10](OH)2. Glauconite is grass green dioctahedral mica
with a yellow hue, having less crystalline structure with theoretical
composition of (K,Na)(Fe3+
,Al,Mg)2(Si,Al)4O10(OH)2 [55, 56]. Naturally, the
colour of the pigments varies in hues depending on the ratio of components
in each provenance. However, these two pigments are hard to distinguish
optically after they are ground, because both appear as pale, slightly greyish
green powders. Moreover, analytical characterisation is difficult likewise
due to similarity in the structure and composition [18, 56]. Earth pigments
16
are characterised by a low covering power and intensity, but good resistance
to alkalis, light and atmospheric effects. Besides, they are non-toxic. Green
Cu-based pigments were widely used since the ancient Egypt times for
various art techniques, such as mural-painting, painting and ceramics until
the 19th century. Due to their disadvantages (low hiding power and intensity,
bad resistance to atmospheric effects, toxicity) later they were almost
completely replaced by other green pigments [16, 17]. Besides previously
mentioned green Cu-based pigments (malachite, Scheele’s and Schweinfurt
green), other pigments were used. Apart from Egyptian blue, the Egyptians
also synthesised Egyptian green, which often is called green frit. Egyptian
green was produced similarly to Egyptian blue, only varying ratios of the
same starting materials (quartz, lime, a copper compound and natural soda
(natron)) and firing at higher temperatures. The colour can range from green
through turquoise to pale blue [18, 57]. Natural mineral chrysocolla with
chemical composition (Cu,Al)2H2Si2O5(OH)4∙nH2O is found in association
with azurite, malachite, cuprite and other minerals and was used as pigment
since the ancient times until circa 17th century. It is commonly bluish green
in colour and the name of it historically was used mistakenly as a term for
malachite in classical and mediaeval literature. Another natural mineral
brochantite (Cu4SO4(OH)6), varying in hues from emerald green to greenish
black, has been identified less commonly in artefacts from the 14th–17
th
centuries. In the artefacts of 18th–19
th centuries, detected brochantite was
considered as synthetic [18]. Synthetic copper acetate group pigments, called
verdigris and many other names, were used from the ancient times to the
early 20th century. There are several known salts: deep bluish green neutral
hydrous and anhydrous verdigris (Cu(CH3COO)2∙H2O, Cu(CH3COO)2,
respectively), bluish green basic verdigris Cu(CH3COO)2∙Cu(OH)2∙5H2O,
green basic verdigris Cu(CH3COO)2∙[Cu(OH)2]2 and other forms. Verdigris
dissolved in colophony produced copper resinate. Cu-based pigments were
replaced generally by Cr-based pigments [17, 18]. Synthetic chromium
oxides, mentioned previously, were discovered in 19th century. Another
beautiful green chromium pigment, lighter than eskolaite Cr2O3, is Victoria
green, which is stated to be the mixture of viridian, zinc yellow and Prussian
blue or barium sulphate or other white pigment [18]. In other reference the
pigment named as Victoria green is a mixture of calcium compound,
chromium oxide and silica [58]. Interestingly, in some literature the pigment
identified with the structure of uvarovite Ca3Cr2(SiO4)3 is named as Victoria
green too [59, 60]. The synthetic uvarovite synthesised in the 19th century is
still used as ceramic pigment until these days [61, 62]. The natural mineral
uvarovite, on the other hand, was not detected as a pigment to the best of our
17
knowledge. However, natural clay mineral volkonskoite
(Ca(Cr,Mg,Fe)2(Si,Al)4O10(OH)2∙4H2O) is detected as a green pigment in
Russian icons from 11th century. Cr-based pigments find applications in all
art techniques and have a good resistance to light, atmospheric effects,
alkalis and acids and aggressive gas. Formerly noticed cobalt, Rinamann’s or
zinc green (CoO·nZnO) was not very popular among the artists despite its
chemical stability, since it created relatively weak colours and its production
was too expensive [17, 18].
Modern green pigments, besides Fe, Cu, Co and Cr, can contain Ni, Ti
and many other elements. For the most part scientists are searching new
synthesis routes to produce and/or improve already existing pigments, as it
was mentioned before. For instance, H. Onoda and K. Sugimoto prepared
green phosphate pigments imitating natural ores xenophillite (Na4Fe7(PO4)6)
and vivianite (Fe3(PO4)2) by hydrothermal synthesis method [63]. Naturally,
copper containing pigments are still being produced, which would be less
toxic than their predecessors and which ones’ colours would be superior to
commercial Cr-based pigments. A bright green pigment Y2BaCuO5 with
great NIR reflectance was synthesised using the nano-emulsion method [64].
Novel pigments Sc2(Cu1–xZnx)2O5 (x = 0–0.1), having brilliant green colours
and high resistance to the UV irradiation, were developed using conventional
solid state method [65]. For economical and environmental reasons,
scientists are developing methods to use industrial wastes as Cr2O3 precursor
for the synthesis of Cr-based pigments. F. Andreola prepared green powder
with the main phase of uvarovite by solid state reaction [62], and W. Hajjaji
et al. developed Cr-doped titanite CaTiSiO5 using the ceramic route and
obtained variations of colours in transparent glazes from green to brown
[66]. D. Esteves et al. used industrial waste as starting materials for the
preparation of Ni-olivine (Ni2SiO4) by the solid state reaction method. The
application of Cr/Ni galvanic sludge improved the formation of Ni2SiO4 at
lower temperatures and stronger and darker green hue, comparing to
pigments, prepared from pure/commercial reagents [60]. Another spinels
CoCr2−2xAl2xO4 (x = 0–1 in steps of 0.2) were prepared by solid combustion
synthesis, varying the colour from the green shades in Cr-rich to blue shades
in Al-rich pigments [67]. (Co,Zn)-MgTi2O5 karrooite-hosted pigments,
prepared using solid state reaction, exhibited a gamut of yellowish green
colours, which became less yellowish and more saturated or darker the
higher the Co content was [68]. Inverse spinel Co2TiO4, due to its reliable
chemical stability and corrosion resistance, is often used as a green pigment,
although it contains poisonous, limited and expensive cobalt. To reduce the
cost and toxicity, Co can be replaced by cheaper and less toxic elements, the
18
pigment can be mixed with light pigments, or coated on mica, leading by all
these methods to the loss of the intensity of the colour. J. Zou et al.
introduced new CoTiO3/TiO2 complex shell/core structured pigments with
ranging green hues [69].
Scientists around the globe have been preparing many and various green
pigments, which is impossible here to review them all. Worth to mention
that quite significant section of ceramic green and other colour pigments is
spinel structured pigments.
1.4. The chemical structure of spinels
Different metal oxides and mixed-metal oxides are employed as ceramic
pigments. For various applications pigments have specific requirements such
as chemical and thermal stability, particle size, hiding and tinting power, etc.
Mixed-metal oxides, displaying general spinel formula AB2O4, are
characteristic for their high mechanical resistance, high thermal and
chemical stability. The cubic spinel unit cell consists of 56 atoms (32 oxygen
anions, and 24 cations, 8 of them occupying tetrahedral sites and the other 16
being located at the octahedral sites). The cations A and B ordinarily are
divalent and trivalent, respectively, although other combinations are possible
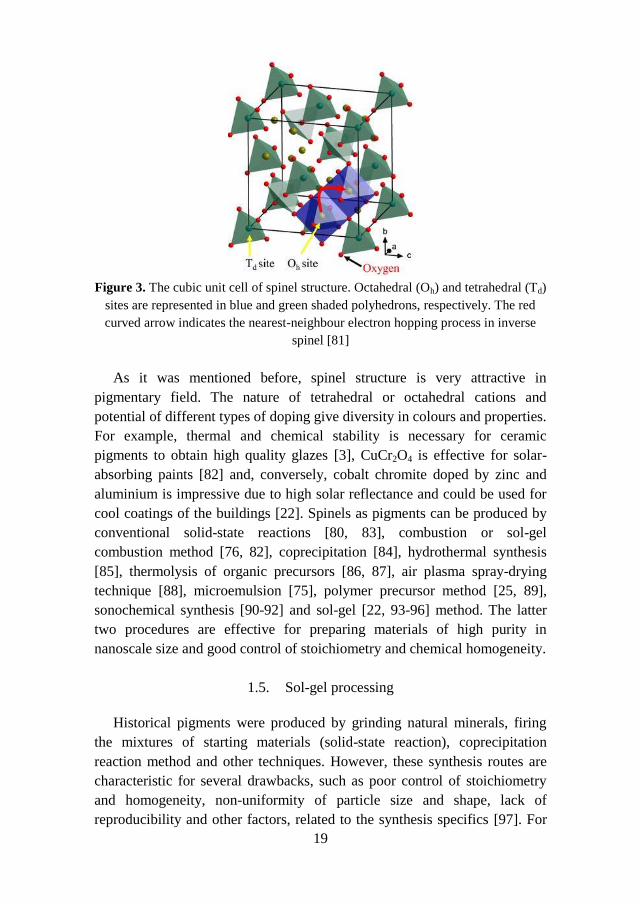
too. The schematic view of conventional face-centred cubic spinel structure
is shown in Fig. 3. The main factors controlling the preference of the
individual ions for the two crystallographic sites are the ionic radii and
coordination chemistry of the ions. There are two ideal types of spinel
structure: the first one known as normal spinel is characterised by cations
A2+
occupying tetrahedral positions and cations B3+
occupying octahedral
positions. The second possible structure is inverse spinel, in which all
tetrahedral sites are occupied by cations B3+
, while octahedral sites are
situated by equal number of cations A2+
and B3+
, and therefore can be
formulated as B(AB)O4. Besides these two ideal spinel structures, spinels
can be partially inverted; if the inversion is incomplete, the distribution of
cations may become random [25, 70, 71]. The formation of inverse spinel
can be influenced by synthesis temperature and pressure as-well [72]. Owing
to easy incorporation of various metal ions into the spinel lattice, the
properties of spinel type materials are remarkable, which lead to wide
applications as magnetic compounds [73], catalysts and sensors for toxic
gases [73-76], refractories, materials for information storage [77-79],
pigments [20, 22, 25, 80], and many others.
19
Figure 3. The cubic unit cell of spinel structure. Octahedral (Oh) and tetrahedral (Td)
sites are represented in blue and green shaded polyhedrons, respectively. The red
curved arrow indicates the nearest-neighbour electron hopping process in inverse
spinel [81]
As it was mentioned before, spinel structure is very attractive in
pigmentary field. The nature of tetrahedral or octahedral cations and
potential of different types of doping give diversity in colours and properties.
For example, thermal and chemical stability is necessary for ceramic
pigments to obtain high quality glazes [3], CuCr2O4 is effective for solar-
absorbing paints [82] and, conversely, cobalt chromite doped by zinc and
aluminium is impressive due to high solar reflectance and could be used for
cool coatings of the buildings [22]. Spinels as pigments can be produced by
conventional solid-state reactions [80, 83], combustion or sol-gel
combustion method [76, 82], coprecipitation [84], hydrothermal synthesis
[85], thermolysis of organic precursors [86, 87], air plasma spray-drying
technique [88], microemulsion [75], polymer precursor method [25, 89],
sonochemical synthesis [90-92] and sol-gel [22, 93-96] method. The latter
two procedures are effective for preparing materials of high purity in
nanoscale size and good control of stoichiometry and chemical homogeneity.
1.5. Sol-gel processing
Historical pigments were produced by grinding natural minerals, firing
the mixtures of starting materials (solid-state reaction), coprecipitation
reaction method and other techniques. However, these synthesis routes are
characteristic for several drawbacks, such as poor control of stoichiometry
and homogeneity, non-uniformity of particle size and shape, lack of
reproducibility and other factors, related to the synthesis specifics [97]. For
20
instance, one of the advantages of sol-gel synthesis is that this method
requires much lower temperatures and shorter calcination times to obtain the
desired product, comparing to conventional solid-state method [96, 98]. The
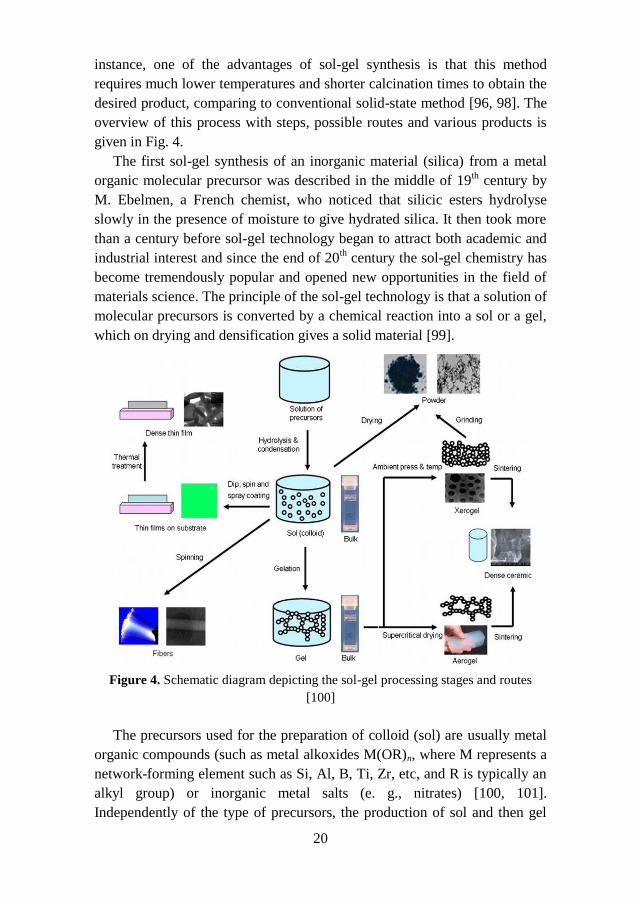
overview of this process with steps, possible routes and various products is
given in Fig. 4.
The first sol-gel synthesis of an inorganic material (silica) from a metal
organic molecular precursor was described in the middle of 19th century by
M. Ebelmen, a French chemist, who noticed that silicic esters hydrolyse
slowly in the presence of moisture to give hydrated silica. It then took more
than a century before sol-gel technology began to attract both academic and
industrial interest and since the end of 20th century the sol-gel chemistry has
become tremendously popular and opened new opportunities in the field of
materials science. The principle of the sol-gel technology is that a solution of
molecular precursors is converted by a chemical reaction into a sol or a gel,
which on drying and densification gives a solid material [99].
Figure 4. Schematic diagram depicting the sol-gel processing stages and routes
[100]
The precursors used for the preparation of colloid (sol) are usually metal
organic compounds (such as metal alkoxides M(OR)n, where M represents a
network-forming element such as Si, Al, B, Ti, Zr, etc, and R is typically an
alkyl group) or inorganic metal salts (e. g., nitrates) [100, 101].
Independently of the type of precursors, the production of sol and then gel
21
proceeds several main consecutive reactions – hydrolysis, condensation and
polymerisation. Only the basic principles and specifications of both
synthesis types, depending on the precursor origin, are further reviewed
concisely.
Synthesis with metal alkoxides as starting materials. The hydrolysis
reaction of metal alkoxide initiates very easily when mixing with water,
since metal alkoxides are very reactive in general due to the highly
electronegative OR groups, that stabilise M in its highest oxidation state and
causing thus the great sensitivity of metal ion to nucleophilic attack.
Moreover, both the hydrolysis and condensation reactions usually occur
simultaneously. The hydrolysis reaction could be represented as Eq. (1):
M(OR)n + xH2O → M(OH)x(OR)n–x + xROH (1)
Hydrolysis is followed by condensation to form –M–O–M– bonds via
either dehydration (see Eq. (2)) or dealcoholation (Eq. (3)):
(a) dehydration:
–M–OH + HO–M– → –M–O–M– + H2O (2)
(b) dealcoholation:
–M–OH + RO–M– → –M–O–M– + ROH (3)
When adequate number of interconnected –M–O–M– bonds are
assembled (polycondensation), a sol or colloidal particles are formed. The
whole system is affected by significant factors, which are temperature of the
synthesis, molar ratio of water to alkoxide, nature and concentration of
catalyst (acidic or basic), type of solvent (water or alcohol-water) and
alkoxide precursor and pressure. All these parameters but the latter one are
variable. By appropriate adjustment of these factors, either linear polymeric
gel or more crosslinked polymeric gel can be formed [97, 100-102].
However, the sol-gel synthesis via metal alkoxides distinguishes major
disadvantages, such as high sensibility to the moist environment and
unavailability of commercial precursors especially for the mixed-metal
oxides. The sol-gel synthesis of mixed oxides from alkoxide mixture usually
suffers from the different hydrolysis susceptibilities of the individual
components. Thus, during the hydrolysis of the alkoxides, the benefits of
improved homogeneity can be lost, which may ultimately lead to mixed
phases in the final materials [96].
22
Synthesis with inorganic metal salts as starting materials. Metal ions
Mz+
, dissolved in water in a form of metal salt, are solvated by water
molecules [M(H2O)n]z+
. The solvated cations show a great tendency to
release the protons due to the occurrence of charge transfer from water
molecule to the metal. Depending on the degree of charge transfer and
resultant water acidity increase, hydrolysis proceeds, which could be defined
as following equilibria (Eq. 4):
[M(OH2)]z+
⇌ [M–OH](z–1)+
+ H+ ⇌ [M=O]
(z–2)+ + 2H
+ (4)
In addition, Equation (4) describes the ligands forming during the
hydrolysis reaction: aqua (M–OH2), hydroxo (M–OH), and oxo (M=O). Two
main factors determining the degree of the hydrolysis are the formal charge z
of the cation Mz+
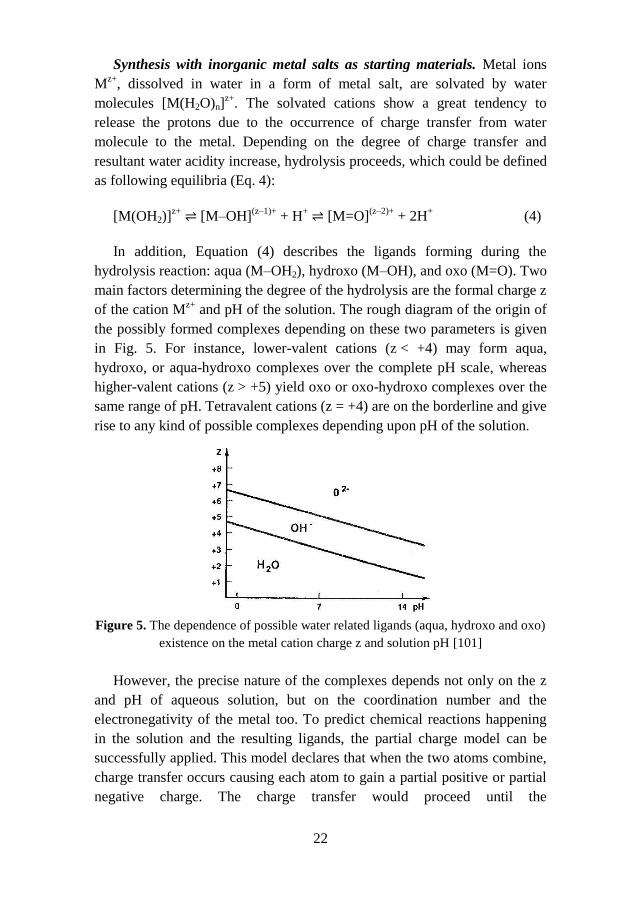
and pH of the solution. The rough diagram of the origin of
the possibly formed complexes depending on these two parameters is given
in Fig. 5. For instance, lower-valent cations (z < +4) may form aqua,
hydroxo, or aqua-hydroxo complexes over the complete pH scale, whereas
higher-valent cations (z > +5) yield oxo or oxo-hydroxo complexes over the
same range of pH. Tetravalent cations (z = +4) are on the borderline and give
rise to any kind of possible complexes depending upon pH of the solution.
Figure 5. The dependence of possible water related ligands (aqua, hydroxo and oxo)
existence on the metal cation charge z and solution pH [101]
However, the precise nature of the complexes depends not only on the z
and pH of aqueous solution, but on the coordination number and the
electronegativity of the metal too. To predict chemical reactions happening
in the solution and the resulting ligands, the partial charge model can be
successfully applied. This model declares that when the two atoms combine,
charge transfer occurs causing each atom to gain a partial positive or partial
negative charge. The charge transfer would proceed until the
23
electronegativities of all the atoms become equal to the mean
electronegativity.
However, the concentration of the solutions of the simple inorganic salts
is not capable attaining a good homogeneity at atomic scale. As a resulting
product heterogeneous mixture of precipitates as the original salt form or as
colloidal hydroxides is generally obtained by evaporating the solvent. The
precipitates tend to deposit on condition of unequal reaction rates of
hydrolysis and condensation or increased pH values. To bypass that, suitable
organic ligands, such as citric acid, EDTA, etc., are engaged, creating stable
mixture of precursor solutions. Introduced chelating agent thus weakens the
hydrolysis of coordinated water molecules.
Condensation of the hydrolysed species proceeds via olation or oxolation.
Olation occurs commonly with hydroxo-aqua complexes [M(OH)x(H2O)n–
x](z–x)+
, (x < n), leading to the formation of a hydroxo bridge M–OH–M,
whereas oxolation happens typically with oxo-hydroxo complexes
[MOx(OH)n–x]n+x–z
, (x < n), causing the formation of an oxo bridge M–O–M
[97, 101].
The hydrolysis and condensation processes of metal salts avoid the
disadvantage of alkoxide sol-gel process (high sensitivity to moisture),
however, have still the drawback of different hydrolysis susceptibilities of
the individual components. [96].
Further processing of the sol or gel enables one to make sol-gel materials
in different configurations (see Fig. 4). Thin films can be produced on a
piece of substrate by spin, dip and spray coating of the sol solution. With
further drying and heat treatment of the gel, it can be transformed into dense
ceramic or glass particles. During the drying process at ambient pressure, the
solvent is removed and substantial shrinkage occurs, resulting xerogel. When
solvent removal occurs under hypercritical (supercritical) conditions, the
network does not shrink and a highly porous, low-density material aerogel is
produced. Heat treatment of a xerogel at elevated temperature produces
viscous sintering (shrinkage of the xerogel due to a small amount of viscous
flow) and effectively transforms the porous gel into a dense glass. As the
viscosity of the sol is adjusted into a proper viscosity range, ceramic fibers
can be drawn from the sol. Ultra-fine and uniform ceramic powders are
formed by emulsion, spray pyrolysis or precipitation techniques [100].
1.6. Basics of the sonochemical synthesis
Sonochemistry is the research area in which molecules undergo a
chemical reaction due to the application of powerful ultrasound radiation
24
(20 kHz to 10 MHz). It is noteworthy, however, that no direct interaction
between the ultrasound molecules can be responsible for the chemical
reactions. Instead, the chemical effects of the ultrasound arise from
temporary “hot-spots”, formed during acoustic cavitation (the creation,
growth and collapse of bubbles in a liquid). This acoustic cavitation leads to
the rapid release of energy with heating and cooling rates of about
milliard °C∙s–1
, temperatures of few thousand °C and pressures of few
thousand atmospheres. Under such extreme conditions the solvent molecules
experience homolytic bond cleavage and generate radicals, which may
interact in many ways chemically and physically. In general, different
properties of the final product, such as particle size, shape and its purity
would be under the control of following series of factors: sonication output
power, frequency of irradiation, time, temperature, origin of the solvent, and
chemical species and their concentrations in the reaction mixture.
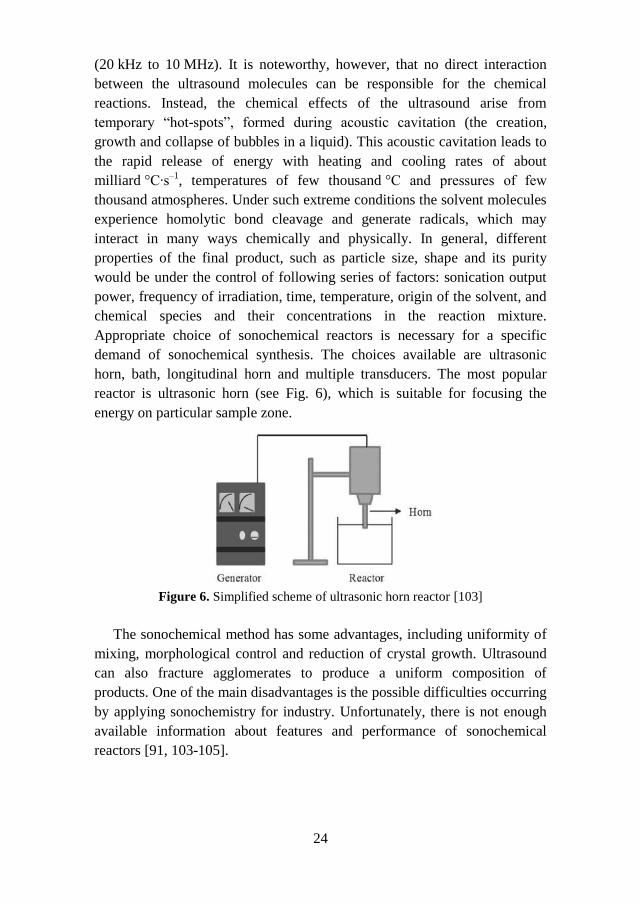
Appropriate choice of sonochemical reactors is necessary for a specific
demand of sonochemical synthesis. The choices available are ultrasonic
horn, bath, longitudinal horn and multiple transducers. The most popular
reactor is ultrasonic horn (see Fig. 6), which is suitable for focusing the
energy on particular sample zone.
Figure 6. Simplified scheme of ultrasonic horn reactor [103]
The sonochemical method has some advantages, including uniformity of
mixing, morphological control and reduction of crystal growth. Ultrasound
can also fracture agglomerates to produce a uniform composition of
products. One of the main disadvantages is the possible difficulties occurring
by applying sonochemistry for industry. Unfortunately, there is not enough
available information about features and performance of sonochemical
reactors [91, 103-105].
25
2. EXPERIMENTAL SECTION
2.1. Chemicals and materials
Nine analogous to historical green pigments were purchased from Kremer
Pigmente. In this study, all the pigments were called according to
manufacturer’s catalogue: malachite (CuCO3∙Cu(OH)2), verdigris
(Cu(CH3COO)2∙[Cu(OH)2]3∙2H2O), Egyptian green (Cu silicate), cobalt
green (Co, Al, Ti, Ni, Zn oxides), cobalt bottle green (CoCr2O4), chrome
oxide green (Cr2O3), Victoria green (Ca3Cr2(SiO4)3), Florentine green and
green jasper. The chemical formulas given in the brackets are as the
producer stated. Florentine green and green jasper were bought with the
unknown chemical compositions.
For the synthesis of green pigments, bluish-green spinel-type cobalt
chromite was chosen as the base structure. All reagents were of analytical
grade or high purity and used as received from commercial sources without
further purification. Chromium(III) nitrate nonahydrate (Cr(NO3)3∙9H2O,
99%, Sigma-Aldrich and p.a., Pliva-Lachema), cobalt(II) nitrate hexahydrate
(Co(NO3)2∙6H2O, ≥97.7%, Alfa Aesar and p.a., Lach-Ner), copper(II) acetate
monohydrate (Cu(CH3COO)2∙H2O, 99%, Sigma-Aldrich and p.a., Riedel-de
Haen AG), nickel(II) acetate tetrahydrate (Ni(CH3COO)2∙4H2O, 98%,
Sigma-Aldrich), nickel(II) nitrate hexahydrate (Ni(NO3)2∙6H2O, p.a., Pliva-
Lachema), zinc acetate dihydrate (Zn(CH3COO)2∙2H2O, p.a., Roth, and p.a.,
Pliva-Lachema), thulium(III) oxide (Tm2O3, 99.99%, Alfa Aesar),
ytterbium(III) oxide (Yb2O3, 99.9%, Merck), and gallium(III) oxide (Ga2O3,
99.99%, Alfa Aesar), were used as starting materials. Metal oxides were
dissolved in concentrated nitric acid (HNO3, 67%, Eurochemicals). 1,2-
ethanediol (C2H6O2, 99.5%, Sigma-Aldrich) as complexing agent and
ammonia solution (NH4OH, 26%, Mikrochem) were used for sol-gel and
sonochemical syntheses, respectively. Acetone (C3H6O, p.a., Mikrochem)
and pure argon were used in the sonochemical processing.
For the preparation of lead-based ceramic glazes, red lead (Pb3O4) and
silica (SiO2) were purchased from Kremer Pigmente. For the preparation of
lead-free ceramic glazes the Czech transparent colourless base glaze
(commercial ID P074 10) was used.
2.2. Synthesis methods
All CoCr2O4 based compounds were prepared initially by sol-gel and
sonochemical synthesis routes.
26
2.2.1. Sol-gel synthesis
For the preparation of Co1–xMxCr2O4 (M = Ni2+
, Cu2+
, and Zn2+
; x = 0;
0.25; 0.5; 0.75; and 1) pigments, stoichiometric amounts of metal nitrates or
acetates were dissolved in deionised water and mixed together. After stirring
the solutions at 40–50 °C for 20 min, 1,2-ethanediol (2 mL) was added with
continuous stirring at the same temperature for 1 h. The solutions were
concentrated by continuous stirring and evaporation at 60–70 °C. Prepared
gels were dried in a furnace at 105 °C in air. Dried gels were ground in an
agate mortar and calcined at 600, 700, and 800 °C in air for 3 h with a
heating rate of 10 °C/min. The powders calcined at 700 °C were ground
again and additionally annealed at 1000 °C in air for 5 h with the heating rate
of 10 °C/min and later were used for the preparation of ceramic glazes.
For the preparation of CoCr2–xLnxO4 (Ln = Tm3+
and Yb3+
; x = 0; 0.01;
0.02; 0.03; 0.04; 0.05; 0.1; 0.2; 0.3; 0.4 and 0.5; and CoCr2–xGaxO4 (x = 0;
0.5; 1; 1.5; and 2) compounds, metal oxides were dissolved in required
amounts of hot diluted HNO3 with continuous stirring and covered glass
beaker by a watch glass, until the clear solutions were obtained. The
stoichiometric amounts of Cr(NO3)3∙9H2O and Co(NO3)2∙6H2O were
dissolved in deionised water and mixed together with respective metal oxide
solution. After mixing, the solutions were stirred at 40–50 °C for 20 min and
then 2 mL of 1,2-ethandiol was added with continuous stirring at the same
temperature for 1 h. The solutions were concentrated by continuous stirring
and evaporation at 60–70 °C. Prepared gels were dried in a furnace at 105–
110 °C in air, carefully ground in the agate mortar and annealed at 700 °C in
air for 3 h with a heating rate of 5 °C/min. The obtained powders were
ground once again and additionally heated at 800, 900, and 1000 °C in air
for 5 h with the heating rate of 10 °C/min. After the calcination at 700 °C,
CoCr2–xGaxO4 powders were exceptionally annealed only at 1000 °C.
2.2.2. Sonochemical synthesis
For the sonochemical reactions, the mixtures of Co-M-Cr-O (M = Ni, Cu,
Zn) gel precursors were prepared in identical manner as for the sol-gel
synthesis, except that after 20 min of stirring ammonia instead of 1,2-
ethanediol was added, until the pH of the solution reached values of 9–10.
After stirring for 10 min, the flask with the solution was purged with pure
argon for 15 min and irradiated with ultrasound radiation under argon for
2.5 h by employing a direct immersion horn. The reaction cell was cooled
during the sonication process. After sonication was completed, the
27
precipitate was separated from the solution by centrifugation, washed once
with distilled water and once with acetone and finally dried in air. As-
prepared products were ground in agate mortar and calcined at 600, 700, and
800 °C for 3 h in air with a heating rate of 10 °C/min. Sonication was
performed using a Sonics and Materials VCX130 reactor with a titanium
13 mm diameter horn operating at 20 kHz at a power of 20 W/cm2.
Since the ammonia caused spontaneous precipitation, for comparison a
coprecipitation reaction to obtain Co1–xMxCr2O4 (M = Ni2+
, Cu2+
, and Zn2+
;
x = 0 and 0.5) powders was performed as-well. The processing route was as
a sonochemical synthesis except involving the ultrasound treatment.
2.2.3. Synthesis of ceramic glazes
For the preparation of the Pb-based ceramic glazes with the commercial
pigments, in all cases the same molar ratio of ingredients has been selected:
Pb3O4 : SiO2 : pigment = 2.85 : 1.9 : 0.25 [106]. The samples with evaluated
weight percentages of the pigments are described in Table 1. The amount of
unknown composition pigments (No. 8 and No. 9) was picked to be
1.40 wt%. 0.5 g of each mixture was mingled with a small amount of water
and carefully plastered onto terracotta tiles (3 x 4 cm). After drying in air,
the prepared terracotta samples were fired in an oxidising atmosphere at 900
and 1000 °C for 1 h with a heating rate of 5 °C/min.
Table 1. The information about commercial analogous to historical green pigments
(Kremer Pigmente) and their weight percentages in the lead-based glazes
Sample
No.
Catalogue
No. Pigment (formula according to producer) wt%
1. 10300 Malachite (CuCO3∙Cu(OH)2) 2.60
2. 44450 Verdigris (Cu(CH3COO)2∙[Cu(OH)2]3∙2H2O) 5.81
3. 44100 Cobalt green (Co, Al, Ti, Ni, Zn oxides) 5.74
4. 44130 Cobalt bottle green (CoCr2O4, Li, Ti, Zn oxides) 2.67
5. 44200 Chrome oxide green (Cr2O3) 1.80
6. 10064 Egyptian green (Cu silicate) 1.47
7. 44190 Victoria green (3CaO : Cr2O3 : 3SiO2) 5.70
8. 11152 Florentine green (?) 1.40
9. 11200 Green jasper (?) 1.40
For the preparation of the glazes with Co1–xMxCr2O4 (M = Ni2+
, Cu2+
, and
Zn2+
; x = 0; 0.25; 0.5; 0.75; and 1) pigments obtained by sol-gel processing,
the same molar ratio of glass-forming ingredients has been selected:
Pb3O4 : SiO2 = 1.5 : 1. The amounts of pigments (x = 0 and 1) have been
28
chosen to be 3, 5 and 7 wt%. The percentage of pigments with the other
substitution ratios (x = 0.25; 0.5; 0.75) has been set to 5 wt%. The mixtures
of the components and drops of water were thoroughly plastered onto
terracotta tiles and after drying in air fired in oxidising atmosphere at
1000 °C for 1 h with a heating rate of 5 °C/min.
For the preparation of Pb-free ceramic glazes, 5 wt% of the pigment was
applied for the majority types of the base glazes according to the glaze
manufacturer’s recommendations. Prepared wet mixtures were carefully
plastered on terracotta tiles, and after drying in air fired in oxidising
atmosphere at 1000 °C for 1 h with a heating rate of 5 °C/min. For the
preparation of the ceramic glazes with the commercial pigments, 0.5 g, 0.6 g
or 1 g of each mixture was used. For the preparation of the glazes with
synthesised pigments, 1 g of each mixture was used.
2.3. Characterisation techniques
X-ray powder diffraction (XRD). The XRD analysis of the samples was
performed using a Rigaku MiniFlex II diffractometer, operated at 30 kV and
10 mA with a scanning speed of 10°/min, in a scanning range of 2θ = 10–
80°, using Cu Kα radiation (λ = 1.540562 Å). The unit-cell lattice parameters
for the chromites, substituted by lanthanides, were obtained by Rietveld
refinement of the powder XRD data using the FULLPROF software. The
tentative crystallite sizes of synthesised pigments were determined by the
Scherrer equation (Eq. 5):
(5)
where τ is the mean crystallite size, λ is the X-ray wavelength, B is the
line broadening at half maximum intensity (FWHM) (in radians) and θ is the
Bragg angle.
SEM-EDX. The morphological features of commercial and synthesised
pigments were investigated using a scanning electron microscope Hitachi
SU-70 at different magnifications. The images of morphology of fired glazes
were obtained employing Hitachi TM3000, using 15.0 kV accelerating
voltage for EDX measurements of commercial pigments and lead-free base
glaze powder.
Fourier-transform infrared spectroscopy (FTIR). For FTIR studies a
Perkin Elmer Spectrum BX spectrometer with ATR accessory was used.
Transmittance (%) was taken in the range of 4000–600 cm–1
by the co-
addition of 10 scans with a resolution of 2 cm−1
. For some samples the FTIR
29
spectra were recorded in the same range by a Bruker Tensor 27 equipment
with a resolution 4 cm−1
for each spectrum, which consisted of 32 scans. For
latter measurements the KBr pellet technique was applied.
Raman spectroscopy. Raman spectroscopy was carried out using a
Horiba Scientific LabRam HR Evolution spectrometer with the Olympus
microscope (objective magnification 50) in the spectral range of 80–
1000 cm−1
at 532 nm.
Inductively coupled plasma optical emission spectrometry (ICP-OES).
For the determination of element ratio in the sol-gel synthesised pigments
with initial calculations, Thermo iCAP 6500 Duo technique was employed.
Co1–xMxCr2O4 and CoCr2–xLnxO4 samples were dissolved in concentrated
HCl and H3PO4, respectively, and CoCr2–xGaxO4 powders were dissolved in
the mixture of concentrated H2SO4, HF, and HClO4 (2 : 1 : 1.25, by volume,
respectively). The samples were decomposed in microwave system Ethos
One from Milestone.
Thermal analysis. The thermal behaviour of the Co-M-Cr-O gel
precursors was investigated through thermogravimetry and derivative
thermogravimetry (TG/DTG) with Perkin Elmer STA6000 apparatus. Dried
samples were placed in an open corundum crucible and heated from room
temperature up to 950 °C with a heating rate of 10 °C/min under dried air
flow of 20 mL/min. The precursors obtained by sonochemical and
coprecipitation methods were analysed by Netzsch STA 449C apparatus,
using Pt crucible and a heating rate of 5 °C/min from room temperature up to
950 °C under an air flow of 70 mL/min air and 10 mL/min of nitrogen.
Diffuse reflectance UV/Vis spectroscopy (DR-UV). The diffuse
reflectance spectra of sol-gel and sonochemically derived pigments were
determined on an Agilent Technologies Cary 5000 spectrophotometer from
200 to 800 nm, using a BaCO3 pellet as white reference.
CIELab colour characterisation. The colour of the synthesised pigments
and their ceramic glazes was evaluated by the CIELab colourimetric method,
which is recommended by the Commission Internationale de l’Eclairage.
The L*, a*, and b* parameters were measured on a Perkin Elmer Lambda
950 spectrophotometer in the 780–380 nm range, employing an illuminant
D65 and a 10° standard observer. In the CIELab system, the coordinate L*
represents the lightness of the colour (L* = 0 and L* = 100 represents black
and white, respectively). The negative/positive values of coordinate a*
represent green/red hue, respectively, and the parameter b* corresponds to
blue/yellow hue, where negative values are for blue and positive – for
yellow.

30
X-ray photoelectron spectroscopy (XPS). XPS analysis of samples was
carried out on the upgraded Vacuum Generator (VG) ESCALAB MKII
spectrometer fitted with a XR4 twin anode. The non-monochromatic Al Kα
X-ray source was used (hν = 1486.6 eV) and the spectra were acquired with
electron analyser pass energy of 20 eV for narrow scans. All spectra were
recorded at a 90° take-off angle and calibrated from the hydrocarbon
contamination using the C1s peak at 284.6 eV. Core level peaks of Co2p,
Cr2p, C1s, N1s, O1s, Tm4d and Yb4d were analysed using a nonlinear
Shirley-type background. All XPS measurements were performed without
any pre-etching of the samples.
Optical microscopy (OM). The ceramic glazes were investigated using a
Motic SMZ-171 optical microscope at different magnifications. Digital
photographs were taken by Moticam 10.0MP digital camera accessory and
processed with a Motic Images Plus 3.0 ML software.
The digital images of both the pigment and ceramic glaze samples were
taken using a Canon PowerShot S110 digital camera. The photographs were
processed with Photoshop CC and CorelDraw softwares.
31
3. RESULTS AND DISCUSSION
3.1. Characterisation of analogous to historical green pigments, their glaze
mixtures and ceramic glazes
In this part of dissertation the applicability of XRD analysis and FTIR
spectroscopy to investigate commercial analogous to historical green
pigments and their glaze mixtures was evaluated.
3.1.1. EDX analysis
The first aim was to determine the composition of green inorganic
pigments with unknown constitution. For this purpose the EDX analysis was
performed foremost. The results are given in Table 2.
Table 2. The EDX analysis results of commercial pigments
Pigment Element (at%)
Malachite Cu (9.93)
Verdigris Cu (6.55)
Cobalt green Ba (5.81) Ni (5.71) S (4.45) Ti (4.10) Co (3.17) Zn (2.20)
Cobalt bottle green Cr (19.66) Mg (5.81) Co (2.18) Zn (1.57)
Chrome oxide green Cr (17.62)
Egyptian green Si (16.15) Cu (2.34) Na (1.03)
Victoria green Si (13.32) Ca (6.91) F (4.84) Cr (1.96) K (1.10)
Florentine green Mg (9.96) Si (7.39) Fe (3.53)
Green jasper Si (14.52) Fe (10.74) Cr (1.04)
Pb-based glazes were the most generally used glazes in Europe since 5–
1st millennium BCE until about 15
th century, therefore the second task was to
investigate the detectability of pigments in their lead-based glaze mixtures
using XRD analysis and FTIR spectroscopy. In order to verify the ability to
detect pigments in their glaze mixtures of the above techniques, both
analyses were performed on the model samples. The third task was to
analyse morphological features of the fired ceramic glazes by optical and
scanning electron microscopies.
3.1.2. XRD analysis
The XRD patterns of malachite and verdigris pigments are shown in Fig.
7. All diffraction peaks of pigment No. 1 (Table 1) correspond to a standard
pattern of malachite CuCO3∙Cu(OH)2 (PDF 72-0075) (see Fig. 7a). The
formula of verdigris presented in the catalogue of Kremer Pigmente is given
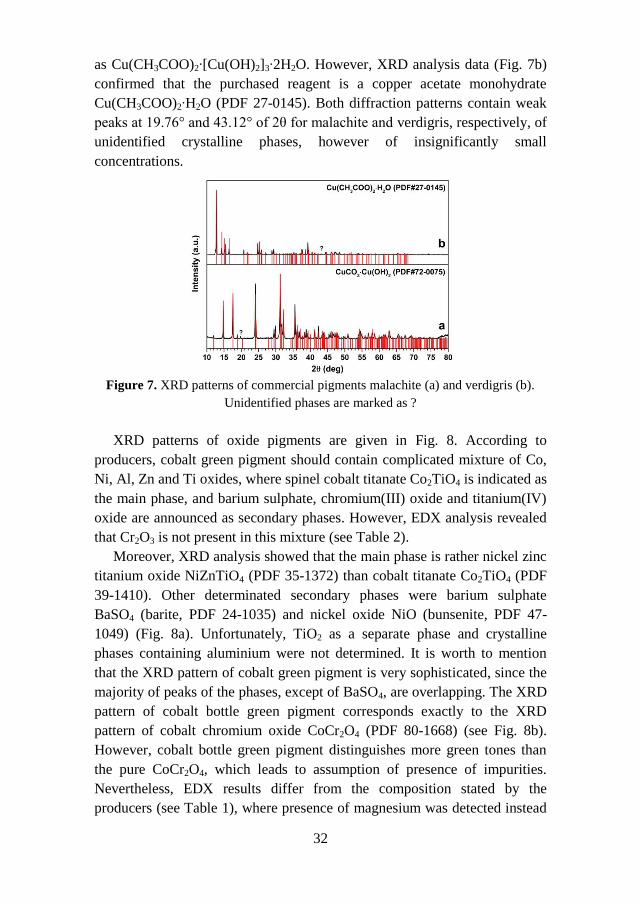
32
as Cu(CH3COO)2∙[Cu(OH)2]3∙2H2O. However, XRD analysis data (Fig. 7b)
confirmed that the purchased reagent is a copper acetate monohydrate
Cu(CH3COO)2∙H2O (PDF 27-0145). Both diffraction patterns contain weak
peaks at 19.76° and 43.12° of 2θ for malachite and verdigris, respectively, of
unidentified crystalline phases, however of insignificantly small
concentrations.
Figure 7. XRD patterns of commercial pigments malachite (a) and verdigris (b).
Unidentified phases are marked as ?
XRD patterns of oxide pigments are given in Fig. 8. According to
producers, cobalt green pigment should contain complicated mixture of Co,
Ni, Al, Zn and Ti oxides, where spinel cobalt titanate Co2TiO4 is indicated as
the main phase, and barium sulphate, chromium(III) oxide and titanium(IV)
oxide are announced as secondary phases. However, EDX analysis revealed
that Cr2O3 is not present in this mixture (see Table 2).
Moreover, XRD analysis showed that the main phase is rather nickel zinc
titanium oxide NiZnTiO4 (PDF 35-1372) than cobalt titanate Co2TiO4 (PDF
39-1410). Other determinated secondary phases were barium sulphate
BaSO4 (barite, PDF 24-1035) and nickel oxide NiO (bunsenite, PDF 47-
1049) (Fig. 8a). Unfortunately, TiO2 as a separate phase and crystalline
phases containing aluminium were not determined. It is worth to mention
that the XRD pattern of cobalt green pigment is very sophisticated, since the
majority of peaks of the phases, except of BaSO4, are overlapping. The XRD
pattern of cobalt bottle green pigment corresponds exactly to the XRD
pattern of cobalt chromium oxide CoCr2O4 (PDF 80-1668) (see Fig. 8b).
However, cobalt bottle green pigment distinguishes more green tones than
the pure CoCr2O4, which leads to assumption of presence of impurities.
Nevertheless, EDX results differ from the composition stated by the
producers (see Table 1), where presence of magnesium was detected instead
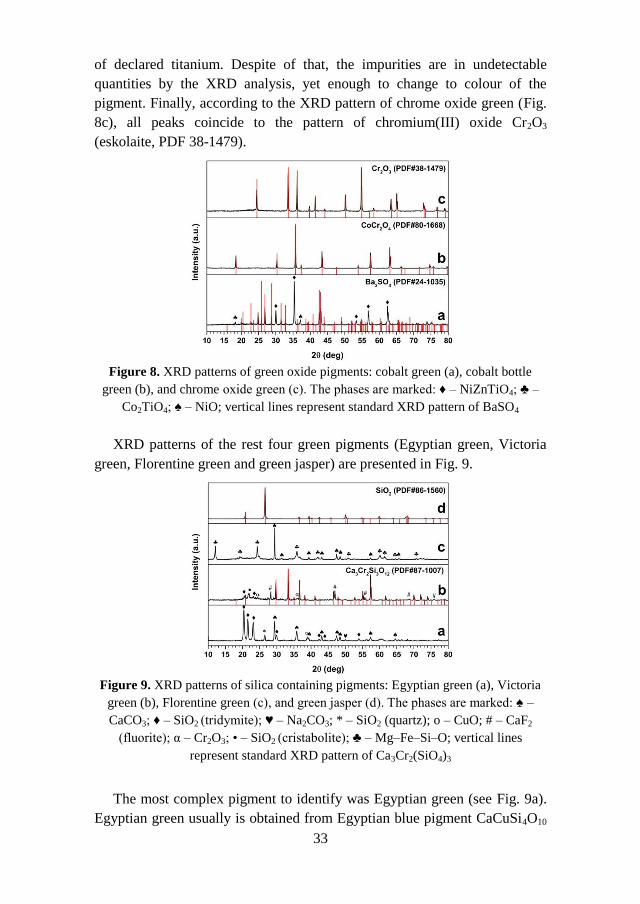
33
of declared titanium. Despite of that, the impurities are in undetectable
quantities by the XRD analysis, yet enough to change to colour of the
pigment. Finally, according to the XRD pattern of chrome oxide green (Fig.
8c), all peaks coincide to the pattern of chromium(III) oxide Cr2O3
(eskolaite, PDF 38-1479).
Figure 8. XRD patterns of green oxide pigments: cobalt green (a), cobalt bottle
green (b), and chrome oxide green (c). The phases are marked: ♦ – NiZnTiO4; ♣ –
Co2TiO4; ♠ – NiO; vertical lines represent standard XRD pattern of BaSO4
XRD patterns of the rest four green pigments (Egyptian green, Victoria
green, Florentine green and green jasper) are presented in Fig. 9.
Figure 9. XRD patterns of silica containing pigments: Egyptian green (a), Victoria
green (b), Florentine green (c), and green jasper (d). The phases are marked: ♠ –
CaCO3; ♦ – SiO2 (tridymite); ♥ – Na2CO3; * – SiO2 (quartz); o – CuO; # – CaF2
(fluorite); α – Cr2O3; • – SiO2 (cristabolite); ♣ – Mg–Fe–Si–O; vertical lines
represent standard XRD pattern of Ca3Cr2(SiO4)3
The most complex pigment to identify was Egyptian green (see Fig. 9a).
Egyptian green usually is obtained from Egyptian blue pigment CaCuSi4O10
34
(cuprorivaite) by heating it or its raw materials, such as siliceous sand, lime,
copper compounds and flux (soda or other), above 1000 °C [107]. The XRD
results revealed that this pigment contains calcite CaCO3 (PDF 72-1652),
tridymite SiO2 (PDF 71-0197), copper(II) oxide CuO (PDF 74-1021), quartz
SiO2 (PDF 83-2465), and sodium carbonate Na2CO3 (PDF 86-0297).
Presumably the XRD pattern of Egyptian green shows only starting
materials for the green frit since no newly formed phase was determined.
According to the data in catalogue of manufacturer, Victoria green pigment
should be garnet calcium chromium silicate. Although the X-ray diffraction
analysis (see Fig. 9b) confirmed the presence of Ca3Cr2(SiO4)3 (uvarovite,
PDF 87-1007) as the main phase, it also showed the presence of calcium
fluoride CaF2 (PDF 35-0816), tridymite SiO2 (PDF 71-0197), silica SiO2
(cristabolite, PDF 77-1317), and chromium(III) oxide Cr2O3 (PDF 85-0730)
as secondary phases. These results imply that Victoria green pigment
contains primary materials of the synthesis in its mixture.
Unfortunately, even after XRD measurements the phase composition of
green pigment Florentine green still remained unclear. The results revealed
that Florentine green (see Fig. 9c) contains calcite CaCO3 (PDF 81-2027)
and magnesium iron silicate Mg–Fe–Si–O (PDF 22-0710). However, all
diffraction peaks of green jasper (Fig. 9d) coincide only to silicon oxide SiO2
(quartz, PDF 86-1560) and no phases of chromophore were identified.
According to EDX results coinciding with literature, the chromophore
should be iron [108, 109] and/or chromium [110] compounds.
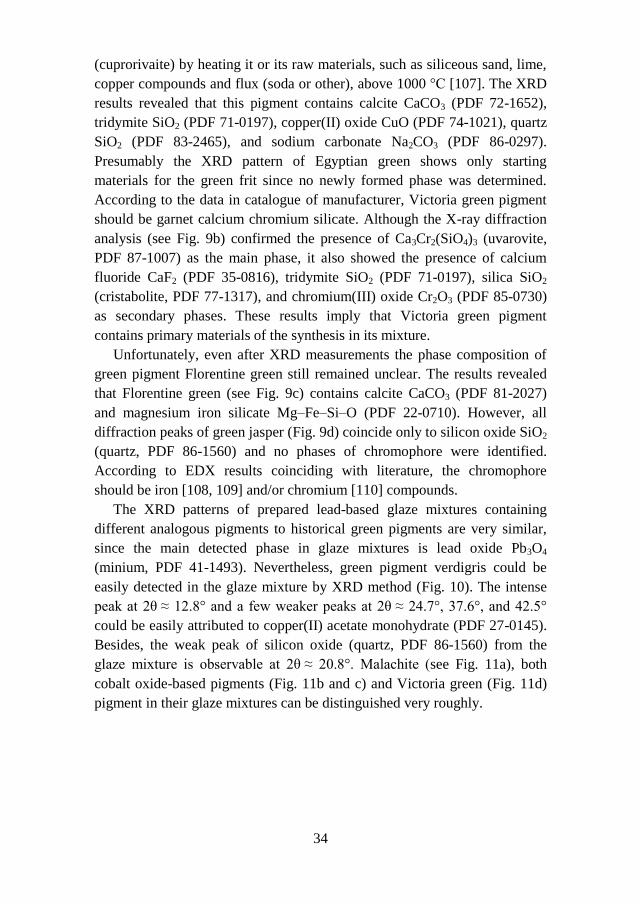
The XRD patterns of prepared lead-based glaze mixtures containing
different analogous pigments to historical green pigments are very similar,
since the main detected phase in glaze mixtures is lead oxide Pb3O4
(minium, PDF 41-1493). Nevertheless, green pigment verdigris could be
easily detected in the glaze mixture by XRD method (Fig. 10). The intense
peak at 2θ ≈ 12.8° and a few weaker peaks at 2θ ≈ 24.7°, 37.6°, and 42.5°
could be easily attributed to copper(II) acetate monohydrate (PDF 27-0145).
Besides, the weak peak of silicon oxide (quartz, PDF 86-1560) from the
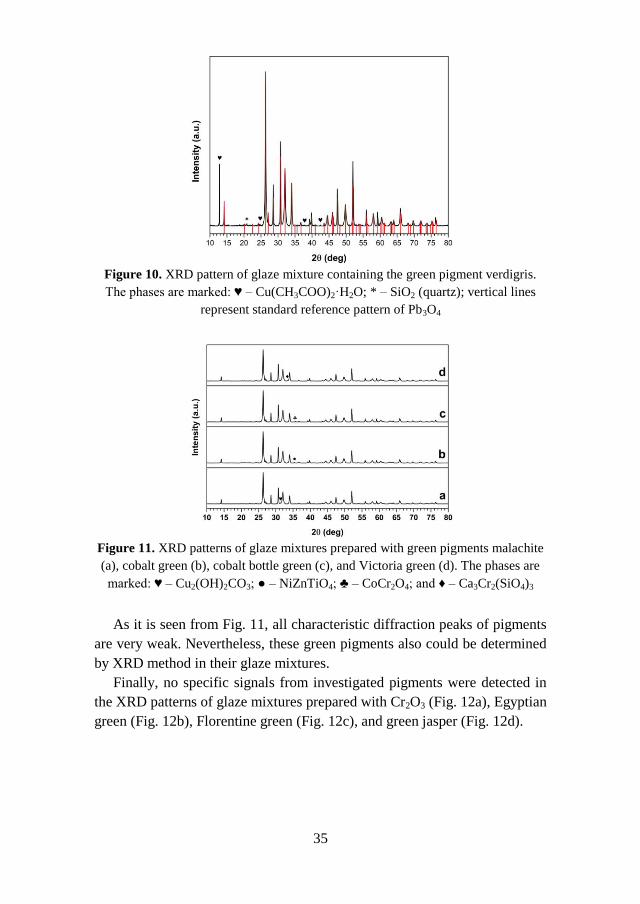
glaze mixture is observable at 2θ ≈ 20.8°. Malachite (see Fig. 11a), both
cobalt oxide-based pigments (Fig. 11b and c) and Victoria green (Fig. 11d)
pigment in their glaze mixtures can be distinguished very roughly.
35
Figure 10. XRD pattern of glaze mixture containing the green pigment verdigris.
The phases are marked: ♥ – Cu(CH3COO)2·H2O; * – SiO2 (quartz); vertical lines
represent standard reference pattern of Pb3O4
Figure 11. XRD patterns of glaze mixtures prepared with green pigments malachite
(a), cobalt green (b), cobalt bottle green (c), and Victoria green (d). The phases are
marked: ♥ – Cu2(OH)2CO3; ● – NiZnTiO4; ♣ – CoCr2O4; and ♦ – Ca3Cr2(SiO4)3
As it is seen from Fig. 11, all characteristic diffraction peaks of pigments
are very weak. Nevertheless, these green pigments also could be determined
by XRD method in their glaze mixtures.
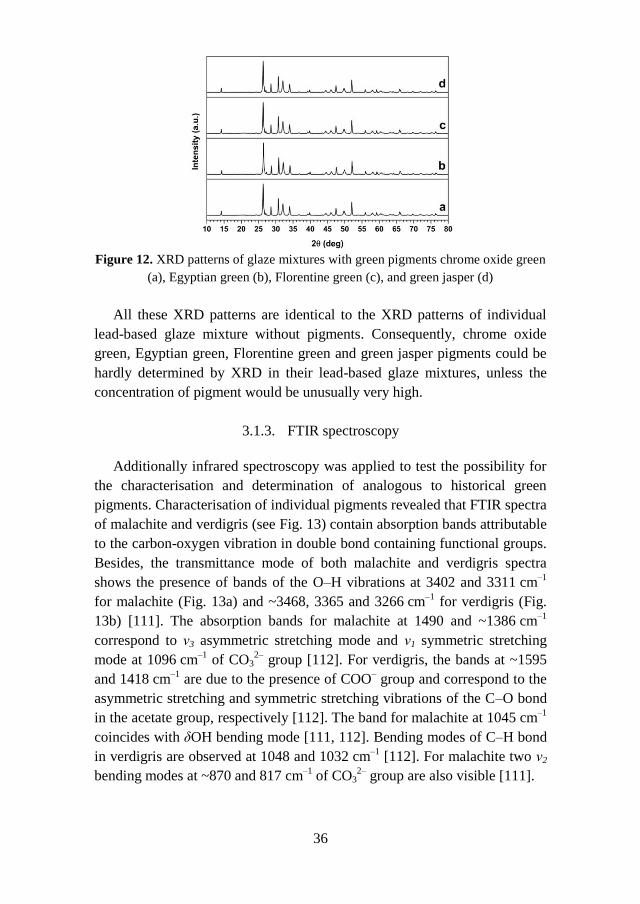
Finally, no specific signals from investigated pigments were detected in
the XRD patterns of glaze mixtures prepared with Cr2O3 (Fig. 12a), Egyptian
green (Fig. 12b), Florentine green (Fig. 12c), and green jasper (Fig. 12d).
36
Figure 12. XRD patterns of glaze mixtures with green pigments chrome oxide green
(a), Egyptian green (b), Florentine green (c), and green jasper (d)
All these XRD patterns are identical to the XRD patterns of individual
lead-based glaze mixture without pigments. Consequently, chrome oxide
green, Egyptian green, Florentine green and green jasper pigments could be
hardly determined by XRD in their lead-based glaze mixtures, unless the
concentration of pigment would be unusually very high.
3.1.3. FTIR spectroscopy
Additionally infrared spectroscopy was applied to test the possibility for
the characterisation and determination of analogous to historical green
pigments. Characterisation of individual pigments revealed that FTIR spectra
of malachite and verdigris (see Fig. 13) contain absorption bands attributable
to the carbon-oxygen vibration in double bond containing functional groups.
Besides, the transmittance mode of both malachite and verdigris spectra
shows the presence of bands of the O–H vibrations at 3402 and 3311 cm–1
for malachite (Fig. 13a) and ~3468, 3365 and 3266 cm–1
for verdigris (Fig.
13b) [111]. The absorption bands for malachite at 1490 and ~1386 cm–1
correspond to ν3 asymmetric stretching mode and ν1 symmetric stretching
mode at 1096 cm–1
of CO32–
group [112]. For verdigris, the bands at ~1595
and 1418 cm–1
are due to the presence of COO– group and correspond to the
asymmetric stretching and symmetric stretching vibrations of the C–O bond
in the acetate group, respectively [112]. The band for malachite at 1045 cm–1
coincides with δOH bending mode [111, 112]. Bending modes of C–H bond
in verdigris are observed at 1048 and 1032 cm–1
[112]. For malachite two ν2
bending modes at ~870 and 817 cm–1
of CO32–
group are also visible [111].
37
Figure 13. FTIR spectra of pigments malachite (a) and verdigris (b)
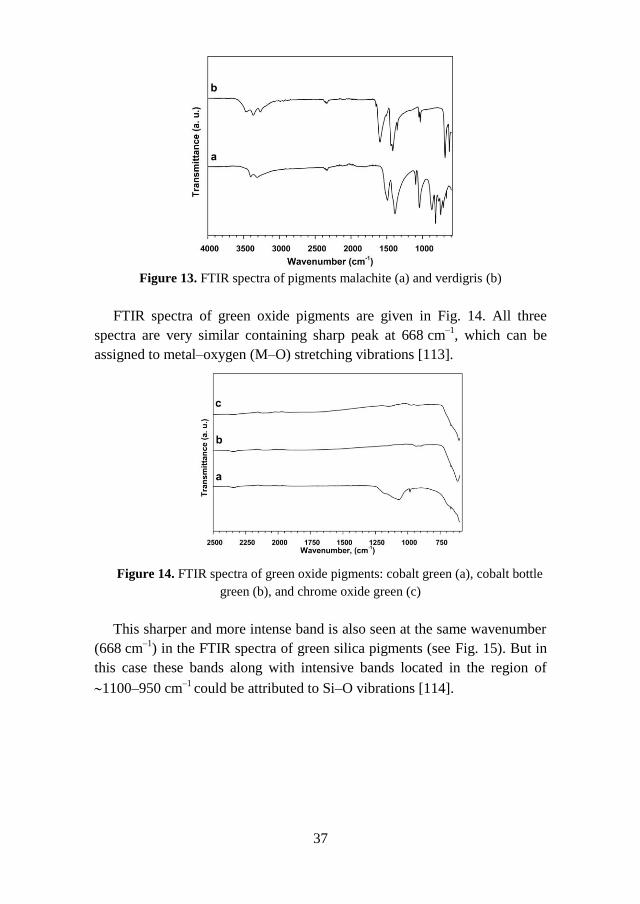
FTIR spectra of green oxide pigments are given in Fig. 14. All three
spectra are very similar containing sharp peak at 668 cm–1
, which can be
assigned to metal–oxygen (M–O) stretching vibrations [113].
Figure 14. FTIR spectra of green oxide pigments: cobalt green (a), cobalt bottle
green (b), and chrome oxide green (c)
This sharper and more intense band is also seen at the same wavenumber
(668 cm–1
) in the FTIR spectra of green silica pigments (see Fig. 15). But in
this case these bands along with intensive bands located in the region of
1100–950 cm–1
could be attributed to Si–O vibrations [114].
38
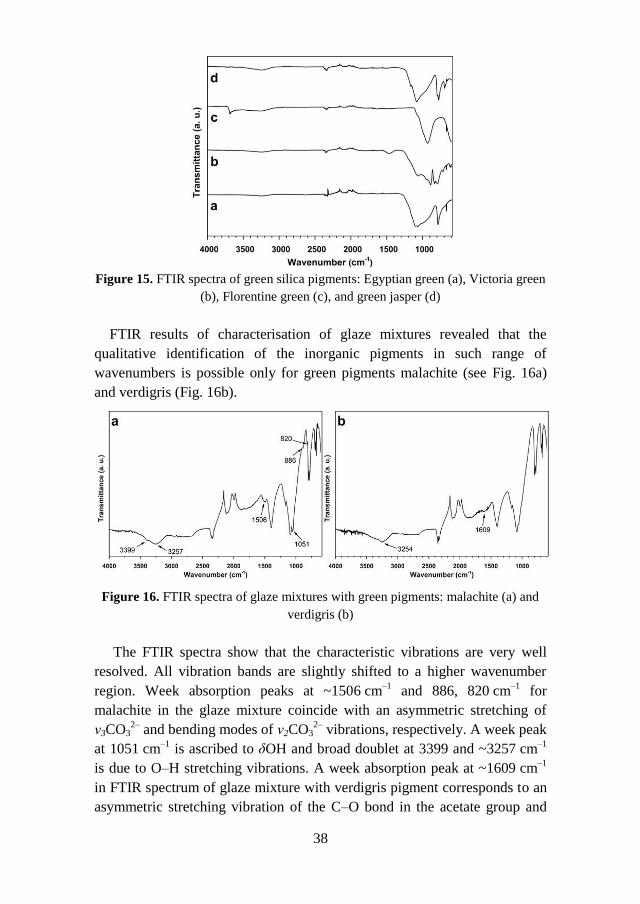
Figure 15. FTIR spectra of green silica pigments: Egyptian green (a), Victoria green
(b), Florentine green (c), and green jasper (d)
FTIR results of characterisation of glaze mixtures revealed that the
qualitative identification of the inorganic pigments in such range of
wavenumbers is possible only for green pigments malachite (see Fig. 16a)
and verdigris (Fig. 16b).
Figure 16. FTIR spectra of glaze mixtures with green pigments: malachite (a) and
verdigris (b)
The FTIR spectra show that the characteristic vibrations are very well
resolved. All vibration bands are slightly shifted to a higher wavenumber
region. Week absorption peaks at ~1506 cm–1
and 886, 820 cm–1
for
malachite in the glaze mixture coincide with an asymmetric stretching of
ν3CO32–
and bending modes of ν2CO32–
vibrations, respectively. A week peak
at 1051 cm–1
is ascribed to δOH and broad doublet at 3399 and ~3257 cm–1
is due to O–H stretching vibrations. A week absorption peak at ~1609 cm–1
in FTIR spectrum of glaze mixture with verdigris pigment corresponds to an
asymmetric stretching vibration of the C–O bond in the acetate group and
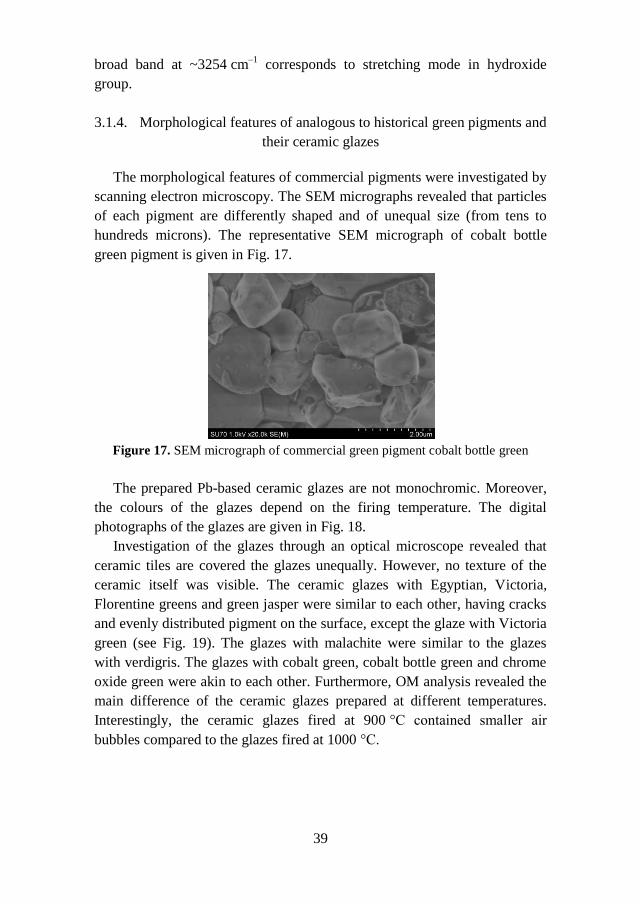
39
broad band at ~3254 cm–1
corresponds to stretching mode in hydroxide
group.
3.1.4. Morphological features of analogous to historical green pigments and
their ceramic glazes
The morphological features of commercial pigments were investigated by
scanning electron microscopy. The SEM micrographs revealed that particles
of each pigment are differently shaped and of unequal size (from tens to
hundreds microns). The representative SEM micrograph of cobalt bottle
green pigment is given in Fig. 17.
Figure 17. SEM micrograph of commercial green pigment cobalt bottle green
The prepared Pb-based ceramic glazes are not monochromic. Moreover,
the colours of the glazes depend on the firing temperature. The digital
photographs of the glazes are given in Fig. 18.
Investigation of the glazes through an optical microscope revealed that
ceramic tiles are covered the glazes unequally. However, no texture of the
ceramic itself was visible. The ceramic glazes with Egyptian, Victoria,
Florentine greens and green jasper were similar to each other, having cracks
and evenly distributed pigment on the surface, except the glaze with Victoria
green (see Fig. 19). The glazes with malachite were similar to the glazes
with verdigris. The glazes with cobalt green, cobalt bottle green and chrome
oxide green were akin to each other. Furthermore, OM analysis revealed the
main difference of the ceramic glazes prepared at different temperatures.
Interestingly, the ceramic glazes fired at 900 °C contained smaller air
bubbles compared to the glazes fired at 1000 °C.
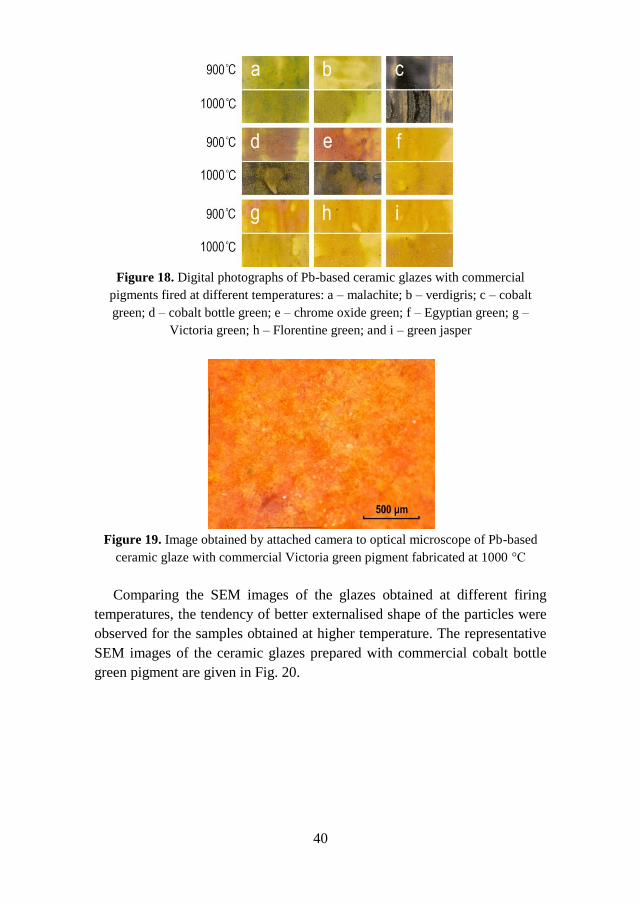
40
Figure 18. Digital photographs of Pb-based ceramic glazes with commercial
pigments fired at different temperatures: a – malachite; b – verdigris; c – cobalt
green; d – cobalt bottle green; e – chrome oxide green; f – Egyptian green; g –
Victoria green; h – Florentine green; and i – green jasper
Figure 19. Image obtained by attached camera to optical microscope of Pb-based
ceramic glaze with commercial Victoria green pigment fabricated at 1000 °C
Comparing the SEM images of the glazes obtained at different firing
temperatures, the tendency of better externalised shape of the particles were
observed for the samples obtained at higher temperature. The representative
SEM images of the ceramic glazes prepared with commercial cobalt bottle
green pigment are given in Fig. 20.
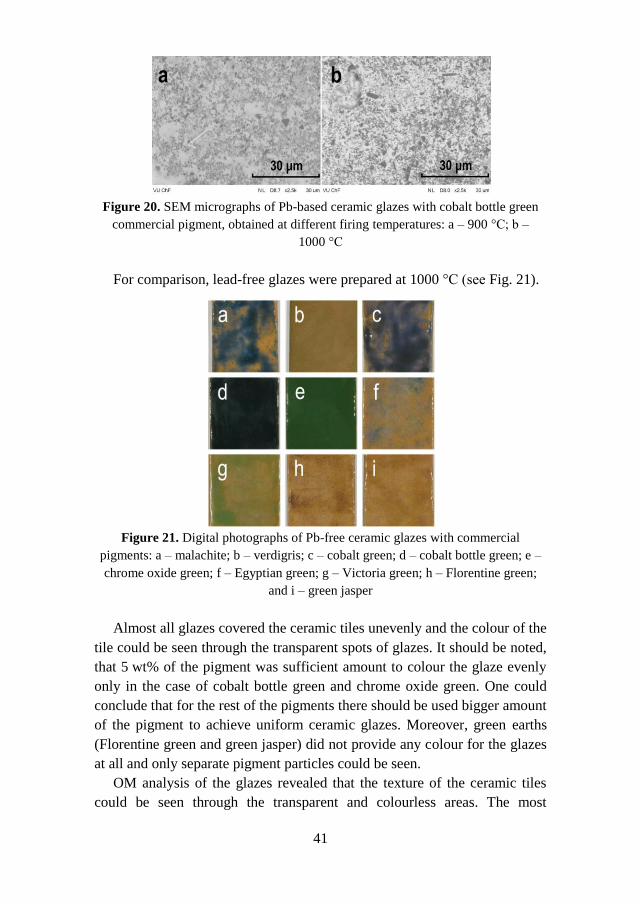
41
Figure 20. SEM micrographs of Pb-based ceramic glazes with cobalt bottle green
commercial pigment, obtained at different firing temperatures: a – 900 °C; b –
1000 °C
For comparison, lead-free glazes were prepared at 1000 °C (see Fig. 21).
Figure 21. Digital photographs of Pb-free ceramic glazes with commercial
pigments: a – malachite; b – verdigris; c – cobalt green; d – cobalt bottle green; e –
chrome oxide green; f – Egyptian green; g – Victoria green; h – Florentine green;
and i – green jasper
Almost all glazes covered the ceramic tiles unevenly and the colour of the
tile could be seen through the transparent spots of glazes. It should be noted,
that 5 wt% of the pigment was sufficient amount to colour the glaze evenly
only in the case of cobalt bottle green and chrome oxide green. One could
conclude that for the rest of the pigments there should be used bigger amount
of the pigment to achieve uniform ceramic glazes. Moreover, green earths
(Florentine green and green jasper) did not provide any colour for the glazes
at all and only separate pigment particles could be seen.
OM analysis of the glazes revealed that the texture of the ceramic tiles
could be seen through the transparent and colourless areas. The most
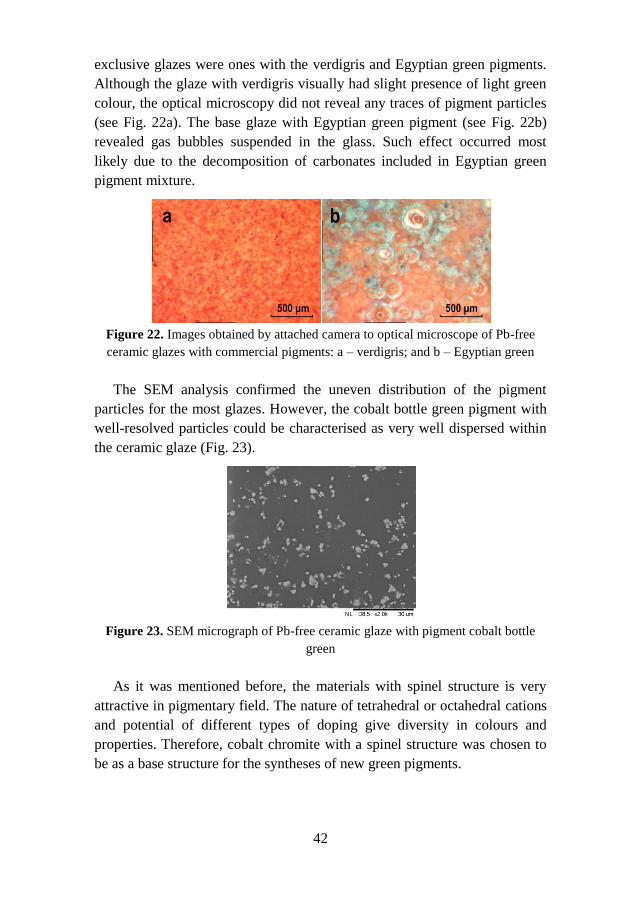
42
exclusive glazes were ones with the verdigris and Egyptian green pigments.
Although the glaze with verdigris visually had slight presence of light green
colour, the optical microscopy did not reveal any traces of pigment particles
(see Fig. 22a). The base glaze with Egyptian green pigment (see Fig. 22b)
revealed gas bubbles suspended in the glass. Such effect occurred most
likely due to the decomposition of carbonates included in Egyptian green
pigment mixture.
Figure 22. Images obtained by attached camera to optical microscope of Pb-free
ceramic glazes with commercial pigments: a – verdigris; and b – Egyptian green
The SEM analysis confirmed the uneven distribution of the pigment
particles for the most glazes. However, the cobalt bottle green pigment with
well-resolved particles could be characterised as very well dispersed within
the ceramic glaze (Fig. 23).
Figure 23. SEM micrograph of Pb-free ceramic glaze with pigment cobalt bottle
green
As it was mentioned before, the materials with spinel structure is very
attractive in pigmentary field. The nature of tetrahedral or octahedral cations
and potential of different types of doping give diversity in colours and
properties. Therefore, cobalt chromite with a spinel structure was chosen to
be as a base structure for the syntheses of new green pigments.
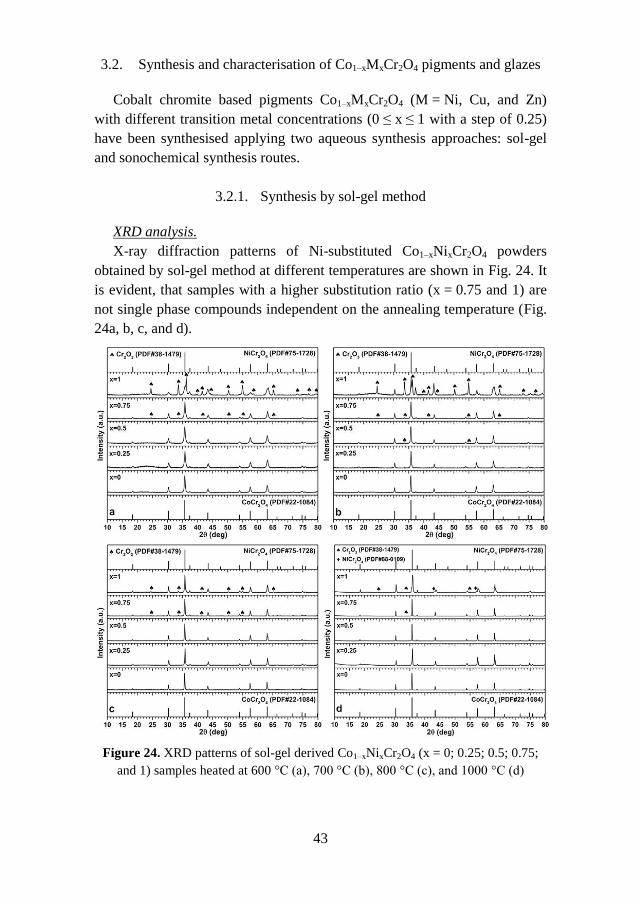
43
3.2. Synthesis and characterisation of Co1–xMxCr2O4 pigments and glazes
Cobalt chromite based pigments Co1–xMxCr2O4 (M = Ni, Cu, and Zn)
with different transition metal concentrations (0 ≤ x ≤ 1 with a step of 0.25)
have been synthesised applying two aqueous synthesis approaches: sol-gel
and sonochemical synthesis routes.
3.2.1. Synthesis by sol-gel method
XRD analysis.
X-ray diffraction patterns of Ni-substituted Co1–xNixCr2O4 powders
obtained by sol-gel method at different temperatures are shown in Fig. 24. It
is evident, that samples with a higher substitution ratio (x = 0.75 and 1) are
not single phase compounds independent on the annealing temperature (Fig.
24a, b, c, and d).
Figure 24. XRD patterns of sol-gel derived Co1–xNixCr2O4 (x = 0; 0.25; 0.5; 0.75;
and 1) samples heated at 600 °C (a), 700 °C (b), 800 °C (c), and 1000 °C (d)
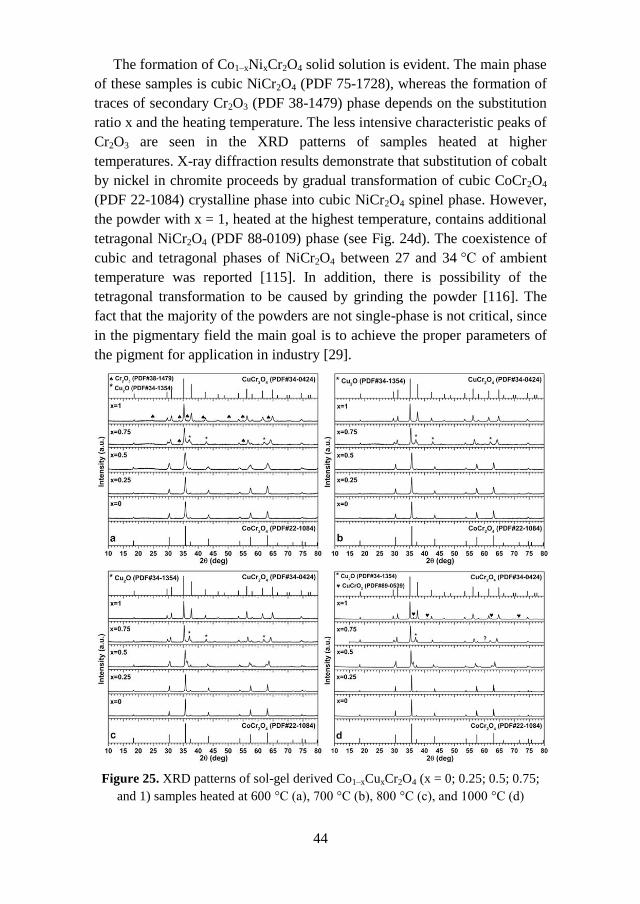
44
The formation of Co1–xNixCr2O4 solid solution is evident. The main phase
of these samples is cubic NiCr2O4 (PDF 75-1728), whereas the formation of
traces of secondary Cr2O3 (PDF 38-1479) phase depends on the substitution
ratio x and the heating temperature. The less intensive characteristic peaks of
Cr2O3 are seen in the XRD patterns of samples heated at higher
temperatures. X-ray diffraction results demonstrate that substitution of cobalt
by nickel in chromite proceeds by gradual transformation of cubic CoCr2O4
(PDF 22-1084) crystalline phase into cubic NiCr2O4 spinel phase. However,
the powder with x = 1, heated at the highest temperature, contains additional
tetragonal NiCr2O4 (PDF 88-0109) phase (see Fig. 24d). The coexistence of
cubic and tetragonal phases of NiCr2O4 between 27 and 34 °C of ambient
temperature was reported [115]. In addition, there is possibility of the
tetragonal transformation to be caused by grinding the powder [116]. The
fact that the majority of the powders are not single-phase is not critical, since
in the pigmentary field the main goal is to achieve the proper parameters of
the pigment for application in industry [29].
Figure 25. XRD patterns of sol-gel derived Co1–xCuxCr2O4 (x = 0; 0.25; 0.5; 0.75;
and 1) samples heated at 600 °C (a), 700 °C (b), 800 °C (c), and 1000 °C (d)
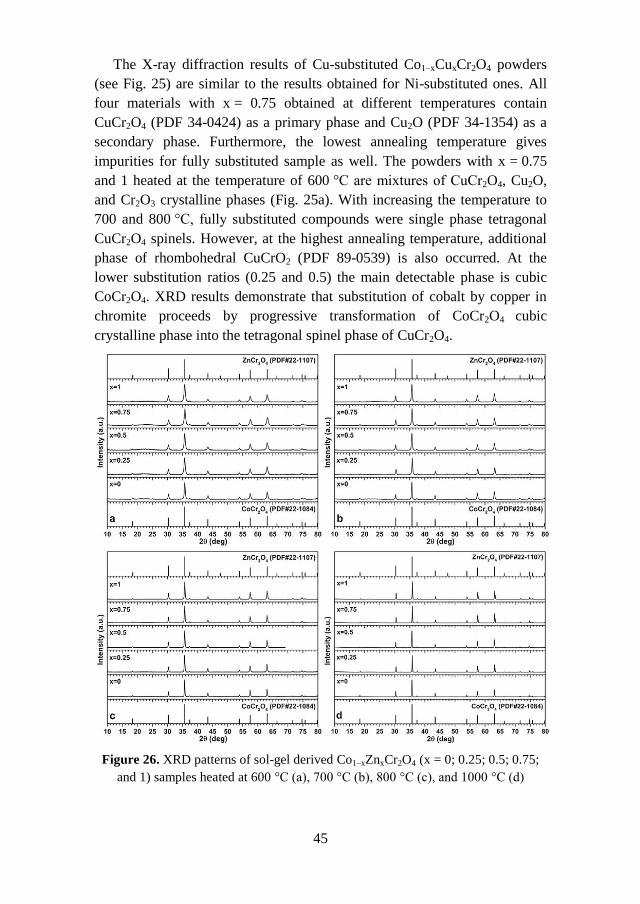
45
The X-ray diffraction results of Cu-substituted Co1–xCuxCr2O4 powders
(see Fig. 25) are similar to the results obtained for Ni-substituted ones. All
four materials with x = 0.75 obtained at different temperatures contain
CuCr2O4 (PDF 34-0424) as a primary phase and Cu2O (PDF 34-1354) as a
secondary phase. Furthermore, the lowest annealing temperature gives
impurities for fully substituted sample as well. The powders with x = 0.75
and 1 heated at the temperature of 600 °C are mixtures of CuCr2O4, Cu2O,
and Cr2O3 crystalline phases (Fig. 25a). With increasing the temperature to
700 and 800 °C, fully substituted compounds were single phase tetragonal
CuCr2O4 spinels. However, at the highest annealing temperature, additional
phase of rhombohedral CuCrO2 (PDF 89-0539) is also occurred. At the
lower substitution ratios (0.25 and 0.5) the main detectable phase is cubic
CoCr2O4. XRD results demonstrate that substitution of cobalt by copper in
chromite proceeds by progressive transformation of CoCr2O4 cubic
crystalline phase into the tetragonal spinel phase of CuCr2O4.
Figure 26. XRD patterns of sol-gel derived Co1–xZnxCr2O4 (x = 0; 0.25; 0.5; 0.75;
and 1) samples heated at 600 °C (a), 700 °C (b), 800 °C (c), and 1000 °C (d)
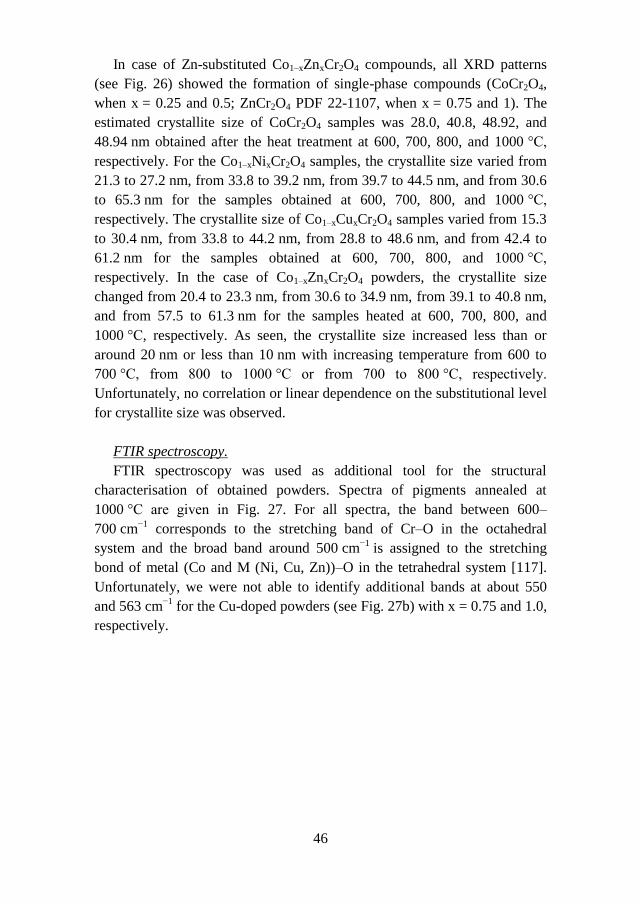
46
In case of Zn-substituted Co1–xZnxCr2O4 compounds, all XRD patterns
(see Fig. 26) showed the formation of single-phase compounds (CoCr2O4,
when x = 0.25 and 0.5; ZnCr2O4 PDF 22-1107, when x = 0.75 and 1). The
estimated crystallite size of CoCr2O4 samples was 28.0, 40.8, 48.92, and
48.94 nm obtained after the heat treatment at 600, 700, 800, and 1000 °C,
respectively. For the Co1–xNixCr2O4 samples, the crystallite size varied from
21.3 to 27.2 nm, from 33.8 to 39.2 nm, from 39.7 to 44.5 nm, and from 30.6
to 65.3 nm for the samples obtained at 600, 700, 800, and 1000 °C,
respectively. The crystallite size of Co1–xCuxCr2O4 samples varied from 15.3
to 30.4 nm, from 33.8 to 44.2 nm, from 28.8 to 48.6 nm, and from 42.4 to
61.2 nm for the samples obtained at 600, 700, 800, and 1000 °C,
respectively. In the case of Co1–xZnxCr2O4 powders, the crystallite size
changed from 20.4 to 23.3 nm, from 30.6 to 34.9 nm, from 39.1 to 40.8 nm,
and from 57.5 to 61.3 nm for the samples heated at 600, 700, 800, and
1000 °C, respectively. As seen, the crystallite size increased less than or
around 20 nm or less than 10 nm with increasing temperature from 600 to
700 °C, from 800 to 1000 °C or from 700 to 800 °C, respectively.
Unfortunately, no correlation or linear dependence on the substitutional level
for crystallite size was observed.
FTIR spectroscopy.
FTIR spectroscopy was used as additional tool for the structural
characterisation of obtained powders. Spectra of pigments annealed at
1000 °C are given in Fig. 27. For all spectra, the band between 600–
700 cm−1
corresponds to the stretching band of Cr–O in the octahedral
system and the broad band around 500 cm−1
is assigned to the stretching
bond of metal (Co and M (Ni, Cu, Zn))–O in the tetrahedral system [117].
Unfortunately, we were not able to identify additional bands at about 550
and 563 cm−1
for the Cu-doped powders (see Fig. 27b) with x = 0.75 and 1.0,
respectively.
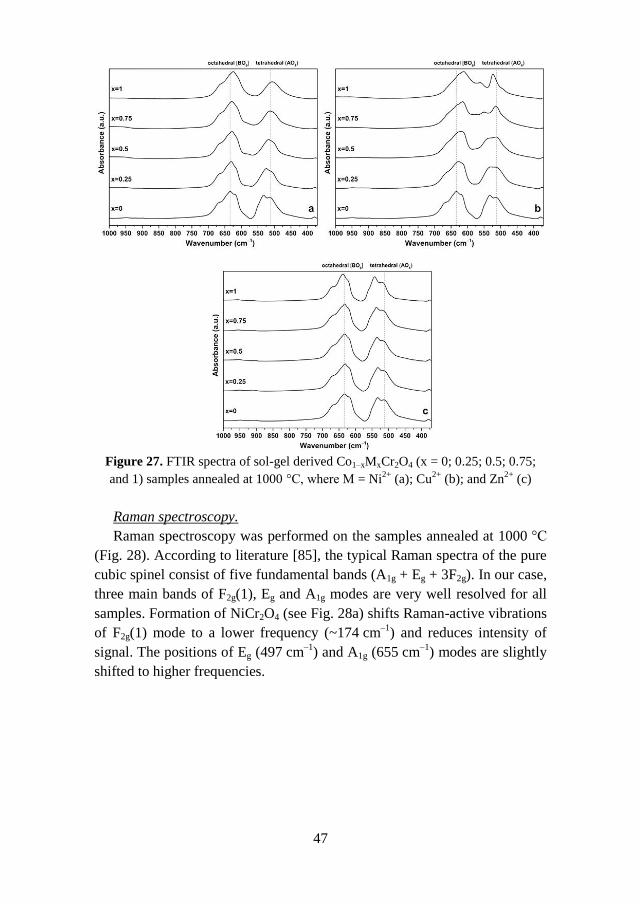
47
Figure 27. FTIR spectra of sol-gel derived Co1–xMxCr2O4 (x = 0; 0.25; 0.5; 0.75;
and 1) samples annealed at 1000 °C, where M = Ni2+
(a); Cu2+
(b); and Zn2+
(c)
Raman spectroscopy.
Raman spectroscopy was performed on the samples annealed at 1000 °C
(Fig. 28). According to literature [85], the typical Raman spectra of the pure
cubic spinel consist of five fundamental bands (A1g + Eg + 3F2g). In our case,
three main bands of F2g(1), Eg and A1g modes are very well resolved for all
samples. Formation of NiCr2O4 (see Fig. 28a) shifts Raman-active vibrations
of F2g(1) mode to a lower frequency (~174 cm–1
) and reduces intensity of
signal. The positions of Eg (497 cm–1
) and A1g (655 cm–1
) modes are slightly
shifted to higher frequencies.
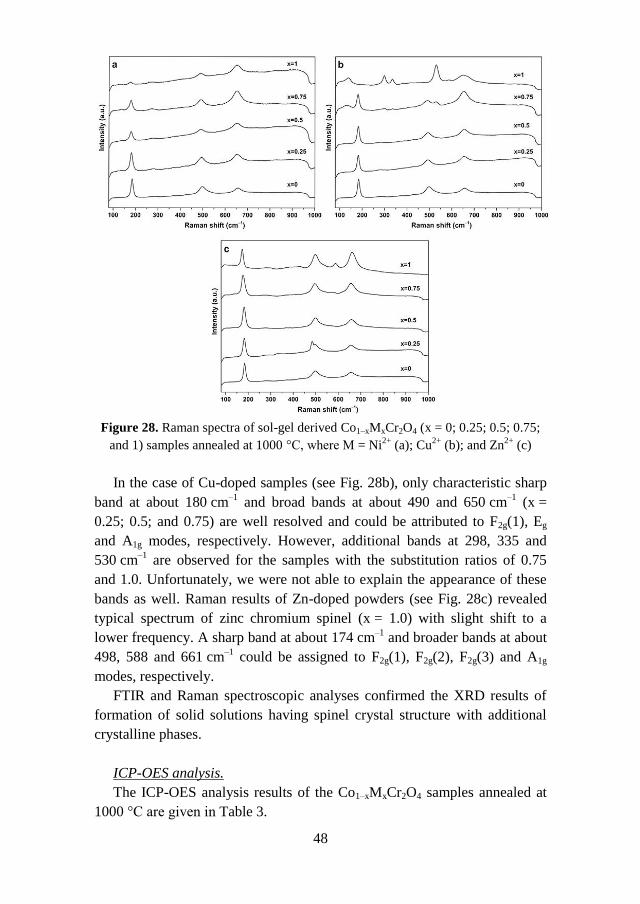
48
Figure 28. Raman spectra of sol-gel derived Co1–xMxCr2O4 (x = 0; 0.25; 0.5; 0.75;
and 1) samples annealed at 1000 °C, where M = Ni2+
(a); Cu2+
(b); and Zn2+
(c)
In the case of Cu-doped samples (see Fig. 28b), only characteristic sharp
band at about 180 cm–1
and broad bands at about 490 and 650 cm–1
(x =
0.25; 0.5; and 0.75) are well resolved and could be attributed to F2g(1), Eg
and A1g modes, respectively. However, additional bands at 298, 335 and
530 cm–1
are observed for the samples with the substitution ratios of 0.75
and 1.0. Unfortunately, we were not able to explain the appearance of these
bands as well. Raman results of Zn-doped powders (see Fig. 28c) revealed
typical spectrum of zinc chromium spinel (x = 1.0) with slight shift to a
lower frequency. A sharp band at about 174 cm–1
and broader bands at about
498, 588 and 661 cm–1
could be assigned to F2g(1), F2g(2), F2g(3) and A1g
modes, respectively.
FTIR and Raman spectroscopic analyses confirmed the XRD results of
formation of solid solutions having spinel crystal structure with additional
crystalline phases.
ICP-OES analysis.
The ICP-OES analysis results of the Co1–xMxCr2O4 samples annealed at
1000 °C are given in Table 3.
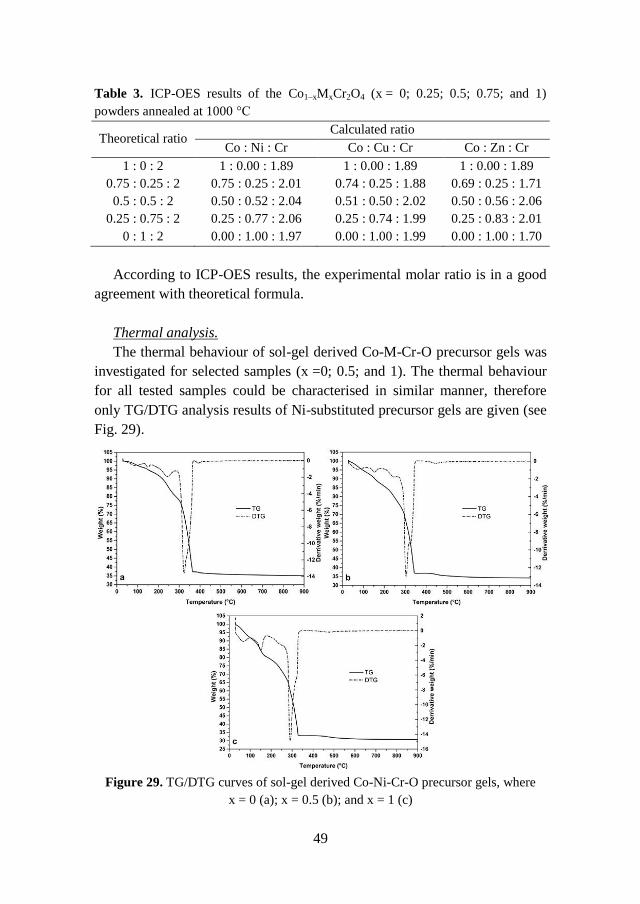
49
Table 3. ICP-OES results of the Co1–xMxCr2O4 (x = 0; 0.25; 0.5; 0.75; and 1)
powders annealed at 1000 °C
Theoretical ratio Calculated ratio
Co : Ni : Cr Co : Cu : Cr Co : Zn : Cr
1 : 0 : 2 1 : 0.00 : 1.89 1 : 0.00 : 1.89 1 : 0.00 : 1.89
0.75 : 0.25 : 2 0.75 : 0.25 : 2.01 0.74 : 0.25 : 1.88 0.69 : 0.25 : 1.71
0.5 : 0.5 : 2 0.50 : 0.52 : 2.04 0.51 : 0.50 : 2.02 0.50 : 0.56 : 2.06
0.25 : 0.75 : 2 0.25 : 0.77 : 2.06 0.25 : 0.74 : 1.99 0.25 : 0.83 : 2.01
0 : 1 : 2 0.00 : 1.00 : 1.97 0.00 : 1.00 : 1.99 0.00 : 1.00 : 1.70
According to ICP-OES results, the experimental molar ratio is in a good
agreement with theoretical formula.
Thermal analysis.
The thermal behaviour of sol-gel derived Co-M-Cr-O precursor gels was
investigated for selected samples (x =0; 0.5; and 1). The thermal behaviour
for all tested samples could be characterised in similar manner, therefore
only TG/DTG analysis results of Ni-substituted precursor gels are given (see
Fig. 29).
Figure 29. TG/DTG curves of sol-gel derived Co-Ni-Cr-O precursor gels, where
x = 0 (a); x = 0.5 (b); and x = 1 (c)
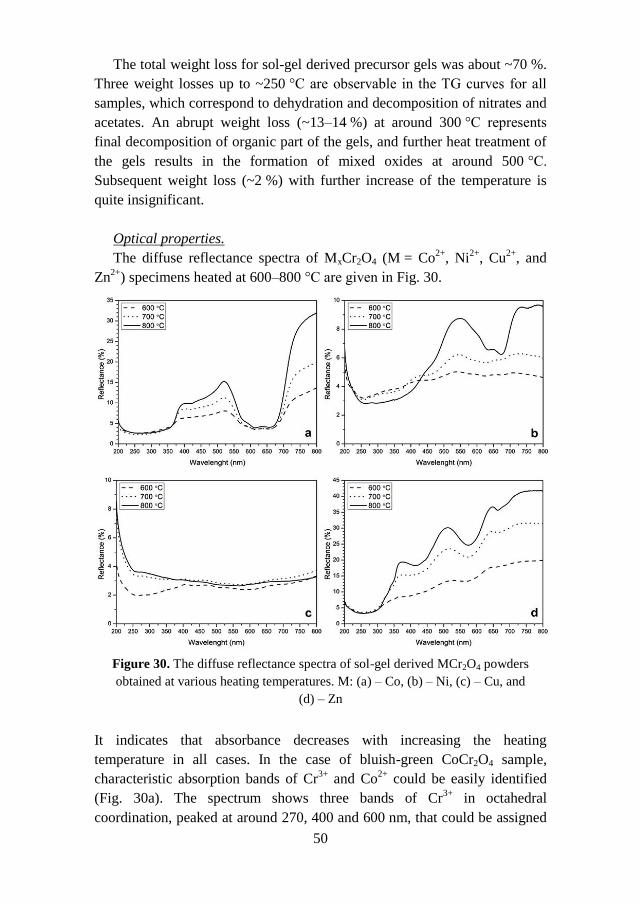
50
The total weight loss for sol-gel derived precursor gels was about ~70 %.
Three weight losses up to ~250 °C are observable in the TG curves for all
samples, which correspond to dehydration and decomposition of nitrates and
acetates. An abrupt weight loss (~13–14 %) at around 300 °C represents
final decomposition of organic part of the gels, and further heat treatment of
the gels results in the formation of mixed oxides at around 500 °C.
Subsequent weight loss (~2 %) with further increase of the temperature is
quite insignificant.
Optical properties.
The diffuse reflectance spectra of MxCr2O4 (M = Co2+
, Ni2+
, Cu2+
, and
Zn2+
) specimens heated at 600–800 °C are given in Fig. 30.
Figure 30. The diffuse reflectance spectra of sol-gel derived MCr2O4 powders
obtained at various heating temperatures. M: (a) – Co, (b) – Ni, (c) – Cu, and
(d) – Zn
It indicates that absorbance decreases with increasing the heating
temperature in all cases. In the case of bluish-green CoCr2O4 sample,
characteristic absorption bands of Cr3+
and Co2+
could be easily identified
(Fig. 30a). The spectrum shows three bands of Cr3+
in octahedral
coordination, peaked at around 270, 400 and 600 nm, that could be assigned
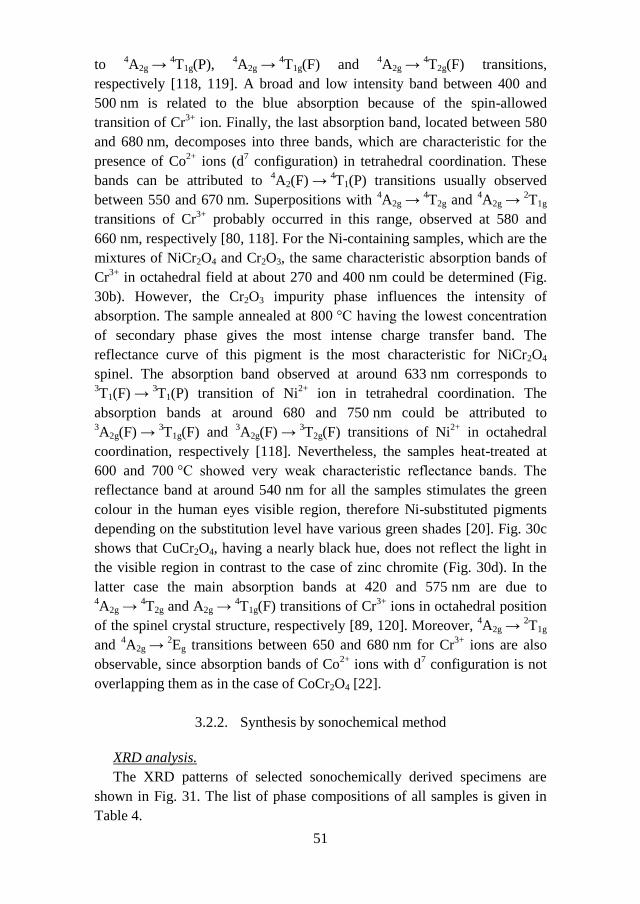
51
to 4A2g →
4T1g(P),
4A2g →
4T1g(F) and
4A2g →
4T2g(F) transitions,
respectively [118, 119]. A broad and low intensity band between 400 and
500 nm is related to the blue absorption because of the spin-allowed
transition of Cr3+
ion. Finally, the last absorption band, located between 580
and 680 nm, decomposes into three bands, which are characteristic for the
presence of Co2+
ions (d7 configuration) in tetrahedral coordination. These
bands can be attributed to 4A2(F) →
4T1(P) transitions usually observed
between 550 and 670 nm. Superpositions with 4A2g →
4T2g and
4A2g →
2T1g
transitions of Cr3+
probably occurred in this range, observed at 580 and
660 nm, respectively [80, 118]. For the Ni-containing samples, which are the
mixtures of NiCr2O4 and Cr2O3, the same characteristic absorption bands of
Cr3+
in octahedral field at about 270 and 400 nm could be determined (Fig.
30b). However, the Cr2O3 impurity phase influences the intensity of
absorption. The sample annealed at 800 °C having the lowest concentration
of secondary phase gives the most intense charge transfer band. The
reflectance curve of this pigment is the most characteristic for NiCr2O4
spinel. The absorption band observed at around 633 nm corresponds to 3T1(F) →
3T1(P) transition of Ni
2+ ion in tetrahedral coordination. The
absorption bands at around 680 and 750 nm could be attributed to 3A2g(F) →
3T1g(F) and
3A2g(F) →
3T2g(F) transitions of Ni
2+ in octahedral
coordination, respectively [118]. Nevertheless, the samples heat-treated at
600 and 700 °C showed very weak characteristic reflectance bands. The
reflectance band at around 540 nm for all the samples stimulates the green
colour in the human eyes visible region, therefore Ni-substituted pigments
depending on the substitution level have various green shades [20]. Fig. 30c
shows that CuCr2O4, having a nearly black hue, does not reflect the light in
the visible region in contrast to the case of zinc chromite (Fig. 30d). In the
latter case the main absorption bands at 420 and 575 nm are due to 4A2g →
4T2g and A2g →
4T1g(F) transitions of Cr
3+ ions in octahedral position
of the spinel crystal structure, respectively [89, 120]. Moreover, 4A2g →
2T1g
and 4A2g →
2Eg transitions between 650 and 680 nm for Cr
3+ ions are also
observable, since absorption bands of Co2+
ions with d7 configuration is not
overlapping them as in the case of CoCr2O4 [22].
3.2.2. Synthesis by sonochemical method
XRD analysis.
The XRD patterns of selected sonochemically derived specimens are
shown in Fig. 31. The list of phase compositions of all samples is given in
Table 4.
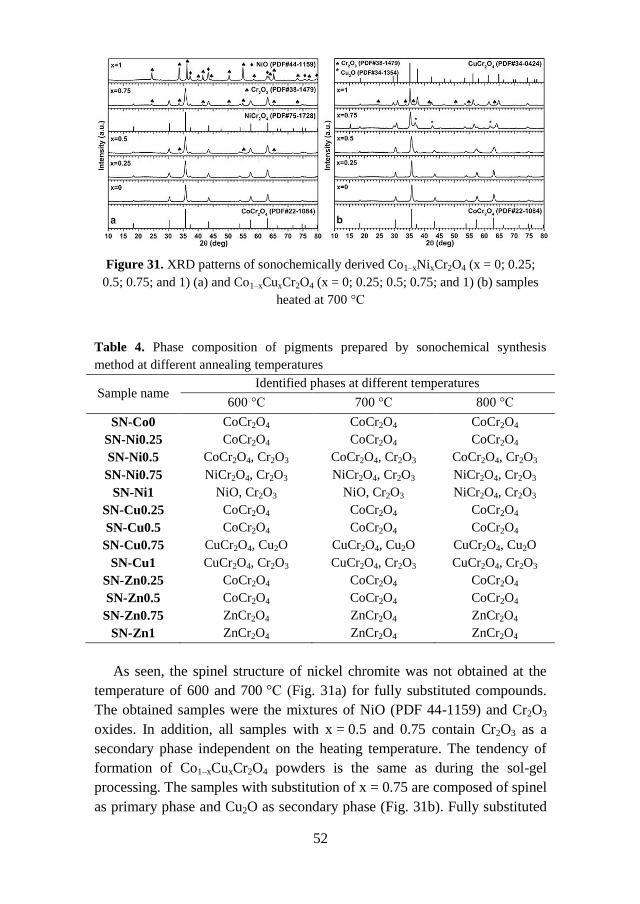
52
Figure 31. XRD patterns of sonochemically derived Co1–xNixCr2O4 (x = 0; 0.25;
0.5; 0.75; and 1) (a) and Co1–xCuxCr2O4 (x = 0; 0.25; 0.5; 0.75; and 1) (b) samples
heated at 700 °C
Table 4. Phase composition of pigments prepared by sonochemical synthesis
method at different annealing temperatures
Sample name Identified phases at different temperatures
600 °C 700 °C 800 °C
SN-Co0 CoCr2O4 CoCr2O4 CoCr2O4
SN-Ni0.25 CoCr2O4 CoCr2O4 CoCr2O4
SN-Ni0.5 CoCr2O4, Cr2O3 CoCr2O4, Cr2O3 CoCr2O4, Cr2O3
SN-Ni0.75 NiCr2O4, Cr2O3 NiCr2O4, Cr2O3 NiCr2O4, Cr2O3
SN-Ni1 NiO, Cr2O3 NiO, Cr2O3 NiCr2O4, Cr2O3
SN-Cu0.25 CoCr2O4 CoCr2O4 CoCr2O4
SN-Cu0.5 CoCr2O4 CoCr2O4 CoCr2O4
SN-Cu0.75 CuCr2O4, Cu2O CuCr2O4, Cu2O CuCr2O4, Cu2O
SN-Cu1 CuCr2O4, Cr2O3 CuCr2O4, Cr2O3 CuCr2O4, Cr2O3
SN-Zn0.25 CoCr2O4 CoCr2O4 CoCr2O4
SN-Zn0.5 CoCr2O4 CoCr2O4 CoCr2O4
SN-Zn0.75 ZnCr2O4 ZnCr2O4 ZnCr2O4
SN-Zn1 ZnCr2O4 ZnCr2O4 ZnCr2O4
As seen, the spinel structure of nickel chromite was not obtained at the
temperature of 600 and 700 °C (Fig. 31a) for fully substituted compounds.
The obtained samples were the mixtures of NiO (PDF 44-1159) and Cr2O3
oxides. In addition, all samples with x = 0.5 and 0.75 contain Cr2O3 as a
secondary phase independent on the heating temperature. The tendency of
formation of Co1–xCuxCr2O4 powders is the same as during the sol-gel
processing. The samples with substitution of x = 0.75 are composed of spinel
as primary phase and Cu2O as secondary phase (Fig. 31b). Fully substituted
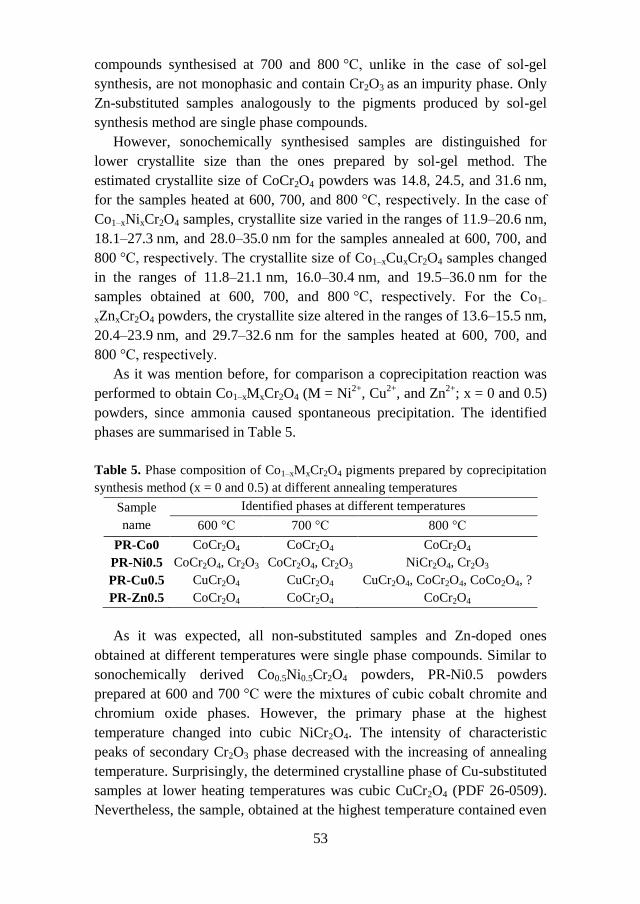
53
compounds synthesised at 700 and 800 °C, unlike in the case of sol-gel
synthesis, are not monophasic and contain Cr2O3 as an impurity phase. Only
Zn-substituted samples analogously to the pigments produced by sol-gel
synthesis method are single phase compounds.
However, sonochemically synthesised samples are distinguished for
lower crystallite size than the ones prepared by sol-gel method. The
estimated crystallite size of CoCr2O4 powders was 14.8, 24.5, and 31.6 nm,
for the samples heated at 600, 700, and 800 °C, respectively. In the case of
Co1–xNixCr2O4 samples, crystallite size varied in the ranges of 11.9–20.6 nm,
18.1–27.3 nm, and 28.0–35.0 nm for the samples annealed at 600, 700, and
800 °C, respectively. The crystallite size of Co1–xCuxCr2O4 samples changed
in the ranges of 11.8–21.1 nm, 16.0–30.4 nm, and 19.5–36.0 nm for the
samples obtained at 600, 700, and 800 °C, respectively. For the Co1–
xZnxCr2O4 powders, the crystallite size altered in the ranges of 13.6–15.5 nm,
20.4–23.9 nm, and 29.7–32.6 nm for the samples heated at 600, 700, and
800 °C, respectively.
As it was mention before, for comparison a coprecipitation reaction was
performed to obtain Co1–xMxCr2O4 (M = Ni2+
, Cu2+
, and Zn2+
; x = 0 and 0.5)
powders, since ammonia caused spontaneous precipitation. The identified
phases are summarised in Table 5.
Table 5. Phase composition of Co1–xMxCr2O4 pigments prepared by coprecipitation
synthesis method (x = 0 and 0.5) at different annealing temperatures
Sample
name
Identified phases at different temperatures
600 °C 700 °C 800 °C
PR-Co0 CoCr2O4 CoCr2O4 CoCr2O4
PR-Ni0.5 CoCr2O4, Cr2O3 CoCr2O4, Cr2O3 NiCr2O4, Cr2O3
PR-Cu0.5 CuCr2O4 CuCr2O4 CuCr2O4, CoCr2O4, CoCo2O4, ?
PR-Zn0.5 CoCr2O4 CoCr2O4 CoCr2O4
As it was expected, all non-substituted samples and Zn-doped ones
obtained at different temperatures were single phase compounds. Similar to
sonochemically derived Co0.5Ni0.5Cr2O4 powders, PR-Ni0.5 powders
prepared at 600 and 700 °C were the mixtures of cubic cobalt chromite and
chromium oxide phases. However, the primary phase at the highest
temperature changed into cubic NiCr2O4. The intensity of characteristic
peaks of secondary Cr2O3 phase decreased with the increasing of annealing
temperature. Surprisingly, the determined crystalline phase of Cu-substituted
samples at lower heating temperatures was cubic CuCr2O4 (PDF 26-0509).
Nevertheless, the sample, obtained at the highest temperature contained even
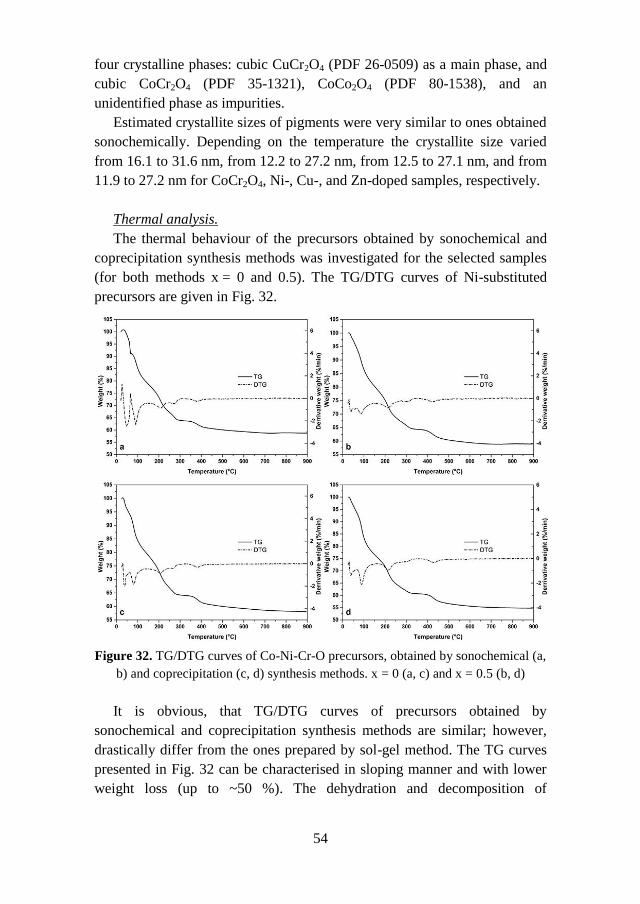
54
four crystalline phases: cubic CuCr2O4 (PDF 26-0509) as a main phase, and
cubic CoCr2O4 (PDF 35-1321), CoCo2O4 (PDF 80-1538), and an
unidentified phase as impurities.
Estimated crystallite sizes of pigments were very similar to ones obtained
sonochemically. Depending on the temperature the crystallite size varied
from 16.1 to 31.6 nm, from 12.2 to 27.2 nm, from 12.5 to 27.1 nm, and from
11.9 to 27.2 nm for CoCr2O4, Ni-, Cu-, and Zn-doped samples, respectively.
Thermal analysis.
The thermal behaviour of the precursors obtained by sonochemical and
coprecipitation synthesis methods was investigated for the selected samples
(for both methods x = 0 and 0.5). The TG/DTG curves of Ni-substituted
precursors are given in Fig. 32.
Figure 32. TG/DTG curves of Co-Ni-Cr-O precursors, obtained by sonochemical (a,
b) and coprecipitation (c, d) synthesis methods. x = 0 (a, c) and x = 0.5 (b, d)
It is obvious, that TG/DTG curves of precursors obtained by
sonochemical and coprecipitation synthesis methods are similar; however,
drastically differ from the ones prepared by sol-gel method. The TG curves
presented in Fig. 32 can be characterised in sloping manner and with lower
weight loss (up to ~50 %). The dehydration and decomposition of
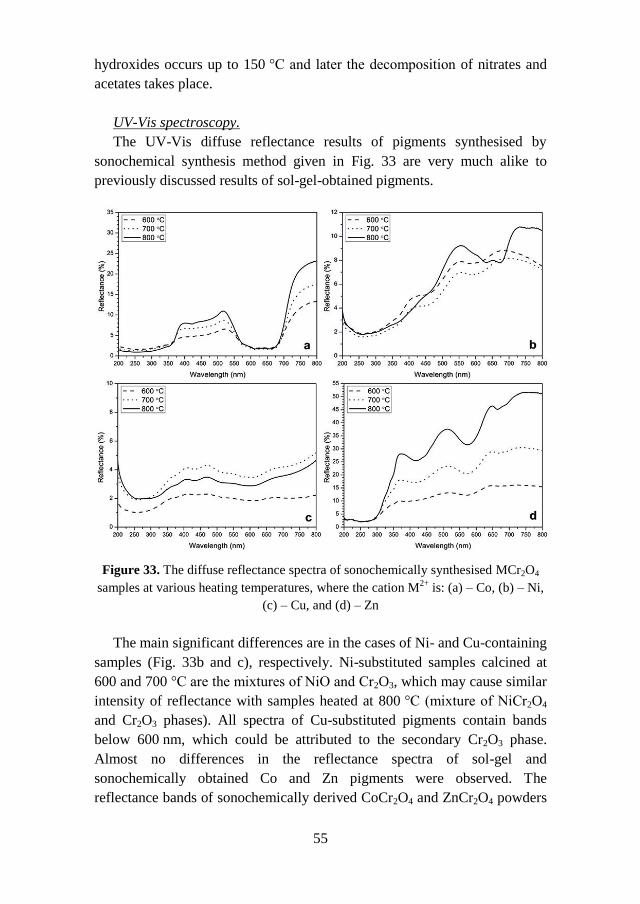
55
hydroxides occurs up to 150 °C and later the decomposition of nitrates and
acetates takes place.
UV-Vis spectroscopy.
The UV-Vis diffuse reflectance results of pigments synthesised by
sonochemical synthesis method given in Fig. 33 are very much alike to
previously discussed results of sol-gel-obtained pigments.
Figure 33. The diffuse reflectance spectra of sonochemically synthesised MCr2O4
samples at various heating temperatures, where the cation M2+
is: (a) – Co, (b) – Ni,
(c) – Cu, and (d) – Zn
The main significant differences are in the cases of Ni- and Cu-containing
samples (Fig. 33b and c), respectively. Ni-substituted samples calcined at
600 and 700 °C are the mixtures of NiO and Cr2O3, which may cause similar
intensity of reflectance with samples heated at 800 °C (mixture of NiCr2O4
and Cr2O3 phases). All spectra of Cu-substituted pigments contain bands
below 600 nm, which could be attributed to the secondary Cr2O3 phase.
Almost no differences in the reflectance spectra of sol-gel and
sonochemically obtained Co and Zn pigments were observed. The
reflectance bands of sonochemically derived CoCr2O4 and ZnCr2O4 powders
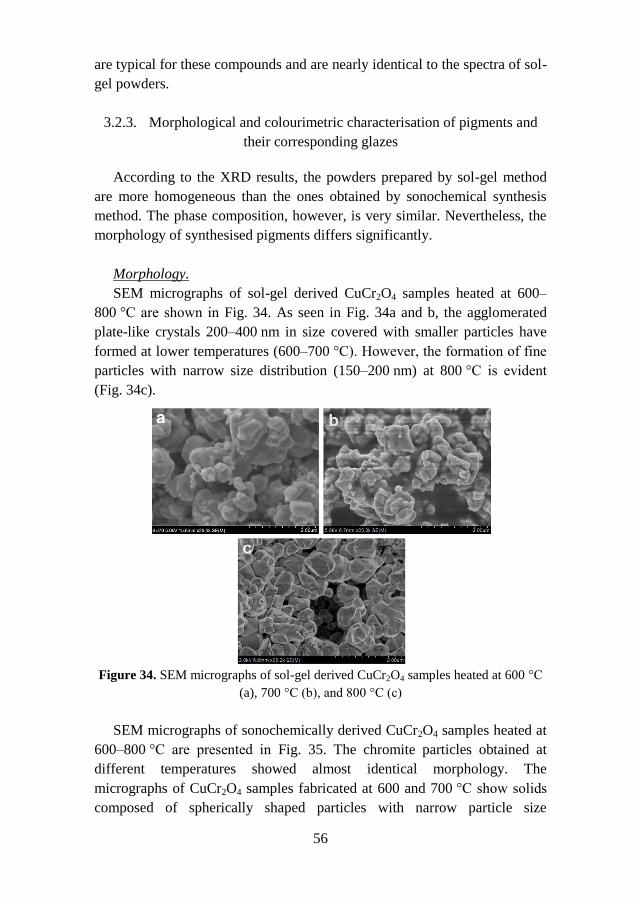
56
are typical for these compounds and are nearly identical to the spectra of sol-
gel powders.
3.2.3. Morphological and colourimetric characterisation of pigments and
their corresponding glazes
According to the XRD results, the powders prepared by sol-gel method
are more homogeneous than the ones obtained by sonochemical synthesis
method. The phase composition, however, is very similar. Nevertheless, the
morphology of synthesised pigments differs significantly.
Morphology.
SEM micrographs of sol-gel derived CuCr2O4 samples heated at 600–
800 °C are shown in Fig. 34. As seen in Fig. 34a and b, the agglomerated
plate-like crystals 200–400 nm in size covered with smaller particles have
formed at lower temperatures (600–700 °C). However, the formation of fine
particles with narrow size distribution (150–200 nm) at 800 °C is evident
(Fig. 34c).
Figure 34. SEM micrographs of sol-gel derived CuCr2O4 samples heated at 600 °C
(a), 700 °C (b), and 800 °C (c)
SEM micrographs of sonochemically derived CuCr2O4 samples heated at
600–800 °C are presented in Fig. 35. The chromite particles obtained at
different temperatures showed almost identical morphology. The
micrographs of CuCr2O4 samples fabricated at 600 and 700 °C show solids
composed of spherically shaped particles with narrow particle size
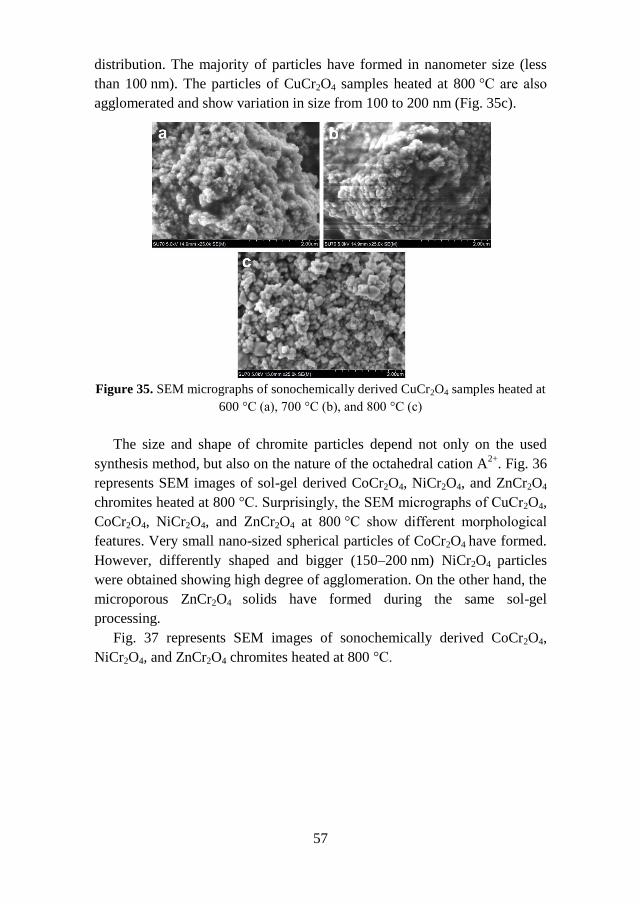
57
distribution. The majority of particles have formed in nanometer size (less
than 100 nm). The particles of CuCr2O4 samples heated at 800 °C are also
agglomerated and show variation in size from 100 to 200 nm (Fig. 35c).
Figure 35. SEM micrographs of sonochemically derived CuCr2O4 samples heated at
600 °C (a), 700 °C (b), and 800 °C (c)
The size and shape of chromite particles depend not only on the used
synthesis method, but also on the nature of the octahedral cation A2+
. Fig. 36
represents SEM images of sol-gel derived CoCr2O4, NiCr2O4, and ZnCr2O4
chromites heated at 800 °C. Surprisingly, the SEM micrographs of CuCr2O4,
CoCr2O4, NiCr2O4, and ZnCr2O4 at 800 °C show different morphological
features. Very small nano-sized spherical particles of CoCr2O4 have formed.
However, differently shaped and bigger (150–200 nm) NiCr2O4 particles
were obtained showing high degree of agglomeration. On the other hand, the
microporous ZnCr2O4 solids have formed during the same sol-gel
processing.
Fig. 37 represents SEM images of sonochemically derived CoCr2O4,
NiCr2O4, and ZnCr2O4 chromites heated at 800 °C.
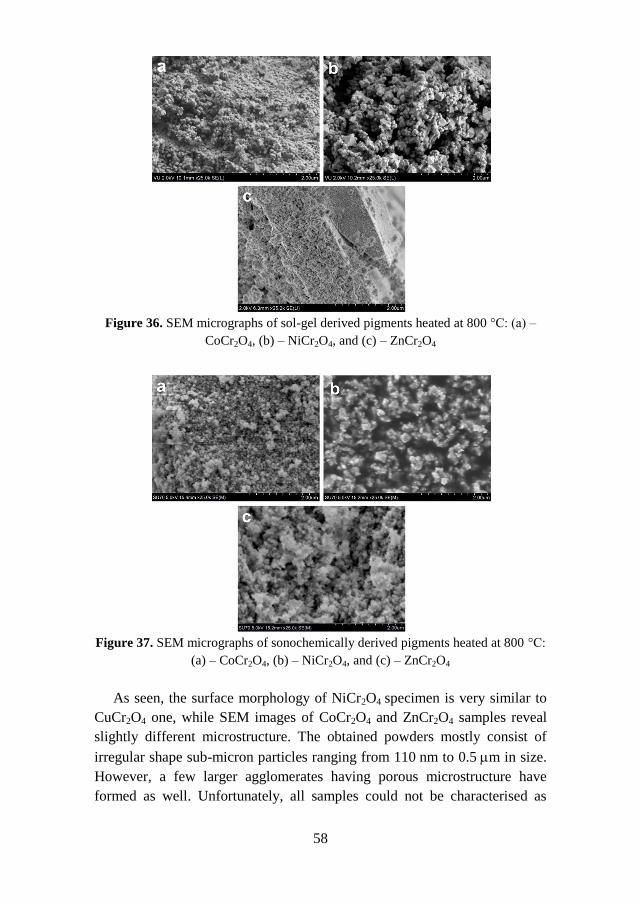
58
Figure 36. SEM micrographs of sol-gel derived pigments heated at 800 °C: (a) –
CoCr2O4, (b) – NiCr2O4, and (c) – ZnCr2O4
Figure 37. SEM micrographs of sonochemically derived pigments heated at 800 °C:
(a) – CoCr2O4, (b) – NiCr2O4, and (c) – ZnCr2O4
As seen, the surface morphology of NiCr2O4 specimen is very similar to
CuCr2O4 one, while SEM images of CoCr2O4 and ZnCr2O4 samples reveal
slightly different microstructure. The obtained powders mostly consist of
irregular shape sub-micron particles ranging from 110 nm to 0.5 m in size.
However, a few larger agglomerates having porous microstructure have
formed as well. Unfortunately, all samples could not be characterised as
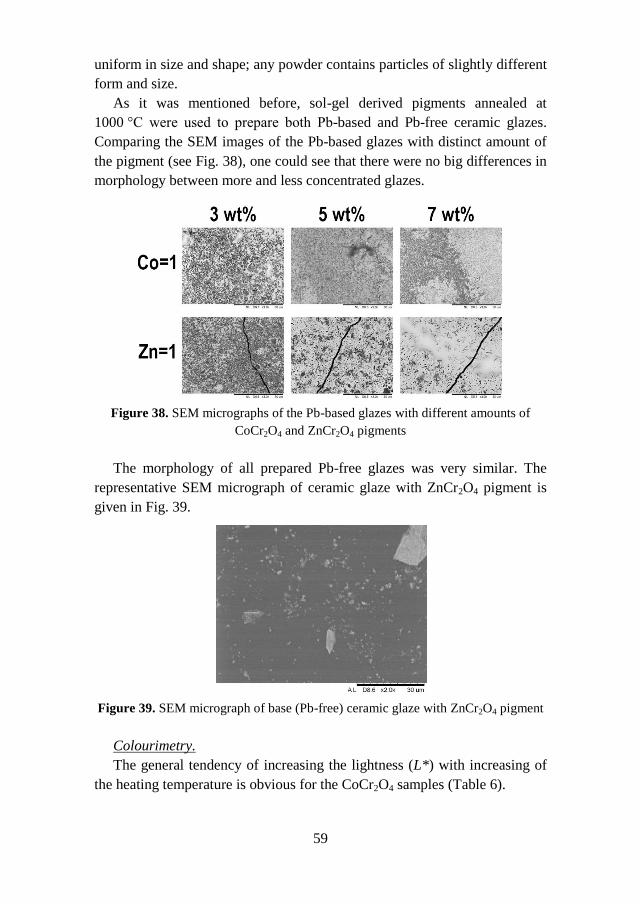
59
uniform in size and shape; any powder contains particles of slightly different
form and size.
As it was mentioned before, sol-gel derived pigments annealed at
1000 °C were used to prepare both Pb-based and Pb-free ceramic glazes.
Comparing the SEM images of the Pb-based glazes with distinct amount of
the pigment (see Fig. 38), one could see that there were no big differences in
morphology between more and less concentrated glazes.
Figure 38. SEM micrographs of the Pb-based glazes with different amounts of
CoCr2O4 and ZnCr2O4 pigments
The morphology of all prepared Pb-free glazes was very similar. The
representative SEM micrograph of ceramic glaze with ZnCr2O4 pigment is
given in Fig. 39.
Figure 39. SEM micrograph of base (Pb-free) ceramic glaze with ZnCr2O4 pigment
Colourimetry.
The general tendency of increasing the lightness (L*) with increasing of
the heating temperature is obvious for the CoCr2O4 samples (Table 6).
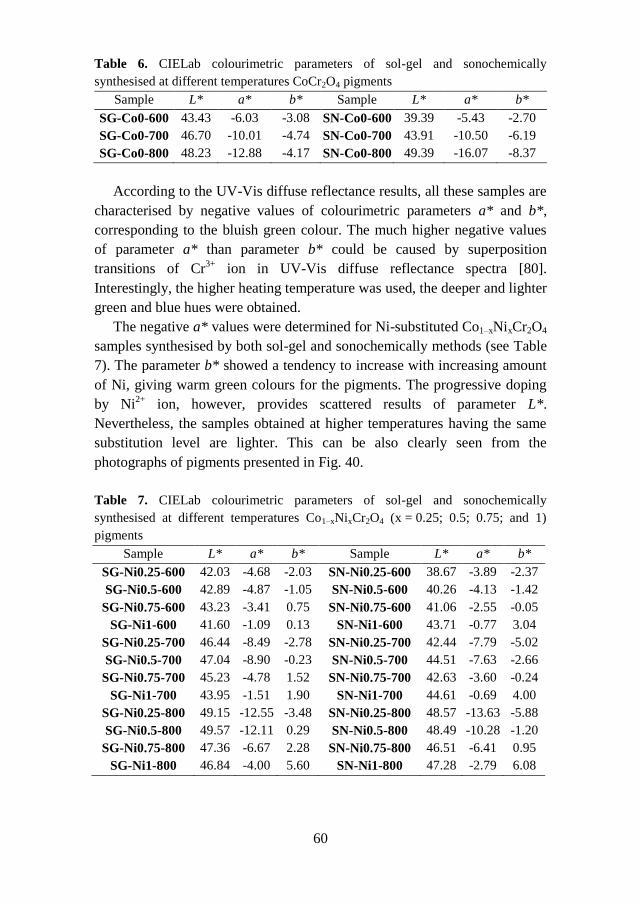
60
Table 6. CIELab colourimetric parameters of sol-gel and sonochemically
synthesised at different temperatures CoCr2O4 pigments
Sample L* a* b* Sample L* a* b*
SG-Co0-600 43.43 -6.03 -3.08 SN-Co0-600 39.39 -5.43 -2.70
SG-Co0-700 46.70 -10.01 -4.74 SN-Co0-700 43.91 -10.50 -6.19
SG-Co0-800 48.23 -12.88 -4.17 SN-Co0-800 49.39 -16.07 -8.37
According to the UV-Vis diffuse reflectance results, all these samples are
characterised by negative values of colourimetric parameters a* and b*,
corresponding to the bluish green colour. The much higher negative values
of parameter a* than parameter b* could be caused by superposition
transitions of Cr3+
ion in UV-Vis diffuse reflectance spectra [80].
Interestingly, the higher heating temperature was used, the deeper and lighter
green and blue hues were obtained.
The negative a* values were determined for Ni-substituted Co1–xNixCr2O4
samples synthesised by both sol-gel and sonochemically methods (see Table
7). The parameter b* showed a tendency to increase with increasing amount
of Ni, giving warm green colours for the pigments. The progressive doping
by Ni2+
ion, however, provides scattered results of parameter L*.
Nevertheless, the samples obtained at higher temperatures having the same
substitution level are lighter. This can be also clearly seen from the
photographs of pigments presented in Fig. 40.
Table 7. CIELab colourimetric parameters of sol-gel and sonochemically
synthesised at different temperatures Co1–xNixCr2O4 (x = 0.25; 0.5; 0.75; and 1)
pigments
Sample L* a* b* Sample L* a* b*
SG-Ni0.25-600 42.03 -4.68 -2.03 SN-Ni0.25-600 38.67 -3.89 -2.37
SG-Ni0.5-600 42.89 -4.87 -1.05 SN-Ni0.5-600 40.26 -4.13 -1.42
SG-Ni0.75-600 43.23 -3.41 0.75 SN-Ni0.75-600 41.06 -2.55 -0.05
SG-Ni1-600 41.60 -1.09 0.13 SN-Ni1-600 43.71 -0.77 3.04
SG-Ni0.25-700 46.44 -8.49 -2.78 SN-Ni0.25-700 42.44 -7.79 -5.02
SG-Ni0.5-700 47.04 -8.90 -0.23 SN-Ni0.5-700 44.51 -7.63 -2.66
SG-Ni0.75-700 45.23 -4.78 1.52 SN-Ni0.75-700 42.63 -3.60 -0.24
SG-Ni1-700 43.95 -1.51 1.90 SN-Ni1-700 44.61 -0.69 4.00
SG-Ni0.25-800 49.15 -12.55 -3.48 SN-Ni0.25-800 48.57 -13.63 -5.88
SG-Ni0.5-800 49.57 -12.11 0.29 SN-Ni0.5-800 48.49 -10.28 -1.20
SG-Ni0.75-800 47.36 -6.67 2.28 SN-Ni0.75-800 46.51 -6.41 0.95
SG-Ni1-800 46.84 -4.00 5.60 SN-Ni1-800 47.28 -2.79 6.08
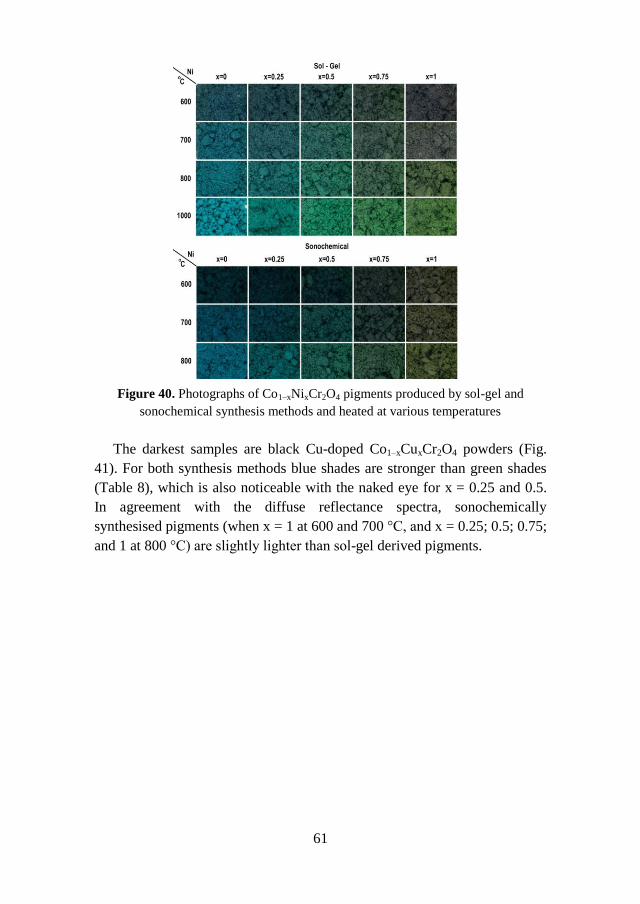
61
Figure 40. Photographs of Co1–xNixCr2O4 pigments produced by sol-gel and
sonochemical synthesis methods and heated at various temperatures
The darkest samples are black Cu-doped Co1–xCuxCr2O4 powders (Fig.
41). For both synthesis methods blue shades are stronger than green shades
(Table 8), which is also noticeable with the naked eye for x = 0.25 and 0.5.
In agreement with the diffuse reflectance spectra, sonochemically
synthesised pigments (when x = 1 at 600 and 700 °C, and x = 0.25; 0.5; 0.75;
and 1 at 800 °C) are slightly lighter than sol-gel derived pigments.
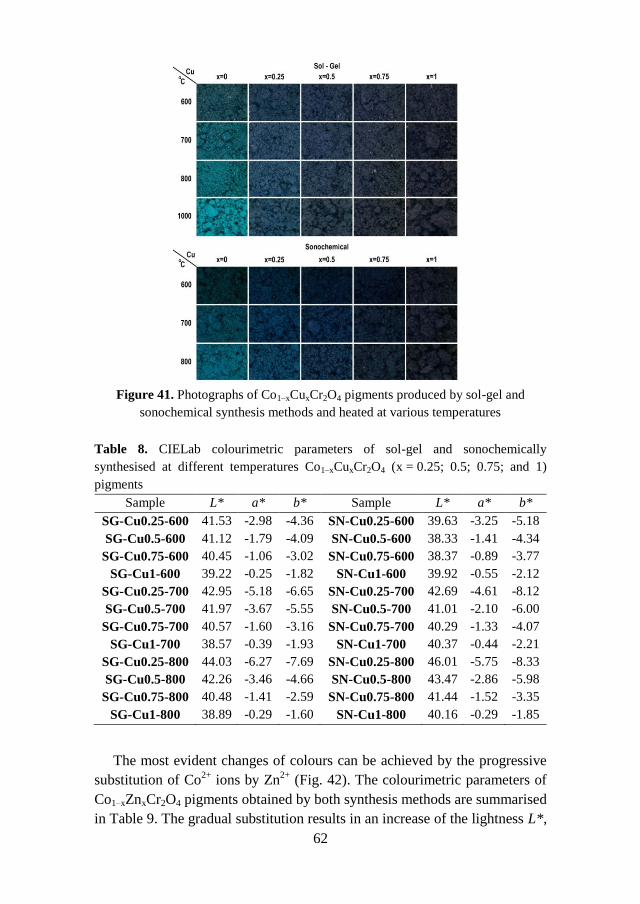
62
Figure 41. Photographs of Co1–xCuxCr2O4 pigments produced by sol-gel and
sonochemical synthesis methods and heated at various temperatures
Table 8. CIELab colourimetric parameters of sol-gel and sonochemically
synthesised at different temperatures Co1–xCuxCr2O4 (x = 0.25; 0.5; 0.75; and 1)
pigments
Sample L* a* b* Sample L* a* b*
SG-Cu0.25-600 41.53 -2.98 -4.36 SN-Cu0.25-600 39.63 -3.25 -5.18
SG-Cu0.5-600 41.12 -1.79 -4.09 SN-Cu0.5-600 38.33 -1.41 -4.34
SG-Cu0.75-600 40.45 -1.06 -3.02 SN-Cu0.75-600 38.37 -0.89 -3.77
SG-Cu1-600 39.22 -0.25 -1.82 SN-Cu1-600 39.92 -0.55 -2.12
SG-Cu0.25-700 42.95 -5.18 -6.65 SN-Cu0.25-700 42.69 -4.61 -8.12
SG-Cu0.5-700 41.97 -3.67 -5.55 SN-Cu0.5-700 41.01 -2.10 -6.00
SG-Cu0.75-700 40.57 -1.60 -3.16 SN-Cu0.75-700 40.29 -1.33 -4.07
SG-Cu1-700 38.57 -0.39 -1.93 SN-Cu1-700 40.37 -0.44 -2.21
SG-Cu0.25-800 44.03 -6.27 -7.69 SN-Cu0.25-800 46.01 -5.75 -8.33
SG-Cu0.5-800 42.26 -3.46 -4.66 SN-Cu0.5-800 43.47 -2.86 -5.98
SG-Cu0.75-800 40.48 -1.41 -2.59 SN-Cu0.75-800 41.44 -1.52 -3.35
SG-Cu1-800 38.89 -0.29 -1.60 SN-Cu1-800 40.16 -0.29 -1.85
The most evident changes of colours can be achieved by the progressive
substitution of Co2+
ions by Zn2+
(Fig. 42). The colourimetric parameters of
Co1–xZnxCr2O4 pigments obtained by both synthesis methods are summarised
in Table 9. The gradual substitution results in an increase of the lightness L*,
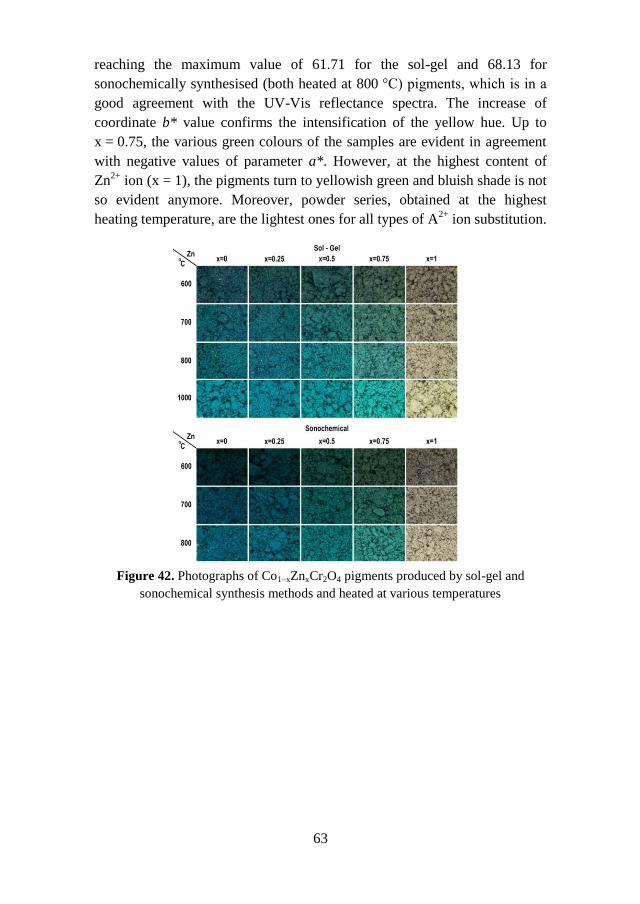
63
reaching the maximum value of 61.71 for the sol-gel and 68.13 for
sonochemically synthesised (both heated at 800 °C) pigments, which is in a
good agreement with the UV-Vis reflectance spectra. The increase of
coordinate b* value confirms the intensification of the yellow hue. Up to
x = 0.75, the various green colours of the samples are evident in agreement
with negative values of parameter a*. However, at the highest content of
Zn2+
ion (x = 1), the pigments turn to yellowish green and bluish shade is not
so evident anymore. Moreover, powder series, obtained at the highest
heating temperature, are the lightest ones for all types of A2+
ion substitution.
Figure 42. Photographs of Co1–xZnxCr2O4 pigments produced by sol-gel and
sonochemical synthesis methods and heated at various temperatures
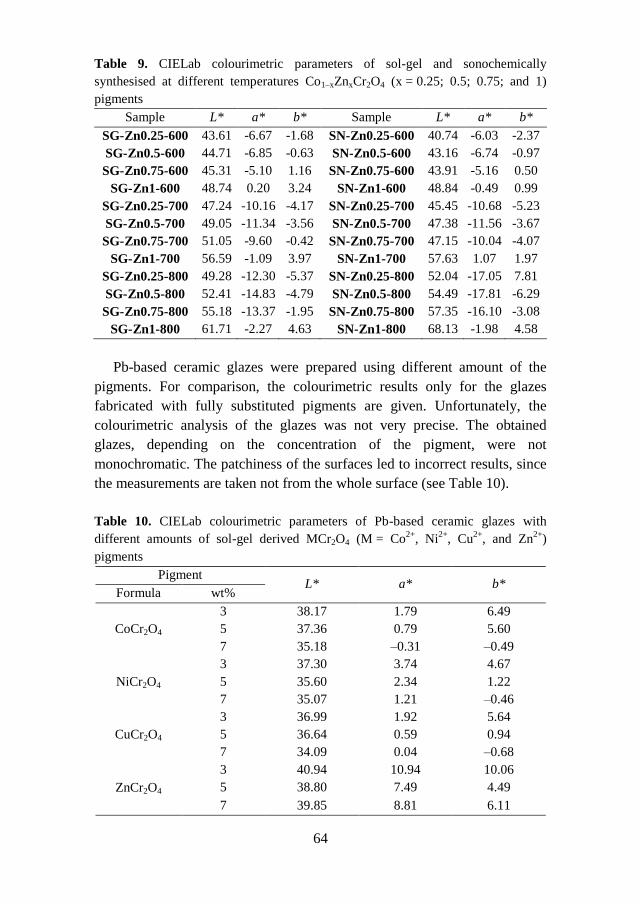
64
Table 9. CIELab colourimetric parameters of sol-gel and sonochemically
synthesised at different temperatures Co1–xZnxCr2O4 (x = 0.25; 0.5; 0.75; and 1)
pigments
Sample L* a* b* Sample L* a* b*
SG-Zn0.25-600 43.61 -6.67 -1.68 SN-Zn0.25-600 40.74 -6.03 -2.37
SG-Zn0.5-600 44.71 -6.85 -0.63 SN-Zn0.5-600 43.16 -6.74 -0.97
SG-Zn0.75-600 45.31 -5.10 1.16 SN-Zn0.75-600 43.91 -5.16 0.50
SG-Zn1-600 48.74 0.20 3.24 SN-Zn1-600 48.84 -0.49 0.99
SG-Zn0.25-700 47.24 -10.16 -4.17 SN-Zn0.25-700 45.45 -10.68 -5.23
SG-Zn0.5-700 49.05 -11.34 -3.56 SN-Zn0.5-700 47.38 -11.56 -3.67
SG-Zn0.75-700 51.05 -9.60 -0.42 SN-Zn0.75-700 47.15 -10.04 -4.07
SG-Zn1-700 56.59 -1.09 3.97 SN-Zn1-700 57.63 1.07 1.97
SG-Zn0.25-800 49.28 -12.30 -5.37 SN-Zn0.25-800 52.04 -17.05 7.81
SG-Zn0.5-800 52.41 -14.83 -4.79 SN-Zn0.5-800 54.49 -17.81 -6.29
SG-Zn0.75-800 55.18 -13.37 -1.95 SN-Zn0.75-800 57.35 -16.10 -3.08
SG-Zn1-800 61.71 -2.27 4.63 SN-Zn1-800 68.13 -1.98 4.58
Pb-based ceramic glazes were prepared using different amount of the
pigments. For comparison, the colourimetric results only for the glazes
fabricated with fully substituted pigments are given. Unfortunately, the
colourimetric analysis of the glazes was not very precise. The obtained
glazes, depending on the concentration of the pigment, were not
monochromatic. The patchiness of the surfaces led to incorrect results, since
the measurements are taken not from the whole surface (see Table 10).
Table 10. CIELab colourimetric parameters of Pb-based ceramic glazes with
different amounts of sol-gel derived MCr2O4 (M = Co2+
, Ni2+
, Cu2+
, and Zn2+
)
pigments
Pigment L* a* b*
Formula wt%
CoCr2O4
3 38.17 1.79 6.49
5 37.36 0.79 5.60
7 35.18 –0.31 –0.49
NiCr2O4
3 37.30 3.74 4.67
5 35.60 2.34 1.22
7 35.07 1.21 –0.46
CuCr2O4
3 36.99 1.92 5.64
5 36.64 0.59 0.94
7 34.09 0.04 –0.68
ZnCr2O4
3 40.94 10.94 10.06
5 38.80 7.49 4.49
7 39.85 8.81 6.11
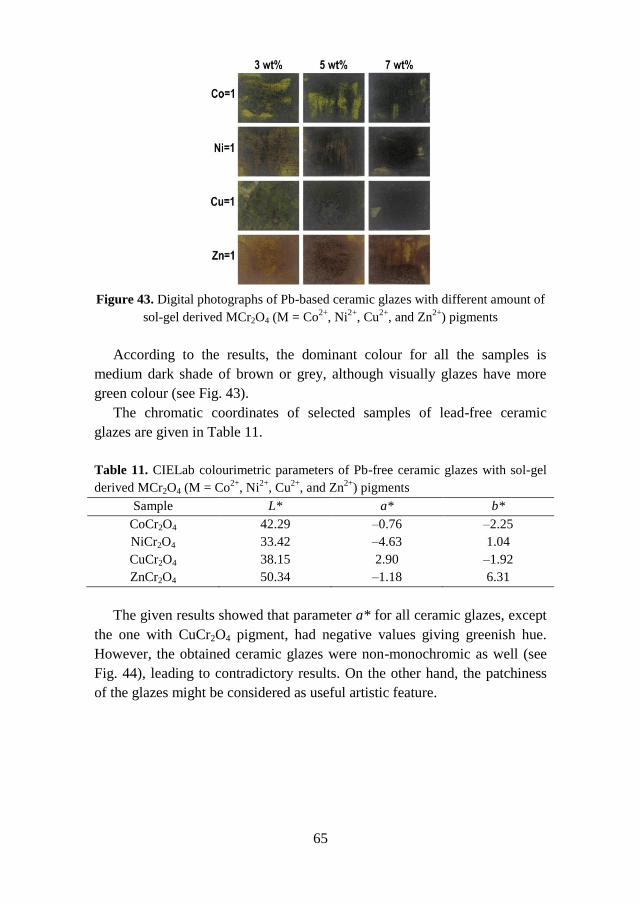
65
Figure 43. Digital photographs of Pb-based ceramic glazes with different amount of
sol-gel derived MCr2O4 (M = Co2+
, Ni2+
, Cu2+
, and Zn2+
) pigments
According to the results, the dominant colour for all the samples is
medium dark shade of brown or grey, although visually glazes have more
green colour (see Fig. 43).
The chromatic coordinates of selected samples of lead-free ceramic
glazes are given in Table 11.
Table 11. CIELab colourimetric parameters of Pb-free ceramic glazes with sol-gel
derived MCr2O4 (M = Co2+
, Ni2+
, Cu2+
, and Zn2+
) pigments
Sample L* a* b*
CoCr2O4 42.29 –0.76 –2.25
NiCr2O4 33.42 –4.63 1.04
CuCr2O4 38.15 2.90 –1.92
ZnCr2O4 50.34 –1.18 6.31
The given results showed that parameter a* for all ceramic glazes, except
the one with CuCr2O4 pigment, had negative values giving greenish hue.
However, the obtained ceramic glazes were non-monochromic as well (see
Fig. 44), leading to contradictory results. On the other hand, the patchiness
of the glazes might be considered as useful artistic feature.
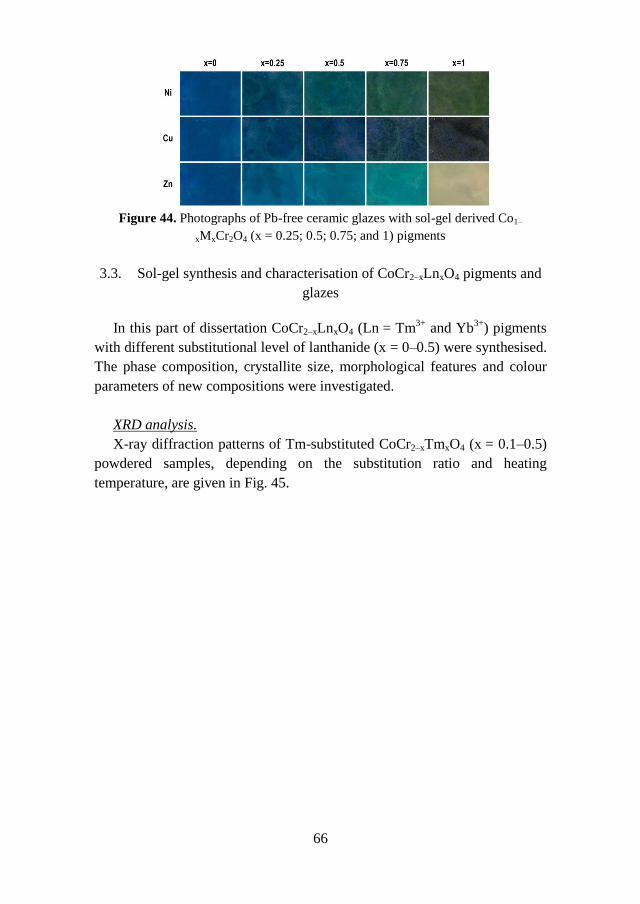
66
Figure 44. Photographs of Pb-free ceramic glazes with sol-gel derived Co1–
xMxCr2O4 (x = 0.25; 0.5; 0.75; and 1) pigments
3.3. Sol-gel synthesis and characterisation of CoCr2–xLnxO4 pigments and
glazes
In this part of dissertation CoCr2–xLnxO4 (Ln = Tm3+
and Yb3+
) pigments
with different substitutional level of lanthanide (x = 0–0.5) were synthesised.
The phase composition, crystallite size, morphological features and colour
parameters of new compositions were investigated.
XRD analysis.
X-ray diffraction patterns of Tm-substituted CoCr2–xTmxO4 (x = 0.1–0.5)
powdered samples, depending on the substitution ratio and heating
temperature, are given in Fig. 45.
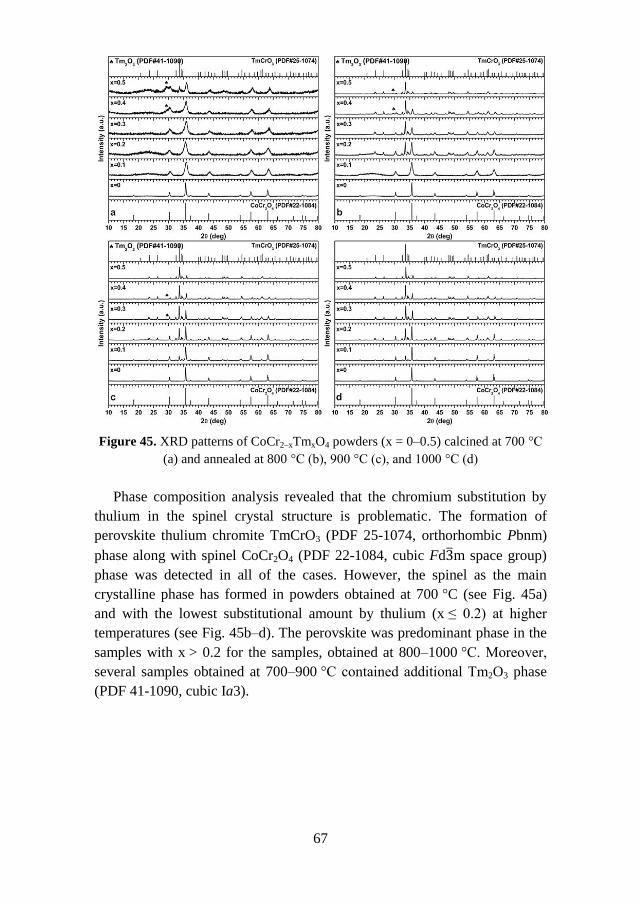
67
Figure 45. XRD patterns of CoCr2–xTmxO4 powders (x = 0–0.5) calcined at 700 °C
(a) and annealed at 800 °C (b), 900 °C (c), and 1000 °C (d)
Phase composition analysis revealed that the chromium substitution by
thulium in the spinel crystal structure is problematic. The formation of
perovskite thulium chromite TmCrO3 (PDF 25-1074, orthorhombic Pbnm)
phase along with spinel CoCr2O4 (PDF 22-1084, cubic Fd m space group)
phase was detected in all of the cases. However, the spinel as the main
crystalline phase has formed in powders obtained at 700 °C (see Fig. 45a)
and with the lowest substitutional amount by thulium (x ≤ 0.2) at higher
temperatures (see Fig. 45b–d). The perovskite was predominant phase in the
samples with x > 0.2 for the samples, obtained at 800–1000 °C. Moreover,
several samples obtained at 700–900 °C contained additional Tm2O3 phase
(PDF 41-1090, cubic Ia3).
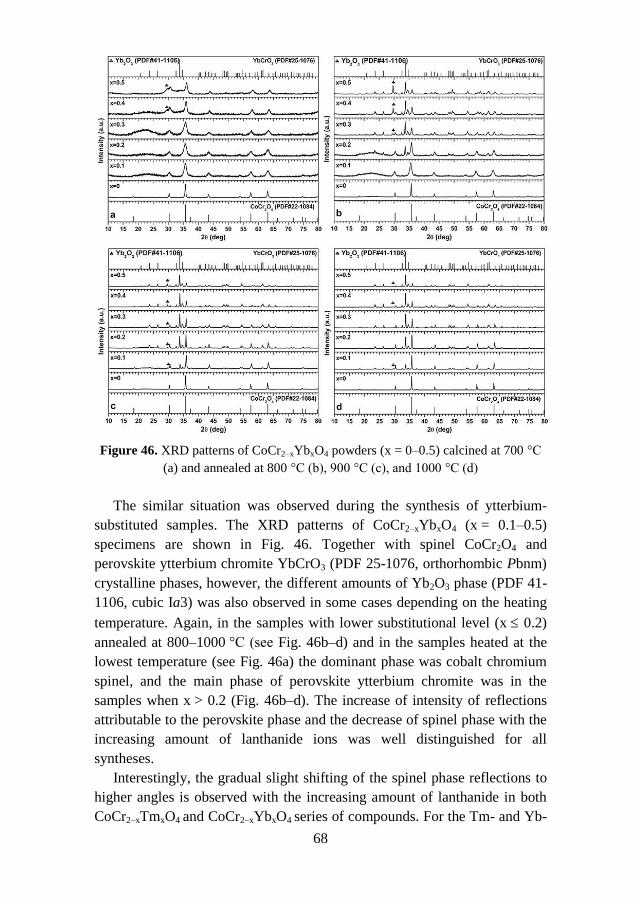
68
Figure 46. XRD patterns of CoCr2–xYbxO4 powders (x = 0–0.5) calcined at 700 °C
(a) and annealed at 800 °C (b), 900 °C (c), and 1000 °C (d)
The similar situation was observed during the synthesis of ytterbium-
substituted samples. The XRD patterns of CoCr2–xYbxO4 (x = 0.1–0.5)
specimens are shown in Fig. 46. Together with spinel CoCr2O4 and
perovskite ytterbium chromite YbCrO3 (PDF 25-1076, orthorhombic Pbnm)
crystalline phases, however, the different amounts of Yb2O3 phase (PDF 41-
1106, cubic Ia3) was also observed in some cases depending on the heating
temperature. Again, in the samples with lower substitutional level (x 0.2)
annealed at 800–1000 °C (see Fig. 46b–d) and in the samples heated at the
lowest temperature (see Fig. 46a) the dominant phase was cobalt chromium
spinel, and the main phase of perovskite ytterbium chromite was in the
samples when x > 0.2 (Fig. 46b–d). The increase of intensity of reflections
attributable to the perovskite phase and the decrease of spinel phase with the
increasing amount of lanthanide ions was well distinguished for all
syntheses.
Interestingly, the gradual slight shifting of the spinel phase reflections to
higher angles is observed with the increasing amount of lanthanide in both
CoCr2–xTmxO4 and CoCr2–xYbxO4 series of compounds. For the Tm- and Yb-
69
substituted samples (when x = 0.5) obtained at 1000 °C the most intense
peak shifts over 0.39 and 0.28 2θ degrees, respectively. The estimated
crystallite size for the samples obtained at the highest temperature varied in
the range of 51.5–61.5 nm and 37.7–57.6 nm for Tm-substituted and Yb-
substituted samples, respectively (see Table 12).
Table 12. The lattice constants and estimated crystallite sizes of the spinel phase in
CoCr2–xTmxO4 and CoCr2–xYbxO4 samples
Amount of
Tm (x)
a (Ǻ)
(±0.0003)
Crystallite
size (nm)
Amount of
Yb (x)
a (Ǻ)
(±0.0003)
Crystallite
size (nm)
0 8.3206 51.49 0 8.3209 51.49
0.1 8.3086 51.53 0.1 8.3105 54.39
0.2 8.3006 54.37 0.2 8.2940 57.64
0.3 8.2814 51.64 0.3 8.2815 37.72
0.4 8.2588 57.68 0.4 8.2620 54.48
0.5 8.2370 61.45 0.5 8.2392 51.67
The cell parameters of these powders decreased with the increasing the
amount of lanthanide ions confirming the existence of lanthanide ions, at
least very negligible amount, in the spinel phase. For the same samples, the
crystallite size of perovskite phase ranged from 50.3 to 56.1 nm (TmCrO3)
and from 50.3 to 56.2 nm (YbCrO3). These results are presented in Table 13.
Unfortunately, no correlation or linear dependence of crystallite size on the
substitutional level for was observed.
Since the lanthanide ion substitution in CoCr2–xLnxO4 at high
concentrations of substituents is problematic, additional sol-gel syntheses of
CoCr2–xTmxO4 and CoCr2–xYbxO4 with lower amount of lanthanides
(x = 0.01; 0.02; 0.03; 0.04 and 0.05) were performed. The XRD patterns
revealed that CoCr2–xTmxO4 samples with the main crystalline spinel phase
were obtained (see Fig. 47). However, insignificant amount of Cr2O3 was
observed in the samples with x = 0.03, obtained at 700–900 °C. Moreover,
minor amount of thulium perovskite phase has formed for the compositions
with x = 0.05 heated at 900 and 1000 °C (Fig. 47c and d).
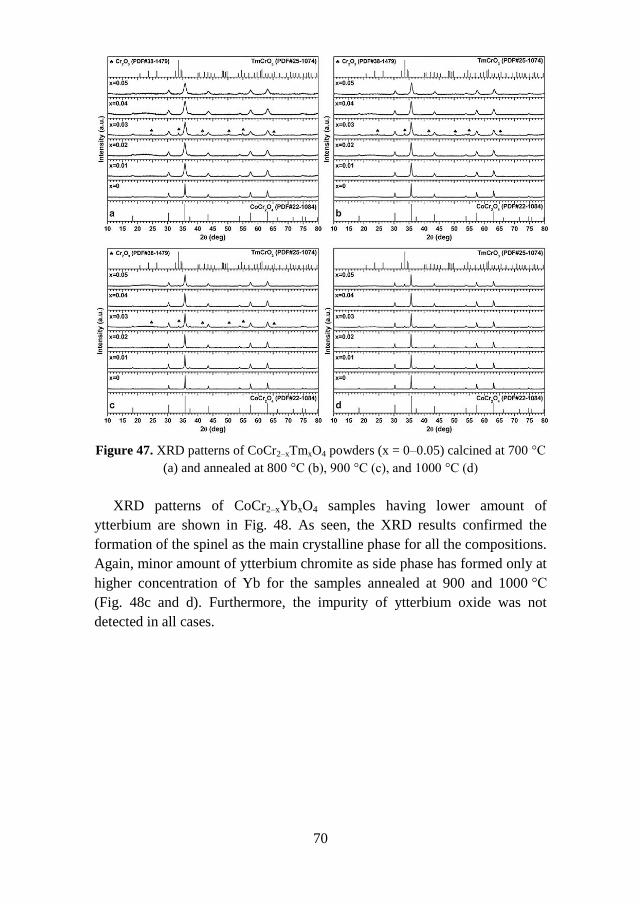
70
Figure 47. XRD patterns of CoCr2–xTmxO4 powders (x = 0–0.05) calcined at 700 °C
(a) and annealed at 800 °C (b), 900 °C (c), and 1000 °C (d)
XRD patterns of CoCr2–xYbxO4 samples having lower amount of
ytterbium are shown in Fig. 48. As seen, the XRD results confirmed the
formation of the spinel as the main crystalline phase for all the compositions.
Again, minor amount of ytterbium chromite as side phase has formed only at
higher concentration of Yb for the samples annealed at 900 and 1000 °C
(Fig. 48c and d). Furthermore, the impurity of ytterbium oxide was not
detected in all cases.
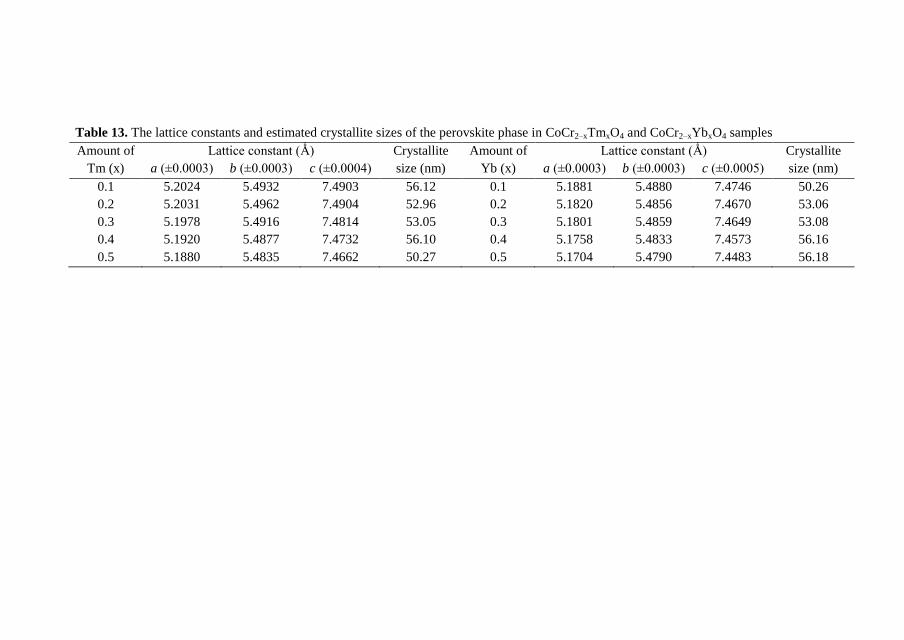
Table 13. The lattice constants and estimated crystallite sizes of the perovskite phase in CoCr2–xTmxO4 and CoCr2–xYbxO4 samples
Amount of
Tm (x)
Lattice constant (Ǻ) Crystallite
size (nm)
Amount of
Yb (x)
Lattice constant (Ǻ) Crystallite
size (nm) a (±0.0003) b (±0.0003) c (±0.0004) a (±0.0003) b (±0.0003) c (±0.0005)
0.1 5.2024 5.4932 7.4903 56.12 0.1 5.1881 5.4880 7.4746 50.26
0.2 5.2031 5.4962 7.4904 52.96 0.2 5.1820 5.4856 7.4670 53.06
0.3 5.1978 5.4916 7.4814 53.05 0.3 5.1801 5.4859 7.4649 53.08
0.4 5.1920 5.4877 7.4732 56.10 0.4 5.1758 5.4833 7.4573 56.16
0.5 5.1880 5.4835 7.4662 50.27 0.5 5.1704 5.4790 7.4483 56.18
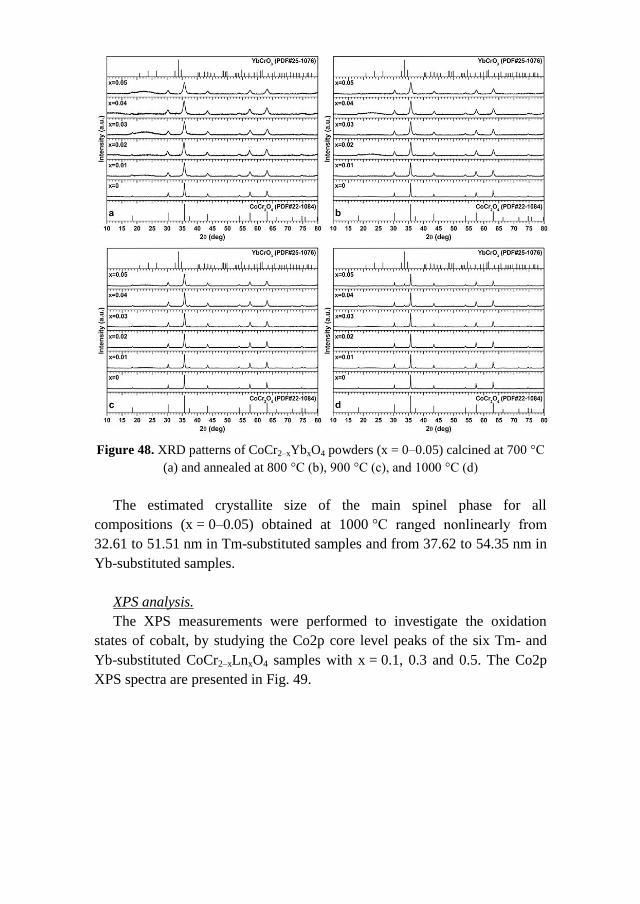
Figure 48. XRD patterns of CoCr2–xYbxO4 powders (x = 0–0.05) calcined at 700 °C
(a) and annealed at 800 °C (b), 900 °C (c), and 1000 °C (d)
The estimated crystallite size of the main spinel phase for all
compositions (x = 0–0.05) obtained at 1000 °C ranged nonlinearly from
32.61 to 51.51 nm in Tm-substituted samples and from 37.62 to 54.35 nm in
Yb-substituted samples.
XPS analysis.
The XPS measurements were performed to investigate the oxidation
states of cobalt, by studying the Co2p core level peaks of the six Tm- and
Yb-substituted CoCr2–xLnxO4 samples with x = 0.1, 0.3 and 0.5. The Co2p
XPS spectra are presented in Fig. 49.
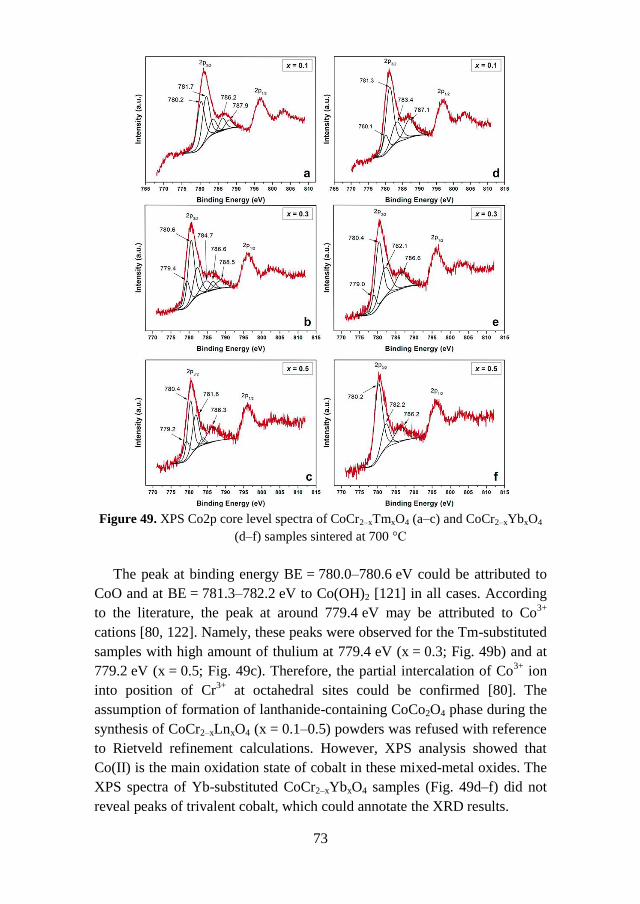
73
Figure 49. XPS Co2p core level spectra of CoCr2–xTmxO4 (a–c) and CoCr2–xYbxO4
(d–f) samples sintered at 700 °C
The peak at binding energy BE = 780.0–780.6 eV could be attributed to
CoO and at BE = 781.3–782.2 eV to Co(OH)2 [121] in all cases. According
to the literature, the peak at around 779.4 eV may be attributed to Co3+
cations [80, 122]. Namely, these peaks were observed for the Tm-substituted
samples with high amount of thulium at 779.4 eV (x = 0.3; Fig. 49b) and at
779.2 eV (x = 0.5; Fig. 49c). Therefore, the partial intercalation of Co3+
ion
into position of Cr3+
at octahedral sites could be confirmed [80]. The
assumption of formation of lanthanide-containing CoCo2O4 phase during the
synthesis of CoCr2–xLnxO4 (x = 0.1–0.5) powders was refused with reference
to Rietveld refinement calculations. However, XPS analysis showed that
Co(II) is the main oxidation state of cobalt in these mixed-metal oxides. The
XPS spectra of Yb-substituted CoCr2–xYbxO4 samples (Fig. 49d–f) did not
reveal peaks of trivalent cobalt, which could annotate the XRD results.
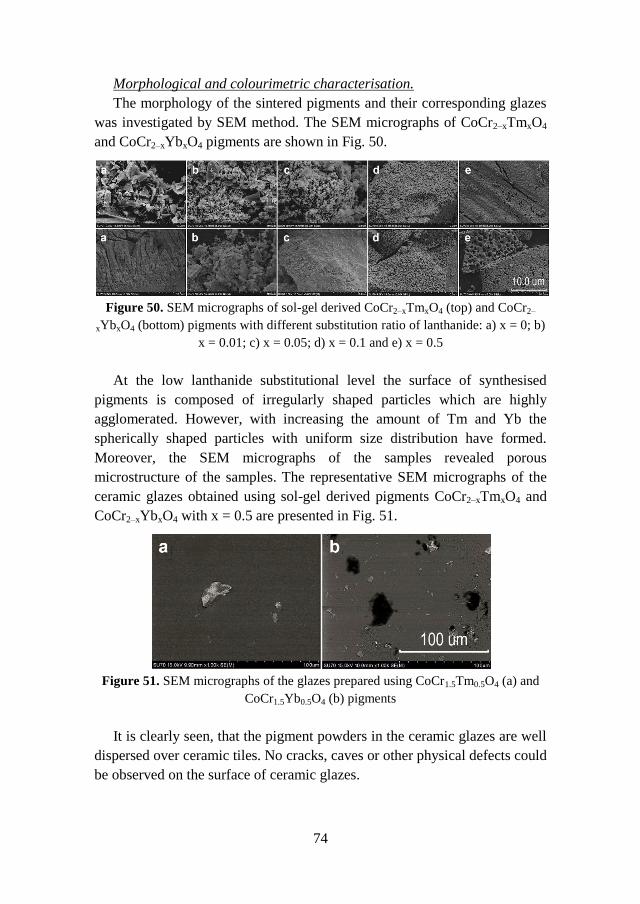
74
Morphological and colourimetric characterisation.
The morphology of the sintered pigments and their corresponding glazes
was investigated by SEM method. The SEM micrographs of CoCr2–xTmxO4
and CoCr2–xYbxO4 pigments are shown in Fig. 50.
Figure 50. SEM micrographs of sol-gel derived CoCr2–xTmxO4 (top) and CoCr2–
xYbxO4 (bottom) pigments with different substitution ratio of lanthanide: a) x = 0; b)
x = 0.01; c) x = 0.05; d) x = 0.1 and e) x = 0.5
At the low lanthanide substitutional level the surface of synthesised
pigments is composed of irregularly shaped particles which are highly
agglomerated. However, with increasing the amount of Tm and Yb the
spherically shaped particles with uniform size distribution have formed.
Moreover, the SEM micrographs of the samples revealed porous
microstructure of the samples. The representative SEM micrographs of the
ceramic glazes obtained using sol-gel derived pigments CoCr2–xTmxO4 and
CoCr2–xYbxO4 with x = 0.5 are presented in Fig. 51.
Figure 51. SEM micrographs of the glazes prepared using CoCr1.5Tm0.5O4 (a) and
CoCr1.5Yb0.5O4 (b) pigments
It is clearly seen, that the pigment powders in the ceramic glazes are well
dispersed over ceramic tiles. No cracks, caves or other physical defects could
be observed on the surface of ceramic glazes.
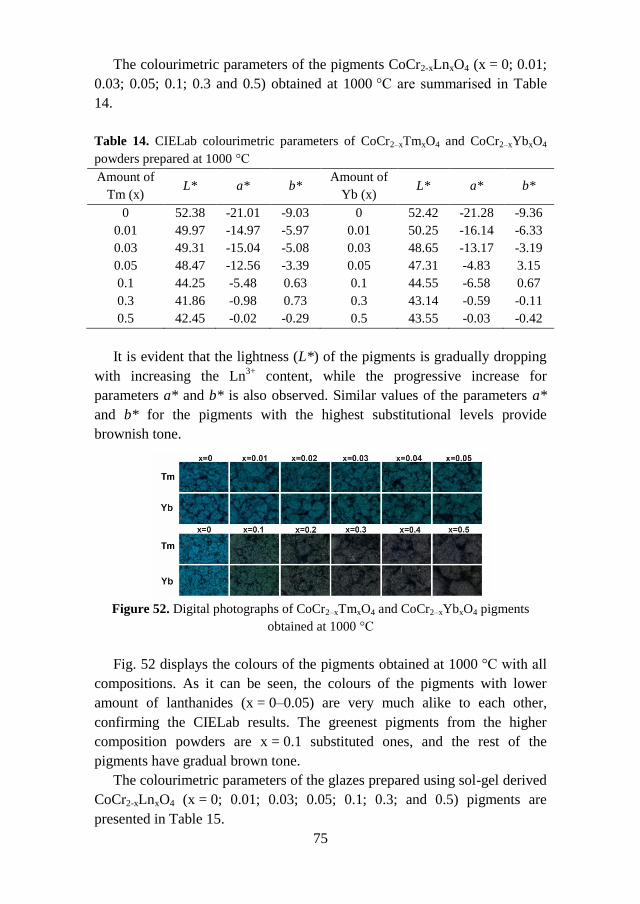
75
The colourimetric parameters of the pigments CoCr2-xLnxO4 (x = 0; 0.01;
0.03; 0.05; 0.1; 0.3 and 0.5) obtained at 1000 °C are summarised in Table
14.
Table 14. CIELab colourimetric parameters of CoCr2–xTmxO4 and CoCr2–xYbxO4
powders prepared at 1000 °C
Amount of
Tm (x) L* a* b*
Amount of
Yb (x) L* a* b*
0 52.38 -21.01 -9.03 0 52.42 -21.28 -9.36
0.01 49.97 -14.97 -5.97 0.01 50.25 -16.14 -6.33
0.03 49.31 -15.04 -5.08 0.03 48.65 -13.17 -3.19
0.05 48.47 -12.56 -3.39 0.05 47.31 -4.83 3.15
0.1 44.25 -5.48 0.63 0.1 44.55 -6.58 0.67
0.3 41.86 -0.98 0.73 0.3 43.14 -0.59 -0.11
0.5 42.45 -0.02 -0.29 0.5 43.55 -0.03 -0.42
It is evident that the lightness (L*) of the pigments is gradually dropping
with increasing the Ln3+
content, while the progressive increase for
parameters a* and b* is also observed. Similar values of the parameters a*
and b* for the pigments with the highest substitutional levels provide
brownish tone.
Figure 52. Digital photographs of CoCr2–xTmxO4 and CoCr2–xYbxO4 pigments
obtained at 1000 °C
Fig. 52 displays the colours of the pigments obtained at 1000 °C with all
compositions. As it can be seen, the colours of the pigments with lower
amount of lanthanides (x = 0–0.05) are very much alike to each other,
confirming the CIELab results. The greenest pigments from the higher
composition powders are x = 0.1 substituted ones, and the rest of the
pigments have gradual brown tone.
The colourimetric parameters of the glazes prepared using sol-gel derived
CoCr2-xLnxO4 (x = 0; 0.01; 0.03; 0.05; 0.1; 0.3; and 0.5) pigments are
presented in Table 15.
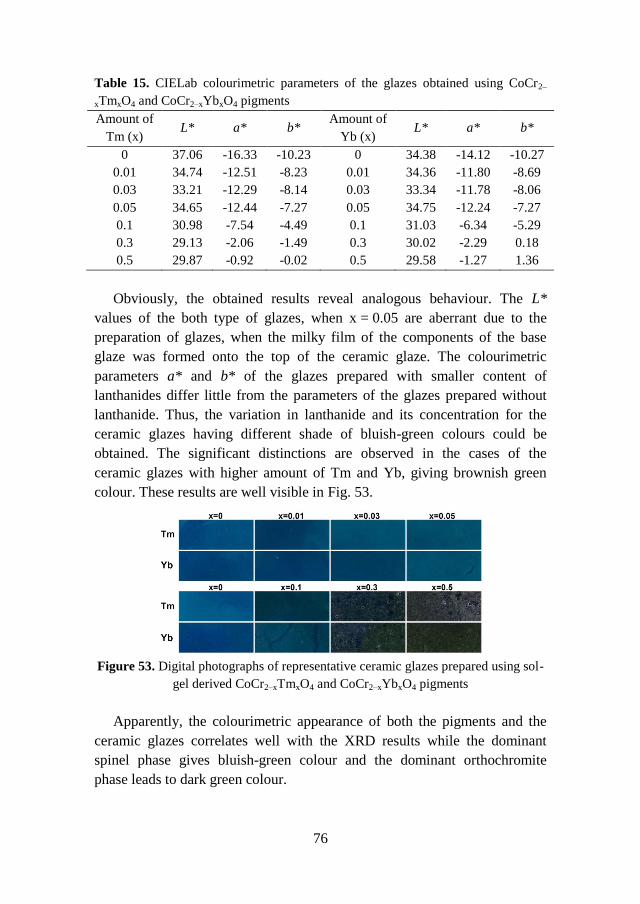
76
Table 15. CIELab colourimetric parameters of the glazes obtained using CoCr2–
xTmxO4 and CoCr2–xYbxO4 pigments
Amount of
Tm (x) L* a* b*
Amount of
Yb (x) L* a* b*
0 37.06 -16.33 -10.23 0 34.38 -14.12 -10.27
0.01 34.74 -12.51 -8.23 0.01 34.36 -11.80 -8.69
0.03 33.21 -12.29 -8.14 0.03 33.34 -11.78 -8.06
0.05 34.65 -12.44 -7.27 0.05 34.75 -12.24 -7.27
0.1 30.98 -7.54 -4.49 0.1 31.03 -6.34 -5.29
0.3 29.13 -2.06 -1.49 0.3 30.02 -2.29 0.18
0.5 29.87 -0.92 -0.02 0.5 29.58 -1.27 1.36
Obviously, the obtained results reveal analogous behaviour. The L*
values of the both type of glazes, when x = 0.05 are aberrant due to the
preparation of glazes, when the milky film of the components of the base
glaze was formed onto the top of the ceramic glaze. The colourimetric
parameters a* and b* of the glazes prepared with smaller content of
lanthanides differ little from the parameters of the glazes prepared without
lanthanide. Thus, the variation in lanthanide and its concentration for the
ceramic glazes having different shade of bluish-green colours could be
obtained. The significant distinctions are observed in the cases of the
ceramic glazes with higher amount of Tm and Yb, giving brownish green
colour. These results are well visible in Fig. 53.
Figure 53. Digital photographs of representative ceramic glazes prepared using sol-
gel derived CoCr2–xTmxO4 and CoCr2–xYbxO4 pigments
Apparently, the colourimetric appearance of both the pigments and the
ceramic glazes correlates well with the XRD results while the dominant
spinel phase gives bluish-green colour and the dominant orthochromite
phase leads to dark green colour.
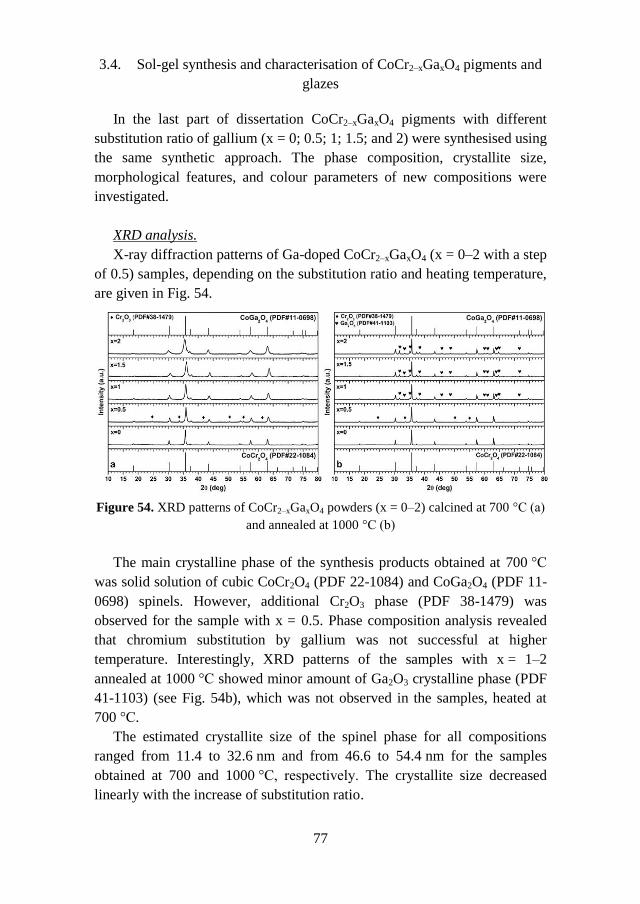
77
3.4. Sol-gel synthesis and characterisation of CoCr2–xGaxO4 pigments and
glazes
In the last part of dissertation CoCr2–xGaxO4 pigments with different
substitution ratio of gallium (x = 0; 0.5; 1; 1.5; and 2) were synthesised using
the same synthetic approach. The phase composition, crystallite size,
morphological features, and colour parameters of new compositions were
investigated.
XRD analysis.
X-ray diffraction patterns of Ga-doped CoCr2–xGaxO4 (x = 0–2 with a step
of 0.5) samples, depending on the substitution ratio and heating temperature,
are given in Fig. 54.
Figure 54. XRD patterns of CoCr2–xGaxO4 powders (x = 0–2) calcined at 700 °C (a)
and annealed at 1000 °C (b)
The main crystalline phase of the synthesis products obtained at 700 °C
was solid solution of cubic CoCr2O4 (PDF 22-1084) and CoGa2O4 (PDF 11-
0698) spinels. However, additional Cr2O3 phase (PDF 38-1479) was
observed for the sample with x = 0.5. Phase composition analysis revealed
that chromium substitution by gallium was not successful at higher
temperature. Interestingly, XRD patterns of the samples with x = 1–2
annealed at 1000 °C showed minor amount of Ga2O3 crystalline phase (PDF
41-1103) (see Fig. 54b), which was not observed in the samples, heated at
700 °C.
The estimated crystallite size of the spinel phase for all compositions
ranged from 11.4 to 32.6 nm and from 46.6 to 54.4 nm for the samples
obtained at 700 and 1000 °C, respectively. The crystallite size decreased
linearly with the increase of substitution ratio.
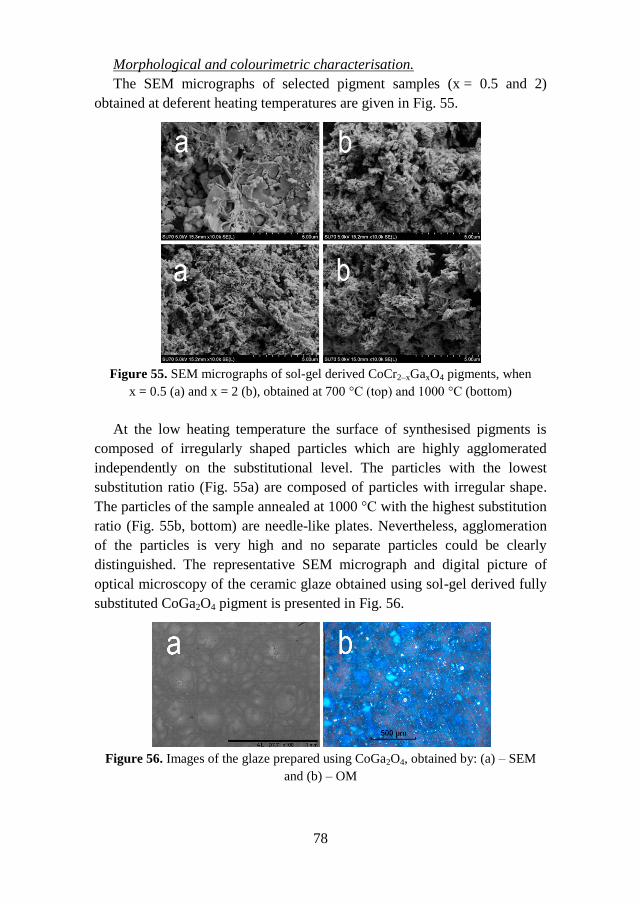
78
Morphological and colourimetric characterisation.
The SEM micrographs of selected pigment samples (x = 0.5 and 2)
obtained at deferent heating temperatures are given in Fig. 55.
Figure 55. SEM micrographs of sol-gel derived CoCr2–xGaxO4 pigments, when
x = 0.5 (a) and x = 2 (b), obtained at 700 °C (top) and 1000 °C (bottom)
At the low heating temperature the surface of synthesised pigments is
composed of irregularly shaped particles which are highly agglomerated
independently on the substitutional level. The particles with the lowest
substitution ratio (Fig. 55a) are composed of particles with irregular shape.
The particles of the sample annealed at 1000 °C with the highest substitution
ratio (Fig. 55b, bottom) are needle-like plates. Nevertheless, agglomeration
of the particles is very high and no separate particles could be clearly
distinguished. The representative SEM micrograph and digital picture of
optical microscopy of the ceramic glaze obtained using sol-gel derived fully
substituted CoGa2O4 pigment is presented in Fig. 56.
Figure 56. Images of the glaze prepared using CoGa2O4, obtained by: (a) – SEM
and (b) – OM
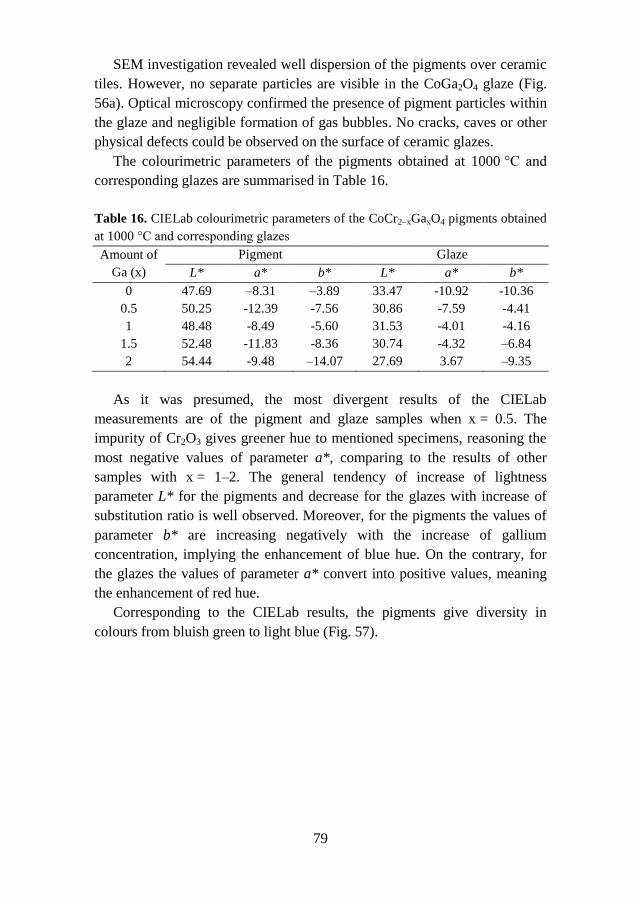
79
SEM investigation revealed well dispersion of the pigments over ceramic
tiles. However, no separate particles are visible in the CoGa2O4 glaze (Fig.
56a). Optical microscopy confirmed the presence of pigment particles within
the glaze and negligible formation of gas bubbles. No cracks, caves or other
physical defects could be observed on the surface of ceramic glazes.
The colourimetric parameters of the pigments obtained at 1000 °C and
corresponding glazes are summarised in Table 16.
Table 16. CIELab colourimetric parameters of the CoCr2–xGaxO4 pigments obtained
at 1000 °C and corresponding glazes
Amount of
Ga (x)
Pigment Glaze
L* a* b* L* a* b*
0 47.69 –8.31 –3.89 33.47 -10.92 -10.36
0.5 50.25 -12.39 -7.56 30.86 -7.59 -4.41
1 48.48 -8.49 -5.60 31.53 -4.01 -4.16
1.5 52.48 -11.83 -8.36 30.74 -4.32 –6.84
2 54.44 -9.48 –14.07 27.69 3.67 –9.35
As it was presumed, the most divergent results of the CIELab
measurements are of the pigment and glaze samples when x = 0.5. The
impurity of Cr2O3 gives greener hue to mentioned specimens, reasoning the
most negative values of parameter a*, comparing to the results of other
samples with x = 1–2. The general tendency of increase of lightness
parameter L* for the pigments and decrease for the glazes with increase of
substitution ratio is well observed. Moreover, for the pigments the values of
parameter b* are increasing negatively with the increase of gallium
concentration, implying the enhancement of blue hue. On the contrary, for
the glazes the values of parameter a* convert into positive values, meaning
the enhancement of red hue.
Corresponding to the CIELab results, the pigments give diversity in
colours from bluish green to light blue (Fig. 57).
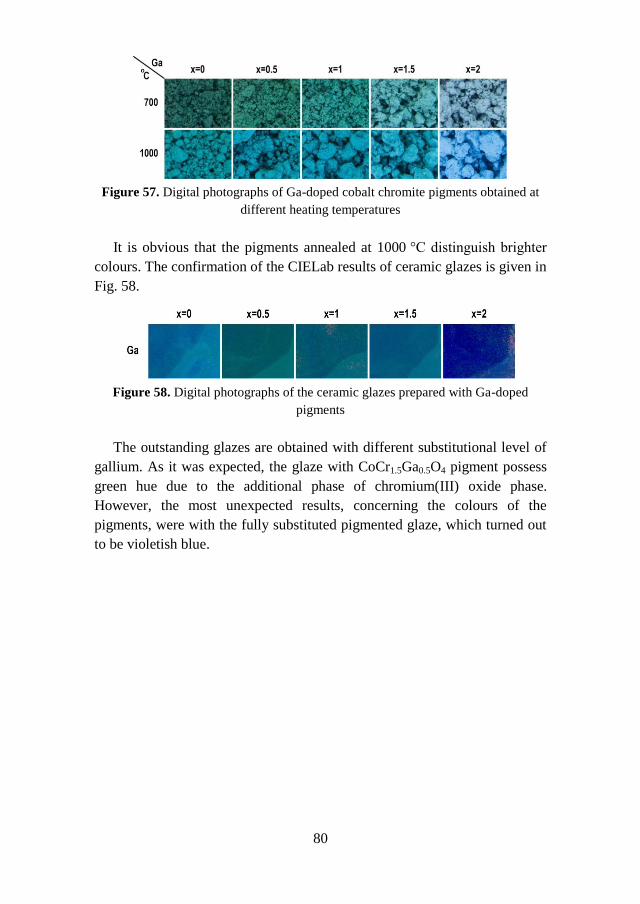
80
Figure 57. Digital photographs of Ga-doped cobalt chromite pigments obtained at
different heating temperatures
It is obvious that the pigments annealed at 1000 °C distinguish brighter
colours. The confirmation of the CIELab results of ceramic glazes is given in
Fig. 58.
Figure 58. Digital photographs of the ceramic glazes prepared with Ga-doped
pigments
The outstanding glazes are obtained with different substitutional level of
gallium. As it was expected, the glaze with CoCr1.5Ga0.5O4 pigment possess
green hue due to the additional phase of chromium(III) oxide phase.
However, the most unexpected results, concerning the colours of the
pigments, were with the fully substituted pigmented glaze, which turned out
to be violetish blue.
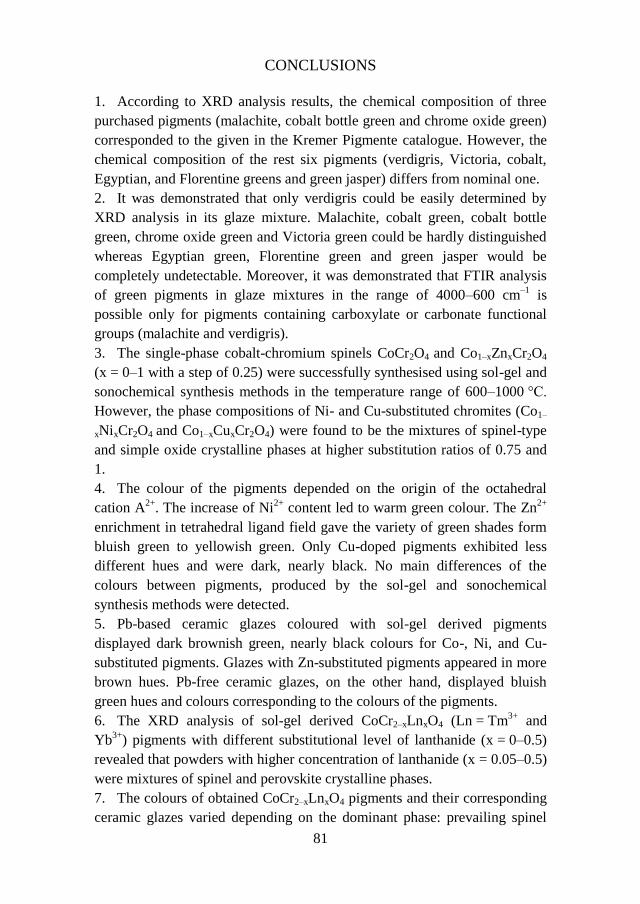
81
CONCLUSIONS
1. According to XRD analysis results, the chemical composition of three
purchased pigments (malachite, cobalt bottle green and chrome oxide green)
corresponded to the given in the Kremer Pigmente catalogue. However, the
chemical composition of the rest six pigments (verdigris, Victoria, cobalt,
Egyptian, and Florentine greens and green jasper) differs from nominal one.
2. It was demonstrated that only verdigris could be easily determined by
XRD analysis in its glaze mixture. Malachite, cobalt green, cobalt bottle
green, chrome oxide green and Victoria green could be hardly distinguished
whereas Egyptian green, Florentine green and green jasper would be
completely undetectable. Moreover, it was demonstrated that FTIR analysis
of green pigments in glaze mixtures in the range of 4000–600 cm–1
is
possible only for pigments containing carboxylate or carbonate functional
groups (malachite and verdigris).
3. The single-phase cobalt-chromium spinels CoCr2O4 and Co1–xZnxCr2O4
(x = 0–1 with a step of 0.25) were successfully synthesised using sol-gel and
sonochemical synthesis methods in the temperature range of 600–1000 °C.
However, the phase compositions of Ni- and Cu-substituted chromites (Co1–
xNixCr2O4 and Co1–xCuxCr2O4) were found to be the mixtures of spinel-type
and simple oxide crystalline phases at higher substitution ratios of 0.75 and
1.
4. The colour of the pigments depended on the origin of the octahedral
cation A2+
. The increase of Ni2+
content led to warm green colour. The Zn2+
enrichment in tetrahedral ligand field gave the variety of green shades form
bluish green to yellowish green. Only Cu-doped pigments exhibited less
different hues and were dark, nearly black. No main differences of the
colours between pigments, produced by the sol-gel and sonochemical
synthesis methods were detected.
5. Pb-based ceramic glazes coloured with sol-gel derived pigments
displayed dark brownish green, nearly black colours for Co-, Ni, and Cu-
substituted pigments. Glazes with Zn-substituted pigments appeared in more
brown hues. Pb-free ceramic glazes, on the other hand, displayed bluish
green hues and colours corresponding to the colours of the pigments.
6. The XRD analysis of sol-gel derived CoCr2–xLnxO4 (Ln = Tm3+
and
Yb3+
) pigments with different substitutional level of lanthanide (x = 0–0.5)
revealed that powders with higher concentration of lanthanide (x = 0.05–0.5)
were mixtures of spinel and perovskite crystalline phases.
7. The colours of obtained CoCr2–xLnxO4 pigments and their corresponding
ceramic glazes varied depending on the dominant phase: prevailing spinel
82
phase gave bluish-green colour, and the main perovskite phase gave dark
brown hue.
8. The main crystalline phase of the synthesis products in the system of
CoCr2–xGaxO4 obtained at 700 °C was solid solution of cubic CoCr2O4 and
CoGa2O4 spinels. However, additional Cr2O3 phase was observed for the
sample with x = 0.5. Interestingly, XRD patterns of the samples with x = 1–
2 annealed at 1000 °C showed minor amount of Ga2O3 crystalline phase,
which was not observed in the samples, heated at 700 °C.
9. The colours of obtained CoCr2–xGaxO4 pigments and their corresponding
ceramic glazes were unexpected. The substitution of Cr3+
by Ga3+
ion led to
the gradual light blueness of the pigment. The impurity of Cr2O3 in the
sample with the lowest substitution ratio gave the green hue to both the
pigment and corresponding ceramic glaze. Surprisingly, the ceramic glaze
prepared using fully substituted CoGa2O4 pigment turned out to possess
violetish blue colour.
10. SEM analysis revealed that the surface of all synthesised materials was
composed of highly agglomerated particles.
83
LIST OF PUBLICATIONS
Articals in journals
1. Grazenaite E., Jasulaitiene J., Ramanauskas R., Kareiva A. Sol–gel
synthesis, characterization and application of lanthanide-doped cobalt
chromites (CoCr2–xLnxO4; Ln = Tm3+
and Yb3+
). Journal of the European
Ceramic Society. 2018, 38: 3361-3368.
2. Grazenaite E., Pinkas J., Beganskiene A., Kareiva A. Sol–gel and
sonochemically derived transition metal (Co, Ni, Cu, and Zn) chromites as
pigments: A comparative study. Ceramics International. 2016, 42: 9402-
9412.
3. Grazenaite E., Kiuberis J., Beganskiene A., Senvaitiene J., Kareiva A.
XRD and FTIR characterisation of historical green pigments and their lead-
based glazes. Chemija. 2014, 25 (4): 199-205.
Published contributions to academic conference
1. Grazenaite E., Kareiva A. Cobalt chromite based pigments as colorants
for ceramic glazes: The influence of the substitution type // There is no future
without the past: Science on the interface of 19th-20
th centuries. The
international conference dedicated to the 215th birth anniversary of Ignacy
Domeyko. Vilnius, Lithuania, 28-30 Jul 2017, pp. 78-79.
2. Grazenaite E., Kareiva A. Galium doped cobalt chromites as ceramic
pigments // Functional materials and Nanotechnologies 2017: international
conference. Tartu, Estonia, 24-27 Apr 2017, p. 91.
3. Grazenaite E., Kareiva A. Sol-gel synthesis of cobalt chromite powders
doped with lanthanides // Advanced materials and technologies: the 18th
international conference-school. Palanga, Lithuania, 27-31 Aug 2016, p.
102.
4. Grazenaite E., Kareiva A. Commercial and sol-gel derived cobalt
chromites as ceramic pigments: a comparative study // Chemistry and
chemical technology 2016: international conference of Lithuanian Society of
Chemistry. Vilnius, Lithuania, 28-29 Apr 2016, p. 227.
5. Grazenaite E. Thermal behaviour of the precursors for transition metal
(Co, Ni, Cu and Zn) chromites synthesized via aqueous coprecipitation, sol-
gel and sonochemical synthesis routes // Nanochemistry and nanomaterials
2015: 2nd
international conference of chemists: the international conference.
Vilnius, Lithuania, 22-24 Oct 2015, p. 24.
6. Grazenaite E., Beganskiene A., Pinkas J., Kareiva A. Synthesis,
characterisation and application of novel green pigments Co(1-x)MxCr2O4

84
(M = Cu, Zn, Ni) // Advanced materials and technologies 2015: the
international conference, Palanga, Lithuania, 27-31 Aug 2015, p 76.
7. Grazenaite E., Pinkas J., Roupcova P., Losos Z., Kareiva A. Synthesis
and characterisation of Co1-xMxCr2O4 as green pigments // Chemistry and
chemical technology 2015: international conference of Lithuanian Chemical
Society, dedicated to Professor Vitas Daukšas on his 80th birth anniversary,
Vilnius, Lithuania, 23 Jan 2015, pp 83-85.
8. Grazenaite E., Senvaitiene S., Kiuberis J., Kareiva A. Characterization
of green historical pigments and glazes using FTIR and XRD analysis
methods // Chemistry and chemical technology 2014: the international
conference, Kaunas, Lithuania, 25 Apr 2014.
Publications not included in the thesis
1. Golubevas R., Zarkov A., Grazenaite E., Alinauskas L., Garskaite E.,
Kareiva A. Preparation and characterization of the inorganic-organic
(bioglass-poly(methyl methacrylate)) composite for bone tissue engineering
// Advanced materials and technologies: book of abstracts of the 18th
international conference-school. Palanga, Lithuania, 27-31 Aug 2016, p.
103.
2. Stankeviciute Z., Grigoraviciute-Puroniene I., Grazenaite E.,
Alinauskas L., Garskaite E., Kareiva A. Synthesis of β-tricalcium phosphate
powders with controlled crystallinity // Nanostructured hybrid materials:
protective and functional coatings, surface treatment, bioceramics,
biocomposites and membranes: HINT workshop. Vilnius, Lithuania, 14-16
Mar 2016, p. 42.
3. Zarkov A., Vegelyte V., Alinauskas L., Stankeviciute Z., Grazenaite E.,
Prichodko A., Grigoraviciute-Puroniene I., Opuchovic O., Tautkus S.,
Skaudzius R., Garskaite E., Beganskiene A., Kareiva A. Sol-gel processing
route to calcium hydroxyapatite bioceramics: repeatability issues //
Nanostructured hybrid materials: protective and functional coatings, surface
treatment, bioceramics, biocomposites and membranes: HINT workshop.
Vilnius, Lithuania, 14-16 Mar 2016, p. 14.
85
ACKNOWLEDGEMENTS
Finally, I came to the part where I can express my gratitude to all the
people, who guided and helped me throughout this long scientific journey.
First and foremost, I would like to sincerely thank my research
supervisors, prof. (HP) dr. Aldona Beganskienė and especially prof. habil.
dr. Aivaras Kareiva, for all the knowledge, guidance and comprehension
during these past years. I am also very grateful to my scientific consultant
prof. RNDr. Jiří Pinkas for all the useful advices and exciting
acquaintanceship with sonochemistry. Thank you very much for the given
opportunity to work in your laboratory.
I am especially thankful to all the specialists from Masaryk University
and Central European Institute of Technology (CEITEC), who provided me
with a great help during my internship in Czech Republic. Thank you, ing.
PhD Pavla Roupcova, for your uncountable XRD measurements. I am
grateful to assoc. prof. RNDr. Zdeněk Losos for the instructions and advices
with Raman measurements, mgr. Lucie Šimoníková for the challenging ICP-
OES measurements and finally mgr. PhD Zdeněk Moravec for the prompt
TG/DTG measurements. And special thanks goes to the entire prof. J.
Pinkas’ research group. Dear friends, you helped me a lot both with my
research and my everyday surroundings and made me feel welcomed and
honoured during my whole stay in Brno. You hold a special part of my heart.
I want to express my gratitude to Gediminas Kreiza and Karolis
Kazlauskas from the Institute of Applied Research, Vilnius University, for
their assistance in CIELab measurements. Special thanks goes to PhD
Vitalija Jasulaitienė from the Centre for Physical Sciences and Technology
for performing XPS measurements and her help interpreting of obtained
results.
I would like to thank assoc. prof. dr. Ramūnas Skaudžius for the valuable
introduction to Rietveld refinement using FullProf software. Dr. Olga
Opuchovič, many thanks to you for TG/DTG measurements and for always
being ready to help me with any questions I had. I am thankful to former
intern PhD student Sung-Wei Yang from National Taipei University of
Technology and former specialist Danas Sakalauskas for taking SEM
microghraphs of my samples. Danas Sakalauskas together with PhD student
Tomas Murauskas deserved gratitude for the help with FTIR measurements.
I also appreciate the assistance with DR-UV measurements provided by prof.
dr. Simas Šakirzanovas.

86
I would like to express my appreciation to Education Exchanges Support
Foundation for providing the funding for the internship and CEITEC
CZ.1.05/1.1.00/02.0068 for the financial assistance.
My dear colleagues and friends from the Institute of Chemistry, Faculty
of Chemistry and Geosciences, thank you all for the support and
encouragement over past these years. I am deeply grateful to you all,
especially to dr. Justina Gaidukevič, dr. Eva Raudonytė, dr. Lina Pavasarytė
and Aurelija Smalenskaitė.
I really appreciate the comprehension, encouragement and constant
motivation, provided by my colleagues from Centre of Cultural Heritage and
my dear old long time not seen friends. Thank you all for your tolerance and
patience!
Last but not least, the biggest thanks goes to my family. Thank you for
your love, patience and versatile support. The genuine appreciation goes to
my beloved father for the help adjusting the thesis images.
Thank you all, dear people!
87
REFERENCES
[1] L. Bloomfield, Colour in Glazes, A & C Black, London, 2012.
[2] I.S. Ahmed, H.A. Dessouki, A.A. Ali, Synthesis and characterization of
new nano-particles as blue ceramic pigment, Spectroc. Acta Pt. A-Molec.
Biomolec. Spectr. 71(2) (2008) 616-620.
[3] M. Llusar, A. Fores, J.A. Badenes, J. Calbo, M.A. Tena, G. Monros,
Colour analysis of some cobalt-based blue pigments, J Eur Ceram Soc 21(8)
(2001) 1121-1130.
[4] Parmelee CW, E.D. Lynch, Ceramic glazes, 2nd ed., Industrial
Publications, Chicago, 1951.
[5] M. Bouchard, A. Gambardella, Raman microscopy study of synthetic
cobalt blue spinels used in the field of art, J Raman Spectrosc 41(11) (2010)
1477-1485.
[6] S.R. Prim, A. García, R. Galindo, S. Cerro, M. Llusar, M.V. Folgueras,
G. Monrós, Pink ceramic pigments based on chromium doped
M(Al2−xCrx)O4, M = Mg, Zn, normal spinel, Ceram Int 39(6) (2013) 6981-
6989.
[7] M. Dondi, C. Zanelli, M. Ardit, G. Cruciani, L. Mantovani, M.
Tribaudino, G.B. Andreozzi, Ni-free, black ceramic pigments based on Co—
Cr—Fe—Mn spinels: A reappraisal of crystal structure, colour and
technological behaviour, Ceram Int 39(8) (2013) 9533-9547.
[8] J. Gilabert, M.D. Palacios, M.J. Orts, S. Mestre, Solution combustion
synthesis of (Ni,Fe)Cr2O4 pigments: Effect of post-synthesis thermal
treatments, Ceram Int 43(15) (2017) 12789-12798.
[9] O.O. Vasil'kov, O.P. Barinova, S.V. Kirsanova, N.A. Marnautov, A.B.
Elfimov, Ceramic Black Pigments Based on Chromium-Nickel Spinel
NiCr2O4, Glass and Ceramics 74(7-8) (2017) 236-239.
[10] J. Cai, M. Lu, K. Guan, W. Li, F. He, P. Chen, C. Peng, P. Rao, J. Wu,
Effect of ZnO/MgO ratio on the crystallization and optical properties of
spinel opaque glazes, J Am Ceram Soc 101(4) (2018) 1754-1764.
[11] Y. Tang, C. Wu, Y. Song, Y. Zheng, K. Zhao, Effects of colouration
mechanism and stability of CoAl2O4 ceramic pigments sintered on
substrates, Ceram Int 44(1) (2018) 1019-1025.
[12] J. Cai, M. Lv, K. Guan, Q. Sun, C. Peng, J. Wu, Y. Liu, Development
of spinel opaque glazes for ceramic tiles, J Eur Ceram Soc 38(1) (2018) 297-
302.
[13] J. Senvaitienė, Kultūros objektų charakterizavimas ir cheminių
konservavimo procesų įtakos jų degradacijai tyrimas, Vilnius University,
Vilnius, 2006, p. 105.
88
[14] D. Jonynaitė, Kobalto neorganinių pigmentų istorinių analogų tyrimas ir
naujų sintezė zolių-gelių metodu, Vilnius University, Vilnius, 2011, p. 115.
[15] A. Abel, 24 - The history of dyes and pigments: From natural dyes to
high performance pigments A2 - Best, J., Colour Design: Theories and
Applications (Second Edition), Woodhead Publishing 2017, pp. 557-587.
[16] J.R. Barnett, S. Miller, E. Pearce, Colour and art: A brief history of
pigments, Opt Laser Technol 38(4–6) (2006) 445-453.
[17] J. Bagdzevičienė, J. Kruopaitė, Pigmentai ir dažikliai restauruojant
kultūros vertybes, Savastis, Vilnius, 2005.
[18] N. Eastaugh, W. V., Chaplin T., S. R., Pigment Compendium: A
Dictionary and Optical Microscopy of Historical Pigments, Butterworth-
Heinemann, Oxford, 2008.
[19] X. Wang, B. Mu, A. Hui, Q. Wang, A. Wang, Low-cost bismuth yellow
hybrid pigments derived from attapulgite, Dyes Pigm 149 (2018) 521-530.
[20] Q.F. Geng, X. Zhao, X.H. Gao, S.R. Yang, G. Liu, Combustion
Synthesis and Characterization of Spinel NiCr2O4, Chinese J Inorg Chem
28(9) (2012) 1979-1984.
[21] P. Ma, Q. Geng, X. Gao, S. Yang, G. Liu, Solution combustion of
spinel CuMn2O4 ceramic pigments for thickness sensitive spectrally
selective (TSSS) paint coatings, Ceram Int 42(10) (2016) 11966-11973.
[22] H.R. Hedayati, A.A. Sabbagh Alvani, H. Sameie, R. Salimi, S.
Moosakhani, F. Tabatabaee, A. Amiri Zarandi, Synthesis and
characterization of Co1−xZnxCr2−yAlyO4 as a near-infrared reflective color
tunable nano-pigment, Dyes Pigm 113 (2015) 588-595.
[23] W. Liu, T. Du, Q. Ru, S. Zuo, X. Yang, C. Yao, Y. Kong, Facile
synthesis and characterization of 2D kaolin/CoAl2O4: A novel inorganic
pigment with high near-infrared reflectance for thermal insulation, Appl
Clay Sci 153 (2018) 239-245.
[24] L. Yuan, A. Han, M. Ye, X. Chen, C. Ding, L. Yao, Synthesis and
characterization of novel nontoxic BiFe1−xAlxO3/mica-titania pigments with
high NIR reflectance, Ceram Int 43(18) (2017) 16488-16494.
[25] L.K.C. de Souza, J.R. Zamian, G.N. da Rocha Filho, L.E.B. Soledade,
I.M.G. dos Santos, A.G. Souza, T. Scheller, R.S. Angélica, C.E.F. da Costa,
Blue pigments based on CoxZn1−xAl2O4 spinels synthesized by the polymeric
precursor method, Dyes Pigm 81(3) (2009) 187-192.
[26] A. Garcia, M. Llusar, J. Calbo, M.A. Tena, G. Monros, Low-toxicity
red ceramic pigments for porcelainised stoneware from lanthanide-cerianite
solid solutions, Green Chem 3(5) (2001) 238-242.
[27] H. Yuan, J. Zhang, R. Yu, Q. Su, Preparation of ternary rare earth
sulfide LaxCe2–xS3 as red pigment, J Rare Earth 31(3) (2013) 327-330.
89
[28] V.S. Vishnu, M.L. Reddy, Near-infrared reflecting inorganic pigments
based on molybdenum and praseodymium doped yttrium cerate: Synthesis,
characterization and optical properties, Sol Energ Mat Sol C 95(9) (2011)
2685-2692.
[29] O. Opuchovic, G. Kreiza, J. Senvaitiene, K. Kazlauskas, A.
Beganskiene, A. Kareiva, Sol-gel synthesis, characterization and application
of selected sub-microsized lanthanide (Ce, Pr, Nd, Tb) ferrites, Dyes Pigm
118 (2015) 176-182.
[30] R.C. Olegario, E.C.F. de Souza, J.F.M. Borges, J.B.M. da Cunha,
A.V.C. de Andrade, S.R.M. Antunes, A.C. Antunes, Synthesis and
characterization of Fe3+
doped cerium-praseodymium oxide pigments, Dyes
Pigm 97(1) (2013) 113-117.
[31] V. De la Luz, M. Prades, H. Beltran, E. Cordoncillo, Environmental-
friendly yellow pigment based on Tb and M (M = Ca or Ba) co-doped Y2O3,
J Eur Ceram Soc 33(15-16) (2013) 3359-3368.
[32] K.J. Sreeram, R. Srinivasan, J. Meena Devi, B. Unni Nair, T.
Ramasami, Cerium molybdenum oxides for environmentally benign
pigments, Dyes Pigm 75(3) (2007) 687-692.
[33] P. Lunakova, M. Trojan, J. Luxova, J. Trojan, BaSn1-xTbxO3: A new
yellow pigment based on a perovskite structure, Dyes Pigm 96(1) (2013)
264-268.
[34] G. George, The structural and optical studies of titanium doped rare
earth pigments and coloring applications, Dyes Pigm 112 (2015) 81-85.
[35] S. Jose, M.L. Reddy, Lanthanum-strontium copper silicates as intense
blue inorganic pigments with high near-infrared reflectance, Dyes Pigm
98(3) (2013) 540-546.
[36] A. Beganskiene, R. Raudonis, A. Kareiva, Sol-gel preparation and
characterization of novel mixed-metal cobaltates-aluminates, Chemical
Engineering Communications 200(2) (2013) 305-315.
[37] S.W. Kim, Y. Saito, T. Hasegawa, K. Toda, K. Uematsu, M. Sato,
Development of a novel nontoxic vivid violet inorganic pigment - Mn3+
-
doped LaAlGe2O7, Dyes Pigm 136 (2017) 243-247.
[38] P.M. Pimentel, S.V.M. Lima, A.F. Costa, M.S.C. Câmara, J.D.C.
Carregosa, R.M.P.B. Oliveira, Gelatin synthesis and color properties of (La,
Pr, Nd) lanthanide aluminates, Ceram Int 43(8) (2017) 6592-6596.
[39] G. George, L.S. Kumari, V.S. Vishnu, S. Ananthakumar, M.L.P. Reddy,
Synthesis and characterization of environmentally benign calcium-doped
Pr2MO2O9 pigments: Applications in coloring of plastics, J Solid State Chem
181(3) (2008) 487-492.
90
[40] P.P. Rao, M.L.P. Reddy, (TiO2)(1)(CeO2)(1-x)(RE2O3)(x) - novel
environmental secure pigments, Dyes Pigm 73(3) (2007) 292-297.
[41] G. Daly, Developing Glazes, The American Ceramic Society, Ohio,
2013.
[42] N. Liu, Y. Yang, Y. Wang, W. Hu, X. Jiang, M. Ren, M. Yang, C.
Wang, Nondestructive characterization of ancient faience beads unearthed
from Ya’er cemetery in Xinjiang, Early Iron Age China, Ceram Int 43(13)
(2017) 10460-10467.
[43] Z. Bahrani, Mesopotamia: Ancient Art and Architecture, Thames &
Hudson, London, 2017.
[44] P. Shi, F. Wang, J. Zhu, B. Zhang, T. Zhao, Y. Wang, Y. Qin, Study on
the Five dynasty sky-green glaze from Yaozhou kiln and its coloring
mechanism, Ceram Int 43(3) (2017) 2943-2949.
[45] J.-Y. Kim, H. No, A.Y. Jeon, U. Kim, J.-H. Pee, W.-S. Cho, K.J. Kim,
C.M. Kim, C.S. Kim, Mössbauer spectroscopic and chromaticity analysis on
colorative mechanism of celadon glaze, Ceram Int 37(8) (2011) 3389-3395.
[46] A. Aguilar-Elguézabal, M. Román-Aguirre, L. De la Torre-Sáenz, P.
Pizá-Ruiz, M. Bocanegra-Bernal, Synthesis of CoAl2O4/Al2O3 nanoparticles
for ceramic blue pigments, Ceram Int 43(17) (2017) 15254-15257.
[47] Z. Pan, Y. Wang, H. Huang, Z. Ling, Y. Dai, S. Ke, Recent
development on preparation of ceramic inks in ink-jet printing, Ceram Int
41(10, Part A) (2015) 12515-12528.
[48] J. Wu, K. Li, X. Xu, J. Yu, X. Li, J. Tian, In situ synthesis of spherical
CdS1-xSex red pigment used for ceramic ink-jet printing, Mater Chem Phys
203 (2018) 193-201.
[49] M. Jovaní, M. Domingo, T.R. Machado, E. Longo, H. Beltrán-Mir, E.
Cordoncillo, Pigments based on Cr and Sb doped TiO2 prepared by
microemulsion-mediated solvothermal synthesis for inkjet printing on
ceramics, Dyes Pigm 116 (2015) 106-113.
[50] P.M.T. Cavalcante, M. Dondi, G. Guarini, M. Raimondo, G. Baldi,
Colour performance of ceramic nano-pigments, Dyes Pigm 80(2) (2009)
226-232.
[51] M. Jovaní, M. Fortuño-Morte, H. Beltrán-Mir, E. Cordoncillo,
Environmental-friendly red-orange ceramic pigment based on Pr and Fe co-
doped Y2Zr2O7, J Eur Ceram Soc 38(4) (2018) 2210-2217.
[52] M. Jovaní, A. Sanz, H. Beltrán-Mir, E. Cordoncillo, New red-shade
environmental-friendly multifunctional pigment based on Tb and Fe doped
Y2Zr2O7 for ceramic applications and cool roof coatings, Dyes Pigm 133
(2016) 33-40.
91
[53] O. Opuchovic, G. Kreiza, J. Senvaitiene, K. Kazlauskas, A.
Beganskiene, A. Kareiva, Sol-gel synthesis, characterization and application
of selected sub-microsized lanthanide (Ce, Pr, Nd, Tb) ferrites, Dyes Pigm
118 (2015) 176-182.
[54] G. Tian, W. Wang, D. Wang, Q. Wang, A. Wang, Novel environment
friendly inorganic red pigments based on attapulgite, Powder Technology
315 (2017) 60-67.
[55] E. Tóth, T.G. Weiszburg, T. Jeffries, C.T. Williams, A. Bartha, É.
Bertalan, I. Cora, Submicroscopic accessory minerals overprinting clay
mineral REE patterns (celadonite–glauconite group examples), Chemical
Geology 269(3) (2010) 312-328.
[56] L.M. Moretto, E.F. Orsega, G.A. Mazzocchin, Spectroscopic methods
for the analysis of celadonite and glauconite in Roman green wall paintings,
J Cult Herit 12(4) (2011) 384-391.
[57] G.D. Hatton, A.J. Shortland, M.S. Tite, The production technology of
Egyptian blue and green frits from second millennium BC Egypt and
Mesopotamia, Journal of Archaeological Science 35(6) (2008) 1591-1604.
[58] P. Colomban, The Destructive/Non-Destructive Identification of
Enameled Pottery, Glass Artifacts and Associated Pigments—A Brief
Overview, Arts 2(3) (2013) 77.
[59] L. Verger, O. Dargaud, M. Chassé, N. Trcera, G. Rousse, L. Cormier,
Synthesis, properties and uses of chromium-based pigments from the
Manufacture de Sèvres, J Cult Herit 30 (2018) 26-33.
[60] D. Esteves, W. Hajjaji, M.P. Seabra, J.A. Labrincha, Use of industrial
wastes in the formulation of olivine green pigments, J Eur Ceram Soc 30(15)
(2010) 3079-3085.
[61] T. Dimitrov, S. Kozhukharov, N. Velinov, Synthesis of pigments of
Fe2O3·SiO2 system, with Ca, Mg, or Co oxide additions, Bol Soc Esp Ceram
V 56(2) (2017) 55-63.
[62] F. Andreola, L. Barbieri, F. Bondioli, M. Cannio, A.M. Ferrari, I.
Lancellotti, Synthesis of chromium containing pigments from chromium
galvanic sludges, Journal of Hazardous Materials 156(1) (2008) 466-471.
[63] H. Onoda, K. Sugimoto, Synthesis of novel green phosphate pigments
in imitation of natural ores, Journal of Asian Ceramic Societies 5(2) (2017)
123-126.
[64] S. Jose, A. Prakash, S. Laha, S. Natarajan, M.L. Reddy, Green colored
nano-pigments derived from Y2BaCuO5: NIR reflective coatings, Dyes Pigm
107 (2014) 118-126.
92
[65] T. Masui, N. Takeuchi, H. Nakado, N. Imanaka, Novel environment-
friendly green pigments based on rare earth cuprate, Dyes Pigm 113 (2015)
336-340.
[66] W. Hajjaji, C. Zanelli, M.P. Seabra, M. Dondi, J.A. Labrincha, Cr-
doped titanite pigment based on industrial rejects, Chemical Engineering
Journal 158(2) (2010) 167-172.
[67] J. Gilabert, M.P. Gómez-Tena, V. Sanz, S. Mestre, Effect of secondary
thermal treatment on crystallinity of spinel-type Co(Cr,Al)2O4 pigments
synthesized by solution combustion route, J Non-Cryst Solids (2018).
[68] M. Llusar, T. Bermejo, J.E. Primo, C. Gargori, V. Esteve, G. Monrós,
Karrooite green pigments doped with Co and Zn: Synthesis, color properties
and stability in ceramic glazes, Ceram Int 43(12) (2017) 9133-9144.
[69] J. Zou, W. Zheng, TiO2@CoTiO3 complex green pigments with low
cobalt content and tunable color properties, Ceram Int 42(7) (2016) 8198-
8205.
[70] K.E. Sickafus, J.M. Wills, N.W. Grimes, Structure of spinel, J Am
Ceram Soc 82(12) (1999) 3279-3292.
[71] D.H. Taffa, R. Dillert, A.C. Ulpe, K.C.L. Bauerfeind, T. Bredow, D.W.
Bahnemann, M. Wark, Photoelectrochemical and theoretical investigations
of spinel type ferrites (MxFe3−xO4) for water splitting: a mini-review, SPIE,
2016, p. 25.
[72] Z.W. Wang, P. Lazor, S.K. Saxena, G. Artioli, High-pressure Raman
spectroscopic study of spinel (ZnCr2O4), J Solid State Chem 165(1) (2002)
165-170.
[73] C. Rath, P. Mohanty, A. Banerjee, Magnetic properties of nanoparticles
of cobalt chromite, J Magn Magn Mater 323(12) (2011) 1698-1702.
[74] S.S. Acharyya, S. Ghosh, S. Adak, D. Tripathi, R. Bal, Fabrication of
CuCr2O4 spinel nanoparticles: A potential catalyst for the selective oxidation
of cycloalkanes via activation of Csp3-H bond, Catal Commun 59 (2015)
145-150.
[75] A.E. Giannakas, A.K. Ladavos, G.S. Armatas, P.J. Pomonis, Surface
properties, textural features and catalytic performance for NO plus CO
abatement of spinels MAl2O4 (M = Mg, Co and Zn) developed by reverse
and bicontinuous microemulsion method, Appl Surf Sci 253(16) (2007)
6969-6979.
[76] S.A. Hosseini, A. Niaei, D. Salari, M.C. Alvarez-Galvan, J.L.G. Fierro,
Study of correlation between activity and structural properties of Cu-(Cr, Mn
and Co)2 nano mixed oxides in VOC combustion, Ceram Int 40(4) (2014)
6157-6163.
93
[77] S.S. Manoharan, K.C. Patil, Combustion Synthesis of Metal Chromite
Powders, J Am Ceram Soc 75(4) (1992) 1012-1015.
[78] S.K. Durrani, S.Z. Hussain, K. Saeed, Y. Khan, M. Arif, N. Ahmed,
Hydrothermal synthesis and characterization of nanosized transition metal
chromite spinels, Turk J Chem 36(1) (2012) 111-120.
[79] G. Marquez, V. Sagredo, C. Marquina, T.E. Torres, M.R. Ibarra, G.F.
Goya, Magnetic Properties of CoFe0.5Cr1.5O4 Nanoparticles, Rev Mex Fis
58(2) (2012) 138-141.
[80] S.A. Eliziário, J.M. de Andrade, S.J.G. Lima, C.A. Paskocimas, L.E.B.
Soledade, P. Hammer, E. Longo, A.G. Souza, I.M.G. Santos, Black and
green pigments based on chromium–cobalt spinels, Mater Chem Phys
129(1–2) (2011) 619-624.
[81] Z. Congmian, Z. XiaoZhe, W. Wengang, G. Wenzhe, P. Ankit, X.
Xiaoshan, S. Jian, M. Li, H. Denglu, Nanostructural origin of
semiconductivity and large magnetoresistance in epitaxial NiCo2O4/Al2O3
thin films, Journal of Physics D: Applied Physics 51(14) (2018) 145308.
[82] Q.F. Geng, X. Zhao, X.H. Gao, S.R. Yang, G. Liu, Low-temperature
combustion synthesis of CuCr2O4 spinel powder for spectrally selective
paints, J Sol-Gel Sci Techn 61(1) (2012) 281-288.
[83] H.-g. Zhang, W.-h. Wang, E.-k. Liu, X.-d. Tang, G.-j. Li, H.-w. Zhang,
G.-h. Wu, Compensation effect and magnetostriction in CoCr2−xFexO4, Phys
Status Solidi B 250(7) (2013) 1287-1292.
[84] M. Ptak, M. Maczka, A. Gagor, A. Pikul, L. Macalik, J. Hanuza,
Temperature-dependent XRD, IR, magnetic, SEM and TEM studies of Jahn-
Teller distorted NiCr2O4 powders, J Solid State Chem 201 (2013) 270-279.
[85] D. Zakutna, A. Repko, I. Matulkova, D. Niznansky, A. Ardu, C.
Cannas, A. Mantlikova, J. Vejpravova, Hydrothermal synthesis,
characterization, and magnetic properties of cobalt chromite nanoparticles, J
Nanopart Res 16(2) (2014) 2251.
[86] S. Li, G. Zhao, H. Bi, Z. Huang, H. Lai, R. Gai, Y. Du, Synthesis and
anomalous magnetic properties of CoCr2O4 nanocrystallites with lattice
distortion, J Magn Magn Mater 305(2) (2006) 448-451.
[87] E. Mohammad, K. Ahmad Reza, Synthesis of Cobalt Chromite
Nanoparticles by Thermolysis of Mixed Cr3+
and Co2+
Chelates of 2-
Mercaptopyridin N-Oxide, Nano-Micro Lett 4(2) (2012) 083-089.
[88] Z.Q. Zhu, X.D. Cheng, W.P. Ye, J. Min, Synthesis of NiCr2O4 spinel
coatings with high emissivity by plasma spraying, Int J Min Met Mater 19(3)
(2012) 266-270.
[89] D. Gingasu, I. Mindru, L. Patron, D.C. Culita, J.M. Calderon-Moreno,
L. Diamandescu, M. Feder, O. Oprea, Precursor method—A
94
nonconventional route for the synthesis of ZnCr2O4 spinel, J Phys Chem
Solids 74(9) (2013) 1295-1302.
[90] D.P. Dutta, J. Manjanna, A.K. Tyagi, Magnetic properties of
sonochemically synthesized CoCr2O4 nanoparticles, J Appl Phys 106(4)
(2009).
[91] W.Z. Lv, Q. Qiu, F. Wang, S.H. Wei, B. Liu, Z.K. Luo, Sonochemical
synthesis of cobalt aluminate nanoparticles under various preparation
parameters, Ultrason Sonochem 17(5) (2010) 793-801.
[92] W.P. Huang, H. Li, B.L. Zhu, Y.F. Feng, S.R. Wang, S.M. Zhang,
Selective hydrogenation of furfural to furfuryl alcohol over catalysts
prepared via sonochemistry, Ultrason Sonochem 14(1) (2007) 67-74.
[93] N. Dupont, A. Kaddouri, P. Gelin, Physicochemical and catalytic
properties of sol gel-prepared copper-chromium oxides, J Sol-Gel Sci Techn
58(1) (2011) 302-306.
[94] D. Jasaitis, D. Beganskiene, J. Senvaitiene, A. Kareiva, R.
Ramanauskas, R. Juskenas, A. Selskis, Sol-gel synthesis and characterization
of cobalt chromium spinel CoCr2O4, Chemija 22(2) (2011) 125-130.
[95] J. Barman, S. Ravi, Study of exchange bias behavior in Ni(Cr1-
xFex)(2)O4, Solid State Commun 201 (2015) 59-63.
[96] H.T. Cui, M. Zayat, D. Levy, Sol-gel synthesis of nanoscaled spinels
using propylene oxide as a gelation agent, J Sol-Gel Sci Techn 35(3) (2005)
175-181.
[97] M. Kakihana, Invited review: “Sol-gel” preparation of high temperature
superconducting oxides, J Sol-Gel Sci Techn 6(1) (1996) 7–55.
[98] M. Zayat, D. Levy, Blue CoAl2O4 Particles Prepared by the Sol−Gel
and Citrate−Gel Methods, Chem Mater 12(9) (2000) 2763-2769.
[99] T. Coradin, J. Livage, Sol–Gel Synthesis of Solids, Encyclopedia of
Inorganic and Bioinorganic Chemistry, John Wiley & Sons2006.
[100] R. Gupta, K. Kumar, Bioactive materials for biomedical applications
using sol–gel technology, Biomed Mater 3(3) (2008) 034005.
[101] C.J. Brinker, G.W. Scherer, Sol-Gel Science: The Physics and
Chemistry of Sol-Gel Processing, Academic Press, Inc., San Diego, 1990.
[102] L.L. Hench, J.K. West, The sol-gel process, Chemical Reviews 90(1)
(1990) 33-72.
[103] S. Asgharzadehahmadi, A.A. Abdul Raman, R. Parthasarathy, B.
Sajjadi, Sonochemical reactors: Review on features, advantages and
limitations, Renewable and Sustainable Energy Reviews 63 (2016) 302-314.
[104] K.S. Suslick, T. Hyeon, M. Fang, A.A. Cichowlas, Sonochemical
synthesis of nanostructured catalysts, Mater Sci Eng A 204(1) (1995) 186-
192.
95
[105] F. Shahangi Shirazi, K. Akhbari, Sonochemical procedures; the main
synthetic method for synthesis of coinage metal ion supramolecular polymer
nano structures, Ultrason Sonochem 31 (2016) 51-61.
[106] D. Jonynaite, J. Senvaitiene, J. Kiuberis, A. Kareiva, R. Juskenas, R.
Ramanauskas, XRD characterization of cobalt-based historical pigments and
glazes, Chemija 20(1) (2009) 10-18.
[107] G.A. Mazzocchin, D. Rudello, C. Bragato, F. Agnoli, A short note on
Egyptian blue, J Cult Herit 5(1) (2004) 129-133.
[108] A. Rafalska-Lasocha, Z. Kaszowska, W. Lasocha, R. Dziembaj, X-ray
powder diffraction investigation of green earth pigments, Powder Diffr 25(1)
(2010) 38-45.
[109] D. Hradil, T. Grygar, M. Hruskova, P. Bezdicka, K. Lang, O.
Schneeweiss, M. Chvatal, Green earth pigment from the Kadan region,
Czech Republic: Use of rare Fe-RICH smectite, Clay Clay Miner 52(6)
(2004) 767-778.
[110] M. Inês Teixeira, L.V.E. Caldas, Dosimetric characteristics of jasper
samples for high dose dosimetry, Appl Radiat Isotopes 70(7) (2012) 1417-
1419.
[111] R.L. Frost, D.L. Wain, W.N. Martens, B.J. Reddy, Vibrational
spectroscopy of selected minerals of the rosasite group, Spectrochim Acta A
66(4–5) (2007) 1068-1074.
[112] D. Buti, F. Rosi, B.G. Brunetti, C. Miliani, In-situ identification of
copper-based green pigments on paintings and manuscripts by reflection
FTIR, Anal Bioanal Chem 405(8) (2013) 2699-711.
[113] B. Nandapure, S. Kondawar, M. Salunkhe, A. Nandapure,
Nanostructure cobalt oxide reinforced conductive and magnetic polyaniline
nanocomposites, J Compos Mater 47(5) (2013) 559-567.
[114] V. Stubican, R. Roy, Isomorphous substitution and infra-red spectra of
the layer lattice silicates, Am Mineral 46(1-2) (1961) 32-51.
[115] P.J. Wojtowicz, Theoretical Model for Tetragonal-to-Cubic Phase
Transformations in Transition Metal Spinels, Physical Review 116(1) (1959)
32-45.
[116] B.D. Hosterman, Raman Spectroscopic Study of Solid Solution Spinel
Oxides, Physics and Astronomy, University of Nevada, Las Vegas, 2011, p.
155.
[117] S.A. Hosseini, M.C. Alvarez-Galvan, J.L.G. Fierro, A. Niaei, D.
Salari, MCr2O4 (M = Co, Cu, and Zn) nanospinels for 2-propanol
combustion: Correlation of structural properties with catalytic performance
and stability, Ceram Int 39(8) (2013) 9253-9261.
96
[118] N. N. Greenwood, A. Earnshaw, Chemistry of the Elements, 2nd ed.,
Butterworth-Heinemann, Oxford, 1997.
[119] G. Blasse, B.C. Grabmaier, Luminescent Materials, Springer-Verlag,
Berlin, 1994.
[120] S. Naz, S.K. Durrani, M. Mehmood, M. Nadeem, Hydrothermal
synthesis, structural and impedance studies of nanocrystalline zinc chromite
spinel oxide material, J Saudi Chem Soc.
[121] S. Surviliene, V. Jasulaitiene, A. Cesuniene, A. Lisowska-Oleksiak,
The use of XPS for study of the surface layers of Cr-Co alloy
electrodeposited from Cr(III) formate-urea baths, Solid State Ionics 179(1-6)
(2008) 222-227.
[122] L. Lukashuk, K. Fottinger, E. Kolar, C. Rameshan, D. Teschner, M.
Havecker, A. Knop-Gericke, N. Yigit, H. Li, E. McDermott, M. Stoger-
Pollach, G. Rupprechter, Operando XAS and NAP-XPS studies of
preferential CO oxidation on Co3O4 and CeO2-Co3O4 catalysts, J Catal 344
(2016) 1-15.

97
UŽRAŠAMS

98
Vilnius University Press
Universiteto st. 1, LT-01513 Vilnius
E-mail [email protected],
www.leidykla.vu.lt
Printed 20 copies