
Innovative Use of Data Mining/Warehousing for Employee Activation
29
1 Innovative Use of Data Mining/ Warehousing for Employee Activation Business Health Agenda March 13, 2009 Lisa R Schmidt, CEBS System Director, Health, Welfare and Wellness Benefits
-
Upload
lisaschmidt -
Category
Business
-
view
453 -
download
2
Transcript of Innovative Use of Data Mining/Warehousing for Employee Activation

1
Innovative Use of Data Mining/Warehousing for Employee Activation
Business Health AgendaMarch 13, 2009
Lisa R Schmidt, CEBS
System Director, Health, Welfare and Wellness Benefits

2
Reflection

3
Our Belief
• It’s possible to stabilize health care spending
• Appropriate use of tactics drives best performance
• Many best-performing companies have adopted CDHPs, but for us this is just one component of a larger consumer-oriented model
• Increasing CDHP enrollment is key to moderating cost trends

4
Providence’s story
• 48,000 employees, 68,000 covered lives
• Health care organization
• Multiple TPA’s, plan designs, self and fully insured plans
• Organization-wide medical trend exceeding 12% (2007)
• Spend projection in 2008 $340 million; 91% employer paid
5
Providence’s story
• Wanted to understand our employee cost data
• Looked for a transparent, unbiased, integrated solution
• Actionable results based on data
• Ability to analyze and report out results in a financially sound fashion
• Wanted our own tool – chose Thomson Reuters NetEffect

6
Providence’s case for wellness
• Wellness and health promotion is really about people
• Wellness/health promotion is about cost management
• You can learn about people through data
• By understanding your data, you can understand people
• Once you understand people, you can build a story

7
For Every 100 Employees• 20% of healthcare expenditures are attributable to
preventable illness• 40% of healthcare expenditures are attributable to
modifiable risk• 11,500 hours of productivity per year are lost due to health
conditions
• 60 are sedentary• 25 smoke• 10 have diabetes• 50 have high cholesterol
• 24 have high blood pressure• 50 are distressed or depressed• 27 have active cardio disease
* Source: National Health Center for Health Promotion and Disease Prevention

8
Selling wellness as an employee strategy
• Human resources and employees don’t speak the same language
• What really matters to your employees?
You must know your employees data in order to tell a story to inspire people to change

9
Cost shifting, or total populationhealth management?
• Providence is striving to become a BEST PRACTICE employer
• We are stabilizing and reversing medical trend
• Choice of population health management over cost shifting-we chose PHM

10
• Make actionable decisions based on factual data– Remove guesswork and assumptions
• Build financial support for strategy
• Drive employee change behaviors through data
New Organizational Philosophy
Our Approach-Thomson Reuters
NetEffect

11
What we learned
• There are many positive actions that Providence could take to reduce the need for and/or cost of care
– Primary prevention – Health decision support– Early detection of disease – Case management– Lifestyle behavior change – Improve outcomes of care– Disease management – Promote guideline
compliance– Use data to target opportunities and prove impact of
programs

12
What we learned• Our benefit trend is catastrophically unsustainable
– Revenue 4%– Costs 12%++
• Our cost sharing models are not effective
• Our costs are being driven by conditions that should be diagnosed early and treated
• Our employees are suffering from lifestyle related conditions
• We are getting older, and not better

13

1414
Cost of Obesity (in millions)Providence employee benefit plans-2007 paid claims
$275.0
$31.1
$0.0
$50.0
$100.0
$150.0
$200.0
$250.0
$300.0
2007 Total PaidClaims
Claims Paid Relatedto Obesity*
*$370 per member per year cost for conditions related to being obese
15
$30
$40
$50
2008 2011
1% Trend 6% Trend 11% Trend
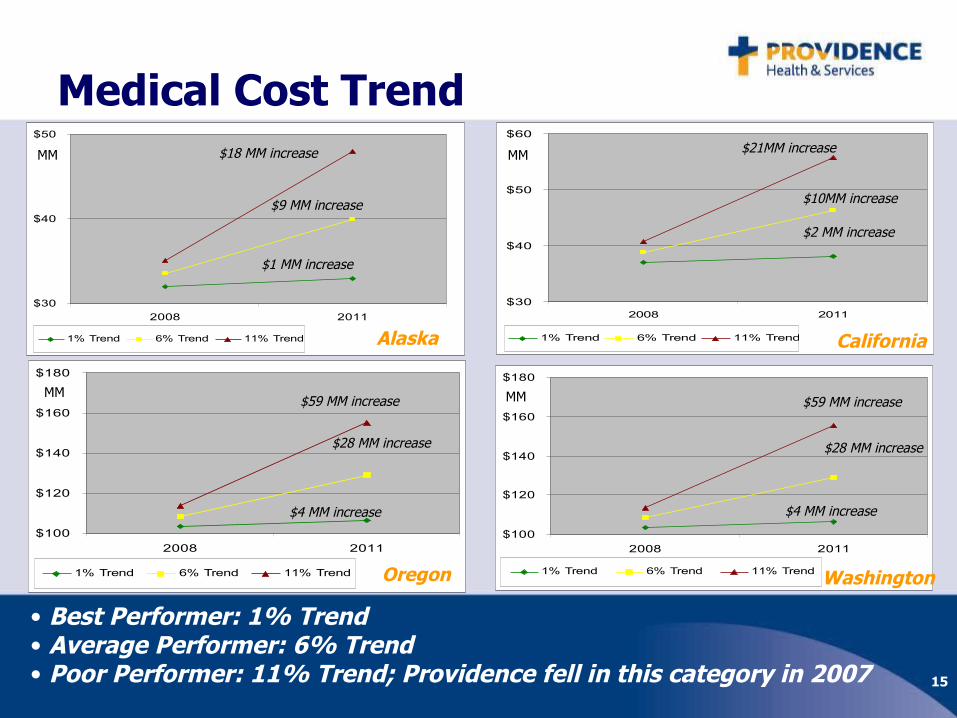
Medical Cost Trend
$30
$40
$50
$60
2008 2011
1% Trend 6% Trend 11% Trend
$100
$120
$140
$160
$180
2008 2011
1% Trend 6% Trend 11% Trend
$100
$120
$140
$160
$180
2008 2011
1% Trend 6% Trend 11% Trend
Alaska
• Best Performer: 1% Trend• Average Performer: 6% Trend• Poor Performer: 11% Trend; Providence fell in this category in 2007
MM $18 MM increase
$1 MM increase
Oregon
MM$59 MM increase
$4 MM increase
California
$21MM increase
Washington
MM
MM $59 MM increase
$4 MM increase
$2 MM increase
$9 MM increase $10MM increase
$28 MM increase $28 MM increase

16
Chronic Conditions
• 15.2% of Providence’s members suffer from a chronic condition• 4.8% of Providence’s claims costs are due to chronic conditions
CAD: Coronary Artery Disease; CHF: Chronic Heart FailureSelf-insured data only – Thomson Risk Profiler paid claims 6/06 – 5/07
Members Diagnosed with Chronic Conditions
0%
5%
10%
15%
20%
25%
Asthma COPD CAD & CHF Hypertension Diabetes All ChronicConditions
AK Members CA Members OR Members WA Members System-w ide Members

17
Lifestyle Related Conditions
• 28% of Providence’s members endure claims related to lifestyle conditions• 20.1% of Providence’s claims costs are due to lifestyle conditions
Self-insured data only – Thomson Risk Profiler paid claims 6/06 – 5/07
Condition Analysis
0%
5%
10%
15%
20%
25%
30%
35%
Obesity Lack of PhysicalActivity
Tobacco Use Alcohol Abuse Poor NutritionPractice
NoncontrolledLipids
NoncontrolledHypertension
Stress / Anxiety /Depression
Total LifestyleRelated Condition
AK Members CA Members OR Members WA Members System-wide Members

18
Segment the Population: 2007
ChronicDisease
AcuteConditions
ModerateRisk
LowRisk
CatastrophicIllness
HighRisk
LowRisk
• 58.0% (62.1%) of the population has medical claims under $1,500
• 8.4% (9.7%) of medical expenses are in this group
• 33.9% (31.4%) of the population has medical claims of $1,500 to $9,999
• 35.6% (36.6%) of medical expenses are in this group
• 7.4% (5.9%) of population has claims of $10,000-$49,999
• 37.3% (33.4%) expenses are in this group
Maintain Health Manage HealthImprove Health
Percentages in orange
represent Watson Wyatt’s
NDC norms
Source: Providence medical claims data incurred August 1, 2006, through July 31, 2007, and paid through September 30, 2007
Risk Reduction/ Self-Care
Disease and Case Management
Prevention/Early Detection/ Self-Care
• 0.7% (0.6%) of population has claims of $50,000+
• 18.7% (20.3%) expenses are in this group
Illness BurdenAllowed PMPY
0.57$534
1.45$3,875
3.09$18,564
8.85$93,191

19
Your Health Rewards Program•Biometric Health Screening
•StayWell® Health Assessment
•StayWell® NextSteps® Health Coaching
•Incentive
•Free & Clear Quit for Life Tobacco Cessation
•Nurse Advice Line and Medically Reviewed Information

20

21
22
Plan redesign 2009
• CDHP plan design commitment– goal: 100% HA participation for employees and spouses
• Cost sharing offset by HA participation
• HSA introduced as retirement supplement vehicle

23
Introducing ProvSelect HSA
24
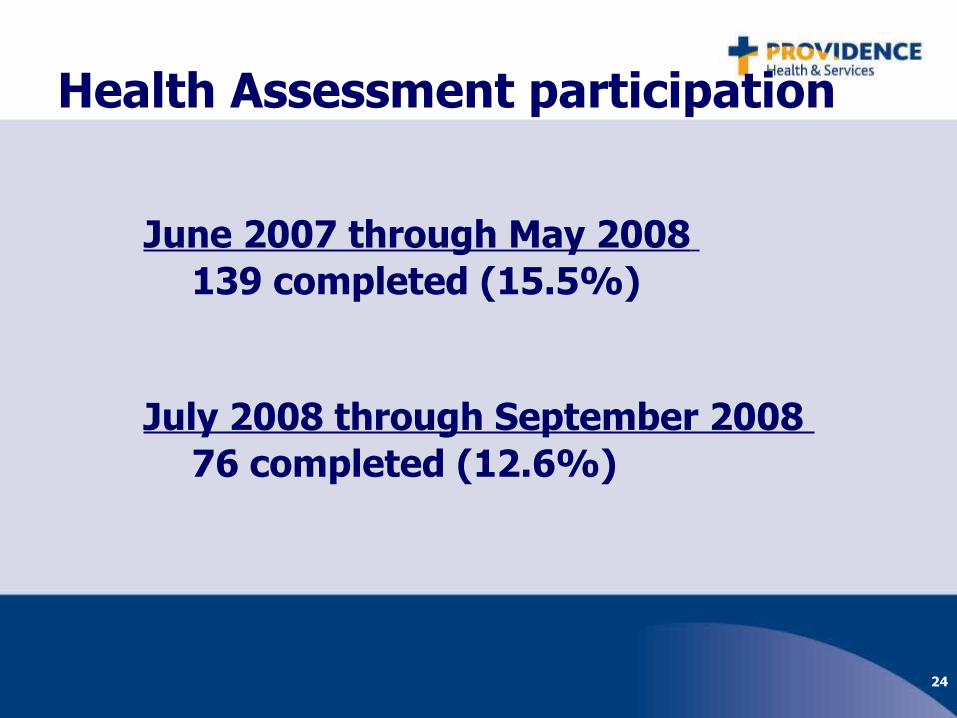
Health Assessment participation
June 2007 through May 2008 139 completed (15.5%)
July 2008 through September 2008 76 completed (12.6%)

25
Health Assessment participation
July 2008 – January 2009
615 completed (93%) 188 spouses (57%)
26
Results of Work to date
• Trend results encouraging
• More accurate data revises trend
• Most progress in regions with highest employee populations
• Best performer has most integrated delivery system

27
What’s next
• Address cost sharing and access issues that encourage employees to use more health care services

28
Other possibilities
• Illness Burden Management
Short term strategies
Longer term strategies

29
Questions??