Innovative recognition-sorting procedures applied …€¦ · Examples of application of...
10
Innovative recognition-sorting procedures applied to solid waste: the hyperspectral approach G. Bonifazi 1 , S. Serranti 1 , A. Bonoli 2 & A. Dall’Ara 3 1 Department of Chemical, Materials and Environmental Engineering, Sapienza Università di Roma, Italy 2 Dipartimento di Ingegneria Chimica Mineraria e delle Tecnologie Ambientali, Università di Bologna, Italy 3 ENEA Faenza (RA), Italy Abstract Waste materials characterization and recognition can be obtained through their surface spectral response. Such a goal can be reached adopting specialized devices that are able to develop acquisition strategies based on the collection of hyperspectral images. The analyses of the detected spectra can give useful information concerning the investigated material surface properties, status and physical-chemical attributes. This last aspect can be utilized to define and implement on-line procedures aimed to recognize different particulate solid waste as they result after specific processing/selection actions. The present study addressed the application of hyperspectral imaging approach for compost products characterization, in order to develop control strategies to be implemented at the plant scale. Reflectance spectra of selected compost samples have been acquired in the visible-near infrared field (VIS-NIR): 400-1000 nm. Correlations have been established between the physical-chemical characteristics of the different compost products and their detected reflectance spectral signature. Keywords: hyperspectral imaging, solid waste recycling, compost, sorting. 1 Introduction Hyperspectral imaging, traditionally used for earth remote sensing applications, has become accessible as a powerful inspection tool for non-destructive analysis www.witpress.com, ISSN 1743-3541 (on-line) © 2009 WIT Press WIT Transactions on Ecology and the Environment, Vol 120, Sustainable Development and Planning IV, Vol. 2 885 doi:10.2495/SDP090832
Transcript of Innovative recognition-sorting procedures applied …€¦ · Examples of application of...
Innovative recognition-sorting procedures applied to solid waste: the hyperspectral approach
G. Bonifazi1, S. Serranti1, A. Bonoli2 & A. Dall’Ara3 1Department of Chemical, Materials and Environmental Engineering, Sapienza Università di Roma, Italy 2Dipartimento di Ingegneria Chimica Mineraria e delle Tecnologie Ambientali, Università di Bologna, Italy 3ENEA Faenza (RA), Italy
Abstract
Waste materials characterization and recognition can be obtained through their surface spectral response. Such a goal can be reached adopting specialized devices that are able to develop acquisition strategies based on the collection of hyperspectral images. The analyses of the detected spectra can give useful information concerning the investigated material surface properties, status and physical-chemical attributes. This last aspect can be utilized to define and implement on-line procedures aimed to recognize different particulate solid waste as they result after specific processing/selection actions. The present study addressed the application of hyperspectral imaging approach for compost products characterization, in order to develop control strategies to be implemented at the plant scale. Reflectance spectra of selected compost samples have been acquired in the visible-near infrared field (VIS-NIR): 400-1000 nm. Correlations have been established between the physical-chemical characteristics of the different compost products and their detected reflectance spectral signature. Keywords: hyperspectral imaging, solid waste recycling, compost, sorting.
1 Introduction
Hyperspectral imaging, traditionally used for earth remote sensing applications, has become accessible as a powerful inspection tool for non-destructive analysis
www.witpress.com, ISSN 1743-3541 (on-line)
© 2009 WIT PressWIT Transactions on Ecology and the Environment, Vol 120,
Sustainable Development and Planning IV, Vol. 2 885
doi:10.2495/SDP090832
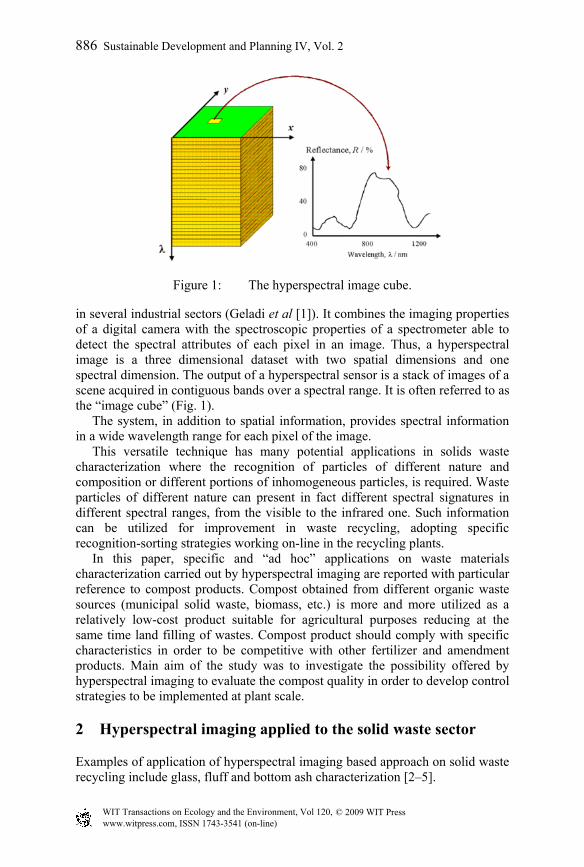
Figure 1: The hyperspectral image cube.
in several industrial sectors (Geladi et al [1]). It combines the imaging properties of a digital camera with the spectroscopic properties of a spectrometer able to detect the spectral attributes of each pixel in an image. Thus, a hyperspectral image is a three dimensional dataset with two spatial dimensions and one spectral dimension. The output of a hyperspectral sensor is a stack of images of a scene acquired in contiguous bands over a spectral range. It is often referred to as the “image cube” (Fig. 1). The system, in addition to spatial information, provides spectral information in a wide wavelength range for each pixel of the image. This versatile technique has many potential applications in solids waste characterization where the recognition of particles of different nature and composition or different portions of inhomogeneous particles, is required. Waste particles of different nature can present in fact different spectral signatures in different spectral ranges, from the visible to the infrared one. Such information can be utilized for improvement in waste recycling, adopting specific recognition-sorting strategies working on-line in the recycling plants. In this paper, specific and “ad hoc” applications on waste materials characterization carried out by hyperspectral imaging are reported with particular reference to compost products. Compost obtained from different organic waste sources (municipal solid waste, biomass, etc.) is more and more utilized as a relatively low-cost product suitable for agricultural purposes reducing at the same time land filling of wastes. Compost product should comply with specific characteristics in order to be competitive with other fertilizer and amendment products. Main aim of the study was to investigate the possibility offered by hyperspectral imaging to evaluate the compost quality in order to develop control strategies to be implemented at plant scale.
2 Hyperspectral imaging applied to the solid waste sector
Examples of application of hyperspectral imaging based approach on solid waste recycling include glass, fluff and bottom ash characterization [2–5].
www.witpress.com, ISSN 1743-3541 (on-line)
© 2009 WIT PressWIT Transactions on Ecology and the Environment, Vol 120,
886 Sustainable Development and Planning IV, Vol. 2
With reference to the glass recycling sector, previous studies carried out on cullet, that is glass fragments characterized by different colour, polluted by various materials, as metal, stones, plastics and ceramic glass [2], demonstrated as through an accurate selection of the right parameter representing the spectral signature, it is possible to recognize the different sample categories: glass and polluting elements. More specifically, the hyperspectral detection strategies result particularly efficient in the detection of ceramic glass fragments, the most harmful for the recycling process and also the most difficult to identify. To define an efficient sorting strategy, the parameters related to specific wavelength ratios seem to best meet the objective for the intrinsic processing speed of the procedure. In particular, the use of a proper selected wavelength ratio could allow the system to recognize most of ceramic glass and glass samples in a fast way, simplifying the sorting architecture, thereby reducing equipment costs and allowing high production rates. Moreover, studies carried out on fluff, that is the light fraction resulting from car dismantling [3, 4], demonstrated the possibility to perform a correct identification of plastics and metals adopting an easy and fast selection strategy, based on the ratio of couples of selected wavelengths. The implementation of the proposed approach for the design and development of an on-line control/sorting system, based on hyperspectral imaging, allowed to reach two important goals: i) the recognition and the further sorting of polluting elements as metals and alloys in fluff, usually difficult to detect in the finer fractions, providing a contaminant-free material to be used in co-combustion process, reducing the costs related to their actual disposal in dumps and environmental pollution and increasing energy production and ii) the control of the separation efficiency of specific processing stages in the industrial recycling plant. In bottom ash characterization, i.e. the ash residues resulting from the combustion of municipal solid waste, the hyperspectral approach allows to perform a full detection of the polluting organic fractions inside the products object of separation-classification procedures allowing this way the possibility to control the quality of the resulting products in terms of reduced environmental impact when utilized as inert material [5].
3 Use of compost product
Compost can be used as a soil amendment in different market segments, including agriculture, landscaping, gardening, nurseries, top dressing, land reclamation and erosion control [6]. The potential use of compost in the listed markets is dependent on the characteristics of the compost, the limitations applicable to its use and pertinent laws and regulations. The quality of compost product is the most critical factor affecting its potential use. The quality depends on compost chemical, biological and physical characteristics, that are mainly determined by i) the source material utilized in the compost production and ii) the process used to remove contaminants. Important physical characteristics affecting the quality of compost product are colour, uniform particle size, earthy odour, absence of contaminants such as
www.witpress.com, ISSN 1743-3541 (on-line)
© 2009 WIT PressWIT Transactions on Ecology and the Environment, Vol 120,
Sustainable Development and Planning IV, Vol. 2 887
rocks, glass fragments, pieces of metal and plastics, adequate moisture, concentration of nutrients and amount of organic matter. Limitations on use of compost products are related to the potential effects on i) human and animal health and safety, ii) crop production and iii) quality of air, water and land resources, due to the presence of harmful substances such as toxic compounds, pathogens, etc. With reference to European legislation on compost products [7], different threshold values for undesirable materials (glass, plastic and metals < 0.5% dry matter) and for inert (soil and stones >5 x 10⁻³< 5% dry matter) are adopted.
4 Hyperspectral imaging architecture set-up
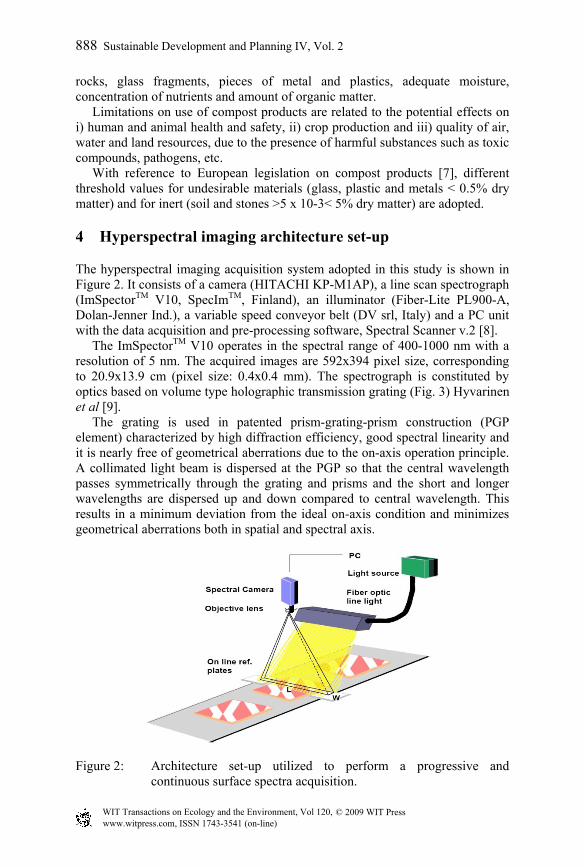
The hyperspectral imaging acquisition system adopted in this study is shown in Figure 2. It consists of a camera (HITACHI KP-M1AP), a line scan spectrograph (ImSpectorTM V10, SpecImTM, Finland), an illuminator (Fiber-Lite PL900-A, Dolan-Jenner Ind.), a variable speed conveyor belt (DV srl, Italy) and a PC unit with the data acquisition and pre-processing software, Spectral Scanner v.2 [8]. The ImSpectorTM V10 operates in the spectral range of 400-1000 nm with a resolution of 5 nm. The acquired images are 592x394 pixel size, corresponding to 20.9x13.9 cm (pixel size: 0.4x0.4 mm). The spectrograph is constituted by optics based on volume type holographic transmission grating (Fig. 3) Hyvarinen et al [9]. The grating is used in patented prism-grating-prism construction (PGP element) characterized by high diffraction efficiency, good spectral linearity and it is nearly free of geometrical aberrations due to the on-axis operation principle. A collimated light beam is dispersed at the PGP so that the central wavelength passes symmetrically through the grating and prisms and the short and longer wavelengths are dispersed up and down compared to central wavelength. This results in a minimum deviation from the ideal on-axis condition and minimizes geometrical aberrations both in spatial and spectral axis.
Figure 2: Architecture set-up utilized to perform a progressive and continuous surface spectra acquisition.
www.witpress.com, ISSN 1743-3541 (on-line)
© 2009 WIT PressWIT Transactions on Ecology and the Environment, Vol 120,
888 Sustainable Development and Planning IV, Vol. 2
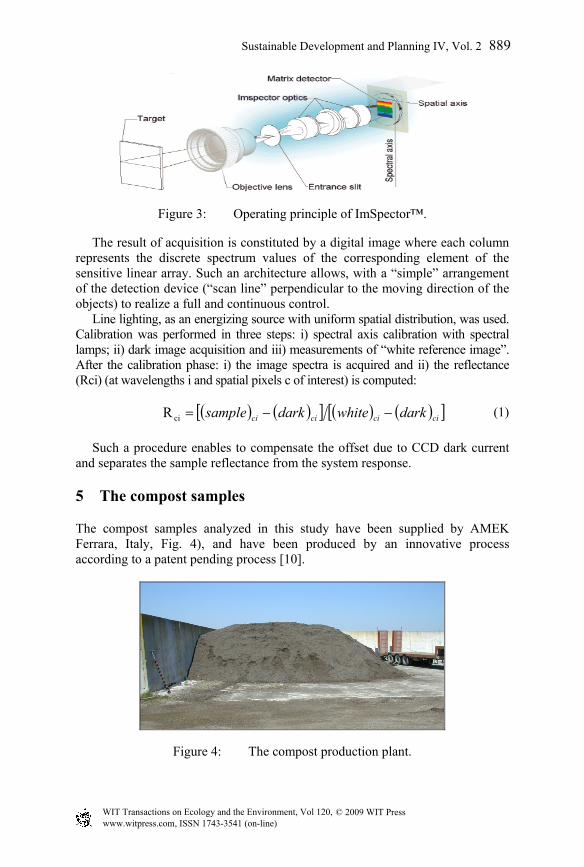
Figure 3: Operating principle of ImSpector™.
The result of acquisition is constituted by a digital image where each column represents the discrete spectrum values of the corresponding element of the sensitive linear array. Such an architecture allows, with a “simple” arrangement of the detection device (“scan line” perpendicular to the moving direction of the objects) to realize a full and continuous control. Line lighting, as an energizing source with uniform spatial distribution, was used. Calibration was performed in three steps: i) spectral axis calibration with spectral lamps; ii) dark image acquisition and iii) measurements of “white reference image”. After the calibration phase: i) the image spectra is acquired and ii) the reflectance (Rci) (at wavelengths i and spatial pixels c of interest) is computed:
( ) ( )[ ] ( ) ( )[ ]cicicici darkwhitedarksample −−=ciR (1) Such a procedure enables to compensate the offset due to CCD dark current and separates the sample reflectance from the system response.
5 The compost samples
The compost samples analyzed in this study have been supplied by AMEK Ferrara, Italy, Fig. 4), and have been produced by an innovative process according to a patent pending process [10].
Figure 4: The compost production plant.
www.witpress.com, ISSN 1743-3541 (on-line)
© 2009 WIT PressWIT Transactions on Ecology and the Environment, Vol 120,
Sustainable Development and Planning IV, Vol. 2 889
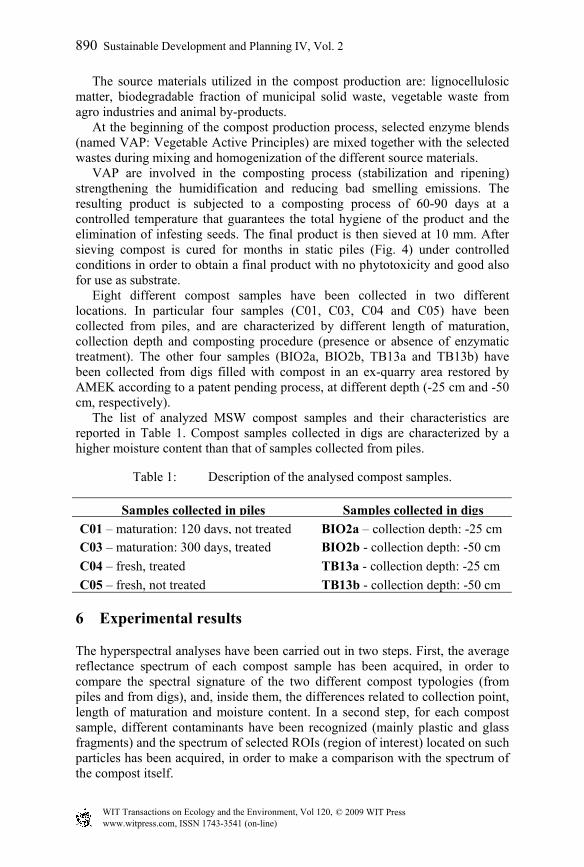
The source materials utilized in the compost production are: lignocellulosic matter, biodegradable fraction of municipal solid waste, vegetable waste from agro industries and animal by-products. At the beginning of the compost production process, selected enzyme blends (named VAP: Vegetable Active Principles) are mixed together with the selected wastes during mixing and homogenization of the different source materials. VAP are involved in the composting process (stabilization and ripening) strengthening the humidification and reducing bad smelling emissions. The resulting product is subjected to a composting process of 60-90 days at a controlled temperature that guarantees the total hygiene of the product and the elimination of infesting seeds. The final product is then sieved at 10 mm. After sieving compost is cured for months in static piles (Fig. 4) under controlled conditions in order to obtain a final product with no phytotoxicity and good also for use as substrate. Eight different compost samples have been collected in two different locations. In particular four samples (C01, C03, C04 and C05) have been collected from piles, and are characterized by different length of maturation, collection depth and composting procedure (presence or absence of enzymatic treatment). The other four samples (BIO2a, BIO2b, TB13a and TB13b) have been collected from digs filled with compost in an ex-quarry area restored by AMEK according to a patent pending process, at different depth (-25 cm and -50 cm, respectively). The list of analyzed MSW compost samples and their characteristics are reported in Table 1. Compost samples collected in digs are characterized by a higher moisture content than that of samples collected from piles.
Table 1: Description of the analysed compost samples.
Samples collected in piles Samples collected in digs C01 – maturation: 120 days, not treated BIO2a – collection depth: -25 cm C03 – maturation: 300 days, treated BIO2b - collection depth: -50 cm C04 – fresh, treated TB13a - collection depth: -25 cm C05 – fresh, not treated TB13b - collection depth: -50 cm
6 Experimental results
The hyperspectral analyses have been carried out in two steps. First, the average reflectance spectrum of each compost sample has been acquired, in order to compare the spectral signature of the two different compost typologies (from piles and from digs), and, inside them, the differences related to collection point, length of maturation and moisture content. In a second step, for each compost sample, different contaminants have been recognized (mainly plastic and glass fragments) and the spectrum of selected ROIs (region of interest) located on such particles has been acquired, in order to make a comparison with the spectrum of the compost itself.
www.witpress.com, ISSN 1743-3541 (on-line)
© 2009 WIT PressWIT Transactions on Ecology and the Environment, Vol 120,
890 Sustainable Development and Planning IV, Vol. 2
C01 C03
C04 C05
BIO2a BIO2b
TB13a TB13b
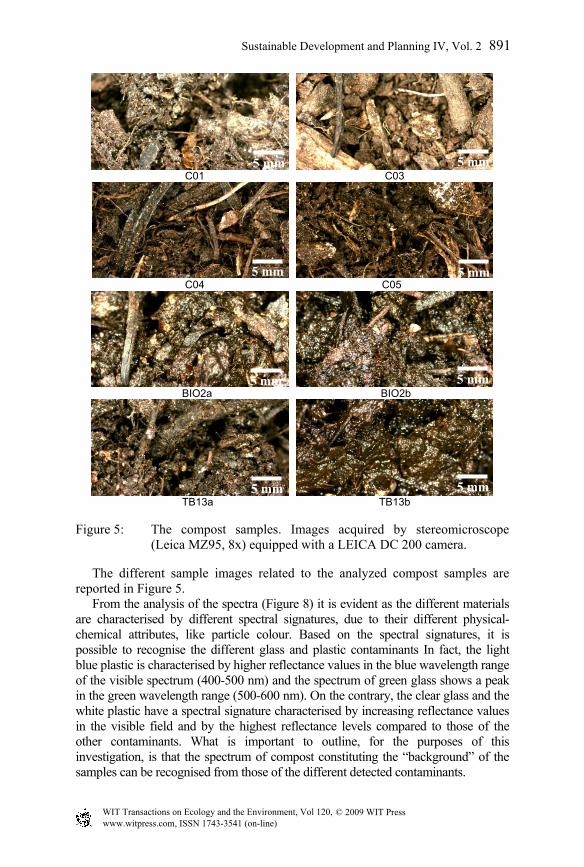
Figure 5: The compost samples. Images acquired by stereomicroscope (Leica MZ95, 8x) equipped with a LEICA DC 200 camera.
The different sample images related to the analyzed compost samples are reported in Figure 5. From the analysis of the spectra (Figure 8) it is evident as the different materials are characterised by different spectral signatures, due to their different physical-chemical attributes, like particle colour. Based on the spectral signatures, it is possible to recognise the different glass and plastic contaminants In fact, the light blue plastic is characterised by higher reflectance values in the blue wavelength range of the visible spectrum (400-500 nm) and the spectrum of green glass shows a peak in the green wavelength range (500-600 nm). On the contrary, the clear glass and the white plastic have a spectral signature characterised by increasing reflectance values in the visible field and by the highest reflectance levels compared to those of the other contaminants. What is important to outline, for the purposes of this investigation, is that the spectrum of compost constituting the “background” of the samples can be recognised from those of the different detected contaminants.
5 mm
5 mm
5 mm
5 mm
5 mm
5 mm
5 mm
5 mm
www.witpress.com, ISSN 1743-3541 (on-line)
© 2009 WIT PressWIT Transactions on Ecology and the Environment, Vol 120,
Sustainable Development and Planning IV, Vol. 2 891
0.00
0.05
0.10
0.15
0.20
0.25
0.30
0.35
400 500 600 700 800 900 1000
Wavelength (nm)
Refle
ctan
ce
C01 C03 C04 C05 BIO2a BIO2b TB13a TB13b
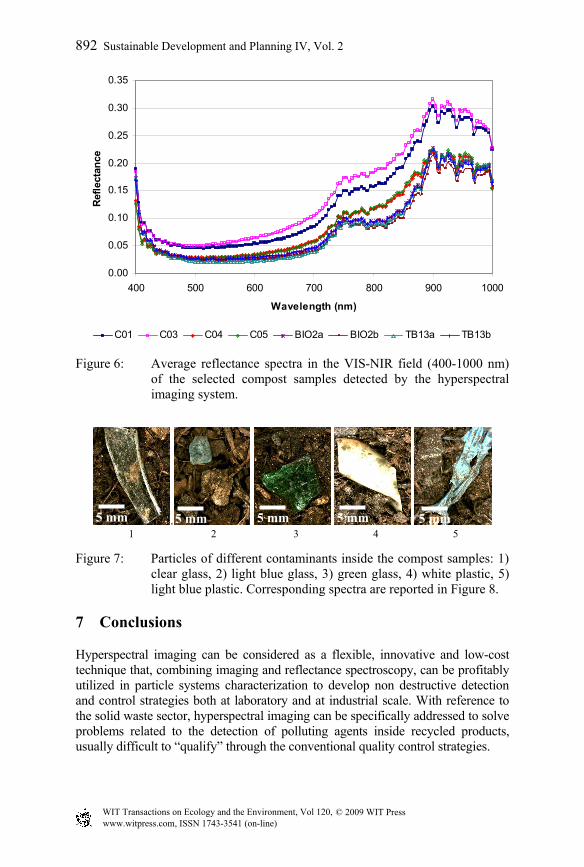
Figure 6: Average reflectance spectra in the VIS-NIR field (400-1000 nm) of the selected compost samples detected by the hyperspectral imaging system.
. 1 2 3 4 5
Figure 7: Particles of different contaminants inside the compost samples: 1) clear glass, 2) light blue glass, 3) green glass, 4) white plastic, 5) light blue plastic. Corresponding spectra are reported in Figure 8.
7 Conclusions
Hyperspectral imaging can be considered as a flexible, innovative and low-cost technique that, combining imaging and reflectance spectroscopy, can be profitably utilized in particle systems characterization to develop non destructive detection and control strategies both at laboratory and at industrial scale. With reference to the solid waste sector, hyperspectral imaging can be specifically addressed to solve problems related to the detection of polluting agents inside recycled products, usually difficult to “qualify” through the conventional quality control strategies.
5 mm
5 mm
5 mm
5 mm
5 mm
www.witpress.com, ISSN 1743-3541 (on-line)
© 2009 WIT PressWIT Transactions on Ecology and the Environment, Vol 120,
892 Sustainable Development and Planning IV, Vol. 2
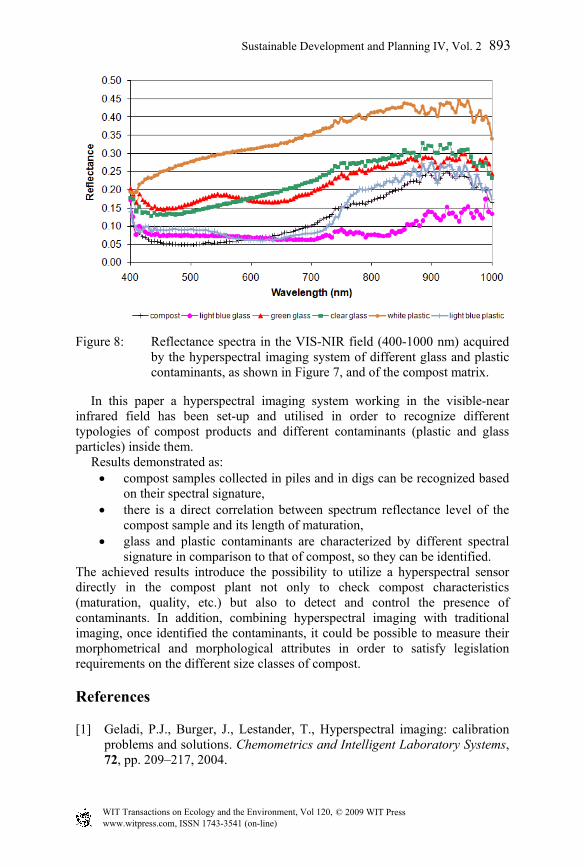
Figure 8: Reflectance spectra in the VIS-NIR field (400-1000 nm) acquired by the hyperspectral imaging system of different glass and plastic contaminants, as shown in Figure 7, and of the compost matrix.
In this paper a hyperspectral imaging system working in the visible-near infrared field has been set-up and utilised in order to recognize different typologies of compost products and different contaminants (plastic and glass particles) inside them. Results demonstrated as:
• compost samples collected in piles and in digs can be recognized based on their spectral signature,
• there is a direct correlation between spectrum reflectance level of the compost sample and its length of maturation,
• glass and plastic contaminants are characterized by different spectral signature in comparison to that of compost, so they can be identified.
The achieved results introduce the possibility to utilize a hyperspectral sensor directly in the compost plant not only to check compost characteristics (maturation, quality, etc.) but also to detect and control the presence of contaminants. In addition, combining hyperspectral imaging with traditional imaging, once identified the contaminants, it could be possible to measure their morphometrical and morphological attributes in order to satisfy legislation requirements on the different size classes of compost.
References
[1] Geladi, P.J., Burger, J., Lestander, T., Hyperspectral imaging: calibration problems and solutions. Chemometrics and Intelligent Laboratory Systems, 72, pp. 209–217, 2004.
www.witpress.com, ISSN 1743-3541 (on-line)
© 2009 WIT PressWIT Transactions on Ecology and the Environment, Vol 120,
Sustainable Development and Planning IV, Vol. 2 893
[2] Bonifazi, G., Serranti, S., Imaging spectroscopy based strategies for ceramic glass contaminants removal in glass recycling. Waste Management, 26, pp. 627–639, 2006.
[3] Bonifazi, G., Serranti, S., Hyperspectral imaging based techniques in fluff sorting. Proc. Of the 21st Int. Conf. on Solid Waste Technology and Management, Philadelphia, PA, U.S.A., pp. 740–747, 2006.
[4] Bonifazi, G., Serranti, S., Hyperspectral imaging techniques in fluff characterization. Proc. of SPIE: Advanced Environmental, Chemical and Biological Sensing Technologies IV, eds. T. Vo-Dinh, R.A. Lieberman, G. Gauglitz, 6377, pp. 63770O-1–63770O-10, 2006.
[5] Bonifazi, G., Serranti, S., Hyperspectral imaging based procedures applied to bottom ash characterization. Proc. of SPIE: Advanced Environmental, Chemical and Biological Sensing Technologies V, eds. T. Vo-Dinh, R.A. Lieberman, G. Gauglitz, 6755, pp. 67550B-1–67550B-10, 2007.
[6] Eggerth, L.L., Diaz, L.F., Chang, M.T.F. & Iseppi L., Marketing of composts (Chapter 12). Compost science and technology, eds. L.F. Diaz, M. de Bertoldi, W. Bidlingmaier & E. Stentiford, Elsevier: Amsterdam, pp. 325–355, 2007.
[7] DG Environment, Biological treatment of biowaste, 2nd draft, 2004. [8] DV srl, Spectral scanner software v. 2.0, Padova, Italy, 2003. [9] Hyvarinen, T., Herrala, E., Dall’Ava, A., Direct sight imaging
spectrograph: a unique add-on component brings spectral imaging to industrial applications. SPIE Proc. of Symposium on Electronic Imaging: Science and Technology, 3302, pp. 165–175, 1998.
[10] AMEK & CTI, A process of maturing and stabilizing biomasses under reduction of smelling emissions, EP02425717.2, 2002.
www.witpress.com, ISSN 1743-3541 (on-line)
© 2009 WIT PressWIT Transactions on Ecology and the Environment, Vol 120,
894 Sustainable Development and Planning IV, Vol. 2


![PROCESSING OF DRONE-BORNE HYPERSPECTRAL ......3.2. Hyperspectral sensor A frame-based hyperspectral camera of Rikola Ltd. [3] was used for data acquisition. With its low weight of](https://static.fdocuments.net/doc/165x107/5e95aa7178731f605a00b1c5/processing-of-drone-borne-hyperspectral-32-hyperspectral-sensor-a-frame-based.jpg)