
Innovative Comparison of Transient Ignition Temperature at ... · Roberto Garcia3 and Kenneth L....
60
47th AIAA/ASME/SAE/ASEE Joint Propulsion Conference & Exhibit 1 American Institute of Aeronautics and Astronautics Innovative Comparison of Transient Ignition Temperature at the Booster Interface, New Stainless Steel Pyrovalve Primer Chamber Assembly “V” (PCA) Design versus the Current Aluminum “Y” PCA Design Regor L. Saulsberry 1 NASA Johnson Space Center White Sands Test Facility, Las Cruces, New Mexico 88004 Stephen H. McDougle 2 NASA Test and Evaluation Contract, NASA Johnson Space Center White Sands Test Facility, Las Cruces, New Mexico 88004 and Roberto Garcia 3 and Kenneth L. Johnson 4 NASA Marshall Space Flight Center Huntsville, Alabama 35811 William Sipes 5 Canyon Country, California 91351 Steven Rickman 6 NASA Johnson Space Center Houston, Texas 77058 Ashvin Hosangadi 7 Combustion Research and Flow Technology, Inc (Craftech) Pipersville, Pennsylvania 18947 An assessment of four spacecraft pyrovalve anomalies that occurred during ground testing was conducted by the NASA Engineering & Safety Center (NESC) in 2008. In all four cases, a common aluminum (Al) primer chamber assembly (PCA) was used with dual NASA Standard Initiators (NSIs) and the nearly simultaneous (separated by less than 80 microseconds (μs)) firing of both initiators failed to ignite the booster charge. The results of the assessment and associated test program were reported in AIAA Paper AIAA-2008-4798, NESC Independent Assessment of Pyrovalve Ground Test Anomalies. As a result of the four Al PCA anomalies, and the test results and findings of the NESC assessment, the Mars Science Laboratory (MSL) project team decided to make changes to the PCA. The material for the PCA body was changed from aluminum (Al) to stainless steel (SS) to avoid melting, distortion, and potential leakage of the NSI flow passages when the device functioned. The flow passages, which were interconnected in a Y-shaped configuration (Y-PCA) in the original design, were changed to a V-shaped configuration 1 Project Manager, Laboratories Office/RF, P.O. Box 20, Las Cruces, New Mexico 88004, Senior Member. 2 Senior Project Engineer, Laboratories Department/201LD, P.O. Box 20, Las Cruces, New Mexico 88004, Associate Fellow. 3 NESC Assessment Requestor, NASA Propulsion Fellow, NESC Propulsion Technical Discipline Team Lead, Huntsville, Alabama 35811. 4 AST, Technical Management, Statistics and Trending, NESC Systems Engineering Organization, Bldg 4201, Rm. 419, Huntsville, Alabama 35811. 5 Pyrotechnic Consultant, 18850 Laurel Crest Lane, Canyon Country, California 91351. 6 NASA Technical Fellow for Passive Thermal, NESC, 2101 NASA Parkway, Houston, Texas 77058. 7 Principal Scientist, 6210 Keller’s Church Road, Pipersville, Pennsylvania 18947. https://ntrs.nasa.gov/search.jsp?R=20110014013 2018-06-14T15:05:46+00:00Z
Transcript of Innovative Comparison of Transient Ignition Temperature at ... · Roberto Garcia3 and Kenneth L....

47th AIAA/ASME/SAE/ASEE Joint Propulsion Conference & Exhibit
1 American Institute of Aeronautics and Astronautics
Innovative Comparison of Transient Ignition Temperature at the Booster Interface, New Stainless Steel Pyrovalve
Primer Chamber Assembly “V” (PCA) Design versus the Current Aluminum “Y” PCA Design
Regor L. Saulsberry1 NASA Johnson Space Center White Sands Test Facility, Las Cruces, New Mexico 88004
Stephen H. McDougle2 NASA Test and Evaluation Contract, NASA Johnson Space Center White Sands Test Facility,
Las Cruces, New Mexico 88004
and
Roberto Garcia3 and Kenneth L. Johnson4 NASA Marshall Space Flight Center
Huntsville, Alabama 35811
William Sipes5
Canyon Country, California 91351
Steven Rickman6 NASA Johnson Space Center
Houston, Texas 77058
Ashvin Hosangadi7 Combustion Research and Flow Technology, Inc (Craftech)
Pipersville, Pennsylvania 18947
An assessment of four spacecraft pyrovalve anomalies that occurred during ground testing was conducted by the NASA Engineering & Safety Center (NESC) in 2008. In all four cases, a common aluminum (Al) primer chamber assembly (PCA) was used with dual NASA Standard Initiators (NSIs) and the nearly simultaneous (separated by less than 80 microseconds (µs)) firing of both initiators failed to ignite the booster charge. The results of the assessment and associated test program were reported in AIAA Paper AIAA-2008-4798, NESC Independent Assessment of Pyrovalve Ground Test Anomalies.
As a result of the four Al PCA anomalies, and the test results and findings of the NESC assessment, the Mars Science Laboratory (MSL) project team decided to make changes to the PCA. The material for the PCA body was changed from aluminum (Al) to stainless steel (SS) to avoid melting, distortion, and potential leakage of the NSI flow passages when the device functioned. The flow passages, which were interconnected in a Y-shaped configuration (Y-PCA) in the original design, were changed to a V-shaped configuration
1 Project Manager, Laboratories Office/RF, P.O. Box 20, Las Cruces, New Mexico 88004, Senior Member. 2 Senior Project Engineer, Laboratories Department/201LD, P.O. Box 20, Las Cruces, New Mexico 88004,
Associate Fellow. 3 NESC Assessment Requestor, NASA Propulsion Fellow, NESC Propulsion Technical Discipline Team Lead,
Huntsville, Alabama 35811. 4 AST, Technical Management, Statistics and Trending, NESC Systems Engineering Organization, Bldg 4201, Rm.
419, Huntsville, Alabama 35811. 5 Pyrotechnic Consultant, 18850 Laurel Crest Lane, Canyon Country, California 91351. 6 NASA Technical Fellow for Passive Thermal, NESC, 2101 NASA Parkway, Houston, Texas 77058. 7 Principal Scientist, 6210 Keller’s Church Road, Pipersville, Pennsylvania 18947.
https://ntrs.nasa.gov/search.jsp?R=20110014013 2018-06-14T15:05:46+00:00Z

47th AIAA/ASME/SAE/ASEE Joint Propulsion Conference & Exhibit
2 American Institute of Aeronautics and Astronautics
(V-PCA). The V-shape was used to more efficiently transfer energy from the NSIs to the booster. Development and qualification testing of the new design clearly demonstrated faster booster ignition times compared to the legacy AL Y-PCA design. However, the final NESC assessment report recommended that the SS V-PCA be experimentally characterized and quantitatively compared to the Al Y-PCA design. This data was deemed important for properly evaluating the design options for future NASA projects. This test program has successfully quantified the improvement of the SS V-PCA over the Al Y-PCA. A phase B of the project was also conducted and evaluated the effect of firing command skew and enlargement of flame channels to further assist spacecraft applications.
Nomenclature 2PT = two-pressure-transducer (bomb tests) CRES = Corrosion Resistant Steel D-PIC = Dual Pyrotechnic Ignition Circuit GRC = Glenn Research Center GSFC = Goddard Space Flight Center ICP = Inductive Couple Plasma JPL = Jet Propulsion Laboratory KSC = Kennedy Space Center LMSSC = Lockheed Martin Space Systems Company ms = millisecond NASA = National Aeronautics and Space Administration NESC = NASA Engineering Safety Center NSI = NASA Standard Initiator PCA = Primer Chamber Assembly PT = pressure transducer psia = Pounds Per Square Inch Absolute psi = Pounds Per Square Inch (Static Pressure) s = seconds SS = stainless steel SDO = Solar Dynamics Observatory WSTF = White Sands Test Facility Y-PCA = Y-configured primer chamber/carrier assembly
I. Introduction N October 2008, the NASA Engineering and Safety Center (NESC) generated a report entitled, Conax Y-PCA (Primer Chamber Assembly) Booster Anomaly Investigation.1 The report detailed an independent assessment of
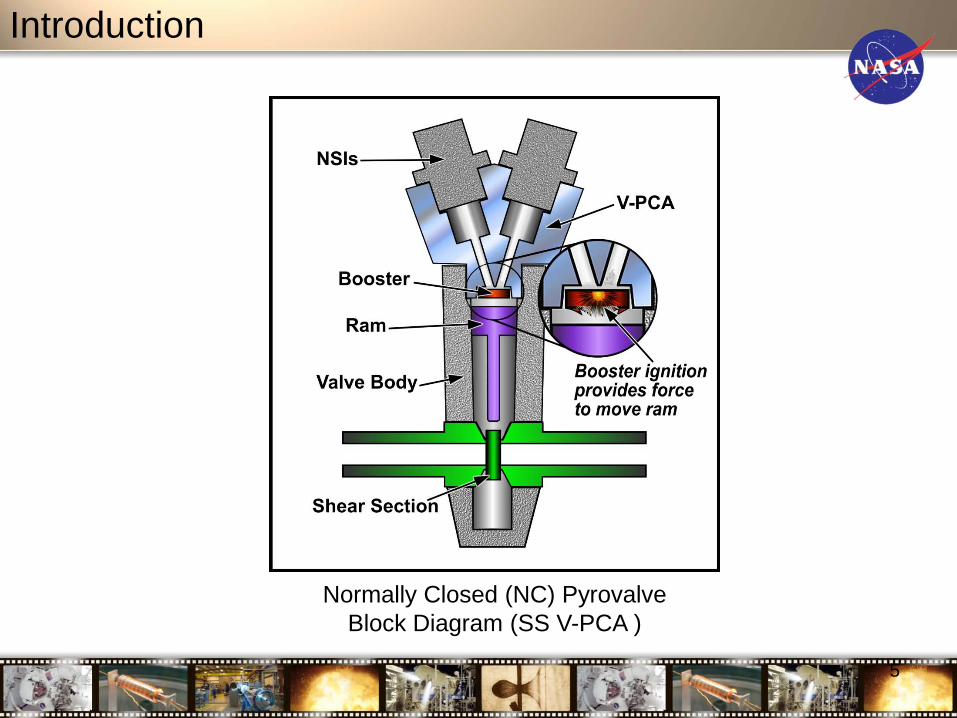
four spacecraft propulsion system pyrovalve anomalies that occurred during ground testing. In all four cases, a common aluminum (Al) PCA featuring dual NASA Standard Initiators (NSI) was used. In the ground tests, the nearly simultaneous (separated by less than 80 microseconds (µs)) firing of both initiators failed to ignite the booster charge. As a result of the NESC’s assessment work and because the Mars Science Laboratory (MSL) spacecraft planned to use pyrovalves with similar features, the MSL project team decided to make modifications to the PCA to avoid potential anomalies. Two modifications were made. The material for the PCA body was changed from Al to stainless steel (SS) to avoid melting and distortion of the NSI flow passages when the device functioned. Secondly, the interconnected flow passages were separated. Instead of a Y-shape configuration, a V-shape was used to more efficiently transfer energy from the NSIs to the booster charge (Fig. 1). Development and qualification testing of the new design clearly demonstrated improved performance in terms of shorter booster ignition times and greater margin for booster ignition.
However, the final NESC report of the ground test anomalies recommended that the SS V-PCA should be experimentally characterized and quantitatively compared to the Al Y-PCA design prior to widespread application in NASA programs. In addition to benefitting MSL as originally planned, this data would provide future NASA projects with information necessary to properly evaluate the selection and use of the SS V-PCA versus the Al Y-PCA. This assessment implements that recommendation.
I

47th AIAA/ASME/SAE/ASEE Joint Propulsion Conference & Exhibit
3 American Institute of Aeronautics and Astronautics
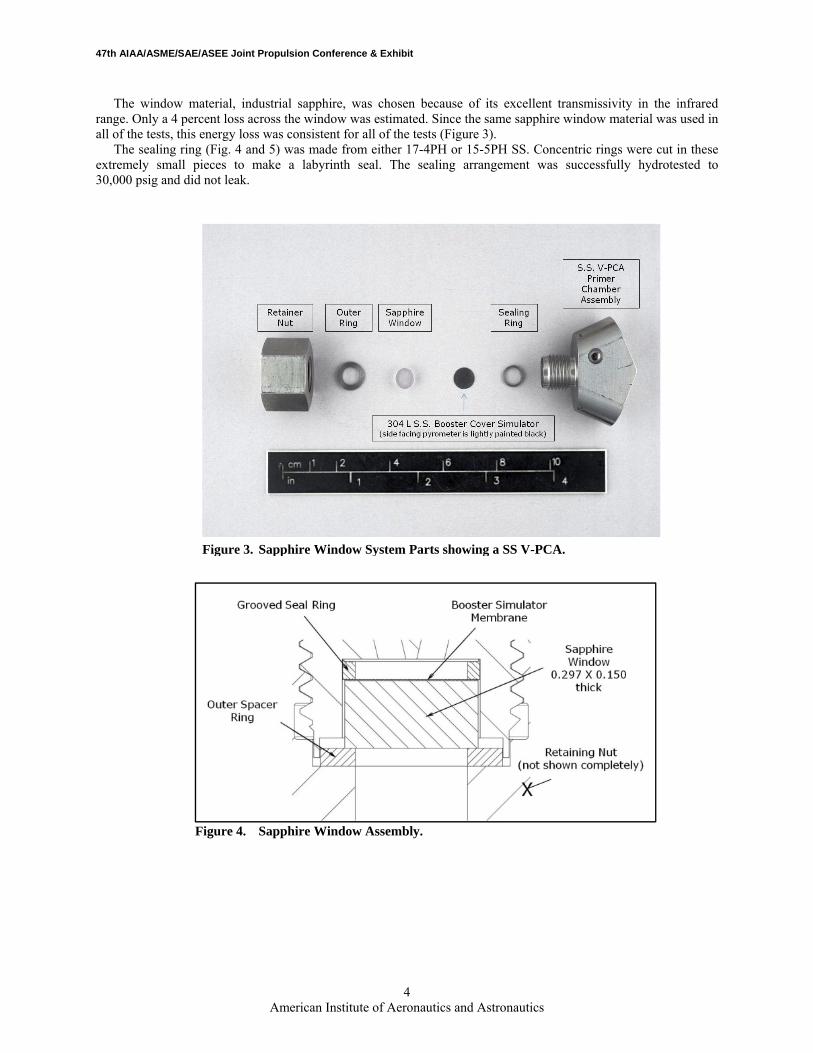
II. Testing Test Apparatus All phases of the test project, and both the Al Y-PCA and SS V-PCA test articles, used a sapphire window arrangement in the booster location (Fig. 1). The Al Y-PCA test article consisted of a sealing ring, a booster cover simulator (0.003-in. thick SS membrane), the sapphire window, and a spacer ring (Fig. 2). The parts were held in place by a retaining nut on the bottom of the PCA.
The booster cover simulator was made from 304L SS supplied by the same vendor that makes the actual booster container. After the cover simulators were cut and before the tests, one side was sprayed with a very thin coating of flat black paint. This became the underside of the diaphragm and it provided a consistent emissivity for the infrared pyrometer.
Figure 2. Sapphire Window Interface Simulating the Booster Container showing an Al Y-PCA.
Figure 1. Comparison of Al Y-PCA (Heritage) to SS V-PCA (MSL: CRES-V).
47th AIAA/ASME/SAE/ASEE Joint Propulsion Conference & Exhibit
4 American Institute of Aeronautics and Astronautics
The window material, industrial sapphire, was chosen because of its excellent transmissivity in the infrared range. Only a 4 percent loss across the window was estimated. Since the same sapphire window material was used in all of the tests, this energy loss was consistent for all of the tests (Figure 3).
The sealing ring (Fig. 4 and 5) was made from either 17-4PH or 15-5PH SS. Concentric rings were cut in these extremely small pieces to make a labyrinth seal. The sealing arrangement was successfully hydrotested to 30,000 psig and did not leak.
Figure 4. Sapphire Window Assembly.
Figure 3. Sapphire Window System Parts showing a SS V-PCA.

47th AIAA/ASME/SAE/ASEE Joint Propulsion Conference & Exhibit
5 American Institute of Aeronautics and Astronautics
One pressure sense port for each NSI cavity was provided in the side of each PCA. The ports were made to
accommodate Kistler model 603B1 pressure transducers. The ports were filled with Dow Corning 33 silicone grease. The infrared pyrometer used for the tests had a temperature range of 300 to 2,000 ºC (572 to 3,632 ºF) with a nominal response time of 6 µs.
III. Phase I, Y-PCA vs. V-PCA Testing In the first phase of this assessment, single and dual simultaneous firings of the NSIs were performed in both
PCA types to characterize the peak temperature delivered to the booster membrane/propellant charge interface (underside of the booster charge cover). Figure 6 shows typical results from a single NSI firing in an Al Y-PCA and typical results for a single NSI firing in a SS V-PCA are shown in Fig. 7. The SS V-PCA units delivered an average maximum booster/propellant interface temperature ~600 °F greater than that delivered by the Al Y-PCA units. The Al Y-PCAs ignite the booster propellant reliably if not fired simultaneously, but this improvement provides extra margin. It is also noted that, under conditions of the tests, the higher temperature was achieved in half the rise time; 776 µs for the SS V-PCAs versus 1,342 µs for the Al Y-PCAs. The SS V-PCA units produced pressures in the NSI cavity that averaged 3,000 psi greater than the Al Y-PCA units produced. Figure 8 compares the booster interface temperature results for all Phase I Tests.
Figure 6. Typical Results from a Single NSI Firing in an Al Y-PCA (Run 4).
Figure 5. Sealing Rings Shown Alongside a U.S. Dime.

47th AIAA/ASME/SAE/ASEE Joint Propulsion Conference & Exhibit
6 American Institute of Aeronautics and Astronautics
Figure 8. Booster Propellant Interface Temperature Results for all Phase I Tests.
Figure 7. Typical Results for a Single NSI firing in a SS V-PCA (Run 15).
47th AIAA/ASME/SAE/ASEE Joint Propulsion Conference & Exhibit
7 American Institute of Aeronautics and Astronautics
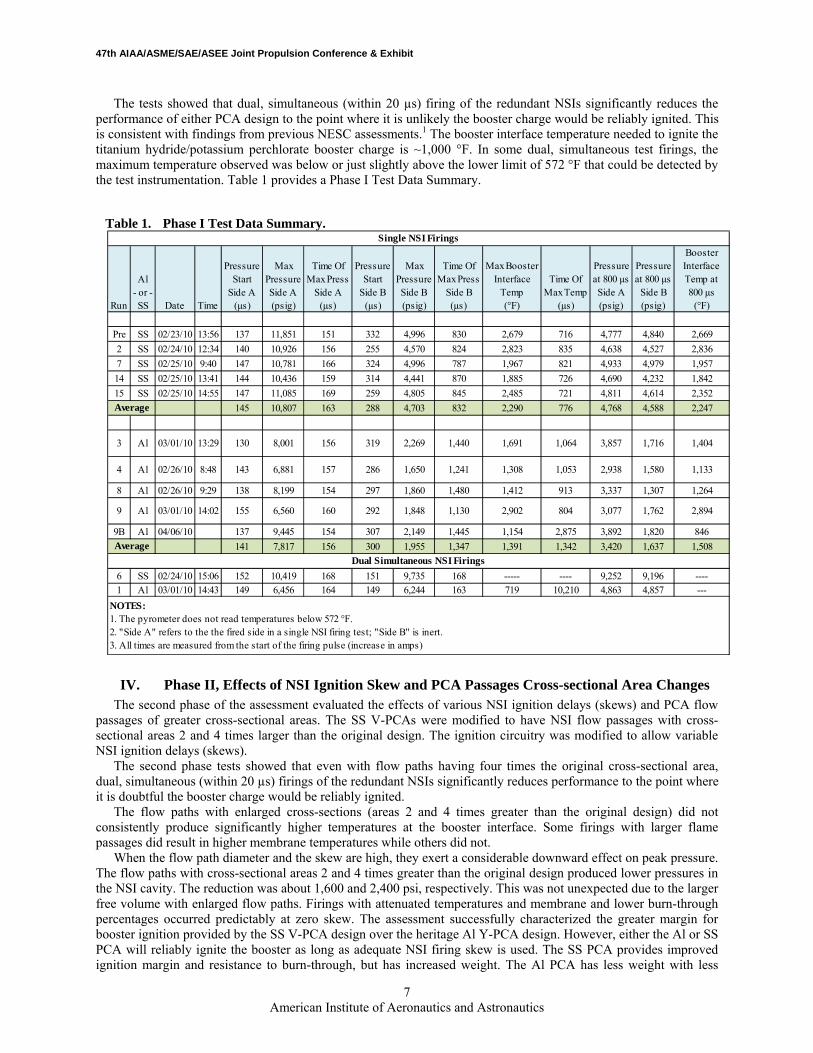
The tests showed that dual, simultaneous (within 20 µs) firing of the redundant NSIs significantly reduces the performance of either PCA design to the point where it is unlikely the booster charge would be reliably ignited. This is consistent with findings from previous NESC assessments.1 The booster interface temperature needed to ignite the titanium hydride/potassium perchlorate booster charge is ~1,000 °F. In some dual, simultaneous test firings, the maximum temperature observed was below or just slightly above the lower limit of 572 °F that could be detected by the test instrumentation. Table 1 provides a Phase I Test Data Summary.
IV. Phase II, Effects of NSI Ignition Skew and PCA Passages Cross-sectional Area Changes The second phase of the assessment evaluated the effects of various NSI ignition delays (skews) and PCA flow
passages of greater cross-sectional areas. The SS V-PCAs were modified to have NSI flow passages with cross-sectional areas 2 and 4 times larger than the original design. The ignition circuitry was modified to allow variable NSI ignition delays (skews).
The second phase tests showed that even with flow paths having four times the original cross-sectional area, dual, simultaneous (within 20 µs) firings of the redundant NSIs significantly reduces performance to the point where it is doubtful the booster charge would be reliably ignited.
The flow paths with enlarged cross-sections (areas 2 and 4 times greater than the original design) did not consistently produce significantly higher temperatures at the booster interface. Some firings with larger flame passages did result in higher membrane temperatures while others did not.
When the flow path diameter and the skew are high, they exert a considerable downward effect on peak pressure. The flow paths with cross-sectional areas 2 and 4 times greater than the original design produced lower pressures in the NSI cavity. The reduction was about 1,600 and 2,400 psi, respectively. This was not unexpected due to the larger free volume with enlarged flow paths. Firings with attenuated temperatures and membrane and lower burn-through percentages occurred predictably at zero skew. The assessment successfully characterized the greater margin for booster ignition provided by the SS V-PCA design over the heritage Al Y-PCA design. However, either the Al or SS PCA will reliably ignite the booster as long as adequate NSI firing skew is used. The SS PCA provides improved ignition margin and resistance to burn-through, but has increased weight. The Al PCA has less weight with less
Table 1. Phase I Test Data Summary.
Run
Al- or -SS Date Time
PressureStart
Side A(µs)
Max PressureSide A(psig)
Time OfMax Press
Side A(µs)
PressureStart
Side B(µs)
Max PressureSide B(psig)
Time OfMax Press
Side B(µs)
Max BoosterInterface
Temp(°F)
Time OfMax Temp
(µs)
Pressureat 800 µsSide A(psig)
Pressureat 800 µs
Side B(psig)
Booster Interface Temp at800 µs
(°F)
Pre SS 02/23/10 13:56 137 11,851 151 332 4,996 830 2,679 716 4,777 4,840 2,6692 SS 02/24/10 12:34 140 10,926 156 255 4,570 824 2,823 835 4,638 4,527 2,8367 SS 02/25/10 9:40 147 10,781 166 324 4,996 787 1,967 821 4,933 4,979 1,95714 SS 02/25/10 13:41 144 10,436 159 314 4,441 870 1,885 726 4,690 4,232 1,84215 SS 02/25/10 14:55 147 11,085 169 259 4,805 845 2,485 721 4,811 4,614 2,352
145 10,807 163 288 4,703 832 2,290 776 4,768 4,588 2,247
3 Al 03/01/10 13:29 130 8,001 156 319 2,269 1,440 1,691 1,064 3,857 1,716 1,404
4 Al 02/26/10 8:48 143 6,881 157 286 1,650 1,241 1,308 1,053 2,938 1,580 1,133
8 Al 02/26/10 9:29 138 8,199 154 297 1,860 1,480 1,412 913 3,337 1,307 1,264
9 Al 03/01/10 14:02 155 6,560 160 292 1,848 1,130 2,902 804 3,077 1,762 2,894
9B Al 04/06/10 137 9,445 154 307 2,149 1,445 1,154 2,875 3,892 1,820 846141 7,817 156 300 1,955 1,347 1,391 1,342 3,420 1,637 1,508
6 SS 02/24/10 15:06 152 10,419 168 151 9,735 168 ----- ---- 9,252 9,196 ----1 Al 03/01/10 14:43 149 6,456 164 149 6,244 163 719 10,210 4,863 4,857 ---
NOTES: 1. The pyrometer does not read temperatures below 572 °F.2. "Side A" refers to the the fired side in a single NSI firing test; "Side B" is inert.3. All times are measured from the start of the firing pulse (increase in amps)
Dual Simultaneous NSI Firings
Single NSI Firings
Average
Average

47th AIAA/ASME/SAE/ASEE Joint Propulsion Conference & Exhibit
8 American Institute of Aeronautics and Astronautics
ignition margin and slower ignition times. With either design, the ignition of both NSIs within 20 µs or less of each other has a significant probability of failure to ignite the booster charge. Designers of spacecraft and pyrovalves now have additional information to make informed decisions regarding the trade-off between the greater weight and improved performance of the SS V-PCA. The team was able to characterize the time and pressure histories for various skew times and flame channel areas. The testing did not show consistent improvement with larger NSI flow channels with either greater temperatures at the booster interface or a reduced probability of failure with dual, simultaneous NSI firings. In addition to thermal analysis done by the team, SS PCA modeling was accomplished by Combustion Research and Flow Technology, Inc. (Craftech Industries, Inc.) under the Small Business Innovation Research (SBIR) program in collaboration with this project. This helped provide an understanding of the booster stagnation condition that results from a simultaneous NSI firing. The modeling also suggested that additional chambers machined into the PCA might help preclude the stagnation condition and eliminate the anomaly. A single test was tried with small chambers machined in, but did not clearly demonstrate an improvement. A further increase in the volume of these chambers and additional testing would likely be necessary to reach firm conclusions on the merit of this modification. Table 2 is a summary of Phase II Test Data.
Because the assessment did not conduct tests with booster charges in place, the overall ability to drive the ram and actuate the pyrovalve could not be examined. This ability could be reduced by the increased tendency of the booster gases to flow back up the enlarged flow passages towards the NSI cavities and by the increase in free volume in the PCA with larger flame passages. Significant testing at the pyrovalve assembly level would be needed to fully understand the effect of larger flame passages. The larger flow channels are a significant departure from both the heritage Al Y-PCA and SS V-PCA flight-qualified designs.
Table 2. Phase II Test Data Summary.
Test Phase
Run No.
Channel Diameter
(in.)
Actual Skew (µs)
Max Pressure Side A (psig)
Time ofMax Press
Side A (µs)
Max Booster Interface
Temp (°F)
Time ofMax
BoosterInterface
Temp (µs)
Press Before Side B Rise
(psig)
Max Pressure Side B (psig)
Time of Max Press
Side B (µs)
2B 1 0.060 6 10,437 225 - NA NA 9,781 235 2A 3A 0.060 16,000 9,641 224 3,410 16,434 1,574 13,039 16,057 2B 4 0.060 486 11,389 224 2,913 1,132 2,532 15,076 713 2B 5 0.060 485 10,780 220 3,078 1,161 5,661 15,371 710 2B 7 0.060 5 9,715 223 1,723 217 NA 10,719 229 2B 11 0.060 235 10,670 228 2,275 825 2,494 13,344 460
Average 10,439 224 2,680 3,954 3,065 12,888 3,067 2A 4 0.085 16,000 7,838 225 3,402 16,460 1,456 10,145 16,052 2B 2B 0.085 236 8,618 222 1,837 2,555 3,018 13,734 466 2B 6A 0.085 250 9,440 212 1,896 1,578 5,765 12,212 461 2B 8 0.085 0 10,010 240 2,095 246 NA 10,477 240 2B 13 0.085 237 9,017 219 1,733 1,208 3,208 14,220 459 2B 9 0.085 242 8,493 222 2,517 965 3,140 13,094 461 2B 14A 0.085 8 9,637 224 1,723 220 NA 10,146 232 2B 16 0.085 484 8,435 222 3,312 803 4,074 14,027 717 2B 17 0.085 236 8,828 220 2,315 770 3,052 12,826 468
Average 8,924 223 2,314 2,756 3,388 12,320 2,173 2A 1A 0.120 12 9,321 168 - NA NA 8,908 156 2A 2 0.120 16,000 6,852 213 3,479 16,285 1,562 9,692 16,211 2B 3A 0.120 488 8,243 214 3,630 299 4,140 10,114 700 2B 10 0.120 243 7,500 219 2,501 648 3,528 11,546 458 2B 12 0.120 5 9,208 215 1,957 216 NA 9,785 221 2B 14 0.120 484 7,208 219 3,630 774 3,528 10,389 706 2B 15 0.120 5 9,161 222 699 3,700 NA 9,077 237
Average 8,213 210 2,649 3,654 3,190 9,930 2,670 NOTES:
1. All times are from the start of the firing signal. 2. A red highlight indicates a temperature too low to ignite the booster propellant. 3. A dash "-" indicates a temperature lower than the 572 °F lower limit detectable by the pyrometer. This means that
the temperature could be anywhere between 72 °F and 572 °F.

47th AIAA/ASME/SAE/ASEE Joint Propulsion Conference & Exhibit
9 American Institute of Aeronautics and Astronautics
V. PCA Thermal Analysis To better understand the contribution of various heat transfer mechanisms in the PCA, both simplified and
detailed thermal analyses were performed by the NASA Technical Fellow for Passive Thermal and his NESC Technical Discipline Team.2 Three heat transfer mechanisms and their effect on booster cap thermal response were investigated as part of this study. From the analysis, the following conclusions are drawn:
a. Convective heat transfer, by itself, does not account for the temperature rise and melting during booster cap testing;
b. Deposition of liquid zirconia spray onto the booster cap results in more heat transfer than convection alone. Zirconia deposition and the subsequent phase change from the liquid to solid state may assist in booster cap heating and subsequent melting, but does not produce booster cap temperatures in agreement with the booster cap transient temperature response observed during testing. Larger quantities of zirconia deposition increase the propensity to melt and accelerate the temperature rise of the booster cap bottom;
c. Detailed thermal analysis suggests that a hemispherical globule of zirconium–potassium perchlorate (ZPP) with a radius of 3.6 × 10⁻³ in. with a mass of 5.2 × 10⁻³ mg (1.14 × 10⁻⁸ lbm) can liberate sufficient energy to locally melt through the booster cap. Deposition of as little as 20 percent of the unburned ZPP (~4.6 mg, or 1 × 10⁻⁵ lbm) can liberate sufficient energy to melt the entire booster cap. Subsequent two-dimensional axisymmetric thermal analysis shows that local melt-through can be accomplished with considerably less ZPP. From this, it is concluded that < 4.6 mg ZPP burning in contact with the booster cap is sufficient to produce the observed response.
VI. Statistical Analysis and Results The Phase I test was designed using some design of experiments (DOE) methods. The statement of problem was
clearly developed. The size of the test was governed by resource considerations rather than a quantitative statement regarding a confidence level on a difference the team desired to be able to find, but the subject matter experts had reason to believe this test would be sufficient to show clear and useful differences. They were correct in this assessment, as will be seen.3 Phase IIB was designed to evaluate the relationship between firing skew and the cross-sectional area of the flow passages. It was assumed that the following model would apply:
Y = β0 + β1 Skew + β2 Area + β12 Skew x Area + β11 Skew2 + β22 Area2 (1) where the β’s are linear regression parameters fit using the data.
The statistical analysis of the results confirmed clearly that within the tested range of the two inputs studied, no-fires were entirely possible at low skews. A no-fire in this test at high skew and channel area suggests that the channel area does not mitigate the risk of a no-fire, and a no-fire at more than 500 µs could occur. Temperatures increase with increasing skew, but are fairly insensitive to channel area. Channel area affects pressure and increases variability of the time it takes to attain peak temperature.4
VII. Numerical Simulations of Single and Simultaneous Dual Firing NSIs in the SS VPCA Design
In addition to the PCA thermal analysis discussed in Section V, SS PCA numerical simulations (computer modeling) were accomplished by Craftech under the SBIR program, in collaboration with this project. Details of this modeling are provided in the final report.5 This numerical modeling effort, based on computational fluid dynamics, provided an improved understanding of the gas and particle flow physics within the V-PCA. One of the primary issues explored by this test project, the dual, simultaneous NSI ignition anomaly was explained as interaction of the shocks formed by the two NSIs and stagnation at the booster interface. The computer modeling indicated that the stagnation condition and reflected waves reduce the amount of hot, burning ZPP particles reaching the booster membrane, causing the membrane temperature to be dramatically lower. Modeling of a modified V-PCA with additional volume chambers on either side of the flow channels was also accomplished.

47th AIAA/ASME/SAE/ASEE Joint Propulsion Conference & Exhibit
10 American Institute of Aeronautics and Astronautics
VIII. Conclusions Although the AL Y-PCA has demonstrated the ability to consistently ignite a booster with a single NSI firing,
or when the firing skew is greater than 2 ms, the SS V-PCA units avoid flame passage melting and erosion, energy loss, and potential leakage of the NSI flow products. The V-PCA units demonstrated improved performance in that the average maximum booster/propellant interface temperature was ~600 °F greater than that delivered by the Al Y-PCA units. The higher temperatures delivered to the booster interface provide added assurance of booster propellant ignition. The higher temperatures with the SS V-PCAs were achieved in approximately half the time; 776 µs average for the SS V-PCAs versus 1,342 µs average for the Al Y-PCAs. This has resulted in faster ignition of the booster as demonstrated in other related testing.
The SS V-PCA units produced pressures in the NSI cavity that were also ~3,000 psi greater than the Al Y-PCA units. However, the testing showed that dual, simultaneous (within 20 µs) firing of the redundant NSIs significantly reduces the performance of either PCA design to the point where it is doubtful the booster charge would be reliably ignited. The booster interface temperature needed to ignite the titanium hydride/potassium perchlorate booster charge is ~1,000 °F under rapid rise conditions present in the pyrovalve. In about 50 percent of the dual, simultaneous test firings, the maximum temperature observed was below or just slightly above the lower limit of 572 °F that could be detected by the test instrumentation. Also in Phase II, even with flow paths enlarged to 4 times the original cross-sectional area, test data indicated that dual simultaneous (within 20 µs) firings of the redundant NSIs significantly reduces performance to the point where it is again doubtful the booster charge would be reliably ignited. The assessment did not show consistent improvement with larger NSI flow channels, either with greater temperatures at the booster interface or a reduced probability of failure with dual, simultaneous NSI firings. Statistical analysis was used to ensure good experiment design and to help judge the significance of the test results. Thermal analysis was accomplished, which helped the team understand the processes in which heating of the diaphragm occurs so rapidly. This provided insight into the burning zirconia spray environment at the booster interface. Numerical simulation of single and simultaneous dual firing NSIs gave insight into the reasons very low skew firings resulted in such low temperatures at the SS V-PCA booster interface. Two-dimensional animations were provided that show how the shock reflections actually caused burning particulate to be carried away from the booster interface.
It was recommended that the SS V-PCA be used on future NASA programs since the improved ignition margin and erosion resistance makes it more robust (unless weight factors dictate otherwise). This is deemed especially important for manned spaceflight applications, such as on the Multi-Purpose Crew Vehicle (Orion).
References
1 NESC Report No.: RP-08-111_06-009-E, Conax Y-PCA (Primer Chamber Assembly) Booster Anomaly Investigation, October 30, 2008.
2 This full analysis is available in Appendix E of NESC Final Report: Comparison of the Booster Interface Temperature with the New Stainless Steel Primer Chamber Assembly (V-PCA) versus the Legacy Aluminum Y-PCA, submitted for publication.
3 Ibid., Appendix F. 4 Ibid., Appendix G. 5 Ibid., Appendix H.
Innovative Comparison of Transient Ignition Temperature at the Booster Interface, New Stainless Steel Pyrovalve Primer Chamber
Assembly “V” (PCA) Design versus the Current Aluminum “Y” PCA Design
Regor Saulsberry, Stephen McDougle, Roberto Garcia, William Sipes, Kenneth Johnson, Steven Rickman, Ashvin Hosangadi

Introduction
• In 2008, the NASA Engineering & Safety Center (NESC) investigated four spacecraft pyrovalve anomalies that occurred during ground testing: – All had a common aluminum (Al) primer chamber assembly
(PCA) with dual NASA Standard Initiators (NSIs) – Nearly simultaneous (separated by less than 80 microseconds
(µs)) firing of both initiators failed to ignite the booster charge– The results of the assessment and associated test program
were reported in AIAA Paper AIAA-2008-4798, NESC Independent Assessment of Pyrovalve Ground Test Anomalies

Introduction
• Based on the NESC report, the Mars Science Laboratory (MSL) project team evaluated design changes to the pyrovalves: – PCAs would be made from stainless steel (SS) instead of Al– The internal flow passages would be “V” instead of “Y” shaped
• The changes had two goals:– Provide extra margin for booster charge ignition– Reduce possibility of burning through the side of the PCA

Introduction
• Empirical testing by Lockheed-Martin showed that the new design provided extra ignition margin
• The final NESC report of the ground test anomalies recommended that the two PCA types be experimentally and quantitatively compared prior to widespread application by NASA programs
Introduction
5
Normally Closed (NC) PyrovalveBlock Diagram (SS V-PCA )

• Phase I – Compare temperature at the booster charge interface for both PCA types– Use methodologies and equipment developed previously, but
improve the sapphire window sealing arrangement at the booster interface
– Perform single NSI and dual, simultaneous (<10 µs skew) NSI firings
• Phase II – Consisted of two parts to further evaluate the SS V-PCA– Phase IIA – Evaluate different NSI flow channel cross-sectional
areas with single and dual, simultaneous NSI firings– Phase IIB – Evaluate staggered NSI firing times and flow
channel cross-sectional areas This briefing is for status only and
does not represent complete engineering data analysis
6
General Test Plan

Sapphire Window Assembly
7
Underside of Booster Cover Simulator (0.003-in CRES) to be Viewed with High Speed Optical Pyrometers and Video Cameras
NOTE: Legacy Al Y-PCAShown Here

Sapphire Window System Parts
8
Sapphire Window Parts (SS V-PCA Is Shown)

Improved Sealing Ring Design
• Made from either 17-4PH or 15-5PH stainless steel• Concentric rings were cut in the sealing surface to
make a labyrinth seal• Hydro-tested to 30,000 psig with no leakage
9
Sealing Rings Shown Alongside a U.S. Dime
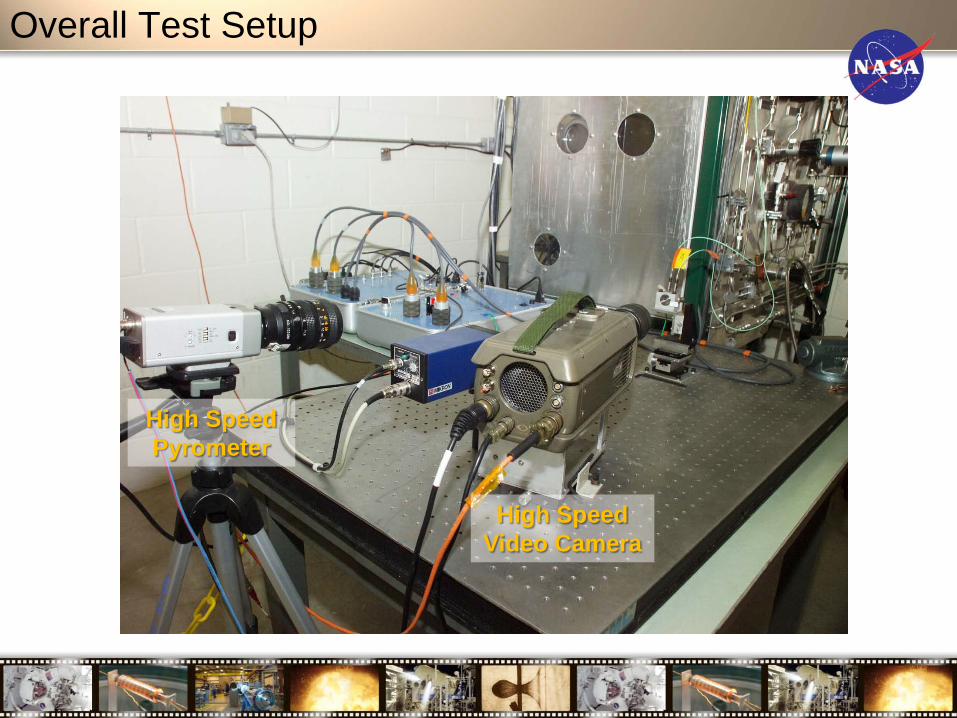
High Speed Pyrometer
High Speed Video Camera
Overall Test Setup

Data Acquisition and Control Systems
• Temperature was measured with an infrared pyrometer – Response time of 6 µs– Temperature range of 572 °F to 3632 °F
• Pressure in each NSI cavity was measured with miniature, high frequency, dynamic pressure sensors
• Firing circuitry provided variable timing with respect to firing one or both NSIs with a precision of ± 2 µs. The system provided firing current of 22 to 24 amps vs the normal NSI firing current of about 3 to 5 amps to minimize small variations in firing times
11

Data Acquisition and Control Systems
• Data was acquired at 1 to 2 MHz for either 20 or 40 ms, depending on test requirements– The data system is capable of 60 MHz– Special attention was paid to eliminate ground loops or other
interferences
• Effects on the booster cover simulator were recorded with high speed video at 20,000 frames per second
12

Phase I Test Results
Typical Results From A Single NSI Firing In An Al Y-PCA

Phase I Test Results
Typical Results From A Single NSI Firing In An SS V-PCA

Phase I Test Results
Booster Propellant Interface Temperature for Single NSI Firings

Phase I Test Results
NSI Current vs Time for All Phase I Tests

Phase I Test Results
• The average maximum temperature was 2290 °F for the SS V-PCA, but only 1391 °F for the legacy Al Y-PCA
• Each SS V-PCA test melted a hole through each booster cover simulator while the Al Y-PCA produced only very small, irregular cracks
• The SS V-PCAs produced much higher temperatures and pressures and were more likely to produce the desired penetration of the booster cover and booster charge ignition than the Al Y-PCAs
17
Booster Cover Simulator From Run # 2 Shows A Hole Typical For A Single NSI, SS V-PCA Test

Phase II Approach
• Phase IIA, SS V-PCAs with enlarged flow channels– Evaluated the improvement in energy delivered to the booster
interface– Also tested dual, simultaneous NSI firings to determine if this
failure mode is still possible if the flow channel is larger
• Phase IIB, SS V-PCAs with enlarged flow channels and staggered NSI firings (skews)– Provide further investigation of staggered NSI firings at various
area ratios
18

Phase IIA Test Results
Phase IIA Run 4, SS V-PCA with .085 in. Diameter Flow Channels

Phase IIA Test Results
Phase IIA Run 1A, SS V-PCA With .120 in. Diameter Flow Channels(Dual, Simultaneous Firing)
Temperature below detectable limit

Phase IIA Results
• One dual, simultaneous NSI firing with 4x the nominal cross-sectional area was performed
• Actual skew was 12 µs • Failed to produce enough temperature rise at the booster propellant
interface to register on the pyrometer (572 °F or more) • 1000 to 1100 °F is the estimated requirement to ignite the booster
propellant
• Three tests, one each with 1x, 2x, and 4x cross-sectional area and 16 ms skew, were performed and all produced a maximum temperature at the booster interface of 3400 °F
• Found that a short skew of 12 µs or less may fail to ignite the booster propellant even with a large flow channel diameter and the more efficient SS V-PCA design
• The pyrovalve would fail to function
21

Phase IIA Results – Sample High Speed Videos
Image No. Run No. Channel Dia
(in.)Skew (µs)
1 1A 0.120 12
2 2_1 0.120 16000
3 2_2 0.120 16000
4 3A_1 0.06 16000
5 3A_2 0.06 16000
6 4_1 0.085 16000
7 4_2 0.085 16000

Statistical Analysis and Results
• Phase I– Statement of problem was clearly developed– Size of the test project was governed by resource
considerations, but was sufficient to show clear and useful differences
• Phase II– Designed to evaluate the relationship between firing skew and
the cross-sectional area of the flow passages– It was assumed that the following model would apply:
• Y = β0 + β1 Skew + β2 Area + β12 Skew x Area + β11 Skew2 + β22 Area2
• β’s are linear regression parameters fit using the data

Statistical Analysis and Results
• Phase IIB Results– Within the tested range of the two inputs studied, no-fires are
entirely possible at low skews– A no-fire at high skew and channel area suggests that channel
area does not mitigate the risk of a no-fire, and a no-fire at more than 500 µs could occur
– Temperatures increase with increasing skew, but are fairly insensitive to channel area
– Channel area affects pressure and increases variability of the time it takes to attain peak temperature

Thermal Analysis
• Simplified and detailed thermal analyses were performed by NASA Technical Fellow for Passive Thermal and his NESC Technical Discipline Team– Convective heat transfer, by itself, does not account for the
temperature rise and melting during this testing– Deposition of liquid zirconia spray onto the booster cap results in
more heat transfer than convection alone• Zirconia deposition and the subsequent phase change from the liquid
to solid state may assist in booster cap heating and subsequent melting, but does not produce booster cap temperatures in agreement with the booster cap transient temperature response observed during testing
• Larger quantities of zirconia deposition increase the propensity to melt and accelerate the temperature rise of the booster cap bottom

Thermal Analysis
– Detailed thermal analysis suggests that a hemispherical globule of zirconium–potassium perchlorate (ZPP) with a radius of 3.6×10⁻³ in with a mass of 5.2×10⁻³ mg (1.14×10⁻⁸ lbm) can liberate sufficient energy to locally-melt through the booster cap
• Deposition of as little as 20 percent of the unburned ZPP (~4.6 mg, or 1×10⁻⁵ lbm) can liberate sufficient energy to melt the entire booster cap
• Subsequent two-dimensional axisymmetric thermal analysis shows that local melt-through can be accomplished with considerably less ZPP. From this, it is concluded that < 4.6 mg ZPP burning in contact with the booster cap is sufficient to produce the observed response

Numerical Simulations
• Numerical simulations were accomplished by CraftechIndustries, Inc.
• This numerical modeling effort, based on computational fluid dynamics, provided an improved understanding of the gas and particle flow physics within the V-PCA– One of the primary issues explored by this test project, the
dual, simultaneous NSI ignition anomaly, was explained as interaction of the shocks formed by the two NSIs and stagnation at the booster interface
– The stagnation condition and reflected waves appeared to reduce the amount of particles (hot burning) from reaching the booster membrane, causing the membrane temperature to be dramatically lower

Numerical Simulations
• Modeling of a modified V-PCA with additional chambers on either side of the flow channels
• Based on this modeling, one SS V-PCA was modified and tested– Dual, simultaneous firing– Object was to seek improved mitigation of the potential dual,
simultaneous failure mode by observing better temperature results at the booster propellant interface

Accumulation of Particles Near the Booster Cap• The mass of particles in a zone near the booster cap is plotted below
– Figure on right shows location of mass integration zone– Figure on left shows the time-varying total mass of particles in the integration zone
normalized by the mass of particles contained within a single initiator charge• After 100 ms, the dual firing case shows half the amount of particles contained in the volume
near the booster cap than the single firing case, despite having twice the amount of particles• Due to the flow reversal, fewer particles are impacting the booster cap in the dual firing scenario• Fundamental hypothesis for failure of simultaneous dual-firing still valid
Craftech

Modified SS V-PCA Test
SS V-PCA Modified with Additional Chambers

Modified SS V-PCA Test
0
200
400
600
800
1000
1200
1400
1600
1800
2000
0
5000
10000
15000
20000
25000
0 200 400 600 800 1000 1200 1400 1600 1800 2000
Tem
pera
ture
(°F
)
Pre
ssu
re (
PS
IG)
Time Referenced To Trigger Signal (µs)
Port A Pressure
Port B Pressure
Ph 2b Run 1 Port A Pressure
Ph 2B Run 1 Port B Pressure
Resonant Chamber Test Compared to a Similar Dual, Simultaneous Firing (Phase IIB, Run 1)

Modified SS V-PCA Test
• Pressure curves are very nearly identical, indicating very good correspondence between the two tests
• Although the modified SS V-PCA produced a higher temperature it is still below the threshold needed to ignite the booster powder reliably.
• Temperature rise with the modified SS V-PCA is very slow, indicating that heat transfer to the booster cover simulator is still restricted by flow stagnation
• Additional testing with larger volumes is needed

Backup Charts
33

Findings
1. The new SS design has a clear advantage over the heritage Al PCAs for single NSI firings– SS V-PCA delivered about 600 °F more energy to the booster
propellant interface that the Al Y-PCA– SS V-PCA delivered higher temperatures in approximately half the
time; 776 µs average for the SS V-PCAs versus 1342 µs average for the Al Y-PCAs
– SS V-PCA produces a 38% higher pressure on the average (as measured in the NSI cavity)
2. Dual, simultaneous (within 20 µs) firing of the redundant NSIs significantly reduces the performance of either PCA design to the point where it is doubtful the booster charge would be reliably ignited. The actual threshold for “no fire” may be higher than 20 µs skew, but no failures were observed at 250 µs skew and higher
34

Findings
3. Even with flow paths enlarged to 4 times the original cross-sectional area, test data indicates that dual, simultaneous (within 20 µs) firings of the redundant NSIs significantly reduces performance to the point where it is doubtful the booster charge would be reliably ignited
4. The assessment did not show consistent improvement with larger NSI flow channels, either with greater temperatures at the booster interface, or with a reduced probability of failure with dual, simultaneous NSI firings
35

1. When the flow path diameter and the skew are high, they exert a considerable downward effect on peak pressure. The flow paths with cross-sectional areas 2 and 4 times greater than the original design produced lower pressures in the NSI cavity. The reduction was about 1600 psi and 2400 psi, respectively. This was not unexpected due to the obviously larger free volume with the enlarged flow paths.
2. Increasing the flow passage diameter from the original 0.060-in. diameter to 0.125-in. (4 times the original cross-sectional area) lowers the maximum pressure inside of the PCA by about 2000 psi or about 21%.
36
Observations

3. A new and innovative temperature measurement method was developed and used for this assessment that is accurate to within 50 °F over a range of 572 °F to 3632 °F and has an extremely rapid response time of 10 µs or less. This may be valuable to other projects/programs.
4. SS PCA modeling was accomplished by Craftech. This not only provided a better understanding of the booster stagnation condition that results from a simultaneous NSI firing, but also suggested that additional chambers machined into the PCA might help preclude the stagnation condition and mitigate the anomaly. Fully exploring this mitigation was beyond the scope of this assessment
37
Observations

1. Further explore, through testing, the merit of chambers of larger volume as recommended by Craftech to determine if this eliminates the dual, simultaneous restriction, which could reduce mission risk
2. Both Al Y-PCA design and SS V-PCA initiator firings should be skewed by at least 2 ms to eliminate the potential for a dual, simultaneous ignition of the initiators that could cause a pyrovalve malfunction. During testing, no anomalies were noted when command skew was greater than 250 µs, but the additional skew will provide margin for minor control system variability
38
Recommendations

3. Programs should perform additional testing if closely sequenced pyrotechnic events make it desirable to reduce skew below 2 ms
4. The SS V-PCA should be used on future NASA programs for improved margin unless weight factors dictate otherwise. This is believed to be especially important for manned spaceflight applications such as on Multi-purpose Crew Vehicle (Orion)
39
Recommendations

Assessment Summary
• Dual, simultaneous NSI test results with both PCA designs failed to produce temperatures above the detectable limit of the pyrometer (572 °F)– 1000 to 1100 °F is estimated to be the minimum temperature required
to ignite the booster propellant– In both tests, the NSI hot gases and particles produced only minimal
damage to the booster cover simulator – This is a credible failure mode with either PCA design
40

Assessment Summary
41
Heritage Aluminum Design With “Y”-Shaped Flow Channel Versus MSL Stainless Steel Design with “V”-shaped Flow Channel
Posttest, Sectioned AluminumY-PCA
Posttest, Sectioned Stainless SteelV-PCA

42

Phase IIB Experiment Design
• Combination of L/D and Skew testing into one experiment makes it reasonable– For each factor level
combination, use a single PCA
– Block one day, running a set number of trials each day; run test over two days
– Randomize within blocks, holding all other sources of variability as constant as possible
43
Phase IIB Test Matrix As Performed
Phase Run Date
ChannelDiameter
(in)
ChannelCross-section
Nominal Skew (µs)
ActualSkew (µs)
2B 1 10/21/10 0.060 1X 5 62B 3 10/26/10 0.125 4X 500 4812B 4 10/26/10 0.060 1X 500 4862B 5 10/26/10 0.060 1X 500 4852B 7 11/04/10 0.060 1X 5 52B 8 11/04/10 0.088 2X 5 02B 10 11/05/10 0.125 4X 250 2432B 11 11/05/10 0.060 1X 250 2352B 12 11/15/10 0.125 4X 5 52B 13 11/16/10 0.088 2X 250 2372B 14 11/16/10 0.125 4X 500 4842B 9 11/19/10 0.088 2X 250 2422B 15 11/24/10 0.125 4X 5 52B 16 11/30/10 0.088 2X 500 4842B 17 11/30/10 0.088 2X 250 2362B 6A 12/03/10 0.088 2X 250 2502B 2B 12/08/10 0.088 2X 250 236

Phase IIB Results
Image No. Run No. Channel Dia
(in.)Skew(µs)
8 1 0.06 69 2B 0.085 23610 3 0.120 48111 4 0.06 48612 5 0.06 48513 6A 0.085 25014 7 0.06 515 8 0.085 016 9 0.085 24217 10 0.120 24318 11 0.06 23519 12 0.120 520 13 0.085 23721 14_1 0.120 48422 14_2 0.120 48423 15 0.120 524 16 0.085 48425 17 0.085 236

Phase I Test Results
45

Team Membership
This briefing is for status on does not represent comp
46
Name Discipline Organization Core Team Roberto Garcia NESC Team Lead MSFC
Regor Saulsberry NESC Assessment Lead WSTF
Stephen McDougle Deputy Assessment Lead MEI Tech, WSTF Tony Carden Electrical Engineer ERC, WSTF Ken Johnson Statistics MSFC Loutricia Johnson Program Analyst LaRC Adam Pender Propulsion Systems Lockheed Martin Asia Quince Pyrotechnics JSC Bill Sipes Pyrotechnics Devices WSTF Sandra Verba Sr. Prog Mgr Aerospace/Pyrovalves Conax Florida Corporation Consultants Saverio D'Agostino Materials and Processes JPL Carl Guernsey MSL Prop System JPL Michael Hagopian Propulsion Systems Components GSFC Masashi Mizukami MSL Prop System JPL Troy Rayner Senior Propulsion Engineer Lockheed Martin Steve Rickman Thermal Analysis Technical Fellow JSC
Robert Sadenwater Aerospace Engineering Supervisor - Pyrovalves Conax Florida Corporation
Keith Van Tassel Pyrotechnic Systems JSC Richard Webster Pyrotechnic Systems JPL Stephen Woods Propellant Physicist Jacobs WSTF Zachary Zenz Pyrovalve Design Engineer Conax Florida Corporation Administrative Support Tina Dunn-Pittman Project Coordinator LaRC/ATK Donna Gilchrist Planning and Control Analyst LaRC/ATK Erin Moran Technical Writer LaRC/ATK

Assessment Summary
• Supporting Data From Earlier Testing– Overall Legacy Al Y-PCA body of historic data, including
NESC, MSL, LM, MRO data (20 tests) • 518 µs to ignition, 475 µs standard deviation• Time referenced to start of NSI pressure rise
– MSL SS V-PCA, 12 Tests• 301 µs to booster ignition, 111 µs standard deviation

Test Matrices
• A statistical design of experiments approach was used to plan the tests – Effective use of test hardware– Random test order to reduce effects of uncontrolled variables– Some compromises had to be made for operational efficiency
and problems with the sapphire windows

49

Understanding How the Device Works
• What are the mechanisms for potential energy loss?– Thermal paths such as phase change of the aluminum– Mechanical paths such as deformation of Y-PCA body
materials might cause permanent volume increases and associated heating of the interior of the Y-PCA body.
– Kinetic Energy and Flow– Byproducts of Y-PCA materials participating with the ZPP burn
and substantially reducing the number of product moles– Incomplete burning of the ZPP in the NSI
• Energy balance analyses performed at WSTF– Gordon-McBride chemical reaction computer code
• Subject of another paper


![[DRAFT] - Hank Johnson4 (a) SHORT TITLE.—This Act may be cited as the 5 ‘‘Election Integrity Act of 2016’’. 6 (b) TABLE OF CONTENTS.—The table of contents of 7 this Act](https://static.fdocuments.net/doc/165x107/60258230136af74cf418354b/draft-hank-johnson-4-a-short-titleathis-act-may-be-cited-as-the-5-aaelection.jpg)


