Innovative Big Data Approaches for Capturing and Analyzing ... · InnovatIve BIg Data approaches...
137
Innovative Big Data Approaches for Capturing and Analyzing Data to Monitor and Achieve the SDGs
Transcript of Innovative Big Data Approaches for Capturing and Analyzing ... · InnovatIve BIg Data approaches...
Innovative Big Data Approaches for Capturing and
Analyzing Data to Monitor and Achieve
the SDGs

Acknowledgements
The present paper was drafted by Dr. Soenke Ziesche, Data Science Consultant, ESCAP ENEA. The author whishes to thank Li
Zhou, Associate Social Affairs Officer, ESCAP ENEA, Tianyi Gu, Intern, ESCAP ENEA and Charlotte Arribe, Intern, ESCAP ENEA for
their inputs into this report.
This working paper was initially prepared as a discussion paper for an expert group meeting titled Forum on Innovative Data
Approaches to SDGs held in Incheon, Republic of Korea, from 31 May – 2 June 2017, jointly organised by ESCAP East and North-
East Asia office, and ESCAP Statistics Division. At this meeting, experts from over 12 countries discussed and reviewed this
report, with feedback integrated subsequent to the meeting. The author is thankful for the inputs from the experts.
disclaimer
The designations employed and the presentation of the material in this publication do not imply the expression of any
opinion whatsoever on the part of the Secretariat of the United Nations concerning the legal status of any country,
territory, city or area, or its authorities, or concerning the delamination of its frontiers or boundaries. The opinions,
figures and estimates set forth in this publication are the responsibility of the authors, and should not necessarily be
considered as reflecting the views or carrying the endorsement of the United Nations.
Innovative Big Data Approaches for Capturing and
Analyzing Data to Monitor and Achieve
the SDGs
Table of Contents
executive summAry ···························································································································································································································· 008
introduction: sdgs, tArgets And indicAtors ··········································································································· 011
Background ········································································································································································································································································ 011
Tier classification of SDG indicators ··································································································································································································· 012
introduction: big dAtA, internet of things And ArtificiAl intelligence ··············· 015
Big data ···················································································································································································································································································· 015
Terminology and definitions ························································································································································································································ 015 Background ···································································································································································································································································· 017 Taxonomy of big data ·········································································································································································································································· 018 Opportunities ······························································································································································································································································· 019 Challenges ······································································································································································································································································· 023
Internet of Things ······················································································································································································································································· 028
Terminology and definitions ························································································································································································································ 028 Background ···································································································································································································································································· 029 Taxonomy of IoT sensors ··································································································································································································································· 029 Opportunities ······························································································································································································································································· 030 Challenges ······································································································································································································································································· 030
Artificial Intelligence ·············································································································································································································································· 032
Terminology and definitions ························································································································································································································ 032 Background ···································································································································································································································································· 032 Taxonomy of AI methods ································································································································································································································· 033 Opportunities ······························································································································································································································································· 033 Challenges ······································································································································································································································································· 034
Synergies for capturing and analysing data ··········································································································································································· 035
overview of big dAtA ApproAches ···························································································································································· 036
Background ········································································································································································································································································ 036
Structure of the overview and explanations ················································································································································································ 036

Exhaust data ······································································································································································································································································ 037
Mobile phone data ················································································································································································································································· 037 Financial transactions ·········································································································································································································································· 042 Online search and access logs ····················································································································································································································· 044 Administrative data / citizen cards ········································································································································································································· 046 Postal data ······································································································································································································································································· 048 Benefits, risks and recommendations ································································································································································································· 050
Sensing data ······································································································································································································································································ 050
Satellite and UAV imagery ······························································································································································································································· 050 Sensors in cities, transport and homes ······························································································································································································ 062 Sensors in nature, agriculture and water ························································································································································································· 066 Wearable technology ··········································································································································································································································· 071 Biometric data ······························································································································································································································································ 074 Benefits, risks and recommendations ································································································································································································· 076
Digital content ································································································································································································································································ 077
Social media data ····················································································································································································································································· 077 Web scraping ································································································································································································································································ 082 Participatory sensing / crowdsourcing ······························································································································································································ 085 Health records ······························································································································································································································································ 089 Radio content ······························································································································································································································································· 092 Benefits, risks and recommendations ································································································································································································· 094
AI applications towards SDGs without big data ································································································································································ 094
Benefits, risks and recommendations ································································································································································································· 097
key findings And AnAlysis ······························································································································································································· 098
Not suitable indicators for big data ···································································································································································································· 099
Indicators with big data approaches ································································································································································································ 099
Targets with big data approaches ········································································································································································································ 101
conclusion ································································································································································································································································ 102
references ·································································································································································································································································· 103
Annex - sdg tArgets, indicAtors And big dAtA ApproAches ················································ 108

List of Tables
Table 1 SDGs with numbers of targets, indicators and tiers ································································································································ 014
Table 2 CDR example ·············································································································································································································································· 016
Table 3 Categories and sources of big data ··············································································································································································· 018
Table 4 Types of sensors, functionalities and examples ··········································································································································· 029
Table 5 AI research topics ·································································································································································································································· 033
Table 6 Big data approaches: mobile phone data ···························································································································································· 041
Table 7 Big data approaches: financial transactions ······················································································································································ 043
Table 8 Big data approaches: Online search and access logs ···························································································································· 045
Table 9 Big data approaches: Administrative data / citizen cards ··············································································································· 047
Table 10 Big data approaches: Postal data ····················································································································································································· 049
Table 11 Big data approaches: Satellite and UAV imagery ········································································································································ 061
Table 12 Big data approaches: Sensors in cities, transport and homes ··································································································· 065
Table 13 Big data approaches: Sensors in nature, agriculture and water ······························································································ 070
Table 14 Big data approaches: Wearable technology ······················································································································································ 073
Table 15 Big data approaches: Biometric data ·········································································································································································· 075
Table 16 Big data approaches: Social media data ································································································································································· 081
Table 17 Big data approaches: Web scraping ············································································································································································· 084
Table 18 Big data approaches: Participatory sensing / crowdsourcing ··································································································· 088
Table 19 Big data approaches: Health records ·········································································································································································· 091
Table 20 Big data approaches: Radio content ··········································································································································································· 093
Table 21 Big data approaches: AI application towards SDGs without big data ··········································································· 096
Table 22 Approaches for calculation of indicators by tier category ············································································································· 099
Table 23 Approaches for calculation of indicators by SDG ······································································································································· 100
Table 24 Approaches for achievement of targets by SDG ········································································································································· 101
Table 25 SDG targets, indicators and big data approaches ····································································································································· 132

List of Abbreviations
AI
Artificial intelligence
CDR
Call detail record
CSR
Corporate social responsibility
ENEA
East and North East Asia
ESCAP
Economic and Social Commission for Asia and the Pacific
IAEG
Inter-Agency and Expert Group
IoT
Internet of things
MDG
Millennium Development Goal
M2M
Machine-to-machine
M2P
Machine-to-person
P2P
Person-to-person
SDG
Sustainable Development Goal
UAV
Unmanned aerial vehicle
InnovatIve BIg Data approaches for capturIng anD analyzIng Data to MonItor anD achIeve the sDgs
8
Executive summary
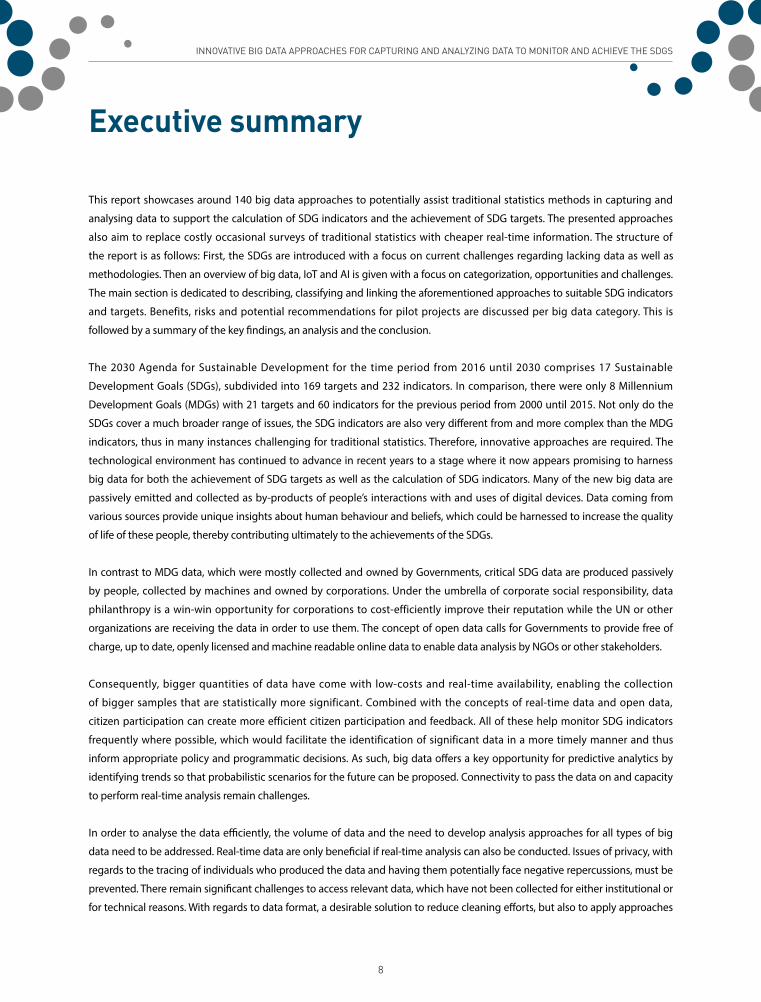
This report showcases around 140 big data approaches to potentially assist traditional statistics methods in capturing and
analysing data to support the calculation of SDG indicators and the achievement of SDG targets. The presented approaches
also aim to replace costly occasional surveys of traditional statistics with cheaper real-time information. The structure of
the report is as follows: First, the SDGs are introduced with a focus on current challenges regarding lacking data as well as
methodologies. Then an overview of big data, IoT and AI is given with a focus on categorization, opportunities and challenges.
The main section is dedicated to describing, classifying and linking the aforementioned approaches to suitable SDG indicators
and targets. Benefits, risks and potential recommendations for pilot projects are discussed per big data category. This is
followed by a summary of the key findings, an analysis and the conclusion.
The 2030 Agenda for Sustainable Development for the time period from 2016 until 2030 comprises 17 Sustainable
Development Goals (SDGs), subdivided into 169 targets and 232 indicators. In comparison, there were only 8 Millennium
Development Goals (MDGs) with 21 targets and 60 indicators for the previous period from 2000 until 2015. Not only do the
SDGs cover a much broader range of issues, the SDG indicators are also very different from and more complex than the MDG
indicators, thus in many instances challenging for traditional statistics. Therefore, innovative approaches are required. The
technological environment has continued to advance in recent years to a stage where it now appears promising to harness
big data for both the achievement of SDG targets as well as the calculation of SDG indicators. Many of the new big data are
passively emitted and collected as by-products of people’s interactions with and uses of digital devices. Data coming from
various sources provide unique insights about human behaviour and beliefs, which could be harnessed to increase the quality
of life of these people, thereby contributing ultimately to the achievements of the SDGs.
In contrast to MDG data, which were mostly collected and owned by Governments, critical SDG data are produced passively
by people, collected by machines and owned by corporations. Under the umbrella of corporate social responsibility, data
philanthropy is a win-win opportunity for corporations to cost-efficiently improve their reputation while the UN or other
organizations are receiving the data in order to use them. The concept of open data calls for Governments to provide free of
charge, up to date, openly licensed and machine readable online data to enable data analysis by NGOs or other stakeholders.
Consequently, bigger quantities of data have come with low-costs and real-time availability, enabling the collection
of bigger samples that are statistically more significant. Combined with the concepts of real-time data and open data,
citizen participation can create more efficient citizen participation and feedback. All of these help monitor SDG indicators
frequently where possible, which would facilitate the identification of significant data in a more timely manner and thus
inform appropriate policy and programmatic decisions. As such, big data offers a key opportunity for predictive analytics by
identifying trends so that probabilistic scenarios for the future can be proposed. Connectivity to pass the data on and capacity
to perform real-time analysis remain challenges.
In order to analyse the data efficiently, the volume of data and the need to develop analysis approaches for all types of big
data need to be addressed. Real-time data are only beneficial if real-time analysis can also be conducted. Issues of privacy, with
regards to the tracing of individuals who produced the data and having them potentially face negative repercussions, must be
prevented. There remain significant challenges to access relevant data, which have not been collected for either institutional or
for technical reasons. With regards to data format, a desirable solution to reduce cleaning efforts, but also to apply approaches

InnovatIve BIg Data approaches for capturIng anD analyzIng Data to MonItor anD achIeve the sDgs
9
globally towards SDG targets and indicators, would be the introduction and widespread acceptance of standardized formats
and controlled vocabularies.
It is also critical to scrutinize potential correlations, especially when analysing important and novel SDG-related data. Capacities
for data literacy are particularly needed in National Statistics Offices and, as often, tend to be less strong in developing
countries. Where the costs for the production of SDG-relevant data have been calculated, innovative big data approaches are
actually recognized as a means to save expenses on traditional statistics. Although the low costs of big data do provide an
opportunity, additional costs must be taken into account, especially when it comes to big data for development. It is estimated
bt Sustainable Development Solutions Network (2015a) that approximately US$1 billion are required yearly to enable statistical
systems to monitor the SDGs. Further costs include initial investments to sensor installations and related infrastructure as well
as the running costs for energy consumption. Moreover, Because of the large volume of the data, the likelihood of errors is not
only higher, but the errors themselves are also harder to detect.
In addition, problems remain with the indicators regarding methodology and data availability due to the innovative data types,
as well the massive amount of required data, with only one third of the SDG indicators possessing an existing methodology
and data availability to some extent. As of April 2017, progress towards the associated targets of the remaining two thirds of
the indicators can currently not be monitored. The report consequently analyses the potential offered by exhaust data, sensing
data and digital content in resolving these issues. While big data are the principal topic of this report, their potential is only
enabled through synergies with the internet of things (IoT) as well as methods of artificial intelligence (AI): The growing IoT
allows capturing numerous additional data, and innovative AI techniques allow analysing large amounts of data, often in real-
time. This report addresses the initial challenges that all three concepts are only vaguely defined and are accompanied by a not
always beneficial media hype.
One way to look at the IoT is that it aims to reduce the information gap between the world and the internet. As such, IoT is
characterized by a shift from P2P communication and decision making to M2M communication and decision making. The
key components of the IoT are sensors which detect changes in their environment and potentially quantify the extent of the
change. This enables a much more comprehensive and remote monitoring of the status of the environment, which includes
nature, human behaviour, urban settings, infrastructure, means of traffic, etc. Consequently, the IoT contributes enormously
towards big data as more and more sensors produce data and lead to more precise predictive analytics. Possible applications
range from the potentially remote management of manufacturing, infrastructure, traffic and buildings to monitoring of
environment and illegal activities.
Healthcare can benefit in two ways from IoT, namely through preventive intervention as well as through remote monitoring. To
promote accessibility and coordination, universal standards and protocols for interoperability within the IoT are needed better
sooner than later. Much concern has been expressed about security, considering what all is or is planned to be connected
to the IoT, such as household devices, means of traffic, factories or hospitals and medical sensors. Given that one promising
application of the IoT is to monitor other devices for energy efficiency, it is critical that the IoT does not waste unnecessary
energy. Moreover, IoT contributes to electronic waste due to a short lifespan and hazardous elements that are inefficiently or
not possible to be recycled, which affects developing countries in particular. Solutions for efficient energy use of the IoT and
reduction of electronic waste are critical. Overall, there have been and there are still other traditional sources for big data, but
the IoT has enormous potential to provide much more data, accurately and in real-time.

InnovatIve BIg Data approaches for capturIng anD analyzIng Data to MonItor anD achIeve the sDgs
10
Unlike big data and the IoT, the United Nations has not embraced much the field of AI yet, neither in terms of projects, nor in
terms of policies. Machine learning and deep learning offer opportunities for data mining and pattern recognition, to discover
regularities and correlations within big data and use them for conclusions, which are applicable for decision making, and
predictions about the future. The ENEA countries have been pioneers in some fields of AI, e.g. robotics, and have the capacities
to continue top-class AI research, also towards the SDGs.
Adverse effects due to AI are also starting to be identified, which include discrimination towards groups of the population and
exacerbating economic inequality. The analysis phase of the data must not become a bottleneck, which can only be prevented
through powerful AI methodologies. Moreover, the monitoring of individuals, e.g. through biometric sensors, raises privacy
concerns, which must be addressed by strict guidelines. AI safety is an area of research that focuses on exploring methods
to increase the likelihood that, if and when a machine reaches superintelligence, its behaviour is aligned with what humans
value. Therefore, it is highly desirable that such a machine values the SDGs as well as many things that humans value. While the
field is currently booming again, there is no guarantee that this will continue or that all expectations will be fulfilled. AI allows
analysing data in new ways. Overall, AI has enormous potential to analyse much more data to deliver actionable information in
real-time.
Whereas big data, IoT and AI are already individually very powerful and innovative technologies, combining them creates
further synergies, which explains the current enthusiasm about these developments and which can be also harnessed for the
calculation of SDG indicators or for the achievement of SDG targets. The United Nations has acknowledged the relevance as
well as the potential of data. In a report, called “A world that counts”, commissioned by the previous UN Secretary-General Ban
Ki-moon, it is stated: “Never again should it be possible to say ‘we didn’t know’. No one should be invisible. This is the world
we want – a world that counts.” (Independent Expert Advisory Group on a Data Revolution for Sustainable Development,
2014, p. 3). As such, the Economic and Social Commission for Asia and the Pacific (ESCAP) supports its member states in their
efforts to achieve the 2030 Agenda and also recommends the enhancement of data capacities and the harnessing of science,
technology and innovation for this purpose (United Nations Economic and Social Commission for Asia and the Pacific, 2016a;
United Nations Economic and Social Commission for Asia and the Pacific, 2016b). The ESCAP East and North-East Asia (ENEA)
sub-region covers some technologically advanced countries, thus offering a suitable environment to pioneer ground-breaking
methodologies towards the SDGs.
Because of the extreme range of topics, the 230 SDG indicators are very diverse. Three types of indicators can be identified as
not suitable for big data, namely the number or proportion of countries or governments, agreements or strategies, and financial
flows or investments or budgets. These indicators are neither about what people say or do, nor can sensors capture data about
these indicators. Big data approaches were found to assist the calculation of 42 SDG indicators, of which there are 232 in total.
Of these 232, 70 have been listed as not suitable for big data, i.e. for 26 per cent of the remaining 162 indicators approaches
that were presented, which is more than one quarter. Big data and AI approaches were found to assist the achievement of
66 SDG targets, of which there are 169 in total. This is 39 per cent, i.e. a higher percentage than the 24.5 per cent that assist
calculation of SDG indicators. In addition, big data and AI approaches were found to assist the achievement of 66 SDG targets,
of which there are 169 in total. This is 39 per cent, i.e. a higher percentage than the 24.5 per cent that assist calculation of SDG
indicators. Overall, it is recommended that the ENEA countries promote and incentivize a vibrant environment for big data, IoT
and AI, which involves the private sector, including start-ups, academic research institutions as well as NGOs to further foster
citizen participation.

InnovatIve BIg Data approaches for capturIng anD analyzIng Data to MonItor anD achIeve the sDgs
11
Introduction: SDGs, targets and indicators
BACkGrounDOn 25 September 2015, the UN General Assembly adopted resolution A/RES/70/1, entitled “Transforming our world: the 2030
Agenda for Sustainable Development” (United Nations, General Assembly, 2015). The pillars of this agenda are 17 Sustainable
Development Goals, which cover a broad range of issues related to sustainable development. The SDGs came officially into
force on 1 January 2016 and the member states aim to achieve them by 2030. Although the SDGs are not legally binding,
member states are requested to take ownership and engage in their implementation.
The SDGs are the successor of the eight Millennium Development Goals, which were the outcome of the UN Millennium
Summit and the United Nations Millennium Declaration in 2000. The MDGs had 21 targets and 60 indicators that were valid
until 2015. Towards the end of this period, in UN General Assembly resolution A/RES/68/6, entitled “Outcome document of the
special event to follow up efforts made towards achieving the Millennium Development Goals,” the commitment to achieve the
MDG’s targets was renewed and supplemented by the agreement to adopt a new set of goals building on the achievements of
the MDGs (United Nations, General Assembly, 2014). While the MDGs were directed at developing countries only, the SDGs are
universally applicable and strive for the improvement of the lives of people everywhere.
The 17 SDGs are further divided in 169 targets. As it is critical as well as challenging to measure progress and success towards
the SDGs and their targets, an Inter-Agency and Expert Group on SDG Indicators (IAEG-SDGs) was established1. The IAEG-
SDGs consists of 28 representatives of national statistical offices and the UN Statistics Division serves as the secretariat of the
group. In addition to developing 244 indicators2 after complex consultations with stakeholders, the IAEG-SDGs is mandated
to provide further technical support for the indicator and monitoring framework until 2030. Prior to this, the Sustainable
Development Solutions Network had produced a detailed report in order to contribute to the debate, also after multi-
stakeholder consultations, acknowledging that the indicators would be “the backbone of monitoring progress towards the
SDGs”. This report proposes exactly 100 Global Monitoring Indicators, complemented by national Indicators (Sustainable
Development Solutions Network, 2015b, p.7).
Of the 244 indicators, nine are identical for two or three different targets, which makes the actual total number of individual
indicators 232. The targets and indicators are not equally distributed between the goals. For example, while SDG 7 has only five
targets and six indicators and SDG 13 has only five targets and eight indicators, SDG 17 has 19 targets, the highest number, and
25 indicators, and SDG 3 has 13 targets and 27 indicators, the highest number (see Table 1).
The overall numbers illustrate that the implementation, the monitoring and the evaluation of the SDGs are much more
ambitious as well as complex than that of the MDGs. It is the responsibility of UN member states to monitor the progress
1 See here for further details and ongoing activities: http://unstats.un.org/sdgs/iaeg-sdgs/
2 See here for the latest list (as of 20 April 2017): https://unstats.un.org/sdgs/iaeg-sdgs/tier-classification/

InnovatIve BIg Data approaches for capturIng anD analyzIng Data to MonItor anD achIeve the sDgs
12
towards the implementation of the SDGs by collecting the data required for the indicators. This is impeded by the fact that
there is a correlation between how far a country is behind in achieving the SDGs and how often its capacities to provide the
relevant data are low. In other words, developed countries usually have better data than developing countries.
Not only are there many more SDG goals, targets and indicators than for the MDGs, the required data types are also very
different, which is an outcome of lessons learned from the MDG indicators. The Task Team on Lessons Learned from MDG
Monitoring of the IAEG-MDG acknowledges that “the MDG framework fostered the strengthening of statistical systems and
the compilation and use of quality data to improve policy design and monitoring by national governments and international
organizations. However, it also provides a longer list with identified weaknesses, including “inconsistencies between goals,
targets and indicators and “discrepancies between national and international data (Task Team on Lessons Learned from
MDG Monitoring of the IAEG-MDG, 2013, p. 3+). The report by the Sustainable Development Solutions Network stresses the
following lessons from the MDG indicators: “MDG data comes with too great a time lag – often three or more years – and too
often is incomplete and of poor quality (Sustainable Development Solutions Network, 2015b, p.7).
Robert Kirkpatrick, the Director of UN Global Pulse, pointed out in his presentation at the UN World Data Forum3 that MDG
data were mostly collected and owned by Governments, while critical SDG data are produced passively by people, collected
by machines and owned by corporations. This causes the challenge of data being partially not captured by traditional statistics
methods, such as through household surveys.
Almost all indicators require further elaboration regarding the rationale, sources, methods of collection and computation,
issues about disaggregation, etc. All these metadata are compiled in an ongoing process by the UN agencies or other partners
who have been assigned as the custodian for the data4.
The UN Secretary General issues an annual report on “Progress towards the Sustainable Development Goals”, which relies on
the indicators. The first report from 2016 has been released as E/2016/75 (United Nations Secretary-General, 2016). The data per
country and per indicator that inform the report are compiled in a database accessible online5.
TIEr CLASSIfICATIon of SDG InDICATorSDue to the innovative data types as well the massive amount of required data, the IAEG-SDGs acknowledges remaining
problems with the indicators regarding methodology and data availability (United Nations, Inter-Agency and Expert Group on
Sustainable Development Goal Indicators, 2015). The IAEG-SDGs assigned the 232 indicators to three tiers, which are defined as
follows:
“Tier 1: Indicator is conceptually clear and has an internationally established methodology and standards are available. In
addition, data are regularly produced by countries for at least 50 per cent of countries and of the population in every region
where the indicator is relevant.
3 Session TA2.04, “Big data innovations”: https://www.youtube.com/watch?v=upC8dEYQiz0
4 See: http://unstats.un.org/sdgs/metadata/
5 See: http://unstats.un.org/sdgs/indicators/database/
InnovatIve BIg Data approaches for capturIng anD analyzIng Data to MonItor anD achIeve the sDgs
13
Tier 2: Indicator is conceptually clear, has an internationally established methodology and standards are available, but data are
not regularly produced by countries.
Tier 3: No internationally established methodology or standards are yet available for the indicator, but methodology/standards
are being (or will be) developed or tested.”6
It is part of the tasks of the IAEG-SDGs to further develop the tier 3 indicators and to also increase the data coverage of tier 2
indicators.
Currently, there are 82 tier 1 indicators, 61 tier 2 indicators and 84 tier 3 indicators, and 5 indicators with more than one tier
assigned. This means that around one third of the indicators belong to tier 1, i.e. a methodology exists and data are to some
extent available. For the remaining two thirds of the indicators, progress towards the associated targets can currently (as of 20
April 2017) not be monitored. This constitutes a major challenge.
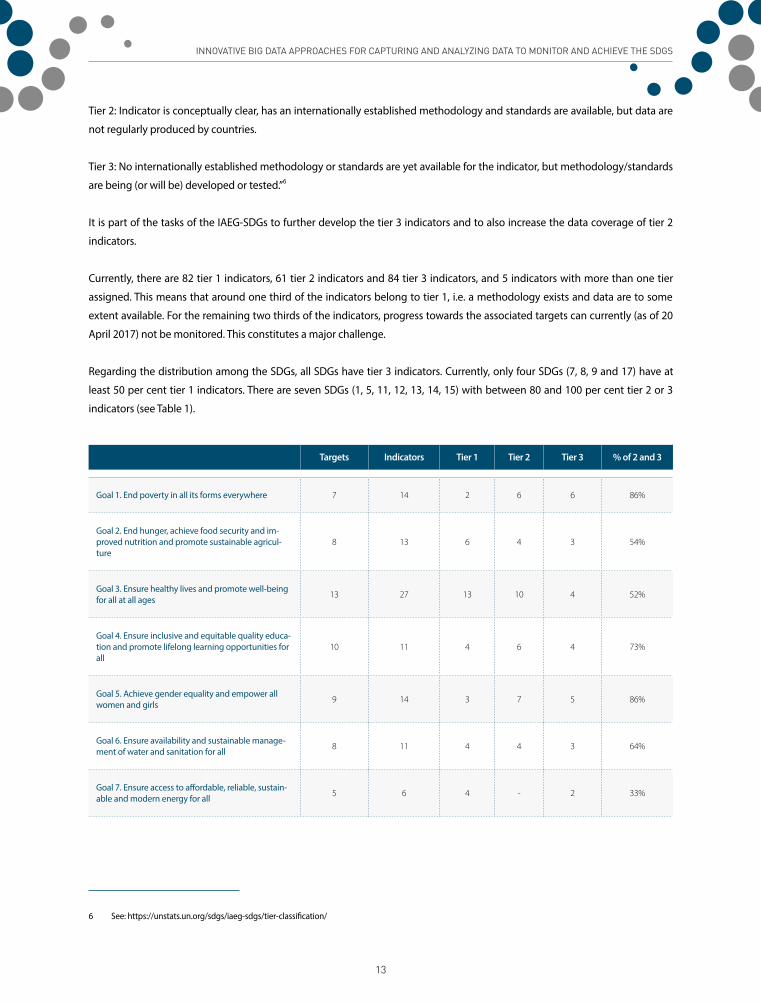
Regarding the distribution among the SDGs, all SDGs have tier 3 indicators. Currently, only four SDGs (7, 8, 9 and 17) have at
least 50 per cent tier 1 indicators. There are seven SDGs (1, 5, 11, 12, 13, 14, 15) with between 80 and 100 per cent tier 2 or 3
indicators (see Table 1).
Targets Indicators Tier 1 Tier 2 Tier 3 % of 2 and 3
Goal 1. End poverty in all its forms everywhere 7 14 2 6 6 86%
Goal 2. End hunger, achieve food security and im-proved nutrition and promote sustainable agricul-ture
8 13 6 4 3 54%
Goal 3. Ensure healthy lives and promote well-being for all at all ages 13 27 13 10 4 52%
Goal 4. Ensure inclusive and equitable quality educa-tion and promote lifelong learning opportunities for all
10 11 4 6 4 73%
Goal 5. Achieve gender equality and empower all women and girls 9 14 3 7 5 86%
Goal 6. Ensure availability and sustainable manage-ment of water and sanitation for all 8 11 4 4 3 64%
Goal 7. Ensure access to affordable, reliable, sustain-able and modern energy for all 5 6 4 - 2 33%
6 See: https://unstats.un.org/sdgs/iaeg-sdgs/tier-classification/

InnovatIve BIg Data approaches for capturIng anD analyzIng Data to MonItor anD achIeve the sDgs
14
Goal 8. Promote sustained, inclusive and sustainable economic growth, full and productive employment and decent work for all
12 17 9 4 4 47%
Goal 9. Build resilient infrastructure, promote inclusive and sustainable industrialization and foster innovation
8 12 8 1 3 33%
Goal 10. Reduce inequality within and among coun-tries 10 11 5 1 6 64%
Goal 11. Make cities and human settlements inclu-sive, safe, resilient and sustainable 10 15 2 6 7 87%
Goal 12. Ensure sustainable consumption and pro-duction patterns 11 13 1 1 11 93%
Goal 13. Take urgent action to combat climate change and its impacts 5 8 - 2 6 100%
Goal 14. Conserve and sustainably use the oceans, seas and marine resources for sustainable develop-ment
10 10 2 - 8 80%
Goal 15. Protect, restore and promote sustainable use of terrestrial ecosystems, sustainably manage forests, combat desertification, and halt and reverse land degradation and halt biodiversity loss
12 14 4 7 5 86%
Goal 16. Promote peaceful and inclusive societies for sustainable development, provide access to justice for all and build effective, accountable and inclusive institutions at all levels
12 23 6 9 8 74%
Goal 17. Strengthen the means of implementation and revitalize the Global Partnership for Sustainable Development
19 25 15 2 8 40%
Total 169 2441 882 70 93 66%
Table 1: SDGs with numbers of targets, indicators and tiers
Unavailability of data, as expressed by tier 2 category, is often linked to lack of financial means and capacities of national
statistics systems, which need to be addressed by the international community, or innovative approaches have to be taken to
bypass or leapfrog these issues.
Lastly, it has to be mentioned that measurability issues first start with the targets. An independent scientific review of the SDG
targets concluded that “out of 169 targets, 49 (29 %) are considered well developed, 91 targets (54 %) could be strengthened by
being more specific, and 29 (17 %) require significant work” (International Council for Science and International Social Science
Council, 2015, p. 6). As such, one of the main identified issues are targets that are not quantified. To identify indicators for such
targets is particularly challenging.

InnovatIve BIg Data approaches for capturIng anD analyzIng Data to MonItor anD achIeve the sDgs
15
Introduction: big data, internet of things and artificial intelligence
BIG DATA
terminology and definitions
Big data has been a buzzword for some years now, yet a universal definition is still lacking. The question that comes up is what
amount of data is considered to be of “normal” size and what is the threshold that an amount is considered as “big data”? And
is it appropriate to assume that the amount of data, which nowadays qualifies to be called “big data” will in some years not be
considered as “big” anymore? In 2015, the member states of the ITU agreed on the following definition:
“A paradigm for enabling the collection, storage, management, analysis and visualization, potentially under real-time
constraints, of extensive datasets with heterogeneous characteristics. (International Telecommunication Union, 2015)
It is hard to quantify the amount of available data in the world. One estimate states that every day 2.5 quintillion7 bytes of data
are created8, which means that 90 per cent of the data globally today has been created only in the last two years. Even if these
estimates are vague, they illustrate that these are for humans almost unimaginable amounts of data, thus sometimes referred
to as a “data tsunami. The handling of such unprecedented volumes of data is a challenging task.
Already in 2001, an often-cited characterization of big data was first used, the so-called 3Vs (Laney, 2001): Volume (referring to
the amount of data), Variety (referring to the different types and sources), Velocity (referring to the often real-time availability).
One of the major implications of the availability of big data is described by Mayer-Schönberger and Cukier (2013). It used to be,
due to costly data collection, common scientific practice to analyse samples of data, i.e. a subset of a larger data set, in order
to come to conclusions about the whole dataset. Current availability of vast amounts and often cheap data makes samples
obsolete, which stands for a drastic change in scientific work.
This is linked to the other disruptive development, which is that correlation dominates now often causality. For example, an
online shop, which analyses that customers who buy item A often also buy item B, is satisfied by identifying this correlation
(and as a consequence would advertise item B to a customer, who is about to purchase item A) and would not question any
causation between buying item A and item B. Mayer-Schönberger and Cukier (2013) put it as follows: “Causality won’t be
discarded, but it is being knocked off its pedestal as the primary fountain of meaning.” (Mayer-Schönberger and Cukier, 2013,
p. 68). Already in 2008 Anderson (2008) predicted in a seminal article a radical change of established scientific methods due to
big data (see also Apophenia).
7 One quintillion = 1018
8 See here: http://www.vcloudnews.com/every-day-big-data-statistics-2-5-quintillion-bytes-of-data-created-daily/

InnovatIve BIg Data approaches for capturIng anD analyzIng Data to MonItor anD achIeve the sDgs
16
As will be shown later, this insight is harnessed to capture not easily observable data for SDG indicators. A relevant term is
proxy. A proxy indicator is used as a substitute for another indicator if 1) the latter one is hard to observe, 2) the proxy indicator
is easier to observe and 3) there is a close correlation between the two indicators.
The above point is a result of the unprecedented “volume” of big data, with the “variety” of the data also being unique. Many of
the new big data are, according to Kirkpatrick, linked to the continuous observation of human behaviour9. They are passively
emitted and collected as by-products of people’s interactions with and uses of digital devices, which provide unique insights
about their behaviours and beliefs.
Pentland, one of the pioneers in big data, illustrates the new opportunities as follows: “It’s the little data breadcrumbs that you
leave behind you as you move around in the world. What those breadcrumbs tell is the story of your life. Who you actually
are is determined by where you spend time, and which things you buy. Big data is increasingly about real behaviour, and by
analysing this sort of data, scientists can tell an enormous amount about you. They can tell whether you are the sort of person
who will pay back loans. They can tell you if you’re likely to get diabetes. They can do this because the sort of person you are
is largely determined by your social context, so if I can see some of your behaviours, I can infer the rest, just by comparing you
to the people in your crowd.10 What is not mentioned in this scenario is that currently still many people do not produce data
breadcrumbs, as they are not interacting with devices that record these data. And these are people often the ones targeted in
particular by the SDGs (see Access - missing million ).
Finally, an example is provided to illustrate how such data breadcrumbs can actually look like. One of the prime instances of
passively produced data in daily lives of people are Call Detail Records (CDR), which are collected after every mobile phone call.
Data type Value
Caller ID 968AYQ11N
Caller ID tower location 8°13' 13.14", 18°53' 44.29
Recipient ID GHJ56EF20
Recipient ID tower location 7°16' 22.18", 41°45' 22:03"
Call time 2016-10-14T18:36:23
Call duration 04:33:12
Table 2 CDR example
While Table 2 is mostly self-explanatory, except for the irrelevant encryptions, it may also illustrate the task to extract something
useful from vast amounts of such data, which will be described later.
9 Session TA2.04, “Big data innovations”: https://www.youtube.com/watch?v=upC8dEYQiz0
10 See: https://www.edge.org/conversation/reinventing-society-in-the-wake-of-big-data

InnovatIve BIg Data approaches for capturIng anD analyzIng Data to MonItor anD achIeve the sDgs
17
background
Whereas big data approaches were embraced in numerous environments, particularly in the corporate sector, the focus here is
how big data approaches were adopted by the United Nations.
The first milestone was the formation of the UN Global Pulse labs in New York in 2009 and later also in Jakarta and in Kampala.
These labs have launched various big data projects for development11, many of which are linked to SDGs and will be described
later. An influential publication by UN Global Pulse is Big Data for Development: Challenges and Opportunities (United Nations
Global Pulse, 2012)
Another important step was when the previous UN Secretary-General Ban Ki-moon commissioned an Independent Expert
Advisory Group to report on how the “data revolution could support sustainable development. This report, called “A world
that counts, was published in 2014 (Independent Expert Advisory Group on a Data Revolution for Sustainable Development,
2014). It recommends the harnessing big data guided by the following nine key principles: Data quality and integrity, data
disaggregation, data timeliness, data transparency and openness, data usability and curation, data protection and privacy, data
governance and independence, data resources and capacity and data rights (Independent Expert Advisory Group on a Data
Revolution for Sustainable Development, 2014, p. 22-23).
In terms of institutions, the Statistical Commission of the UN Department of Economic and Social Affairs established a Global
Working Group on Big Data for Official Statistics12 with the objective to explore the benefits and challenges of Big Data.
Moreover, the UN organized significant events on this topic. The Statistical Commission annually holds the Global International
Conference on Big Data for Official Statistics13. In 2015, ESCAP organized the meeting “Big Data and the 2030 Agenda for
Sustainable Development: Achieving the Development Goals in the Asia and the Pacific Region, which was critical for the
region14.
The most recent relevant summit was the UN World Data Forum in Cape Town in January 2017. At this forum, new approaches
and tools for the unprecedented demand of accurate, timely and disaggregated data were discussed. The main outcome of the
forum was a “Global Action Plan for Sustainable Development Data15, which identified the following six strategic areas:
• Coordination and strategic leadership on data for sustainable development
• Innovation and modernization of national statistical systems
• Strengthening of basic statistical activities and programmes, with particular focus on addressing the monitoring needs of
the 2030 Agenda
• Dissemination and use of sustainable development data
• Multi-stakeholder partnerships for sustainable development data
• mobilization of resources and coordination of efforts for statistical capacity building.
11 See an overview here: http://www.unglobalpulse.org/projects
12 See: http://unstats.un.org/bigdata/
13 See: http://unstats.un.org/bigdata/meetings.cshtml
14 See: http://www.unescap.org/events/call-participants-big-data-and-2030-agenda-sustainable-development-achieving-development
15 See: http://undataforum.org/WorldDataForum/launch-of-the-cape-town-global-action-plan-for-sustainable-development-data/

InnovatIve BIg Data approaches for capturIng anD analyzIng Data to MonItor anD achIeve the sDgs
18
taxonomy of big data
It is essential to structure the various big data approaches. Here, three categories are used, as established by Letouz (Data-Pop
Alliance, 2015c):
• Exhaust data: Passively collected data from people’s use of digital services such as mobile phones, financial transactions or
web searches.
• Sensing data: Actively collected data from sensors, e.g. in smart cities or from wearables and also through remote sensing
and satellite images.
• Digital content: Open web content actively produced by people such as social media interactions, news articles, blogs or job
postings. Unlike exhaust and sensing data, this is digital content intentionally edited by somebody, i.e. subjective or even
deceptive, depending on the intentions of the author.
Kirkpatrick distinguishes only two categories for big data on the top level16: What people say and what people do. What people
say corresponds to the above category “digital content, while what people do combines “exhaust data and “sensing data. But it
makes sense to separate these categories:
• Sensing data are collected for a specific purpose; otherwise that sensor would not be there or not be activated. Sensing data
can also be described as data which are captured by the IoT. In contrast, exhaust data are collected permanently and have
initially no primary function, until potentially being exploited in a “big data project”.
• Moreover, sensors collect more than human activities, e.g. animal’s behaviour, water quality etc.
However, in some cases the distinction between sensing data and exhaust data is not fully clear.
Another distinction is made between unstructured and structured data. Structured data corresponds with the above categories
of exhaust and sensing data, because, despite being potentially large, these data are binary or numeric values and can be stored
and categorized in specific fields of a well-defined database. Unstructured data is (often) digital content, which can include text
as well as multimedia content such as images, videos or audio. These data cannot be used before interpretation or analysis.
The type of data is relevant regarding the potential approach of artificial intelligence, which is applied for interpretation or
analysis, e.g. natural language processing for texts, object recognition for images etc.
The second level of the taxonomy is the source of the data within the above categories, which are listed in Table 3 and will be
explained in detail later.
Category Source
Exhaust data Mobile phone data / Financial transactions / Online search and access logsAdministrative data / citizen cards / Postal data
Sensing data Satellite and UAV imagery / Sensors in cities, transport and homesSensors in nature, agriculture and water / Wearable technology / Biometric data
Digital content Social media data / Web scraping / Participatory sensing / crowdsourcingHealth records / Radio content
Table 3 Categories and sources of big data
16 Session TA2.04, “Big data innovations”: https://www.youtube.com/watch?v=upC8dEYQiz0

InnovatIve BIg Data approaches for capturIng anD analyzIng Data to MonItor anD achIeve the sDgs
19
opportunities
Big data has generated lots of attention because it offers numerous opportunities as will be described below, with a focus on
opportunities regarding the SDGs. Further down, it will also be shown that several of these opportunities are (at least for the
moment still) linked to challenges. It remains to be seen if and how this will change over time. Various opportunities are caused
by the main characteristics of big data volume, variety and velocity as described above and are also partly linked to each other.
▶▶ Access - deluge of data
As mentioned earlier, the quantity of available data is higher than ever before and continues to rise. This includes data that
could previously not at all or not efficiently be accessed and collected. Innovative data sources address the SDG slogan “leaving
no one behind in particular. For example, satellite images17, mobile phone and internet data provide information on regions
in the world, which was often not available before. In Tourangeau et al. (2014), the challenges to survey populations with
conventional methods are summarized. Therefore, the high volume of additional data obtained through new sources is a major
benefit compared to traditional statistics. Yet, the coverage is still not satisfying (see Access - missing million ).
In addition to the unprecedented volume of data, the advanced variety of sources is also advantageous since it makes
triangulation easier, which is the recommended validation of data through cross verification from two or more sources.
▶▶ Access - data philanthropy
This point has been and to some extent continues to be a challenge, but it is progressively turning into an opportunity.
Kirkpatrick pointed out at the World Data Forum that MDG data were mostly collected and owned by Governments, while
critical SDG data are produced passively by people, collected in real-time by machines and owned by corporations18. The data
he is referring to are mainly the above mentioned exhaust data, e.g. mobile phone data or data from financial transactions.
The challenge to get access to these data has been turned into a win-win opportunity: Several corporations have created a
branch called “data philanthropy within their corporate social responsibility (CSR) activities, through which the data are shared
for public benefit. This does not cost the corporations much or anything, but may polish their reputation. And the UN or other
organizations are receiving the data in order to use them, for example for calculation of SDG indicators or for the achievement
of SDG targets.
Since this term emerged at the World Economic Forum in Davos in 2011, UN Global Pulse has been one of the driving forces19,
while at the same time protecting individual privacy (see Privacy). They convinced companies of this additional component
of CSR, which previously were mostly comprised of donations of goods, services or volunteer time. At the World Data Forum,
Kirkpatrick also highlighted that data philanthropy is thriving and has become a “global movement”,even leading to the
creation of the new job title “Data Philanthropy Manager”20. In addition, to improve the image of a company because of CSR,
UN Global Pulse also points out that data philanthropy has a potentially positive impact on their business: If these data provide
information as proxy indicators about increased costs of living or displacement after a disaster, they could be used to alleviate
17 Satellite images are not innovative per se, but coverage and quality have increased and especially mechanisms for analysis have improved.
18 Session TA2.04, “Big data innovations”: https://www.youtube.com/watch?v=upC8dEYQiz0
19 See: http://www.unglobalpulse.org/blog/data-philanthropy-public-private-sector-data-sharing-global-resilience
20 Session TA2.04, “Big data innovations”: https://www.youtube.com/watch?v=upC8dEYQiz0

InnovatIve BIg Data approaches for capturIng anD analyzIng Data to MonItor anD achIeve the sDgs
20
the situation, which ultimately may improve the economic situation of the concerned customers21.
Examples for success stories include the following: In 2016 Twitter, which holds crucial social media data, agreed on a
partnership with UN Global Pulse that will provide the UN with access to their data to support the achievement of the SDGs22.
United Parcel Service, which also participates in data philanthropy, called at the World Data Forum for a donation of not only
data, but also for donation of data scientists (see Capacities and data literacy) and technology. An example for the latter is
provided by ESRI for the SDGs, as announced in 2017, which is their geographic information system23.
An initiative that goes a step even further is the OPAL (Open Algorithm) project. It is a partnership with corporations and
other organizations who provide “open technology platform and open algorithms running directly on the servers of partner
companies, behind their firewalls, to extract key development indicators of relevance for a wide range of potential users,
including national statistical offices, ministries, civil society organizations, media organizations”24. By getting access to the
code, concerns that data are manipulated before being shared will be addressed, i.e. the accountability will be potentially
strengthened. The OPAL project supports further open data in general (see Open data) as well as citizen participation (see
Citizen participation) and data literacy (see Capacities and data literacy) as people are encouraged to examine the data as well
as the code.
▶▶ Low costs
With traditional statistics, there is not only the challenge that some data cannot be accessed at all, but also often those data,
which are accessible, are expensive to collect (United Nations Global Pulse, 2016, p. 54+). As a result of these costs, sometimes
only smaller samples are collected althougha bigger sample would be statistically more significant.
The Sustainable Development Solutions Network estimates that approximately US$1 billion per year are required to build
strong statistical systems for SDG monitoring (Sustainable Development Solutions Network, 2015a). This amount is very high
because, on the one hand, the SDG indicators are numerous and complex, and on the other, the capacities of national statistical
offices in developing countries are often low.
Compared to that, many big data are cheaper and are sometimes literally “exhaust, as described above. Therefore, money is
often no issue regarding neither the sample size25 nor the collection of data from multiple sources for triangulation (see Access
- deluge of data).
Still there are additional costs, especially regarding big data for the monitoring of the SDG indicators, which are explained
below (see Financing big data for SDGs). Since, as mentioned, relevant big data are nowadays often collected by corporations,
it (costs?) also depends on their generosity to provide the data (see Access - data philanthropy).
21 See: http://www.unglobalpulse.org/big-data-partnerships-for-sustainable-development
22 See: http://www.un.org/apps/news/story.asp?NewsID=55075#.WKlX4xDHTRp
23 See: https://blogs.esri.com/esri/esri-insider/2017/01/11/gis-provides-an-open-platform-for-global-engagement-on-the-sustainable-development-goals/
24 See: http://www.data4sdgs.org/dc-opal/ and http://datapopalliance.org/open-algorithms-a-new-paradigm-for-using-private-data-for-social-good/
25 As described above. See Mayer-Schönberger and Cukier (2013).

InnovatIve BIg Data approaches for capturIng anD analyzIng Data to MonItor anD achIeve the sDgs
21
▶▶ Real-time availability
This opportunity is linked to the third “V, “velocity, introduced above. Surveys constitute the main tool and source for data in
traditional statistics, especially in developing countries, which are conducted sometimes only every few years and are often
expensive and time-consuming. In contrast, many types of big data are generated constantly and in real-time. Also called
“nowcasting, as opposed to “forecasting (see Predictive analytics), the advantage of this approach is that it allows for quick
corrective action if required, i.e. there is a real-time “feedback loop”. And this could lead to a cost reduction because of timely
interventions in case something goes wrong.
This could also be beneficial for the SDGs. If SDG indicators are monitored where possible frequently and more than just on
an annual basis or less often, something not on track could be noticed in a more timely manner and thus inform appropriate
policy and programmatic decisions. Real-time data can also provide early warning information, e.g. for potential disasters, food
shortages or epidemics26.
The above scenario is subject to the question of whether or not the two following challenges can be mitigated: Connectivity is
required to pass the data on (see Connectivity and technical issues), and capacities are required to effectively perform real-time
analysis (see Analysis) seing as real-time data alone are insufficient to take any action.
In addition to real-time exhaust and sensing data, real-time digital content produced by committed citizens is also relevant.
For example, people provide input through participatory sensing for early warning or disaster information. Or Government
projects can receive real-time comments from concerned citizens (see Citizen participation), which allows for a much more
accelerated feedback loop.
▶▶ Predictive analytics
While the general challenges of data analysis will be described below (see Analysis), better predictive analytics is a key
opportunity thanks to big data. Analytics can have different purposes, e.g. to describe or to explain. Predictive analytics is about
forecasting what will happen next. Based on increasing or decreasing numbers, trends can be identified and probabilistic
scenarios for the future can be proposed. It may be possible to determine whether a situation is improving or deteriorating
over time and whether any risks are emerging.
The 3Vs of big data provide a boost to predictive analytics because it is more precise when more data are available (Volume,
Variety) and it can be continuously updated when real-time data are provided (Velocity) (see Real-time availability).
Applications related to the SDGs are imaginable in a range of areas, from predicting food insecurity to volume of traffic in smart
cities, provided relevant data are accessible.
▶▶ Open data
Open data is a concept, mostly calling for Governments, to make data available 1) online, 2) up to date, 3) free of charge, 4)
openly licensed and 5) machine readable27. The last two points are relevant for republishing and reusing the data legally as
well as effectively, which is a crucial part of open data. By a similar movement, the Data FAIRport initiative also introduces the
26 Data-Pop Alliance issued a detailed report how big data can impact disaster resilience and risk reduction (Data-Pop Alliance, 2015a).
27 See: http://opendefinition.org/od/2.1/en/

InnovatIve BIg Data approaches for capturIng anD analyzIng Data to MonItor anD achIeve the sDgs
22
acronym FAIR, which stands for findable, accessible, interoperable and reusable28.
While there may not necessarily be a causal relation between big and open data, ,since many big data are not open and many
open data are not big, there is a temporal relation as the open data movement started around the same time.
Open data is mentioned here since it is not only desirable for as many big data as possible to be openly available, but it is also
an opportunity for achieving the SDGs. If Governments do not have the capacity (or sometimes creativity) to analyse the data
citizens (see Citizen participation), NGOs or companies could complement the Governments in identifying trends and patterns
and making individual data-driven decisions that positively affect various areas of life, including the SDGs.
The World Wide Web Foundation issues an annual Open Data Barometer that ranks countries on “Readiness for open data
initiatives, implementation of open data programmes, [and the] impact that open data is having on business, politics and civil
society”29. The NGO Open Data Watch issued an Open Data Inventory, which provides “a comprehensive review of the coverage
and openness of official statistics in 173 countries”30. The Open Data Institute published a report on how open data can
support sustainable development since it can “i) more effectively target aid money and improve development programmes,
ii) track development progress and prevent corruption, and iii) contribute to innovation, job creation and economic growth”
(Open Data Institute, 2015, p. 4). Various country Governments31, but also municipalities32, have been responsive to these calls
and created open data portals.
▶▶ Citizen participation
The two features introduced above that came with big data, real-time availability and open data (see Real-time availability and
Open data) offer new opportunities for more efficient citizen participation, which also means more democracy. Social media
offer channels for everybody, unless restricted by Governments, to provide real-time feedback to Government activities. The
Overseas Development Institute (2015) describes two directions as follows: The data revolution will need to be both top down,
with new checks, balances and legal frameworks (and the institutional capacity to realise them), and bottom up, as citizens
create, access and analyse data in innovative ways, and use those data to hold governments, the private sector and donors to
account.” (Overseas Development Institute, 2015, p. 8).
Therefore, in addition to providing feedback, grassroots movements have been started to further two data-related activities to
improve quality of life and the SDGs in particular:
• Citizens work with the newly available data, i.e. analyse the data and search for new beneficial insights. One NGO in this field
is DataKind33.
• Citizens generate their own data. One initiative in this field is DataShift, which aims to “produce and use citizen-generated
28 See: http://www.datafairport.org/ and https://www.force11.org/group/fairgroup/fairprinciples
29 See: http://opendatabarometer.org/barometer/
30 See: http://opendatawatch.com/monitoring-reporting/open-data-inventory-2016/
31 See e.g.: http://open.canada.ca/en
32 See e.g.: https://data.london.gov.uk/
33 See: http://www.datakind.org/

InnovatIve BIg Data approaches for capturIng anD analyzIng Data to MonItor anD achIeve the sDgs
23
data to monitor sustainable development progress, demand accountability and campaign for transformative change34.
DataShift has also participated in the World Data Forum35. These activities are called participatory sensing or crowdsourcing
and further projects are described later (see Participatory sensing / crowdsourcing).
Also, this opportunity is linked to a challenge (see Capacities and data literacy) since some of these activities require skills, in
particular skills related to new technologies. Therefore, only a limited number of people, including trainers,, currently have these
skills, particularly in developing countries. Nevertheless, data analysis can at least be done remotely thanks to the internet.
challenges
While big data offer various opportunities, there are also many challenges from very different directions, which are also partly
linked to each other or to the listed opportunities.
▶▶ Analysis
As previously noted, the availability and collection of big data is only the first step of a process, which by itself would be mostly
futile without the follow-up analysis of the data. Analysis is not only necessary, but also much more challenging than the data
collection, which, as explained, sometimes consist of just data exhaust. Already in 2006, the UK mathematician Clive Humby
called data the “new oil” and explained it by stating: “It’s valuable, but if unrefined it cannot really be used. It has to be changed
into gas, plastic, chemicals, etc to create a valuable entity that drives profitable activity; so must data be broken down, analysed
for it to have value.”36 One of the pioneers in the field of big data, Harvard University professor Gary King, describes the current
development as follows: Big data is not actually about the data. The revolution is not that there’s more data available. The
revolution is that we know what to do with it now. That’s really the amazing thing.37
This means the raw data have to be transformed from various formats into actionable information that informs intelligent
decisions. United Nations Global Pulse (2016) gives the following development-oriented definition for data analytics:
Organization and integration of multiple sources of data, and the application of data science and data analytics to find
previously undiscovered patterns and associations in the data, and to predict outcomes of development interventions.” (United
Nations Global Pulse, 2016, p. 34).
Two kinds of challenges can be identified for the analysis of big data:
1. To handle the enormous amount of big data (Volume of big data)
Except from having benefitted recently from developments in AI, data analysis is clearly not a new discipline and has been
performed for a long time. The new challenge is to find ways to analyse vast and ever increasing amounts of data. The current
consequence is that a large amount of collected and potentially relevant data is not analysed at all38.
34 See: http://civicus.org/thedatashift/
35 See: http://undataforum.org/WorldDataForum/wp-content/uploads/2017/01/ta4.09_HannahWheatley.pdf
36 See: http://ana.blogs.com/maestros/2006/11/data_is_the_new.html
37 See: https://www.washingtonpost.com/blogs/post-live/wp/2016/05/05/meet-professor-gary-king/?utm_term=.f7b6ac749300
38 See e.g.: https://www.theguardian.com/news/datablog/2012/dec/19/big-data-study-digital-universe-global-volume

InnovatIve BIg Data approaches for capturIng anD analyzIng Data to MonItor anD achIeve the sDgs
24
2. To develop analysis approaches for all types of big data (Variety of big data)
Depending on the introduced types of the raw data, distinct procedures for analysis have to be applied with different degrees
of difficulty and complexity. Searching for unknown correlations in structured tables of numbers differs from analysing
unstructured text or from recognizing faces on pictures, etc. For example, , in addition to the overall challenge to interpret
language, a challenge for the analysis of digital textual content is that it often contains emotions which are relevant to
recognize. As described in United Nations Global Pulse (2012), the technique for this is called sentiment analysis. Seeing as
social media posts and blogs are an important source of big data, it is critical to have ways to identify whether the author
is expressing happiness,unhappiness or any of many other possible emotions. For several of these analyses, there are tools
provided through new developments in AI (see Artificial Intelligence).
Addressing these two challenges is important for not impeding the opportunity of having real-time data through an “analysis
bottleneck. Real-time data are only beneficial if real-time analysis can also be conducted.
▶▶ Privacy
Privacy of data has been a controversial issue even before the advent of big data, which has only increased this challenge. As
previously described, a large part of the new big data is produced actively or passively by people. This is desirable since these
data provide insights about human behaviour, which could be harnessed to increase the quality of life of these people, thereby
contributing ultimately to the achievements of the SDGs. However, the tracing of individuals who produced the data and
having them potentially face negative repercussions must be prevented. It is a fundamental human right as well as a pillar of
democracy for individuals to control what actively or passively produced information about them is disclosed.
With regards to this issue, UN Global Pulse has acted as a pioneer by developing a set of data privacy and data protection
principles39. These principles focus on data towards the SDGs in particular and are aimed to ensure the individual privacy of the
data. Every organization and individual who works on big data in general, and towards the SDGs in particular, ought to observe
these principles. While this is a laudable initiative, further institutional frameworks to protect privacy of data, on the national as
well as on the international level, are still lacking.
▶▶ Access - missing million etc.
While access to new data sources was also mentioned as an opportunity (see Access - deluge of data and Access - data
philanthropy), there still remain significant challenges to access relevant data, which have not been collected for either
institutional or for technical reasons. This phenomenon has been described as “digital divide. There are at least two dimensions
of a digital divide, namely between countries, i.e. some countries are technologically better equipped than others, and within
countries, i.e. some people in a country are technologically better equipped than others in the same country. In the report “The
data revolution - Finding the missing millions, these challenges are elaborated and it is pointed out that often Governments do
not adequately know their own people. This is particularly true for the poorest and most marginalized.” (Overseas Development
Institute, 2015, p. 7). According to this report, around 350 million people globally are not covered by household surveys. This is
a concerning number considering the fact that the SDGs have been drafted without having baseline data about these people.
As a solution to tackle this issue, the Overseas Development Institute (2015) advocates to work on further big data approaches.
Another access challenge is constituted by organisations that may have data available, but do not share them openly, which
39 See: http://www.unglobalpulse.org/privacy-and-data-protection.

InnovatIve BIg Data approaches for capturIng anD analyzIng Data to MonItor anD achIeve the sDgs
25
could be for institutional or technical reasons, or even deliberately publish inaccurate data.40
Yet, a different access problem is linked to the fact that new and useful information is often gained by analysing data from
different sources, which is also called “data mashup or “data fusion. An obstacle for potentially beneficial mashups is when
the base data are in so-called “silos, i.e. isolated islands of data, preventing them from being analysed together. This could
be because the people who have access to the respective silos do not know about each other or do not communicate.
For example, they may work in different organizations or simply in different departments of the same institution, but data
exchange between them has not been institutionalized.
It has been acknowledged that this issue exists also within the UN and a blog called “Silo Fighters has been created to address
it and strive for integrated solutions41. Data silos may also be a challenge for relevant SDG data because the custodians of the
data are from a variety of organizations, among which, as described, data collaboration may not have been institutionalized
as desired. In the overview below, various approaches are introduced that rely on data mashups to tackle SDG targets or
indicators (see Overview of big data approaches).
▶▶ Cleaning/preparing data and lack of standards
Another challenge is often the cleaning of data. Cleaning encompasses the process of converting data to a format, which
allows analysing them, i.e. the mandatory precondition for the analysis. This applies mostly to the big data category of
unstructured data, which comprises text and multimedia content, such as videos, photos, audio files. They are the opposite of
structured data, which are stored directly in fields in a database. However, structured data are not necessarily “clean” right away.
Misspellings, different Latin spellings of names and locations in countries with another alphabet or different formats of dates
are only a few examples that often require cleaning of structured data. A reason for uncleanliness is that the data were not
collected or sampled with the explicit intention of drawing conclusions from them as it often the case with big data.
Data cleaning is often carried out manually, i.e. in an inefficient manner. A survey among data scientists revealed that cleaning
big data is not only their least enjoyable task by far, it is also the most time-consuming. The extent of this bottleneck is
illustrated by the finding that Data Scientists spend 60 per cent of their time on cleaning and organizing data42. Only nine per
cent is spent on “mining data for patterns”, i.e. the critical analysis part.
A desirable solution to reduce cleaning efforts, but also to apply approaches globally towards SDG targets and indicators,
would be the introduction and widespread acceptance of standardized formats and controlled vocabularies.
▶▶ Data disaggregation
The Report of the Inter-Agency and Expert Group on Sustainable Development Goal Indicators states:
“Sustainable Development Goal indicators should be disaggregated, where relevant, by income, sex, age, race, ethnicity,
migratory status, disability and geographic location, or other characteristics, in accordance with the Fundamental Principles of
40 See: https://www.ft.com/content/0361c1a4-bcfe-11e6-8b45-b8b81dd5d080
41 See: http://www.silofighters.org/
42 See: http://www.forbes.com/sites/gilpress/2016/03/23/data-preparation-most-time-consuming-least-enjoyable-data-science-task-survey-says/#78e1f9787f75

InnovatIve BIg Data approaches for capturIng anD analyzIng Data to MonItor anD achIeve the sDgs
26
Official Statistics. (United Nations, Inter-Agency and Expert Group on Sustainable Development Goal Indicators, 2015, p. 7)
Data disaggregation is seen as a requirement to fulfil the slogan of the 2030 Agenda for Sustainable Development, which is to
“leave no one behind. Yet, the mainstreaming of data disaggregation still has a long way to go in many areas as these examples
show: “Only 41% of countries regularly produce data on violence against women. Only 13% of countries have a dedicated
gender statistics budget.” (United Nations World Data Forum, 2017, p. 2)
Sex-disaggregated data are of particular importance for the achievements of the SDGs as they are “critical to the better
understanding of the causes of gender gaps and to the better design and evaluation of actions to address them” (United
Nations Secretary-General’s High-Level Panel on Women’s Economic Empowerment, 2016, p. 10).
One UN Foundation-led initiative that addresses this challenge is Data2X43, which provides technical and advocacy support on
gender data. In a common project with UN Global Pulse and the University of Leiden, they also developed a tool for real-time
sex-disaggregation of social media posts, an important source of big data, in order to demonstrate that women and men have
different concerns related to sustainable development44.
▶▶ Apophenia
As described above, “correlation instead of causality” is one of the main innovative themes that came with big data. This theme
is very powerful and thanks to it numerous new insights have been found. Nevertheless, it holds the challenge of seeing
patterns where none exists. This phenomenon is called “apophenia”.
For example, Google Correlate showed a 0.9 correlation between the terms “weight gain” and “apartments for rent” for web
searches in the USA although there appears to be no causation between the terms (United Nations Global Pulse, 2012).
Therefore, it is critical to scrutinize potential correlations, especially when analysing important, but also novel, SDG-related data.
▶▶ Capacities and data literacy
Data literacy can be defined as the ability to read and analyse (big) data, thus creating actionable information. Capacities for
this are particularly needed in National Statistics Offices and, as often, tend to be less strong in developing countries. The
mentioned “A world that counts report calls for “global data literacy” (Independent Expert Advisory Group on a Data Revolution
for Sustainable Development, 2014, p. 25) and recommends that “governments, civil society, academia and the philanthropic
sector work together […] to strengthen the data and statistical literacy.” (Independent Expert Advisory Group on a Data
Revolution for Sustainable Development, 2014, p. 18).
It could be argued that because of big data and the IoT, global data literacy, i.e. in all National Statistics Offices, does not need
to be strengthened because relevant data can be collected and analysed remotely, thereby bypassing National Statistics
Offices. In Overseas Development Institute (2015), diametrical concerns of National Statistics Offices are stated: 1) They fear
to be overwhelmed to fulfil the demands for all the required additional data for the SDG indicators, or 2) They fear to become
irrelevant since remote big data collection and analysis would not require them.
43 See: http://data2x.org/
44 See: http://unglobalpulse.org/projects/sex-disaggregation-social-media-posts

InnovatIve BIg Data approaches for capturIng anD analyzIng Data to MonItor anD achIeve the sDgs
27
This is also linked to financial considerations (see Financing big data for SDGs). In Sustainable Development Solutions Network
(2015a), where the costs for the production of SDG-relevant data have been calculated, innovative big data approaches are
actually recognized as a means to save expenses on traditional statistics. However, Jütting argues that “despite the hype and
excitement that surrounds the potential of big data, official statistics will continue to provide a necessary baseline for important
policy decisions.45
Data-Pop Alliance (2015b) goes a step further by defining data literacy as “the desire and ability to constructively engage in
society through or about data (Data-Pop Alliance, 2015b, p. 22). Byachieving this, people would be better equipped for the
desired citizen participation thanks to big data (see Citizen participation).
▶▶ Financing big data for SDGs
Although the low costs of big data have been listed above as opportunity (see Low costs), there are also additional costs,
especially when it comes to big data for development. Referring to the “A World That Counts report (Independent Expert
Advisory Group on a Data Revolution for Sustainable Development, 2014), Melamed and Cameron46 foresee four groups of
related costs, especially for developing countries: 1. Funding for official statistics. […] 2. Funding for innovation. […] 3. Funding
for data literacy and use. […] 4. Funding for partnership and leadership. The investments under “innovation would be to “leapfrog
over current technologies and refer to the topics of this report.
As mentioned, it is estimated in Sustainable Development Solutions Network (2015a) that approximately US$1 billion are
required yearly to enable statistical systems to monitor the SDGs. Further costs are mentioned under the challenges of IoT
(see Challenges), which are initial investments to sensor installations and related infrastructure as well as the running costs for
energy consumption.
▶▶ Veracity
The overarching challenge, veracity, is sometimes mentioned as a fourth “V” to characterize big data. Big data can obviously
also contain wrong data, which can cause a lot of problems. And two of the other V’s exacerbate the challenge: Because of the
large volume of the data, the likelihood of errors is not only higher, but the errors themselves are also harder to detect. And
because of the velocity and the desire to use the data in real-time, there is not much time for error diagnostics. Errors can occur
in different phases and were partly mentioned as individual challenges:
• Data collection: There can be technical problems due to the unprecedented size of data and collection devices (see
Connectivity and technical issues).
• Data collection: Relevant groups still do not produce digital content or data exhaust or are not linked to sensors, i.e. their data are
not collected (see Access - missing million). This causes a sampling selection bias. Examples are also given in United Nations Global
Pulse (2012). Yet, sampling selection bias is not limited to big data as it is a well-known challenge in traditional statistics too.
• Data collection: Digital, i.e. citizen-generated content, varies regarding reliability as people may write about topics on which
they lack expert knowledge or do not know the full picture.
• Data processing: A large percentage of data is initially dirty and cleaning is a laborious task (see Cleaning/preparing data).
• Data analysis: During analysis, spurious correlation may be treated as real findings (see Apophenia).
45 See: http://www.huffingtonpost.com/johannes-jatting/financing-the-sdg-data-needs_b_12103102.html
46 See: http://www.undatarevolution.org/2015/01/20/funding-data-revolution/

InnovatIve BIg Data approaches for capturIng anD analyzIng Data to MonItor anD achIeve the sDgs
28
While these are mostly unintentional reasons for wrong data, intentional manipulation is also possible. There can be malicious
hacks at various stages of the process, starting from manipulating sensors or producing and spreading massively wrong digital
content, so-called “fake news” (see Access - missing million ). On the latter issue, Berti-Équille and Borge-Holthoefer (2015)
developed models of misinformation dynamics to better understand the phenomenon.
InTErnET of ThInGS
terminology and definitions
Initially, the internet was characterized by the interaction of humans via connected devices, such as computers and later
smartphones. This is also referred to as P2P, person-to-person communication. The IoT supplements this structure by linking
physical devices (not directly operated by humans), buildings, vehicles and other items to it. Also, devices implanted to or worn
by humans or animals can be connected to the IoT.
One way to look at the IoT is that it aims to reduce the information gap between the world and the internet. Countless items in
the world have a certain status and certain features, many of which are changing over time, e.g. the current temperature in a
specific city or the current heart rate of a specific person. The IoT measures and processes more and more of these data, usually
with a purpose, e.g. to improve certain conditions or to prevent negative developments.
The key components of the IoT are sensors. Sensors are (often small) objects which detect changes in theirenvironment and
potentially quantify the extent of the change. Sensors are deployed in the environment, installed in technical devices, or can
be also worn by humans as well as animals. In International Telecommunication Union and CISCO Systems (2016), a variety of
examples of what sensors can measure is listed: Position, presence, proximity, motion, velocity, displacement, temperature,
humidity, moisture, sound, vibration, chemical, gas, electricity, magnetism, flow (of liquids), force, strain, pressure or radiation47.
One of the main reasons for the proliferation of sensors is that their prices have dropped significantly; hence nowadays many
common devices contain already a range of sensors.
The synergy between sensors and the IoT is that the measured information by a sensor can be instantly digitally conveyed via
the IoT to another human or another device, who/which then may take action regarding what the sensor detected. The latter
point is also novel: In the IoT, devices have not only the role of collecting data and informing humans (M2P, machine-to-person
communication), but humans can be also bypassed and machine-to-machine (M2M) communication takes place with the
backend device as decision maker, which often requires artificial intelligence.
Therefore, the two main characteristics of the IoT are:
• A shift from P2P communication and decision making to M2M communication and decision making.
• A much more comprehensive and remote monitoring of the status of the environment, which includes nature, human
behaviour, urban settings, infrastructure, means of traffic etc.
Two consequences of this are that 1) the IoT contributes enormously towards big data as more and more sensors (often
permanently) produce data and 2) (if the data are correctly analysed) many negative incidents, e.g. disaster or illnesses, can be
47 Innovations for Poverty Action (2016) provides another detailed overview, which also includes technical specifications.
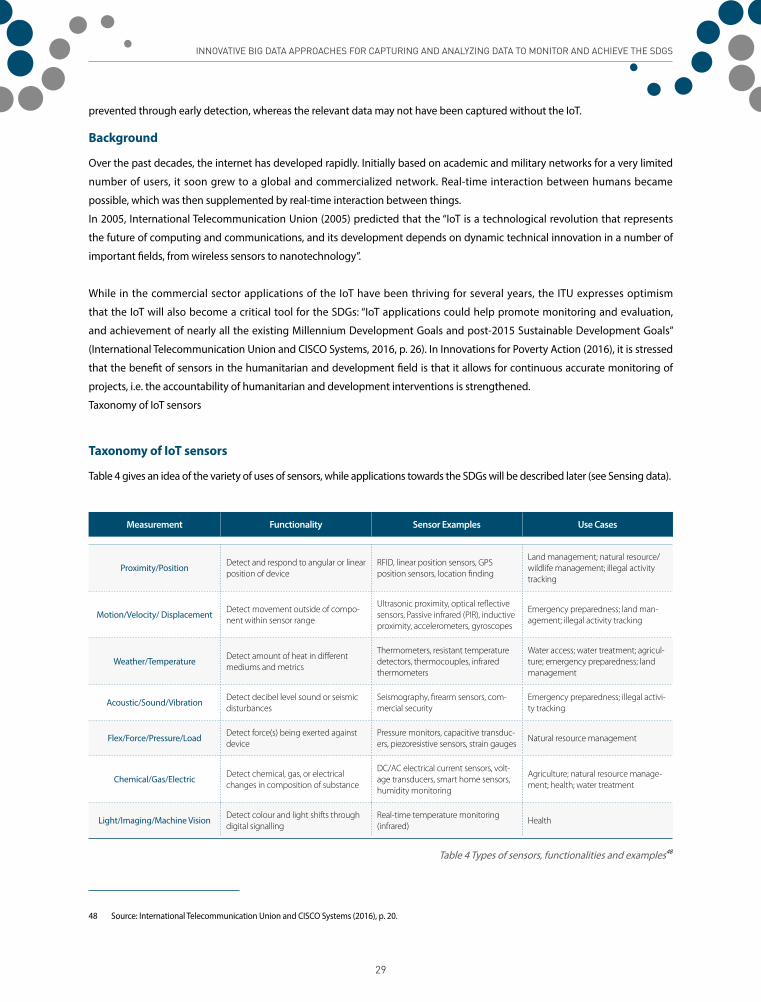
InnovatIve BIg Data approaches for capturIng anD analyzIng Data to MonItor anD achIeve the sDgs
29
prevented through early detection, whereas the relevant data may not have been captured without the IoT.
background
Over the past decades, the internet has developed rapidly. Initially based on academic and military networks for a very limited
number of users, it soon grew to a global and commercialized network. Real-time interaction between humans became
possible, which was then supplemented by real-time interaction between things.
In 2005, International Telecommunication Union (2005) predicted that the “IoT is a technological revolution that represents
the future of computing and communications, and its development depends on dynamic technical innovation in a number of
important fields, from wireless sensors to nanotechnology”.
While in the commercial sector applications of the IoT have been thriving for several years, the ITU expresses optimism
that the IoT will also become a critical tool for the SDGs: “IoT applications could help promote monitoring and evaluation,
and achievement of nearly all the existing Millennium Development Goals and post-2015 Sustainable Development Goals”
(International Telecommunication Union and CISCO Systems, 2016, p. 26). In Innovations for Poverty Action (2016), it is stressed
that the benefit of sensors in the humanitarian and development field is that it allows for continuous accurate monitoring of
projects, i.e. the accountability of humanitarian and development interventions is strengthened.
Taxonomy of IoT sensors
taxonomy of iot sensors
Table 4 gives an idea of the variety of uses of sensors, while applications towards the SDGs will be described later (see Sensing data).
Measurement Functionality Sensor Examples Use Cases
Proximity/Position Detect and respond to angular or linear position of device
RFID, linear position sensors, GPS position sensors, location finding
Land management; natural resource/wildlife management; illegal activity tracking
Motion/Velocity/ Displacement Detect movement outside of compo-nent within sensor range
Ultrasonic proximity, optical reflective sensors, Passive infrared (PIR), inductive proximity, accelerometers, gyroscopes
Emergency preparedness; land man-agement; illegal activity tracking
Weather/Temperature Detect amount of heat in different mediums and metrics
Thermometers, resistant temperature detectors, thermocouples, infrared thermometers
Water access; water treatment; agricul-ture; emergency preparedness; land management
Acoustic/Sound/Vibration Detect decibel level sound or seismic disturbances
Seismography, firearm sensors, com-mercial security
Emergency preparedness; illegal activi-ty tracking
Flex/Force/Pressure/Load Detect force(s) being exerted against device
Pressure monitors, capacitive transduc-ers, piezoresistive sensors, strain gauges
Natural resource management
Chemical/Gas/Electric Detect chemical, gas, or electrical changes in composition of substance
DC/AC electrical current sensors, volt-age transducers, smart home sensors, humidity monitoring
Agriculture; natural resource manage-ment; health; water treatment
Light/Imaging/Machine Vision Detect colour and light shifts through digital signalling
Real-time temperature monitoring (infrared)
Health
Table 4 Types of sensors, functionalities and examples48
48 Source: International Telecommunication Union and CISCO Systems (2016), p. 20.

InnovatIve BIg Data approaches for capturIng anD analyzIng Data to MonItor anD achIeve the sDgs
30
opportunities
There are numerous fields which the IoT could and has already impacted positively. Considering the description above that the
IoT reduces the information gap between the world and the internet, there is a myriad of technological processes that could be
improved or fine-tuned if they had access to more data of the world. And this is what the IoT is providing.
Possible applications range from the (potentially remote) management of manufacturing, infrastructure, traffic and buildings
to monitoring of environment and illegal activities. These will be described later as far as SDGs are concerned (see Sensing
data) and only one example is given below, which may be the most ground-breaking.
▶▶ Healthcare
Healthcare can benefit in two ways, namely through preventive intervention as well as through remote monitoring. Some time
ago, hardly any medical sensing technology, except perhaps fever thermometers, was available outside hospitals and doctor’s
offices. Diamandis summarized the issue as follows: “My car, my airplane, my computer know more about their health status
than I do.49
Sensors allow not only efficient, but also constant remote monitoring of health data, i.e. also at times when people show
no unhealthy symptoms. Without tracking the data, an illness often remained undetected until it broke out. Now with
progresses in preventive healthcare, alarming data enable at an early stage to potentially eliminate conditions while they
are still controllable. Moreover, the longer the period of recording personal health data is, the more it empowers the experts
to compare and detect irregularities and then to provide not only preventive, but also personalized treatment (Ziesche and
Motallebi, 2013).
challenges
▶▶ Connectivity and technical issues
Although internet coverage keeps increasing, still significant parts of the world are not or only poorly covered with insufficient
bandwidth. In those areas, sensors are of limited use as they cannot convey information in real-time. This issue concerns often
developing countries or remote nature. For example, sensors for wildlife tracking often must be checked and read in situ.
Another issue is the reliability of the system even when internet is available. A network of up to billions of devices is
unprecedented, highly complex and requires sophisticated management and almost constant upgrades. An example is the
task to determine when a (especially not easily accessible) device or a sub- network discontinues functioning or becomes
faulty. Such failure may be caused by unstable electricity, which is also another challenge in developing countries affecting the
internet connectivity in general.
▶▶ Interoperability
In order for a number of machines to communicate with each other, they have to do it in a way that they “understand”
each other. However, the variety of involved devices often has different specifications. Therefore, universal (and ideally
49 See: http://www.mddionline.com/article/nokia-sensing-x-challenge-debuts-intent-revolutionize-healthcare

InnovatIve BIg Data approaches for capturIng anD analyzIng Data to MonItor anD achIeve the sDgs
31
open) standards and protocols for interoperability within the IoT are needed better sooner than later. Yet, this requires the
corporations, which produce these devices, to agree, while they may have an interest in keeping proprietary systems.
▶▶ Energy demands
It is evident that the more devices are linked to the IoT, the more energy is consumed. Moreover, the storage of the data
generated by all the connected devices requires significant energy too. Given that one promising application of the IoT is to
monitor other devices for energy efficiency, it is critical that the IoT does not waste unnecessary energy.
For example, sensors should not be kept active permanently if their monitoring is required only at certain times. Also, data
should be stored for longer only when this is useful, given that much of the data generated within the IoT is needed only briefly
to send signals from machine to machine, and does not require being stored (see also Privacy).
▶▶ Security
Much concern has been expressed about security issues of the IoT50. Without sufficient security of often newly, i.e. not fully
tested, devices hackers may be able to access and steal sensitive data and to manipulate devices or parts of the network. This
is even more concerning considering what all is or is planned to be connected to the IoT, such as household devices, means of
traffic, factories or hospitals and medical sensors. Manufacturers of the components of the IoT are requested through universal
regulations to address this issue, which should include secure encryption for all involved devices.
▶▶ Electronic waste
Electronic waste is a serious issue in general, and the IoT is contributing to it. Often devices have only, intentionally or
unintentionally, a short lifespan and then need to be replaced. Electronic waste also often contains hazardous elements and
recycling is not possible or inefficient.
Overall, some of the above challenges are affecting developing countries in particular, since in these places, for example,
internet connectivity tends to be poorer, electricity supply less stable and options to manage or recycle electronic waste
less developed. This is challenging given that, especially in developing countries, sensors could be useful to capture relevant
data for SDG indicators. The problem is exacerbated by the high demand for skilled personnel, which is also less available in
developing countries. Human capacities are required to operate often innovative machines, address the above challenges and
also for maintenance and repair of devices on the ground.
Another issue is that some of the above challenges affect adversely certain SDGs, such as SDG 7 (Affordable and clean energy)
and SDG 12 (Responsible consumption and production). Therefore, solutions for efficient energy use of the IoT and reduction
of electronic waste are critical.
50 See e.g. International Telecommunication Union and CISCO Systems (2016) or http://www.zdnet.com/article/internet-of-things-finding-a-way-out-of-the-secu-rity-nightmare/

InnovatIve BIg Data approaches for capturIng anD analyzIng Data to MonItor anD achIeve the sDgs
32
ArTIfICIAL InTELLIGEnCE
terminology and definitions
As with other terms in this report, defining AI is not straightforward. The initial problem is already to define what regular, i.e.
non-artificial, intelligence means, which is intelligence executed by humans or animals. Despite various attempts, none of the
involved disciplines, such as psychology or education science, has come up with a satisfying, mutually agreed upon definition
of intelligence. Legg and Hutter (2007) provide an overview of the many definitions that have been proposed over the years
and eventually deliver this general definition: “Intelligence measures an agent’s ability to achieve goals in a wide range of
environments”.
Based on this it can be said that if the “agent” in this definition is a human being or an animal, it is regular intelligence, while it
is AI if the agent is a machine. A machine that exhibits intelligence, which equals human intelligence, is referred to as having
artificial general intelligence. Such a machine has not yet been developed.
However, already in 1976 Newell and Simon (1976) claimed that artificial general intelligence is possible based on their
physical symbol system hypothesis, which states: “A physical symbol system has the necessary and sufficient means for general
intelligent action. (Newell and Simon, 1976, p. 116). This hypothesis defines human intelligent behaviour on an abstract level as
manipulation of symbols. And since machines are also capable of manipulating symbols, they possess the sufficient feature for
intelligence.
What is more relevant for this report are subcategories of intelligence, such as reasoning, decision-making, planning, learning,
visual perception, face recognition, speech recognition, natural language processing, or the ability to move and manipulate
objects. These subcategories are easier to define, play partly already a role in daily lives of people, and are promising to partly
support both the achievement of SDG targets and the calculation of SDG indicators.
background
The field of AI is clearly older than big data or the IoT. It is often said that AI was founded as an area of research at a conference
at Dartmouth College in 1956, where the name was also coined51.
The following decades were characterized by progress as well as drawbacks. The latter occurred partly because of too much
initial optimism and thus too high expectations. Successes were achieved in specialized fields and often owing to increased
computational power. For example, in 1997 the Deep Blue chess machine, developed by IBM, defeated the (then) world chess
champion Garry Kasparov. Since the beginning of the new century, the boom of AI continues and prompted many projects in
the private sector. This development is boosted by faster computers, more available (big) data and innovative machine learning
methods.
Unlike big data and the IoT, the United Nations has not embraced much the field of AI yet, neither in terms of projects, nor in
terms of policies. However, the United Nations Chief Information Technology Officer Riazi acknowledges that challenges and
51 See e.g. Gardner (1987).

InnovatIve BIg Data approaches for capturIng anD analyzIng Data to MonItor anD achIeve the sDgs
33
potential consequences of AI should be discussed at the United Nations52.
Moreover, there are attempts advocating to apply AI towards the SDGs, e.g. by the International Telecommunication Union53.
The International Telecommunication Union also co-organized together with the XPRIZE Foundation the very recent
AI for Good Global Summit in Geneva in June 2017, which aimed “[…] to accelerate and advance the development and
democratization of AI solutions that can address specific global challenges related to poverty, hunger, health, education, the
environment, and others”54.
taxonomy of Ai methods
Of the various research topics of AI, the ones which are relevant for the analysis of big data are briefly introduced in Table 5.
AI research topics Short description
Machine learning Discovering patterns and making predictions on big data
Decision making Reasoning from data and select preferences among choices
Natural language processing Reading and understanding digital textual content
Object recognition Processing and understanding digital images
Speech recognition Recognizing and transcribing spoken language to text
Table 5 AI research topics
Some of these methods interact, just like in humans. For example, natural language processing follows after speech
recognition, or object recognition is based on machine learning.
opportunities
▶▶ Machine and deep learning
As mentioned above, progress in AI is often triggered through successes in specific sub-areas. The field which has advanced
a lot over the past years is machine learning. Machine learning is about enabling computers to learn without needing to
explicitly program the details. Another term often mentioned in this context is deep learning, which is a recently prospering
branch of machine learning that improves the learning performance through multiple layers of processing.
Similar to the chess computer Deep Blue in the 1990s, deep learning gained fame through successfully mastering a game: In
2016 AlphaGo, a computer program developed by Google Deepmind, beat in the board game Go the high-ranking player Lee
Sedol. Go was previously considered very hard to program, but deep learning algorithms led to this success.
52 See: http://www.techrepublic.com/article/united-nations-cito/
53 See: https://itu4u.wordpress.com/2016/09/13/could-technical-standards-for-artificial-intelligence-help-us-achieve-the-sustainable-development-goals/
54 See: http://www.itu.int/en/ITU-T/AI/Pages/201706-default.aspx

InnovatIve BIg Data approaches for capturIng anD analyzIng Data to MonItor anD achIeve the sDgs
34
Machine learning proves also to be a much-needed tool for big data, since the volume, the variety and the velocity are often
exceeding the abilities of conventional analytics. Just collecting or having access to large amounts of data is futile without
the following steps of data mining and pattern recognition. This appears to be a strength of machine and deep learning; to
discover regularities and correlations within big data and use them for conclusions, which are applicable for decision making,
and predictions about the future (see also Analysis and Synergies for capturing and analysing data).
challenges
▶▶ AI safety
Many experts believe that it is realistic that work on AI will eventually lead to so-called superintelligence. This would be a machine
with abilities which surpasses those of humans in general and not only in specialized fields, such as chess. The risk is that such a
machine could have not only goals, which are not in the interest of humanity, but also ways to implement such goals because of its
unprecedented capabilities. AI safety is an area of research that focuses on exploring methods to increase the likelihood that, if and
when a machine reaches superintelligence, its behaviour is aligned with what humans value. To illustrate this by using the SDGs: If
not directed in that way, there is no reason to assume that a machine with superintelligence has goals that are compatible with the
SDGs. Therefore, it is highly desirable that such a machine values the SDGs as well as many things that humans value.
Bostrom, a leading researcher in this field, describes the problem as well as the significant challenges AI safety research is facing
(Bostrom, 2014). AI safety research gained momentum in recent years and several institutions are working on it, e.g. the Future
of Humanity Institute55, led by Bostrom, and the Machine Intelligence Research Institute56.
AI safety research has only a chance to be successful if addressed in a global effort. Therefore, the adoption of the so-called
Asilomar AI Principles57 at the conference Beneficial AI in January 2017 by leading AI researchers was an important step.
▶▶ Adverse effects on SDGs - algorithmic discrimination
AI safety is one issue to prevent AI from having adverse effects on the SDGs.
Also for the SDGs 5, 10 and 16, adverse effects due to AI have been identified, which is discrimination towards groups of the
population. It is a common feature of big data analytics for corporations to categorize their customers according to profiles,
e.g. for targeted advertising. Yet, the underlying algorithms can be rooted in stereotype. For example, a study showed that
Google ads for high paying jobs were more often offered to men than to women (Datta, 2015). There are further examples that
discriminate other groups58. The US White House published a report which introduces big data techniques that can be used to
detect bias and prevent discrimination (Executive Office of the US President, 2016).
Since it is an open debate whether AI in the long run creates or reduces employment, in other words supports or impedes SDG
8, it is not discussed here.
55 https://www.fhi.ox.ac.uk/
56 https://intelligence.org/
57 https://futureoflife.org/ai-principles/
58 See e.g. https://www.nytimes.com/2015/07/10/upshot/when-algorithms-discriminate.html and https://www.theguardian.com/technology/2016/sep/08/artifi-cial-intelligence-beauty-contest-doesnt-like-black-people

InnovatIve BIg Data approaches for capturIng anD analyzIng Data to MonItor anD achIeve the sDgs
35
▶▶ Slow progress and too high expectations
As mentioned above, there were ups and downs in the short history of artificial intelligence. While currently the field is
again booming, there is no guarantee that this will continue or that all expectations will be fulfilled. For example, one of the
foundations for the current progress is the continuously increasing computational power, but it is not certain if there is an
upper limit to this development.
Also, progress in some fields, such as machine learning, does not ensure that other aspects of human intelligence can be
artificialized as effectively. Especially challenging appear to be skills that humans acquired early during evolution and often
perform unconsciously, such a motor skills or those that require common-sense knowledge about the world.
Another option discussed, for example by Chalmers (2010), consists ofdisinclination or active prevention. This would mean that
mankind discontinues research in AI, for example, because of the concerns or possibly unsolvable problems mentioned under
AI safety or for different reasons.
SynErGIES for CApTurInG AnD AnALySInG DATAWhereas big data, IoT and AI are already individually very powerful and innovative technologies, combining them creates
further synergies, which explains the current enthusiasm about these developments and which can be also harnessed for the
calculation of SDG indicators or for the achievement of SDG targets. Approaches emerging from these synergies are crucial
since the SDG indicators are much more complex as well as very different from the preceding MDG indicators (see Background),
thus potentially not all of them are suitable for traditional statistics.
As Figure 1 illustrates, big data forms the centre of this project, while IoT and AI provide support at different stages in the
process:
• The IoT allows capturing numerous additional data. There have been and there are still other traditional sources for big data,
but the IoT has enormous potential to provide much more data, accurately and in real-time.
• AI allows analysing data in new ways. There have been and there are still other traditional methods of analysing big data,
but AI has enormous potential to analyse much more data to deliver actionable information in real-time.
world Data capturingthrough loT
Analysis through AI methods
Data capturingthrough traditional
sources
Analysis through traditional methodsbig dAtA
ActionAbleinformAtion
Figure 1 Synergies between big data, IoT and AI

InnovatIve BIg Data approaches for capturIng anD analyzIng Data to MonItor anD achIeve the sDgs
36
overview of big data approaches
BACkGrounDAfter presenting big data, IoT and AI in general and the potential these three together have for many aspects of life, this chapter
introduces approaches which harness this potential towards the SDGs.
This potential, especially regarding real-time and financial advantages, has also been acknowledged by the UN Global Working
Group on Big Data as it stated: “To monitor certain indicators Big Data could have the potential to be as relevant, more timely
and more cost effective than traditional data collection methods, and could make the data cycle match the decision cycle59.
While the Global Working Group focuses on the SDG indicators in this report, two different aspects of SDGs support are examined:
• Capturing and analysing data to support the calculation of SDG indicators.
• Capturing and analysing data to support the achievement of SDG targets.
The World Bank maintains a relevant repository of open development data60. Also, outside the UN, the potential of big data
towards the SDGs has been recognized and, for example, the following non-UN institutions and networks explore how the
SDGs can be supported by big data:
• The Global Partnership for Sustainable Development Data61, which sees itself as an “unprecedented, open, multi-stakeholder
network working to harness the data revolution for sustainable development. It works together with various data collaboratives62.
• Data-Pop Alliance63, which intends to bring “together researchers, experts, practitioners, and activists to promote a people-centred
Big Data revolution through collaborative research, capacity building, and community engagement. Its core members are the
Harvard Humanitarian Initiative, the MIT Media Lab, the Overseas Development Institute and the Flowminder Foundation.
• PARIS2164, which aims “to reduce poverty and improve governance in developing countries by promoting the integration
of statistics and reliable data in the decision-making process. They also host a compendium of innovations and statistical
capacity in official statistics65.
structure of the overview and explanations
On the top level, this overview is structured by the big data categories exhaust data, sensing data and digital content
(see Taxonomy of big data). On the next level, the various data sources of these categories are itemised. It follows a list of
approaches using these data sources, which could be applied for the calculation of SDG indicators or the achievement of SDG
targets. The overview is completed by a list of AI approaches, which do not rely on big data. A few more explanatory remarks:
59 See: https://unstats.un.org/bigdata/taskteams/sdgs/
60 See: http://data.worldbank.org/
61 See: http://www.data4sdgs.org/
62 See http://www.data4sdgs.org/data-collabratives/
63 See: http://datapopalliance.org/
64 See: http://www.paris21.org/
65 See: http://pista.paris21.org/innovation/
InnovatIve BIg Data approaches for capturIng anD analyzIng Data to MonItor anD achIeve the sDgs
37
• Given space limitations and the number and diversity of SDG targets and indicators, the approaches are described very briefly. Yet, many
targets and indicators are very complex, which can be illustrated by the example that for the measurement of SDG indicator 9.1.1 (“Proportion
of the rural population who live within 2 km of an all-season road) alone, a report with over 100 pages has been published (World Bank, 2016).
• The approaches are categorized by the following types: Commercial product, government project, NGO project, research
project and UN project.
• There are approaches that collect their data from more than one source. This is called “data mashup and is, owing to one
of the 3Vs, namely variety, one of the methodologies to gain novel insights through big data. A common example is to
combine data from satellite images with data from sensors on the ground.
• Sometimes, several similar approaches for the same SDG target or indicator are available; then only one example is
introduced, while links to alternatives are provided. The selection of that particular example does not indicate any
preference, especially when the approaches are competitive commercial products.
• to The presentation of approaches from all parts of the world has been attempted. The resulting majority of approaches
from North America and Europe may be due to the unavailability of English descriptions of approaches from, for example,
some ENEA countries.
• There are also approaches which address more than one SDG target or indicator as some targets and indicators are similar
or the approach is versatile.
• Finally, the presented approaches can, in many cases, not be considered solutions for the calculation of certain SDG
indicators or the achievement of certain SDG targets since some of them are in early stages or on-going research for a
restricted domain, neither with proven exactitude nor global applicability. Also, the capabilities of the presented commercial
products may be portrayed overly optimistic in marketing documents. For the calculation of indicators, the approach would
have to be, if possible at all, adjusted to the methodology and standards established by the IAEG-SDGs. The following
approaches are to be considered as innovative tools to potentially assist traditional statistics methods.
ExhAuST DATA
mobile phone data
▶▶ Introduction
Mobile phone data can be considered one of the classical sources of big data and perhaps the best-known example for the
category “exhaust data. The call detail records show not only how,for how long and how often people make phone calls,
but also their location and movements over time. Mobile phone data is also one of the three sources of big data, for which a
dedicated task team within the UN Global Working Group on Big Data has been established66.
The two distinct types of data (calls and location) are analysed for different purposes: The number of duration of calls can be seen as
proxy for available financial means. And by means of the location, real-time population movements and migration can be investigated.
A challenge is to get access to mobile phone data, which are held by corporations, and often also require the approval of
the national Government. For example, during the Ebola outbreak in West Africa in 2014 no access was granted, although
movement data from mobile phones are considered very useful to analyse spreading of epidemics67. The Flowminder
Foundation is an NGO that is specialized in understanding migration patterns through mobile phone data68.
66 See for details: https://unstats.un.org/bigdata/taskteams/mobilephone/
67 See: http://www.economist.com/news/science-and-technology/21627557-mobile-phone-records-would-help-combat-ebola-epidemic-getting-look
68 See: http://www.flowminder.org/

InnovatIve BIg Data approaches for capturIng anD analyzIng Data to MonItor anD achIeve the sDgs
38
▶▶ Approaches
SDG indica-
tor
SDG target Name Description
Data mash-up with oth-
er sourcesCountries Organisations Type of
project URLExamples for similar
approaches(or further description of the approach)
1.1.1, 1.2.1, 1.2.2
Mapping poverty using mobile phone and satellite data
Traditional approaches to measuring and targeting pov-erty rely heavily on census data, which in most low- and middle-income countries are unavailable or out-of-date. Recently, there are promising signs that novel sources of high-resolution data can provide an accurate and up-to-date indication of living conditions. In particular, recent work illustrates the potential of features derived from remote sensing and geographic information system data and mobile operator call detail records. This work represents the first attempt to build predictive maps of poverty using a combination of call detail records and remote sensing data.
Satellite and UAV imagery
Bangla-desh
Flowminder Foundation, Sweden, [email protected]
Research project
http://rsif.royalsociety-publishing.org/con-tent/14/127/20160690
http://dl.acm.org/citation.cfm?id=2557358, http://link.springer.com/chapter/10.1007%2F978-3-642-22362-4_35, http://science.sciencemag.org/content/350/6264/1073, http://2012.cities.io/wp-con-tent/uploads/2012/12/d4d-chris-submitted.pdf
1.1.1, 1.2.1, 1.2.2, 2.1.1, 2.1.2, 2.2.1, 2.2.2
Estimat-ing Food Consumption and Poverty indices with Mobile Phone Data
The suitability of indicators derived from mobile phone data as a proxy for food security indicators is assessed. The measures extracted from call detail records and airtime credit purchases are compared to the results of a nationwide household survey conducted at the same time. Results show high correlations (> 0.8) between mo-bile phone data derived indicators and several relevant food security variables such as expenditure on food or vegetable consumption. This research also shows that poverty levels can be inferred from top up information at quite a granular level in a low-income economy.
Financial trans-actions (Airtime purchases)
Africa
Universite catholique de Louvain, Belgium, UN Global Pulse, USA, World Food Programme, Italy, Real Impact Ana-lytics, Belgium, [email protected]
UN projecthttps://arxiv.org/pdf/1412.2595.pdf
http://www.unglobalpulse.org/sites/default/files/UNGP_ProjectSeries_Airtimecredit_Food_2015.pdf
11.2.1 11.2, 11.3
Daytime Population estimations based on Mo-bile Phone Metadata
The aim of the project is to produce statistics on the spa-tial distribution of the Dutch population during the day, as opposed to the spatial distribution as registered by the municipality of residence. This will be based on mobile phone location data.
Nether-lands
Statistics Nether-lands, [email protected]
Govern-ment project
https://unstats.un.org/bigdata/inventory/?selec-tID=2015063
http://www.von-tijn.nl/tijn/research/presentations/DTP_Martijn_Tennekes_JSM2014.pdf
11.2.1 11.2
African Bus Routes Re-drawn Using Cell-Phone Data
Researchers at IBM, using movement data collected from millions of cell-phone users in Ivory Coast in West Africa, have developed a new model for optimizing an urban transportation system. The model prescribed changes in bus routes around the around Abidjan, the nation’s larg-est city. These changes—based on people’s movements as discerned from cell-phone records—could, in theory, slash travel times 10 per cent.
Côte d'Ivo-ire
IBM, USA, [email protected]
Research project
https://www.technologyre-view.com/s/514211/african-bus-routes-redrawn-using-cell-phone-data/
http://journals.plos.org/plosone/article?id=10.1371/journal.pone.0096180, http://journals.plos.org/plosone/article?id=10.1371/journal.pone.0049171, http://www.sciencedirect.com/science/ar-ticle/pii/S0966692315001878

InnovatIve BIg Data approaches for capturIng anD analyzIng Data to MonItor anD achIeve the sDgs
39
SDG indica-
tor
SDG target Name Description
Data mash-up with oth-
er sourcesCountries Organisations Type of
project URLExamples for similar
approaches(or further description of the approach)
3.3, 3.d
Containing the Ebola Outbreak – the Potential and Challenge of Mobile Network Data
The Ebola outbreak in 2014 took place in one of the most highly connected and densely populated regions of Africa. Accurate information on population movements is valuable for monitoring the progression of the outbreak and predicting its future spread, facilitating the prioritiza-tion of interventions and designing surveillance and con-tainment strategies. The utility of CDRs for understanding human mobility in the context of the Ebola is outlined.
Guinea, Li-beria, Sierra Leone
Flowminder Foundation, Sweden, Harvard School of Public Health, USA, [email protected]
Research project
http://currents.plos.org/outbreaks/article/containing-the-ebo-la-outbreak-the-poten-tial-and-challenge-of-mo-bile-network-data/
https://ore.exeter.ac.uk/reposi-tory/handle/10871/23166,http://www.vanessafriasmar-tinez.org/uploads/epidemics.pdf
3.3, 3.d
Integrating rapid risk mapping and mobile phone call record data for strategic malaria elimination planning
As successful malaria control programmes re-orientate towards elimination, the identification of transmission foci, targeting of attack measures to high-risk areas and management of importation risk become high priorities. Using the example of Namibia, a method for targeting of interventions using surveillance data, satellite imagery, and mobile phone call records to support elimination planning is described.
Satellite and UAV imagery
Namibia
University of Southampton, UK, Universi-ty of Florida, USA, National Vector-borne Disease Control Programme, Namibia, Clinton Health Access Initiative, USA, Fogarty Inter-national Center, USA, Mobile Tele-communications Limited, Namibia, [email protected]
Research project
https://malariajournal.biomedcentral.com/arti-cles/10.1186/1475- 2875-13-52
https://www.hsph.harvard.edu/news/press-releases/cell-phone-data-malaria/
3.4, 3.8
Quantifying the Impact of Accessibility on Preventive Healthcare in Sub-Sa-haran Africa Using Mobile Phone Data
Poor physical access to health facilities has been identi-fied as an important contributor to reduced uptake of preventive health services and is likely to be most critical in low-income settings. Using anonymised mobile phone data from 2008 to 2009, individual and spatially aggregat-ed travel patterns of 14,816,521 subscribers across Kenya are analysed and these measures are compared with estimated travel times to health facilities and data on the uptake of preventive healthcare interventions.
Kenya
Carnegie Mellon University, USA, Harvard School of Public Health, USA, Duke Univer-sity, USA, Universi-ty of Southamp-ton, UK; Fogarty International Cen-ter, USA, Moi University, Kenya, Northeastern University, USA, [email protected]
Research project
http://journals.lww.com/epidem/Fulltext/2015/03000/Quantifying_the_Impact_of_Accessibility_on.15.aspx

InnovatIve BIg Data approaches for capturIng anD analyzIng Data to MonItor anD achIeve the sDgs
40
SDG indica-
tor
SDG target Name Description
Data mash-up with oth-
er sourcesCountries Organisations Type of
project URLExamples for similar
approaches(or further description of the approach)
1.5, 11.5, 13.1
Rapid and Near Real-Time Assessments of Population Displacement Using Mobile Phone Data Following Disasters: The 2015 Nepal Earthquake
Sudden impact disasters often result in the displacement of large numbers of people. These movements can occur prior to events, due to early warning messages, or take place post-event due to damages to shelters and livelihoods as well as a result of long-term reconstruction efforts. Displaced populations are especially vulnerable and often in need of support. The analysis of call detail records based on movements of 12 million de-identified mobile phones users shows the evolution of population mobility patterns after the earthquake and the patterns of return to affected areas, at a high level of detail.
Nepal
Flowminder Foundation, Sweden, [email protected]
NGO project
http://currents.plos.org/disas-ters/article/rapid-and-near-re-al-time-assessments-of-pop-ulation-displacement-us-ing-mobile-phone-data-fol-lowing-disasters-the-2015-ne-pal-earthquake/
http://www.flowminder.org/case-studies/haiti-earth-quake-2010, http://www.flowminder.org/case-studies/haiti-cholera-outbreak-2010, http://link.springer.com/article/10.1007/s10584-016-1753-7, http://www.pnas.org/content/111/45/15888.full
7.1
Using Mobile Phone Data for Electricity Infrastructure Planning
The analysis of society-wide mobile phone records has recently proven to offer unprecedented insights into the spatio-temporal distribution of people, but this information has never been used to support electrifica-tion planning strategies anywhere and for rural areas in developing countries in particular. The aim of this project is the assessment of the contribution of mobile phone data for the development of bottom-up energy demand models, in order to enhance energy planning studies and existing electrification practices.
Senegal
University of Manchester, UK, Ecole supérieure polytechnique de Dakar UCAD, Senegal, Santa Fe Institute, USA,[email protected], [email protected], [email protected], [email protected]
Research project
https://www.researchgate.net/publication/275055023_Using_Mobile_Phone_Data_for_Electricity_Infrastructure_Planning

InnovatIve BIg Data approaches for capturIng anD analyzIng Data to MonItor anD achIeve the sDgs
41
SDG indica-
tor
SDG target Name Description
Data mash-up with oth-
er sourcesCountries Organisations Type of
project URLExamples for similar
approaches(or further description of the approach)
11.7, 16.1, 16.4., 16.a
Moves on the Street: Clas-sifying Crime Hotspots Using Aggregated Anonymised Data on Peo-ple Dynamics
The proposed approach uses demographic information along with human mobility characteristics as derived from anonymised and aggregated mobile network data. The hypothesis that aggregated human behavioural data captured from the mobile network infrastructure, in combination with basic demographic information, can be used to predict crime is supported by the findings. The models, built on and evaluated against real crime data from London, obtain accuracy of almost 70% when classifying whether a specific area in the city will be a crime hotspot or not in the following month.
UK
University of Tren-to, Italy, Fondazi-one Bruno Kessler, Italy, Sorbonne Universités, France, University of California–Berkeley, USA, Data-Pop Alliance, USA, Telefonica Research, Spain, MIT Media Lab, USA, [email protected]
Research project
http://online.liebertpub.com/doi/10.1089/big.2014.0054
https://arxiv.org/abs/1409.2983
5.2, 8.7, 16.2
Human Trafficking Resource Center
Polaris is harnessing all of the 'Big Data' from their hotline calls to create a real-time picture of trafficking across the USA. Moreover, Palantir’s technology lets a call centre operator pull up a web app that maps where a victim is calling from. In addition to powerful mapping and search tools, data is automatically pushed to the operator instead of having them to manually pull it.
USA
Polaris, USA, Goo-gle, USA, Palantir, USA, Salesforce, USA, Twilio, USA, [email protected]
NGO project
http://edition.cnn.com/2015/08/10/world/can-big-data-help-stamp-out-human-trafficking/
10.7
Analysing Seasonal Mo-bility Patterns Using Mobile Phone Data
Mobile phone data allows for the direct observation of population-scale mobility. In this study, the movements of populations in Senegal in 2013 were quantified using anonymised mobile phone data. Results of this analysis showed that for vulnerable population groups, changes in mobility patterns could indicate changes in livelihoods or coping strategies, or exposure to new shocks. Moni-toring such changes in vulnerability in real time could be a powerful humanitarian early warning mechanism for informed decision-making and rapid response.
Senegal
UN Global Pulse Kampala, Uganda, [email protected]
UN project
http://www.unglobalpulse.org/projects/analysing-sea-sonal-mobility-patterns-us-ing-mobile-phone-data
Table 6 Big data approaches: mobile phone data

InnovatIve BIg Data approaches for capturIng anD analyzIng Data to MonItor anD achIeve the sDgs
42
financial transactions
▶▶ Introduction
This is another example of exhaust data, held by corporations, but with potential value as big data for the SDGs. This source
comprises all data linked to financial transactions, i.e. credit card data, scanner data of retail and supermarket chains or data
from other electronic points of sale69.
In developing countries credit cards are often still scarce, but financial transactions by mobile phone have caused disruptive
changes there. The challenge to send money over distances was solved by enabling money transfers between mobile
phone users. It is now even possible beyond borders, which is crucial for migrant workers and dubbed “International Mobile
Remittance.
Also in developed countries financial transaction data are interesting, for example to examine customer behaviour and needs
as well as to monitor price indices and also criminal activities.
69 One could argue that financial transactions (apart from online transactions) are sensing data since it requires a sensor to scan credit cards or bar code. As stated earlier, the line between exhaust and sensing data is blurry, and financial transactions are listed under exhaust data because the primary purpose of taking the data is the actual financial transaction and not the big data projects presented here.
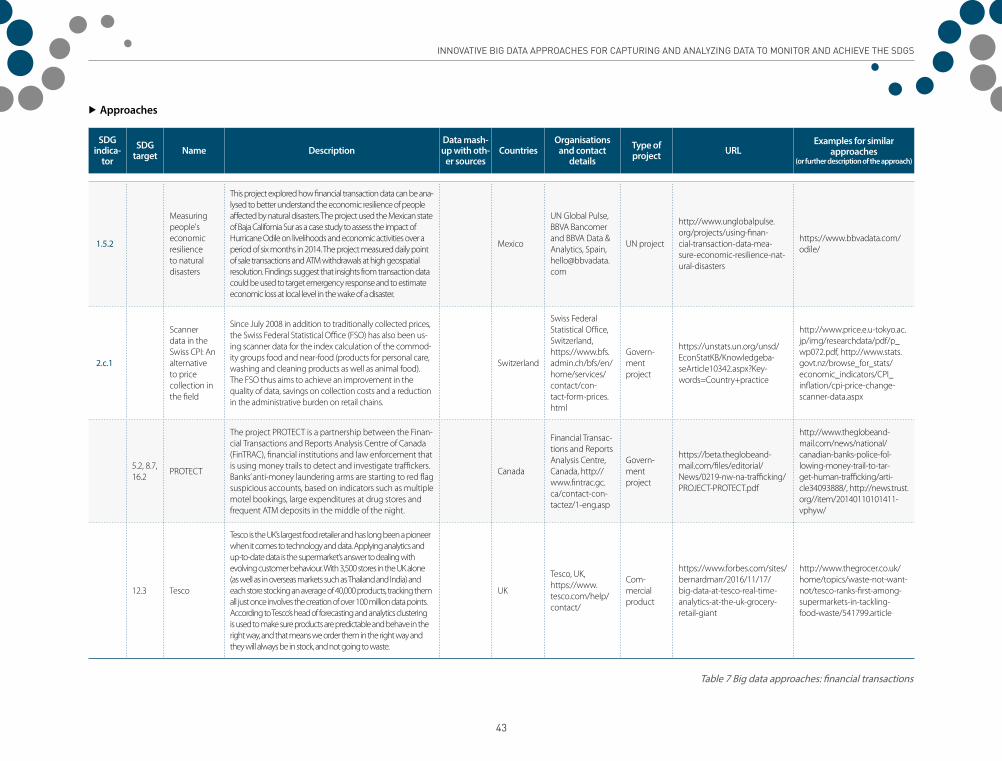
InnovatIve BIg Data approaches for capturIng anD analyzIng Data to MonItor anD achIeve the sDgs
43
▶▶ Approaches
SDG indica-
tor
SDG target Name Description
Data mash-up with oth-
er sourcesCountries
Organisations and contact
details
Type of project URL
Examples for similar approaches
(or further description of the approach)
1.5.2
Measuring people's economic resilience to natural disasters
This project explored how financial transaction data can be ana-lysed to better understand the economic resilience of people affected by natural disasters. The project used the Mexican state of Baja California Sur as a case study to assess the impact of Hurricane Odile on livelihoods and economic activities over a period of six months in 2014. The project measured daily point of sale transactions and ATM withdrawals at high geospatial resolution. Findings suggest that insights from transaction data could be used to target emergency response and to estimate economic loss at local level in the wake of a disaster.
Mexico
UN Global Pulse, BBVA Bancomer and BBVA Data & Analytics, Spain,[email protected]
UN project
http://www.unglobalpulse.org/projects/using-finan-cial-transaction-data-mea-sure-economic-resilience-nat-ural-disasters
https://www.bbvadata.com/odile/
2.c.1
Scanner data in the Swiss CPI: An alternative to price collection in the field
Since July 2008 in addition to traditionally collected prices, the Swiss Federal Statistical Office (FSO) has also been us-ing scanner data for the index calculation of the commod-ity groups food and near-food (products for personal care, washing and cleaning products as well as animal food). The FSO thus aims to achieve an improvement in the quality of data, savings on collection costs and a reduction in the administrative burden on retail chains.
Switzerland
Swiss Federal Statistical Office, Switzerland, https://www.bfs.admin.ch/bfs/en/home/services/contact/con-tact-form-prices.html
Govern-ment project
https://unstats.un.org/unsd/EconStatKB/Knowledgeba-seArticle10342.aspx?Key-words=Country+practice
http://www.price.e.u-tokyo.ac.jp/img/researchdata/pdf/p_wp072.pdf, http://www.stats.govt.nz/browse_for_stats/economic_indicators/CPI_inflation/cpi-price-change-scanner-data.aspx
5.2, 8.7, 16.2
PROTECT
The project PROTECT is a partnership between the Finan-cial Transactions and Reports Analysis Centre of Canada (FinTRAC), financial institutions and law enforcement that is using money trails to detect and investigate traffickers. Banks’ anti-money laundering arms are starting to red flag suspicious accounts, based on indicators such as multiple motel bookings, large expenditures at drug stores and frequent ATM deposits in the middle of the night.
Canada
Financial Transac-tions and Reports Analysis Centre, Canada, http://www.fintrac.gc.ca/contact-con-tactez/1-eng.asp
Govern-ment project
https://beta.theglobeand-mail.com/files/editorial/News/0219-nw-na-trafficking/PROJECT-PROTECT.pdf
http://www.theglobeand-mail.com/news/national/canadian-banks-police-fol-lowing-money-trail-to-tar-get-human-trafficking/arti-cle34093888/, http://news.trust.org//item/20140110101411-vphyw/
12.3 Tesco
Tesco is the UK’s largest food retailer and has long been a pioneer when it comes to technology and data. Applying analytics and up-to-date data is the supermarket’s answer to dealing with evolving customer behaviour. With 3,500 stores in the UK alone (as well as in overseas markets such as Thailand and India) and each store stocking an average of 40,000 products, tracking them all just once involves the creation of over 100 million data points. According to Tesco’s head of forecasting and analytics clustering is used to make sure products are predictable and behave in the right way, and that means we order them in the right way and they will always be in stock, and not going to waste.
UK
Tesco, UK, https://www.tesco.com/help/contact/
Com-mercial product
https://www.forbes.com/sites/bernardmarr/2016/11/17/big-data-at-tesco-real-time-analytics-at-the-uk-grocery-retail-giant
http://www.thegrocer.co.uk/home/topics/waste-not-want-not/tesco-ranks-first-among-supermarkets-in-tackling-food-waste/541799.article
Table 7 Big data approaches: financial transactions

InnovatIve BIg Data approaches for capturIng anD analyzIng Data to MonItor anD achIeve the sDgs
44
online search and access logs
▶▶ Introduction
This source is another example of exhaust data. In addition to interpreting actively and intentionally produced content by
internet users (see Digital content), it can also lead to insights to analyse how people “surf” the web. This includes terms entered
in search engines,websites visited, how users navigate there and for how long. Among other applications, this type of exhaust
data has been used to monitor the spreading of diseases by utilizing Google searches related to the disease. To describe this
new methodology, which may detect outbreaks of diseases faster and cheaper than conventional approaches, Eysenbach
(2011) introduced the terms “infoveillance” and “infodemiology”.

InnovatIve BIg Data approaches for capturIng anD analyzIng Data to MonItor anD achIeve the sDgs
45
▶▶ Approaches
SDG indica-
tor
SDG target Name Description
Data mash-up with oth-
er sources
Countries Countries
Organisations and contact
details
Type of project URL
Examples for similar approaches
(or further description of the approach)
3.3.1 3.3, 3.d
Disease Monitor-ing and Health Campaign Evalua-tion Using Google Search Activities for HIV and AIDS, Stroke, Colorec-tal Cancer, and Marijuana Use in Canada
Google Trends provides publicly accessible informa-tion regarding search behaviours in a population, which may be studied and used for health campaign evaluation and disease monitoring. This study exam-ined four different diseases: human immunodeficien-cy virus (HIV) infection, stroke, colorectal cancer, and marijuana use. Disease patterns and online activity across all four diseases were significantly correlated.
Canada
University of Waterloo, Canada,[email protected]
Research project
https://www.ncbi.nlm.nih.gov/pmc/articles/PMC5081479/
http://journals.plos.org/plosone/article?id=10.1371/journal.pone.0064323, http://journals.plos.org/plosntds/article?id=10.1371/journal.pntd.0001206, http://journals.plos.org/ploscompbiol/article?id=10.1371/journal.pcbi.1003892, http://www.nature.com/nature/journal/v457/n7232/full/nature07634.html
5.3.1 5.3Online Data and Child Marriage
This project explored the value of analysing online sources and mainstream media to gain insights on child marriage in two countries faced with this chal-lenging issue, namely Ethiopia and India. The project analysed online data sources - news media, Wikipe-dia, web searches - and assessed the availability of signals and type of insights that can be extracted about child marriage.
Web scrap-ing
Ethiopia, India
UN Global Pulse, David and Lucile Packard Founda-tion, USA, [email protected]
UN projecthttp://childmarriage.unglobal-pulse.net/
http://www.unglobalpulse.org/news/%20big-data-ex-ploration-project-child-mar-riage-project-design-phase
8.5
Big Data: Google Searches Predict Unemployment in Finland
Predicting the present and the near future is of inter-est, as the official records of the state of the economy are published with a delay. Data on Google searches are publicly available in real-time. A simple seasonal first-order autoregressive model, which includes relevant Google variables, tends to outperform models that exclude these predictors in predicting the unemployment rate in the short run.
Finland
Research Institute of the Finnish Economy, Finland, University of Helsinki, Finland,[email protected]
Research project
https://www.etla.fi/wp-con-tent/uploads/tuhkuri_NTTS_2015_abstract.pdf
https://ec.europa.eu/eurostat/cros/system/files/Vicen-te-etal_NTTS2015_Forecast-ing%20unemployment%20with%20big%20data_unblind-ed%20abstract.pdf
10.7
Estimating Migra-tion Flows Using Online Search Data
This study was conducted to explore how online search data could be analysed to understand migra-tion flows. Using Australia as a case study, Google search query data from around the world were disaggregated by country and compared to historical official monthly migration statistics provided by UNF-PA.
Australia
UN Global Pulse, UNFPA, http://www.unglobalpulse.org/contact
UN project
http://www.unglobalpulse.org/projects/migra-tion-search-data, http://www.unglobalpulse.org/sites/default/files/UNGP_ProjectSeries_Search_Migra-tion_2014_0.pdf
Table 8 Big data approaches: Online search and access logs

InnovatIve BIg Data approaches for capturIng anD analyzIng Data to MonItor anD achIeve the sDgs
46
Administrative data / citizen cards
▶▶ Introduction
Administrative data refers to data compiled by government branches and other organisations primarily for administrative
purposes, e.g. for registration, transaction or record keeping, usually to document the delivery of a service. Administrative data
differ from previously introduced exhaust data in the sense that they have been collected and utilized already for a long time
unlike CDRs or online logs.
Due to the increasing size and variety in recent years, the utilization of administrative data to complement and enhance survey
data has been discussed. This would be according to the definition of exhaust data, which stands for the reuse of big data that
were not primarily collected for research purposes. Connelly et al. (2016) provide an overview of the potential of administrative
data for social science research, but also list challenges to the use of these data, which have been already generally mentioned
above: Because the data were collected for a different purpose, often extensive cleaning and reformatting is required.
Moreover, privacy is a severe issue and actually prohibits by law the use of administrative data in many countries.
In ROK, the National Statistical Office “Statistics Korea” uses administrative data to improve the quality of survey statistics.
For example, it developed the following administrative statistics, which were applied to about 30 policies and analyses: farm
and fishing village returnee statistics, business establishment and dissolution administrative statistics, newly married couple
statistics, profit corporate administrative statistics, job administration statistics and retirement pension statistics. Moreover,
in 2015 Statistics Korea replaced for their Population and Housing Census 12 items by administrative data, which reduced
significantly both the response burden as well as the budget of the census.
In the USA in particular, Chetty and colleagues have conducted significant work in this field. For example, Chetty et al. (2011)
present the analysis of school district data from grades 3 to 8 for 2.5 million children in connection with tax records on parent
characteristics and adult outcomes. Thereby, they show the long-term impact of teachers on the subsequent earnings of former
students and come to the conclusion that “good teachers create substantial economic value”.
While this research is linked in general to SDG 4 and there are also other studies of with big administrative data regarding social
issues such as poverty or employment, they do not address specifically the calculation of SDG indicators or the achievement of
SDG targets.
A specific carrier of administrative data are citizen cards as they hold readable information about its owner. Such cards for
various purposes are not a new invention. A more recent innovation is that citizen cards can be recognized by sensors, thereby
producing further exhaust data. Depending on the purpose of the card, the cardholder can be identified (This applies, for
example, to ID cards with biometric data.) or keeps her/him anonymous (This applies, for example, to cards, which track only
the use of public transport.). There is a tendency to merge cards for various purposes into one for convenience. For example,
the Resident Card in the Chinese city Hangzhou offers access to public transportation, health facilities, libraries, parks and other
public facilities70.
70 See: http://www.96225.com/smknet/service/show_allGet.action?chanageCrd=1

InnovatIve BIg Data approaches for capturIng anD analyzIng Data to MonItor anD achIeve the sDgs
47
▶▶ Approaches
SDG indica-
tor
SDG target Name Description
Data mash-up with oth-
er sourcesCountries
Organisations and contact
details
Type of project URL
Examples for similar approaches
(or further description of the approach)
11.2.1 11.2 Oyster card
Transport for London (TfL) has always been a data-rich organisation, recording information since 1971; but it was not until the Oyster card arrived in 2003 that the volume and richness of the data exploded. In 2005 TfL entered into a research partnership with the Massachusetts Insti-tute of Technology to focus on how to exploit data. Data is key to provide better transport. TfL has to understand how people behave and how to manage their transport needs. Big Data analysis also helps TfL respond in a personalised way when disruption occurs.
UK
Transport for London, UK, Massachusetts Institute of Tech-nology, USA,
https://tfl.gov.uk/help-and-con-tact/
Govern-ment project
https://oyster.tfl.gov.uk/oyster/entry.do
http://www.citymetric.com/transport/data-helps-us-provide-better-transport-tfl-oyster-cards-big-data-and-contactless-payments-1396, http://www.96225.com/smknet/service/show_allGet.action?chanageCrd=1
Table 9 Big data approaches: Administrative data / citizen cards

InnovatIve BIg Data approaches for capturIng anD analyzIng Data to MonItor anD achIeve the sDgs
48
postal data
▶▶ Introduction
Postal flows are another source of exhaust data, which could be used as a proxy indicator to examine the wellbeing of a
population. Postal services predate the internet more than a hundred years. But only recently have traceable digital data
records been introduced, which allow efficient analysis of the flows. However, while this approach develops a proxy indicator
for wellbeing in general, it does not address specific SDG targets or indicators. Moreover, it applies mostly to developing
countries, although there are more suitable indicators in developed countries to examine wellbeing.

InnovatIve BIg Data approaches for capturIng anD analyzIng Data to MonItor anD achIeve the sDgs
49
▶▶ Approaches
SDG indica-
tor
SDG target Name Description
Data mash-up with oth-
er sourcesCountries
Organisations and contact
details
Type of project URL
Examples for similar approaches
(or further description of the approach)
Un-speci fied
Un-speci fied
Building Proxy Indicators of National Well-being with Postal Data
This study investigated for the first time the potential of using the network of international postal flows to approx-imate socioeconomic indicators typically used to bench-mark national wellbeing. The research used aggregated electronic postal records from 187 countries collected by the Universal Postal Union over a four-year period (2010-2014) to create an international network showing the way post flows around the world. This enabled the building of proxy indicators or proxies for a number of fourteen socioeconomic indicators, demonstrating new approaches to approximating indicators such as the Human Development Index and Gross Domestic Product.
187 coun-tries
UN Global Pulse, University of Cambridge, UK, Universal Postal Union,
http://www.unglobalpulse.org/contact
UN project
http://www.unglobalpulse.org/projects/estimating-na-tional-wellbeing-with-post-al-data
http://unglobalpulse.org/sites/default/files/UNGP_ProjectSeries_postal_data_and_national_wellbeing.pdf, http://journals.plos.org/plosone/article?id=10.1371/journal.pone.0155976
Table 10 Big data approaches: Postal data

InnovatIve BIg Data approaches for capturIng anD analyzIng Data to MonItor anD achIeve the sDgs
50
benefits, risks and recommendations
Exhaust data is often named as a prime example for the potential of big data. The presented approaches aim to replace costly occasional
surveys of traditional statistics with cheaper real-time information. Exhaust data complement sensing data as they provide insights about
human activities that cannot be measured by sensors. This comprises virtual activities, for which per se sensors are not available.
These benefits of exhaust data face the risks of inaccuracy and apophenia (see Apophenia) since often proxy indicators are
used. For example, the Google Flu project got significant media attention, but Lazer et al. (2014) and others described various
flaws in this approach. Another concern is to ensure the anonymity of the monitored exhaust data.
Given the existing promising studies harnessing big administrative data for social science research, it is recommended to
explore approaches that utilize big administrative data specifically for the calculation of SDG indicators or the achievement of
SDG targets.
The example of postal data is included because of its relevance to “leave no one behind”, but it is not significant for the
developed ENEA countries. The successful projects using mobile phone data for poverty and food insecurity mapping are not
applicable in the developed ENEA countries either. Some of the other approaches could be adopted, and citizen cards are
partly already established.
Overall, the usefulness of exhaust data has to be evaluated by the accuracy of the revealed information, thereby competing
particularly in developed countries with more precise sensing data, for example when it comes to movements of people (see
Sensors in cities, transport and homes).
SEnSInG DATA
satellite and uAv imagery
▶▶ Introduction
Satellite and unmanned aerial vehicles (UAVs) imagery are further classical sources of big data. Satellite images are not new, but
the number of satellites keeps rising, the coverage is more comprehensive, the images get higher resolutions and recognition
mechanisms get better. UAVs, also called drones, have become very popular in recent years for various applications also for
civilian customers, while they were before known for military operations. Also for this source of big data, the UN Global Working
Group on Big Data has established a dedicated task team “Satellite Imagery and Geo-Spatial Data”71.
Satellite and UAV imagery belong to the big data category “sensing data”. To be more precise, satellites and UAVs are
conducting “remote sensing”, which is when sensors are gathering data from objects without being in physical contact with
them, sometimes even from far away. Therefore, these sensing data are also the only ones, which are not part of the IoT.
Satellite and UAV imagery is useful to assess large and not easily accessible areas. For example, crop production and harvests
can be measured, land cover and land use in general, and also the condition of ecosystems and natural disaster impacts, e.g.
after earthquakes and flooding. Satellite images are impacted when the areas of interest are covered by clouds.
71 See for details: https://unstats.un.org/bigdata/taskteams/satellite/

InnovatIve BIg Data approaches for capturIng anD analyzIng Data to MonItor anD achIeve the sDgs
51
Within the UN, there is the UNOSAT programme “delivering imagery analysis and satellite solutions to relief and development organisations
within and outside the UN system to help make a difference in critical areas such as humanitarian relief, human security, strategic territorial
and development planning”72. For UAVs, UN OCHA issued a policy paper on how to use them for data collection and observation in
humanitarian response, e.g. for damage assessment (United Nations Office for the Coordination of Humanitarian Affairs, 2014).
The indispensable second step after capturing images has to be their analysis, for which AI methods for object recognition are
essential to replace inefficient manual analyses.
72 See: https://unitar.org/unosat/

InnovatIve BIg Data approaches for capturIng anD analyzIng Data to MonItor anD achIeve the sDgs
52
▶▶ Approaches
SDG indica-
tor
SDG target Name Description
Data mash-up with oth-
er sourcesCountries Organisations and contact
detailsType of project URL
Examples for similar approaches
(or further description of the approach)
1.1.1, 1.2.1, 1.2.2
Measuring Poverty with Machine Roof Counting
The types of roofs of houses in Uganda are used as a proxy-indicator for poverty by the Uganda Bureau of Statistics. Traditional thatched roofs harbour pests and disease and are high maintenance. Therefore, as soon as they can afford it citizens will upgrade to a metal or tiled roof. At the same time, a wide variety of remote sensing image sources from highly light-sensitive satellites, high-resolution (<1m) image data, nano-satellites, balloon mapping, and low-cost unmanned aerial vehicles is available for measuring sustainable development.
Uganda
UN Global Pulse Kampala, Uganda,[email protected]
UN projecthttp://www.unglobalpulse.org/projects/measuring-pov-erty-machine-roof-counting
1.1.1, 1.2.1, 1.2.2
Combining satellite imagery and machine learning to predict poverty
A method, which requires only publicly avail-able satellite data, is introduced to transform efforts to track and target poverty in devel-oping countries. It also demonstrates how powerful machine-learning techniques can be applied in a setting with limited training data, suggesting broad potential application across many scientific domains.
Malawi, Nigeria, Rwanda, Tanzania, Uganda
Stanford University, USA, Na-tional Bureau of Economic Research, USA, [email protected]
Research project
https://web.stanford.edu/~m-burke/papers/JeanBurkeE-tAl2016.pdf
http://www.sciencedirect.com/science/article/pii/S0098300409001253
1.5.2, 11.5.2
Towards a rapid automatic detection of building damage using remote sensing for disaster man-agement: The 2010 Haiti earthquake
Satellite and airborne images are increasingly used at different stages of disaster manage-ment, especially in the detection of infrastruc-ture damage. Damage maps produced by international organisations are still based on visual interpretation of images, which is time- and labour-consuming. An automatic damage mapping has been developed, which proves to be reliable and could be used in emergency situations for a first and rapid assessment of building damage.
Haiti
Institut national de la recher-che scientifique, Canada, University of Canterbury, New Zealand, Centre national de la recherche scientifique, France, École des sciences de la gestion, Canada, [email protected]
Research project
https://www.researchgate.net/publication/262849847_Towards_a_rapid_automatic_detection_of_building_dam-age_using_remote_sensing_for_disaster_management_The_2010_Haiti_earthquake
http://www.utpjournals.press/doi/pdf/10.3138/car-to.46.3.200, http://citeseerx.ist.psu.edu/viewdoc/citations;-jsessionid=F0821230E94B-135D5C54BC2FB8F2776F?-doi=10.1.1.711.2735

InnovatIve BIg Data approaches for capturIng anD analyzIng Data to MonItor anD achIeve the sDgs
53
SDG indica-
tor
SDG target Name Description
Data mash-up with oth-
er sourcesCountries Organisations and contact
detailsType of project URL
Examples for similar approaches
(or further description of the approach)
2.4.1
A near real-time sat-ellite-based global drought climate data record
Reliable drought monitoring requires long-term and continuous precipitation data. High-resolution satellite measurements provide valuable precipitation information on a quasi-global scale. However, their short lengths of records limit their applications in drought monitoring. In addition to this limita-tion, long-term low-resolution satellite-based gauge-adjusted data sets such as the Global Precipitation Climatology Project one are not available in near real-time form for timely drought monitoring. This study bridges the gap between low-resolution long-term sat-ellite gauge-adjusted data and the emerging high resolution satellite precipitation data sets to create a long-term climate data record of droughts.
AnywhereUniversity of California, USA,[email protected], [email protected]
Research project
http://iopscience.iop.org/arti-cle/10.1088/1748-9326/7/4/ 044037/pdf;jsessionid= B705B61AD701A9EF498F-C1901F63B73B.c4.iopscience.cld.iop.org
https://www.researchgate.net/publication/224383482_Drought_Monitoring_in_Northern_China_based_on_Remote_Sensing_Data_and_Land_Surface_Modeling, http://www.iwmi.cgiar.org/Publications/IWMI_Research_Reports/PDF/pub085/RR85.pdf
2.4.1, 6.4.1, 6.4.2
2.4, 6.4 AQUASTAT
AQUASTAT is FAO's global water information system, developed by the Land and Water Division. It is the most quoted source on global water statistics. Data and information by coun-try on water resources, water uses, agricultural water management is collected, analysed and disseminated.
Anywhere FAO, [email protected] UN projecthttp://www.fao.org/nr/water/aquastat/main/index.stm
6.3.2 6.3, 6.6Water Quality Monitoring
EOMAP is the leading global service provider of satellite-derived aquatic information in maritime and inland waters. The Water Qual-ity Monitoring Services are focused on key parameters of water quality measures such as turbidity, suspended matter, chlorophyll-a or harmful algae blooms.
AnywhereEOMAP, Germanyhttp://www.eomap.com/contact-support/
Com-mercial product
http://www.eomap.com/ser-vices/water-quality/
6.6.1 Global Man-grove Watch
Mangroves are of critical importance as breeding and nursery areas for birds, fish and shellfish and play an important role in the reg-ulation of freshwater, nutrients and sediment inputs into the marine coastal waters. The satellites JERS-1, ALOS and ALOS-2 provide fine resolution (25 m) geospatial information about mangrove extent and changes.
Anywhere
Aberystwyth University, UK, University of New South Wales, Australia, JAXA, Japan, soloEO, Sweden, [email protected]
Research project
https://www.earthobserva-tions.org/documents/pub-lications/201703_geo_eo_for_2030_agenda.pdf

InnovatIve BIg Data approaches for capturIng anD analyzIng Data to MonItor anD achIeve the sDgs
54
SDG indica-
tor
SDG target Name Description
Data mash-up with oth-
er sourcesCountries Organisations and contact
detailsType of project URL
Examples for similar approaches
(or further description of the approach)
7.1.1
Estimating rural popula-tions without access to electricity in developing countries through night-time light satellite imagery
This paper describes the extent to which electricity access can be investigated using nighttime light satellite data and spatially explicit population datasets to compare elec-tricity access between 1990 and 2000. The first satellite-derived estimates of rural population without access to electricity in developing countries are presented to draw insights on issues surrounding the delivery of electricity to populations in rural areas.
Anywhere
United Nations University, Japan, University of Tokyo, Japan, International Institute for Applied Systems Analysis, Austria,[email protected]
Research project
http://www.sciencedirect.com/science/article/pii/S030142151000385X
http://onlinelibrary.wiley.com/doi/10.1002/9780470979563.ch15/summary
7.2.1
A Thermody-namic Geog-raphy: Night-Time Satellite Imagery as a Proxy Mea-sure of Emergy
Nighttime satellite imagery enables the measurement, visualization, and mapping of energy consumption in an area. Emergy has renewable and non-renewable components. Our results show that the non-renewable com-ponent of national emergy use is positively correlated with nighttime satellite imagery. This relationship can be used to produce emergy density maps, which enable the incor-poration of spatially explicit representations of emergy in geographic information systems.
Italy
University of Siena, Italy, NOAA National Geophysical Data Center, USA, University of South Australia, Australia, University of Denver, USA,[email protected]
Research project
https://www.ncbi.nlm.nih.gov/pmc/articles/PMC4190140/
8.1.1
Measuring Economic Growth from Outer Space
A statistical framework has been developed to use satellite data on night-lights to augment official income growth measures. For countries with poor national income accounts, the optimal estimate of growth is a composite with roughly equal weights on conventionally measured growth and growth predicted from lights.
Developing countries in general
National Bureau of Econom-ic Research, USA, Brown University, USA,[email protected]
Research project
https://www.aeaweb.org/arti-cles?id=10.1257/aer.102.2.994, http://www.nber.org/papers/w15199.pdf
https://www.researchgate.net/publication/242254394_Estimation_of_Gross_Domestic_Product_at_Sub-National_Scales_Using_Nighttime_Satellite_Imagery, http://www.pnas.org/con-tent/108/21/8589.full
8.7.1 8.7Ending slav-ery on Lake Volta
Lake Volta in Ghana is a site of systemic modern slavery: Children are forced to work as slaves in the area’s fishing industry. By search-ing DigitalGlobe satellite imagery of Lake Volta and placing a tag on every boat, building and fish cage, online volunteers are helping to create a valuable data set that, for the first time, will begin to provide an understanding of the modern slavery landscape in this area of the world.
Participato-ry Sensing / crowd-sourcing
Ghana
Global Fund to End Slavery, USA, Tomnod, USA,http://www.fundtoendslav-ery.org/contact-us/
NGO project
http://blog.tomnod.com/end-ing-slavery-on-lake-volta

InnovatIve BIg Data approaches for capturIng anD analyzIng Data to MonItor anD achIeve the sDgs
55
SDG indica-
tor
SDG target Name Description
Data mash-up with oth-
er sourcesCountries Organisations and contact
detailsType of project URL
Examples for similar approaches
(or further description of the approach)
9.1.1 9.1
Population Distribution, Settlement Patterns and Accessibility across Africa in 2010
Approaches are outlined to develop a new high-resolution population distribution dataset for Africa and analyse rural accessi-bility to population centres. Contemporary population count data were combined with detailed satellite-derived settlement extents to map population distributions across Africa at a finer spatial resolution than ever before. The analyses highlight large inequities in access, the isolation of many rural populations and the challenges that exist between countries and regions in providing access to services.
Africa
University of Florida, USA, Fogarty International Center, USA,[email protected]
Research project
http://journals.plos.org/plosone/article?id=10.1371/journal.pone.0031743
11.1.1
Slums from Space — 15 Years of Slum Mapping Using Remote Sens-ing
The body of scientific literature on slum mapping employing remote sensing methods has increased since the availability of more very-high-resolution sensors. This review provides an overview of slum mapping-related remote sensing publications over the period from 2000 to 2015 regarding four dimensions: contextual factors, physical slum charac-teristics, data and requirements, and slum extraction methods.
Anywhere
University of Twente, Netherlands, University of Amsterdam, Netherlands, [email protected]
Research project
www.mdpi.com/2072-4292/8/6/455/pdf
http://edoc.hu-berlin.de/dissertationen/kit-oleksan-dr-2014-02-13/PDF/kit.pdf
11.3.1
Spatial modelling of urban change using satellite re-mote sensing
A critical review of published studies is provid-ed that made use of satellite remote sensing and GIS in understanding the dynamism of urban areas through change detection and urban modelling.
AnywhereUniversity of Johannesburg, South Africa, [email protected]
Research project
https://www.researchgate.net/publication/272183077_Spatial_modelling_of_urban_change_using_satellite_remote_sensing_a_review
http://www.sciencedirect.com/science/article/pii/S0034425705000696
11.6.2 Geostation-ary satellite Himawari-8
Fine particulate matter concentrations over cities are estimated by numerical modelling, integrating satellite data and in-situ data. Aerosol data from the geostationary satellite Himawari-8 are available every 10 min with 5 km ground resolution. Hot spot detection and forest fire/smoke haze monitoring are conducted using other geostationary and low Earth orbiting satellites. Satellite-based estimates of PM2.5 rely on this data.
Anywhere
Japan Meteorological Agency, Ministry of the En-vironment, Japan, National Institute for Environmental Studies, Japan, Common-wealth Scientific and Indus-trial Research Organisation, Australia, WHO, [email protected]
Govern-ment project
https://www.earthobserva-tions.org/documents/pub-lications/201703_geo_eo_for_2030_agenda.pdf

InnovatIve BIg Data approaches for capturIng anD analyzIng Data to MonItor anD achIeve the sDgs
56
SDG indica-
tor
SDG target Name Description
Data mash-up with oth-
er sourcesCountries Organisations and contact
detailsType of project URL
Examples for similar approaches
(or further description of the approach)
14.1.1 14.1
Extraction of marine debris in the Sea of Japan using high-spa-tial-resolution satellite images
The small size of most marine debris in the Sea of Japan makes it impossible to be confirmed directly, even when using high-spatial-res-olution satellite imagery. Thus, to extract candi-date pixels containing possible marine debris, pixels with spectra that differ from those of the surrounding ocean and wave crests were identified.
AnywhereFukui University of Technolo-gy, Japan, [email protected]
Research project
http://proceedings.spiedig-itallibrary.org/proceeding.aspx?articleid=2521526
https://eos.org/meet-ing-reports/develop-ing-a-remote-sensing-sys-tem-to-track-marine-debris
15.1.115.1, 15.2, 15.b
Real Time System for Detection of Deforestation (DETER)
A satellite-based alert system could prove a potent weapon in the fight against deforesta-tion. One such effort, the Real Time System for Detection of Deforestation, or DETER, has helped Brazil’s government to reduce its deforestation rate by almost 80% since 2004, by alerting the country’s environmental police to large-scale forest clearing.
BrazilNational Institute for Space Research, Brazil, [email protected]
Research project
http://ieeexplore.ieee.org/stamp/stamp.jsp?ar-number=7128317, http://www.nature.com/news/satellite-alerts-track-deforesta-tion-in-real-time-1.19427
https://www.gislounge.com/using-drones-to-protect-indig-enous-lands/, http://dup.esrin.esa.it/page_project154.php, https://artes.esa.int/news/logging-smart-way
15.3.1 DesertWatch
A geo-information system was developed to produce a set of geo-information maps and indicators in order to monitor desertification, droughts and land degradation worldwide. The DesertWatch project aimed at develop-ing a user-tailored, standardised, commonly accepted and operational information system based on electro-optics technology to support national and regional authorities in reporting commonly to the UNCCD and assessing and monitoring desertification and its trends over time.
AnywhereEuropean Space Agency,[email protected]
Research project
http://due.esrin.esa.int/page_project65.php
http://due.esrin.esa.int/files/ 131-176-149-30_ 2009430103633.pdf
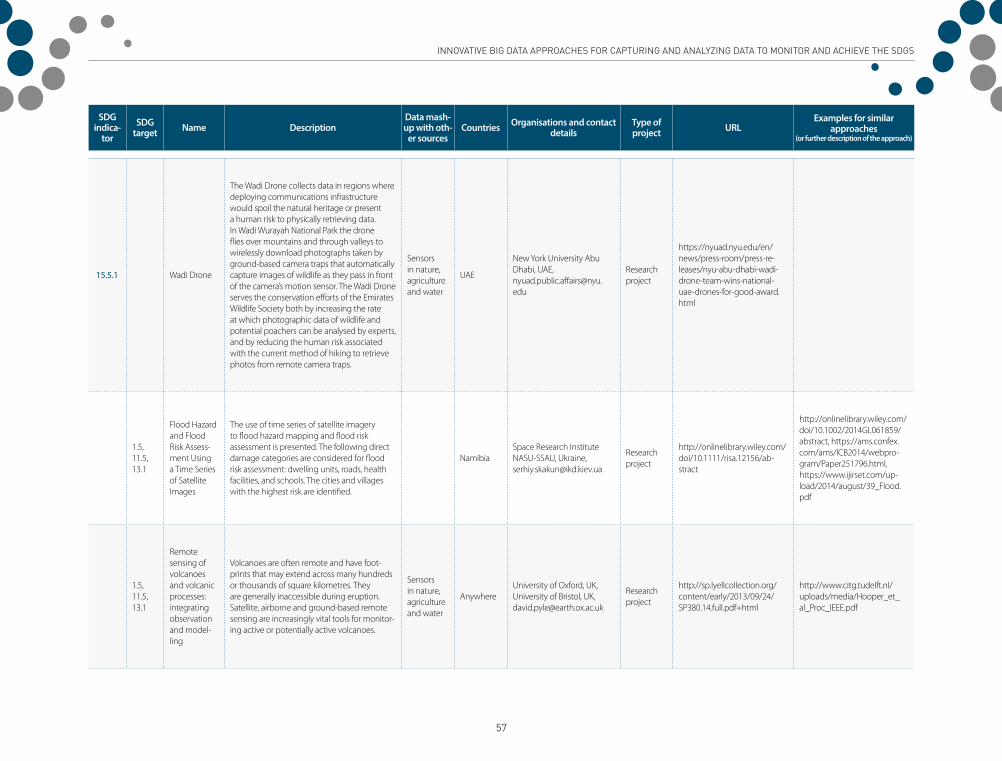
InnovatIve BIg Data approaches for capturIng anD analyzIng Data to MonItor anD achIeve the sDgs
57
SDG indica-
tor
SDG target Name Description
Data mash-up with oth-
er sourcesCountries Organisations and contact
detailsType of project URL
Examples for similar approaches
(or further description of the approach)
15.5.1 Wadi Drone
The Wadi Drone collects data in regions where deploying communications infrastructure would spoil the natural heritage or present a human risk to physically retrieving data. In Wadi Wurayah National Park the drone flies over mountains and through valleys to wirelessly download photographs taken by ground-based camera traps that automatically capture images of wildlife as they pass in front of the camera’s motion sensor. The Wadi Drone serves the conservation efforts of the Emirates Wildlife Society both by increasing the rate at which photographic data of wildlife and potential poachers can be analysed by experts, and by reducing the human risk associated with the current method of hiking to retrieve photos from remote camera traps.
Sensors in nature, agriculture and water
UAE
New York University Abu Dhabi, UAE, [email protected]
Research project
https://nyuad.nyu.edu/en/news/press-room/press-re-leases/nyu-abu-dhabi-wadi-drone-team-wins-national-uae-drones-for-good-award.html
1.5, 11.5, 13.1
Flood Hazard and Flood Risk Assess-ment Using a Time Series of Satellite Images
The use of time series of satellite imagery to flood hazard mapping and flood risk assessment is presented. The following direct damage categories are considered for flood risk assessment: dwelling units, roads, health facilities, and schools. The cities and villages with the highest risk are identified.
NamibiaSpace Research Institute NASU-SSAU, Ukraine,[email protected]
Research project
http://onlinelibrary.wiley.com/doi/10.1111/risa.12156/ab-stract
http://onlinelibrary.wiley.com/doi/10.1002/2014GL061859/abstract, https://ams.confex.com/ams/ICB2014/webpro-gram/Paper251796.html, https://www.ijirset.com/up-load/2014/august/39_Flood.pdf
1.5, 11.5, 13.1
Remote sensing of volcanoes and volcanic processes: integrating observation and model-ling
Volcanoes are often remote and have foot-prints that may extend across many hundreds or thousands of square kilometres. They are generally inaccessible during eruption. Satellite, airborne and ground-based remote sensing are increasingly vital tools for monitor-ing active or potentially active volcanoes.
Sensors in nature, agriculture and water
AnywhereUniversity of Oxford, UK, University of Bristol, UK,[email protected]
Research project
http://sp.lyellcollection.org/content/early/2013/09/24/SP380.14.full.pdf+html
http://www.citg.tudelft.nl/uploads/media/Hooper_et_al_Proc_IEEE.pdf

InnovatIve BIg Data approaches for capturIng anD analyzIng Data to MonItor anD achIeve the sDgs
58
SDG indica-
tor
SDG target Name Description
Data mash-up with oth-
er sourcesCountries Organisations and contact
detailsType of project URL
Examples for similar approaches
(or further description of the approach)
1.5, 11.5, 13.1
Alpine Avalanche Forecast
Avalanche warning services base their prod-ucts mainly on numerical weather prediction outputs, networks of automatic stations and observers in the field. Presently many European networks are not dense enough and observations by people in the field are hindered by bad weather conditions or high avalanche danger. Satellite technology has the potential to close existing information gaps by acquiring data automatically even over remote areas.
Sensors in nature, agriculture and water
Switzerland
WSL Swiss Federal Institute for Forest, Snow and Land-scape Research, Switzerland, European Space Agency, [email protected], [email protected]
Govern-ment project
https://artes-apps.esa.int/projects/aaf
1.5, 11.5, 13.1
Monitoring Alpine Trans-portation Infrastructure using Space Techniques (MATIST)
Rock falls and landslides are natural hazards of special relevance to mountainous areas with severe human and economic consequences. The MATIST services provide ground motion information to operators of alpine transporta-tion infrastructures such as railway companies, institutes representing the national roads and companies from the energy sector. Information related to the ground motion is obtained from the integration of satellite and terrestrial radar interferometry and space-based navigation.
Sensors in nature, agriculture and water
Austria, Switzerland
Gamma Remote Sensing, Switzerland, European Space Agency, [email protected]
Govern-ment project
https://artes-apps.esa.int/projects/MATIST
2.3
Remote sensing time series analysis for crop mon-itoring with the SPIRITS software
Monitoring crop and natural vegetation condi-tions is highly relevant, particularly in the food insecure areas of the world. Data from remote sensing image time series at high temporal and medium to low spatial resolution can assist this monitoring as they provide key information about vegetation status in near real-time over large areas.
Anywhere
Joint Research Centre, European Commission, Institute for Environment and Sustainability, Ispra, Italy, University of Natural Resources and Life Sciences, Austria, Vlaamse Instelling voor Technologisch Onder-zoek, Belgium,[email protected]
Research project
http://journal.frontiersin.org/article/10.3389/fen-vs.2015.00046/full
http://dl.nsf.ac.lk/bit-stream/handle/1/19670/SLJTS_77_1_2_2012_70.pdf?sequence=2

InnovatIve BIg Data approaches for capturIng anD analyzIng Data to MonItor anD achIeve the sDgs
59
SDG indica-
tor
SDG target Name Description
Data mash-up with oth-
er sourcesCountries Organisations and contact
detailsType of project URL
Examples for similar approaches
(or further description of the approach)
3.3
Prediction of a Rift Valley fever outbreak
El Niño/Southern Oscillation related climate anomalies were analyzed by using a combi-nation of satellite measurements of elevated sea-surface temperatures and subsequent ele-vated rainfall and satellite-derived normalized difference vegetation index data. A Rift Valley Fever (RVF) risk-mapping model using these climate data predicted areas where outbreaks of RVF in humans and animals were expect-ed and occurred in the Horn of Africa from December 2006 to May 2007. The predictions were subsequently confirmed by entomologi-cal and epidemiological field investigations of virus activity in the areas identified as at risk.
Kenya, Somalia, Tanzania
National Aeronautics and Space Administration (NASA), USA, Walter Reed Army Institute of Research, USA, WHO, United States Army Medical Research Unit-Kenya, USA, Agricultural Research Service Center for Medical, Agricultural, and Veterinary Entomology, USA,[email protected]
Research project
http://www.pnas.org/con-tent/106/3/955
3.9 Sentinel 5
The Sentinel-5 mission focuses on monitoring of trace gas concentrations and aerosols in the atmosphere to support operational services covering air-quality near-real time applications, air-quality protocol monitoring and climate protocol monitoring.
AnywhereEuropean Space Agency,[email protected]
Research project
https://earth.esa.int/web/guest/missions/esa-fu-ture-missions/sentinel-5, https://directory.eoportal.org/web/eoportal/satellite-mis-sions/c-missions/coperni-cus-sentinel-5
3.9 Haze Gazer
The forest and peat land fires, which occur on an annual basis in Indonesia, affect the entire Southeast Asian region resulting in extensive environmental destruction and threaten-ing livelihoods. To better support affected populations, the Government of Indonesia is looking for more timely and effective means of tracking and managing the impact of fire and haze events. In response, Pulse Lab Jakarta has developed Haze Gazer, a crisis analysis and visualisation tool that provides real-time situa-tional information from various data sources to enhance disaster management efforts.
Participato-ry Sensing / crowd-sourcing, Social media data
IndonesiaUN Global Pulse Lab Jakarta, Indonesia, [email protected]
UN projecthttp://www.unglobalpulse.org/projects/haze-gazer-a-crisis-analysis-tool
http://www.unglobalpulse.org/projects/monitoring-so-cial-response-and-after-nat-ural-disasters-data-analytics, http://www.unglobalpulse.org/sites/default/files/UNGP_ProjectSeries_Peat_Haze_2014_0.pdf

InnovatIve BIg Data approaches for capturIng anD analyzIng Data to MonItor anD achIeve the sDgs
60
SDG indica-
tor
SDG target Name Description
Data mash-up with oth-
er sourcesCountries Organisations and contact
detailsType of project URL
Examples for similar approaches
(or further description of the approach)
3.9
China deploys big data to clear smog
China's Ministry of Environmental Protection is tackling the country's severe air-pollution problems by using a holistic approach to the collection, analysis and quality assurance of vast amounts of data — and making the information publicly accessible. The ministry has improved sharing of data from multiple sources. Satellite data are used to analyse and predict general air quality and pollution by particulate matter. Drones monitor pollution discharges, measure air quality and assess the effectiveness of environmental-protection programmes. Citizens contribute widely by promptly reporting pollution episodes.
Participato-ry Sensing / crowd-sourcing
ChinaMinistry of Environmental Protection, China,[email protected]
Govern-ment project
http://www.nature.com/nature/journal/v542/n7639/full/542031a.html
11.4European Space Imag-ing
European Space Imaging (EUSI) released a new case study outlining the success of using sat-ellite imagery to help protect UNESCO World Heritage sites. When the so-called "Islamic State" was rumoured in the media to have destroyed two cultural heritage sites in Iraq, Hatra and Nimrud, officials could not reach the areas in person to confirm the damage. Instead, archaeologists with experience in the use of satellite remote sensing turned to very high-resolution imagery supplied by EUSI to safely assess the situation on the ground.
IraqEuropean Space Imaging,[email protected]
Research project
http://www.euspaceimaging.com/images/casestudies/CS14_EUSI_DAI_DLR-FINAL_web.pdf
http://www.aaas.org/sites/default/files/content_files/AAAS-SyrianWHS-9182014.pdf, http://www.aaas.org/page/high-resolution-satellite-im-agery-and-destruction-cultur-al-artifacts-nakhchivan-azer-baijan
13.2
Greenhouse gases Observing Satellite "IBUKI"
IBUKI is able to measure the concentration of greenhouse gases such as CO2 and CH4 over almost the entire surface of the earth at equal intervals every 3 days from the orbit traveling around the earth in approx. 100 minutes.
Anywhere
Japan Aerospace Exploration Agency, Japan, Japanese Ministry of Environment, Japan, National Institute of Environmental Studies, Japan, https://ssl.tksc.jaxa.jp/space/inquiries/index_e.html
Govern-ment project
http://global.jaxa.jp/projects/sat/gosat/index.html
14.4, 14.6
Global Fish-ing Watch
The world’s oceans are threatened by global overfishing, illegal fishing and habitat de-struction. Global Fishing Watch allows users to monitor when and where commercial fishing is occurring around the world.
AnywhereGlobal Fishing Watch, USA,[email protected]
NGO project
http://globalfishingwatch.org
http://www.pewtrusts.org/en/multimedia/video/2015/project-eyes-on-the-seas, http://www.esa.int/Our_Ac-tivities/Telecommunications_Integrated_Applications/Tracking_marine_traffic_via_satellite

InnovatIve BIg Data approaches for capturIng anD analyzIng Data to MonItor anD achIeve the sDgs
61
SDG indica-
tor
SDG target Name Description
Data mash-up with oth-
er sourcesCountries Organisations and contact
detailsType of project URL
Examples for similar approaches
(or further description of the approach)
15.7, 15.c
Air SheperdAir Shepherd provides a comprehensive drone-based solution to reduce poaching of elephants and rhinos in Africa.
Malawi, South Africa, Zimbabwe
Air Sheperd, USA, University of Maryland, USA, [email protected]
NGO project
http://airshepherd.org/
https://www.savetherhino.org/rhino_info/thorny_issues/the_use_of_drones_in_rhino_ conservation, http:// theconversation.com/sat-ellites-mathematics-and- drones-take-down-poachers-in-africa- 36638
16.1Human Rights Docu-mentation
AAAS has used geospatial technologies to illu-minate on-the-ground human rights concerns, including: mass violence, secret detention, extrajudicial executions, internal displacement, forced evictions, and displacement caused by development projects.
Afghan-istan, Argentina, Azerbaijan, Bahrain, Democratic Republic of Congo, Ethiopia, Georgia, Kenya, Kyrgyzstan, Lebanon, Libya, Myanmar, Nigeria, Pakistan, Somalia, Sri Lanka, Su-dan, Syria, Turkmeni-stan, Zimbabwe
American Association for the Advancement of Science, USA, [email protected]
https://www.aaas.org/geo-tech/humanrights
http://www.amnestyusa.org/research/science-for-human-rights/remote-sensing-for-human-rights
Table 11 Big data approaches: Satellite and UAV imagery

InnovatIve BIg Data approaches for capturIng anD analyzIng Data to MonItor anD achIeve the sDgs
62
sensors in cities, transport and homes
▶▶ Introduction
This group of big data generating sensors is often described within the rather vague umbrella term “smart city”. Among a
variety of existing definitions, one characterises a smart city as “[…] an improvement on today’s city both functionally and
structurally, using information and communication technology (ICT) as an infrastructure” (International Telecommunication
Union, 2013, p. 1). The basic component towards these improvements are sensors, which are installed at objects in the city
with the intention to monitor urban flows in the widest sense and to detect any issues in the city life that need to be fixed or
improved.
The attempt to utilize data in London is, for example, portrayed as follows: “Data is everywhere in our city. In the London of
the future it will pour off people, buildings and vehicles. Its capacity to deliver insight and value to change the way the city,
communities and services work is only now starting to be properly realized.”73 According to this quote, the usage of big data to
make cities smarter is still considered to be at an early stage.
In addition, this group comprises sensors at homes, which aim to improve the efficient use of resources as well as the safety. For
example, in the Republic of Korea infrared motion sensors are tested to detect abnormal living patterns of elderly people who
live alone and to improve the efficiency of their healthcare74.
73 See: https://data.london.gov.uk/city-data/
74 See: http://ieeexplore.ieee.org/abstract/document/5711666/?part=1

InnovatIve BIg Data approaches for capturIng anD analyzIng Data to MonItor anD achIeve the sDgs
63
▶▶ Approaches
SDG indica-
tor
SDG target Name Description
Data mash-up with oth-
er sourcesCountries
Organisations and contact
details
Type of project URL
Examples for similar approaches
(or further description of the approach)
11.2.1 11.2
Improving transport planning through real time data analytics
The Smart City team within the Jakarta Government and Pulse Lab Jakarta are collaborating to explore real-time bus location data, service demand data, and real-time traffic information. In its first phase of implementation, the study is focussing on two aspects, mapping locations with abnormal traffic behaviours and understanding how customer demand responds to traffic dynamics.
Indonesia
UN Global Pulse Lab Jakarta, Indonesia,[email protected]
UN project
http://www.unglobalpulse.org/projects/improving-trans-port-planning-with-data-ana-lytics
http://www1.unece.org/stat/platform/display/bigdata/Statistics+Finland+-+Traf-fic+sensor+data+for+com-muting+statistics, http://blog.echomobile.org/post/135184605317/echos-smart-matatu-project
1.5, 11.5
Fire detection
Lumkani has developed an early-warning system to reduce the damage and destruction caused by the spread of shack/slum fires in urban informal settlements. The detectors are networked within a 60-metre radius so that in the event of a fire all devices in this range will ring together, enabling a community-wide response to the danger. There are also smart centralised devices, which gather information about the detector mesh network. These devices constantly check the health of the system and in the event of fire, store GPS coordinates and simul-taneously send text-message warnings to members of the affected community.
South Africa
Lumkani, South Africa,[email protected]
Com-mercial product
http://lumkani.com/
1.5, 11.5, 13.1
Zizmos
Zizmos is an earthquake early warning system and uses a hybrid approach of mobile and wireless sensors. Zizmos is building a cloud-connected seismic network that provides earthquake early-warning and high-resolution shake maps for urban areas. A device is installed at homes and records the ground shaking. It is connected to the home’s wifi and sends signals to Zizmos’ cloud-server. There, an earthquake-detection algorithm monitors all incoming signals. If an earthquake is detected a warning is sent to a mobile phone app.
AnywhereZizmos, USA, [email protected]
Com-mercial product
https://www.zizmos.com/
3.6, 8.8 eagle
Optalert’s early-warning drowsiness-detection system is made up of a series of components that work together to reduce the risk of accidents caused by fatigue by measuring continuously and unobtrusively alertness in drivers and operators.
AnywhereOptalert, Australia, [email protected]
Com-mercial product
http://www.optalert.com/https://en.wikipedia.org/wiki/Driver_drowsiness_detec-tion#Systems

InnovatIve BIg Data approaches for capturIng anD analyzIng Data to MonItor anD achIeve the sDgs
64
SDG indica-
tor
SDG target Name Description
Data mash-up with oth-
er sourcesCountries
Organisations and contact
details
Type of project URL
Examples for similar approaches
(or further description of the approach)
6.4 leakSMART
leakSMART detects water leaks throughout homes, shuts off the water at the first sign of a leak, alerts with both audible and visible alarms and sends an app notification on smart devices.
AnywhereleakSMART, USA,[email protected]
Com-mercial product
https://leaksmart.com/https://www.wateralert.com/water-leak-sensor-cable.php
7.1, 7.3 Gram Power
Smart Metering: Gram Power provides the industry's most integrated smart metering solution at the lowest cost to organize and manage power infrastructure intel-ligently. Smart Microgrids: Energy efficient Smart Micro grids provide on-demand, reliable electricity to telecom towers and rural households with an affordable prepaid purchase model. Smart Energy Monitor: Gram Power's ingenious energy management system makes the under-standing, monitoring and control of energy less cryptic.
India
Gram Power, India,info @grampow-er.com
Com-mercial product
https://www.grampower.com/
http://www.m-kopa.com/, https://unstats.un.org/bigdata/inventory/?select-Title=&selectCountry=&se-lectOrganization=&select-Source=Smart+meter+elec-tricity+data&selectsta-tArea=&selectsdgGoal=
8.8 SmartSite
SmartSite is a site-deployed tool, which monitors worker exposure to harmful factors on site. Immediate feedback is provided when environmental factors (noise, UV, particles) exceed safe working levels, allowing action to be taken. Data are logged automatically in the cloud.
UK
InnovateUK, UK, Amey, UK, Network Rail, UK,http://www.smartsitesafety.com/
Govern-ment project
http://www.smartsitesafety.com/
9.1 StreetScan
StreetScan provides pavement inspection and manage-ment services with sensing technologies (acoustic, radar, optical) installed on work vehicles and detects surface and subsurface roadway defects while driving in traffic.
USAStreetScan, USA,[email protected]
Com-mercial product
https://www.streetscan.com/https://play.google.com/store/apps/details?id=jp.traffichaz-ard.BumpRecorder&hl=en
9.1Sensors to monitor bridges
Researchers from KTH Royal Institute of Technology in Stockholm are rigging up the country’s bridges with multiple sensors that allow early detection of wear and tear. The bridges can even tweet throughout the course of a day.
Sweden
KTH Royal Insti-tute of Technolo-gy, Sweden, [email protected]
Research project
https://www.kth.se/en/forskning/artiklar/sensors-to-monitor-bridges-and-even-enable-them-to-tweet-1.682868?platform=hootsuite

InnovatIve BIg Data approaches for capturIng anD analyzIng Data to MonItor anD achIeve the sDgs
65
SDG indica-
tor
SDG target Name Description
Data mash-up with oth-
er sourcesCountries
Organisations and contact
details
Type of project URL
Examples for similar approaches
(or further description of the approach)
10.2, 11.2
Mobi+
The Mobi+ project aims to improve the accessibility (services) to urban public transportation to meet the re-quirements of Disabled, Wheelchair and Blind (DWB) peo-ple by adopting advanced information & communication technologies and green technologies concepts. In this system, the disabled people, including the passengers with baby buggies will take a specific ticket (RFID tag) to indicate the type of their handicap (e.g., wheelchair user). The Mobi+ system is an event-driven state-transition system that can provide the DWB detection/alarm no-tification services in the station peer, the environmental surveillance/bus parking and access services in the bus peer, and the wireless communication service between buses and states in the wireless subsystem.
France
Harbin Institute of Technology, China, University of Clermont-Fer-rand II, France,[email protected]
Govern-ment project
www.mdpi.com/1424-8220/12/8/10678/pdf
http://www.onyxbeacon.com/world-premiere-large-scale-ibeacons-network-guides-visually-impaired-people-to-use-the-public-transportation-service/
11.7, 16.1
Automatic detection of abnormal behaviour and threats in crowded spaces
Today's surveillance systems cannot effectively distin-guish between normal and uncharacteristic, possibly threatening behaviour of masses or individuals, particu-larly prior to a harmful or destructive event. Researchers developed and tested visual and acoustic sensor process-ing and inference mechanisms that enable long-term monitoring of the location and behaviour of people close to an acoustic event. These include gunshots, breaking glass, screams and offensive songs.
SwedenEuropean Union,[email protected]
Govern-ment project
http://cordis.europa.eu/result/rcn/155989_en.html
12.3
Vol-ume-based Food Waste Fee System
The Ministry of Environment has been shifting its policy direction to restrict the generation of food waste and has implemented a volume-based food waste fee system that imposes fees in proportion to the amount of food waste generated. The RFID system allows the information on a discharge to be checked through an electronic tag, and fees are charged according to the waste volume.
Republic of Korea
Ministry of Environment, Republic of Korea,http://eng.me.go.kr/eng/web/index.do?menuId=10
Govern-ment project
http://eng.me.go.kr/eng/web/index.do?menuId=387
Table 12 Big data approaches: Sensors in cities, transport and homes
InnovatIve BIg Data approaches for capturIng anD analyzIng Data to MonItor anD achIeve the sDgs
66
sensors in nature, agriculture and water
▶▶ Introduction
Increasingly sensors are also used in rural areas and in nature, including in developing countries, i.e. the information gap
between the world and the internet is reduced even further. Sensors in remote areas can be seen as a step towards the theme
“to leave no one behind” as they provide data from areas, of which information is lacking. As a consequence, valuable insights
are gained and the longer the data are collected and the bigger the data pool gets, the better analyses can be made. This also
includes disaster forecast as a priority area to enable early warning of, for example, flooding, landslides and avalanches.

InnovatIve BIg Data approaches for capturIng anD analyzIng Data to MonItor anD achIeve the sDgs
67
▶▶ Approaches
SDG indica-
tor
SDG target Name Description
Data mash-up with oth-
er sourcesCountries
Organisations and contact
details
Type of project URL
Examples for similar approaches
(or further description of the approach)
6.3.2 6.3, 6.6Waspmote Smart Water
Waspmote Smart Water is a water quality-sensing plat-form featuring autonomous nodes that connect to the cloud for real-time water control. Waspmote Smart Water is suitable for potable water monitoring, chemical leakage detection in rivers, remote measurement of swimming pools and spas, and levels of seawater pollution.
AnywhereLibelium, Spain,[email protected]
Com-mercial product
http://www.libelium.com/smart-water-sensors-to-mon-itor-water-quality-in-rivers-lakes-and-the-sea/
14.3.1
SeapHOx, Deep SeapHOx, SeaFET, SBE 18, SBE 27, Float Deep SeaFET
Sea-Bird Scientific manufactures the following pH sensors: pH and CTD plus Dissolved Oxygen, for Moored applications to 50 m, pH and CTD plus Dissolved Oxygen, for Moored applications to 2000 m, pH for Moored applications to 50 m, pH only, for Profiling applications to 1200 m, pH and ORP, for Profiling applications to 1200 m, pH for Autonomous profiling floats (Argo).
Anywhere
Sea-Bird Scientific, USA,[email protected]
Com-mercial product
https://sea-birdscientific.com/pH/#sthash.zqgtxgx4.dpbs
15.5.1
A comparison of automated and tradition-al monitoring techniques for marbled murrelets using passive acoustic sensors
Autonomous sensors and automated analysis have great potential to reduce cost and increase efficacy of wildlife monitoring. By increasing sampling effort, autonomous sensors are powerful at detecting rare and elusive species such as the marbled murrelet (Brachyramphus marmora-tus).
USA
University of California, USA, California State Park, USA,[email protected]
Research project
http://onlinelibrary.wiley.com/doi/10.1002/wsb.608/full
https://www.ncbi.nlm.nih.gov/pmc/articles/PMC3231152/, http://www.mitrabaratchi.com/sensors-13-06054-v2.pdf
1.5, 11.5, 13.1
The "Ava-lanche De-tector", a new avalanche monitoring tool using distributed acoustic fibre optic sensing
Information on avalanche activity is a paramount parameter in avalanche forecasting. When avalanches are released spontaneously, the risk of avalanches is very high. Therefore a new tool for avalanche monitoring, a distributed fibre optic system, is for the first time installed and adapted for the purpose of monitoring snow ava-lanche activity.
Austria
University of Natural Resources and Life Sciences, Austria,[email protected]
Research project
http://arc.lib.montana.edu/snow-science/objects/ISSW13_paper_P2-23.pdf
http://www.nat-hazards-earth-syst-sci.net/15/905/2015/nhess-15-905-2015.pdf, http://www.slf.ch/ueber/mitarbeiter/homepages/schweizj/publica-tions/vanHerwijnen_Schweiz-er_Avalanche_activity_seis-mic_monitoring_CRST_2011.pdf, http://www.govtech.com/dc/articles/Snow-Sensors-to-Predict-Avalanche-Conditions-at-Alaskas-Turnagain-Pass.html

InnovatIve BIg Data approaches for capturIng anD analyzIng Data to MonItor anD achIeve the sDgs
68
SDG indica-
tor
SDG target Name Description
Data mash-up with oth-
er sourcesCountries
Organisations and contact
details
Type of project URL
Examples for similar approaches
(or further description of the approach)
1.5, 11.5, 13.1
Design, develop-ment, and deployment of a wireless sensor network for detection of landslides
With a focus on landslide detection, this work reaffirms the capability of wireless sensor networks for disaster mitigation. A complete functional system consisting of 50 geological sensors and 20 wireless sensor nodes was deployed in Idukki, a district in the south-western region of Kerala State, India, a highly landslide prone area.
India
Amrita University, India,[email protected]
Research project
http://www.sciencedirect.com/science/article/pii/S157087051200159X
http://www.nat-hazards-earth-syst-sci.net/15/905/2015/nhess-15-905-2015.pdf, https://www.amrita.edu/sites/default/files/ICW6339-ICWN09.pdf, https://www.ee.iitb.ac.in/~prakshep/SenSlide_ACM_SIGOPS_OSR.pdf
1.5, 11.5, 13.1
Design of Early Warning Flood Detec-tion Systems for Develop-ing Countries
The problem of flooding on the Aguan River in north-eastern Honduras is addressed with sensor networks to balance the minimal cost requirement and limited computational power with the need for high reliability.
Honduras
Massachusetts Institute of Tech-nology, USA,[email protected], [email protected]
Research project
https://courses.cs.washington.edu/courses/cse590f/08wi/docs/Basha.pdf
http://pista.paris21.org/inno-vation/331/show
1.5, 11.5, 13.1
Deep Ocean Tsunami Detection Buoys
Deep-ocean tsunami detection buoys are one of two types of instruments used by the Bureau of Meteorology to confirm the existence of tsunami waves generated by undersea earthquakes. These buoys observe and record changes in sea level out in the deep ocean. This enhances the capability for early detection and real-time reporting of tsunamis before they reach land.
Australia
Bureau of Meteo-rology, Australia,http://www.bom.gov.au/other/feedback/
Govern-ment project
http://www.ndbc.noaa.gov/, http://www.irishlights.ie/envi-ronment/smart-buoy-sensors.aspx
2.3, 2.4
A Crop Monitoring System Based on Wireless Sensor Network
A crop monitoring system based on a wireless sensor network is presented. The environmental parameter acqui-sition platform collects meteorological and soil information such as temperature, humidity, wind, air, rainfall, soil ph and so on. The image capture platform obtains crop growth images. The growth of crops and growing conditions can be observed directly. A large number of nodes form the agricultural condition monitoring sensor network, and then access to the internet. The experimental results show that this monitoring system works correctly and reliably.
China
Tsinghua Univer-sity, China,[email protected] , [email protected]
Research project
http://www.sciencedirect.com/science/article/pii/S187802961100911X
http://www.mdpi.com/1424-8220/11/6/6088, https://www.prospera.ag/
2.3, 2.4 Water-Bee
The aim of the project is to develop an irrigation manage-ment and scheduling system, which is intelligent, flexible, easy-to-use and accurate. The costs of the system are affordable and it takes advantage of recent technological advances in wireless networking, environmental sensors and improvements in crop modelling.
Malta, Spain
Innovació i Re-cerca Industrial i Sostenible, Spain,
[email protected], [email protected], [email protected]
Research project
http://waterbee.iris.cat/

InnovatIve BIg Data approaches for capturIng anD analyzIng Data to MonItor anD achIeve the sDgs
69
SDG indica-
tor
SDG target Name Description
Data mash-up with oth-
er sourcesCountries
Organisations and contact
details
Type of project URL
Examples for similar approaches
(or further description of the approach)
2.3, 2.4
Low-Cost Salinity Sen-sor Increases Profitability and Envi-ronmental Sustainabil-ity for Small Plot Shrimp Farmers
This project produced a marketable salinity sensor for small plot shrimp farmers with the same accuracy as cur-rent systems while reducing the total manufacturing and production cost by over tenfold. The handheld sensor uses a resistive bridge to measure salinity.
Developing countries in general
United States Naval Academy Annapolis, USA, [email protected]
Research project
http://ieeexplore.ieee.org/document/6103608/
http://www.odysseysensors.com/aquaculture.html
2.4, 2.5
On the Design of a Bioacoustic Sensor for the Early Detection of the Red Palm Weevil
The Red Palm Weevil (RPW, Rynchophorus Ferrugineus) has become one of the most dangerous threats to palm trees in many parts of the world. Its early detection is difficult, since palm trees do not show visual evidence of infection until it is too late for them to recover. One of the early detection mechanisms proposed is based on acoustic monitoring, as the activity of RPW larvae inside the palm trunk is audible. In this work we propose the design of an autonomous bioacoustic sensor that can be installed in every palm tree under study.
Spain
Miguel Hernan-dez University, Spain, Technical University of Valencia, Spain,[email protected]
Research project
www.mdpi.com/1424-8220/13/2/1706/pdf
http://spensatech.com/spen-sa.html
3.8, 3.b ColdTrace
ColdTrace is a wireless remote temperature monitoring solution designed for vaccine refrigerators in rural clinics and health facilities. The device uploads temperature and grid power availability data to a server, and the systems sends SMS to key personnel whenever vaccines are in danger.
Rural areas in general
Nexleaf, USA,[email protected]
Com-mercial product
http://nexleaf.org/vaccines/
3.9Air quality monitoring
Aeroqual helps people, companies and governments make better air quality decisions by providing them with cost effective and reliable instrumentation and informa-tion. The sensor-based instruments and environmental monitoring systems are used widely in outdoor ambient applications for compliance, non-compliance and special purpose monitoring.
Anywhere
Aeroqual, New Zealand,http://www.aero-qual.com/forms/contact.php
Com-mercial product
http://www.aeroqual.com/
https://arxiv.org/abs/1005.1737, https://tatacenter.mit.edu/portfolio/air-pollution-sensors/

InnovatIve BIg Data approaches for capturIng anD analyzIng Data to MonItor anD achIeve the sDgs
70
SDG indica-
tor
SDG target Name Description
Data mash-up with oth-
er sourcesCountries
Organisations and contact
details
Type of project URL
Examples for similar approaches
(or further description of the approach)
6.1 CellPump
SweetSense worked with Living Water International and installed 200 sensors in rural water pumps in Rwanda as a longitudinal cohort study. In three experimental arms the current model of operation and maintenance was compared against a ‘best practice’ circuit rider model that includes a ‘call us’ feature for communities to report pump outages and against an ‘ambulance service’ model where the sensors notified an online technician dispatch platform. The platform also collected smartphone based maintenance records to map technician and service performance.
Rwanda
SweetSense, USA, Living Water Inter-national, USA,[email protected]
Com-mercial product
http://www.sweetsensors.com/applications/water/
http://momo.welldone.org/applications/
6.2 SweetSense
SweetSense has partnered with Sanergy to design and deploy cellular enabled data collection system for the Sanergy Fresh Life Toilet franchise network’ in Mukuru, Nairobi, with the aim of improving the efficiency of their Waste Collection Teams and ensuring greater access to sanitation facilities for users. The GSM technology is integrated directly into the Sanergy solid waste recepta-cles and the data used in the sanitation value chain. The SweetSense platform monitors the following parameters: Each use of the latrine, the approximate fill level of the waste receptacle, the GPS location of the latrine. Via GSM, the system notifies an online dashboard when a waste re-ceptacle requires servicing. The online dashboard allows manual and automatic notification of the appropriate technician.
Kenya
SweetSense, USA, Sanergy Inc, Kenya,[email protected]
Com-mercial product
http://www.sweetsensors.com/applications/sanitation/
http://www.ircwash.org/sites/default/files/final_sanitation_outcome_verification_re-port_-_24_april.pdf
15.1, 15.2, 15.b
A solution that can halt illegal logging in rainforests
Rainforest Connection transforms recycled cell-phones into autonomous, solar-powered listening devices that can monitor and pinpoint chainsaw activity at great distance. This changes the game by providing the world's first real-time logging detection system, pinpointing deforestation activity as it occurs, and providing the data openly, freely, and immediately to anyone around the world.
IndonesiaRainforest Con-nection, USA,[email protected]
NGO project
https://rfcx.org/
Table 13 Big data approaches: Sensors in nature, agriculture and water

InnovatIve BIg Data approaches for capturIng anD analyzIng Data to MonItor anD achIeve the sDgs
71
wearable technology
▶▶ Introduction
Wearable technology refers to sensors that are worn as accessories by humans or animals or implanted to their body. Whenever
there is network, they are usually part of the IoT. The main motivation for humans to wear such sensors is fitness tacking
and healthcare. As described before, preventive as well as remote monitoring have become a major trend (see Healthcare),
for which wearable technology is a critical tool. People who were inspired by the new opportunities to efficiently track data
about their lives founded a movement called “Quantified Self”75. Moreover, wearable technology can control the treatment
of existing diseases. Wearable technology for animals serves mostly for identification and traceability, but also for health
monitoring. The citizen cards, which were introduced above, are not part of this category since they do not carry a sensor, but
are read by external sensors.
75 See here for further details: http://antephase.com/quantifiedself

InnovatIve BIg Data approaches for capturIng anD analyzIng Data to MonItor anD achIeve the sDgs
72
▶▶ Approaches
SDG indica-
tor
SDG target Name Description
Data mash-up with oth-
er sourcesCountries
Organisations and contact
details
Type of project URL
Examples for similar approaches
(or further description of the approach)
2.3, 2.4 VitalHerd
Cows swallow VitalHerd’s “e-pill”, which remains in their stomach until the rest of their life and monitors their core temperature, heart rate, respiration rate, stomach con-centration rate as well as low cost, long-term pH, volatile fatty acid and lactic acid. These real-time data, which are relevant to detect illnesses, heat stress, estrus timing, calving readiness and rumen health, are transmitted to cloud-based software.
Anywhere
VitalHerd, USA,
Com-mercial product
http://www.vitalherd.com/http://www.tekvet.com/index.php?option=com_con-tent&view=article&id=6
3.2 MonBaby
MonBaby Smart Button has a universal form factor and attachment mechanism. Measurements are done in real-time, five times per second, and transmitted to a smartphone app. The MonBaby app receives information about the baby, such as breathing movements, body position (on the back or on the stomach), fall detection, proximity to the phone, battery and connection status, and displays it in an easy-to-understand manner.
Anywhere
MonDevices, USA,
Com-mercial product
https://monbaby.com http://www.bempu.com/
3.4MiniMed 670G Insulin Pump System
The MiniMed 670G Insulin Pump System for people living with diabetes offers two new levels of personaliza-tion: The "Suspend before low" option avoids lows and rebound highs proactively by automatically stopping insulin 30 minutes before pre-selected low limits are reached, then automatically restarts insulin when the levels recover, all without bothersome alerts. The "Auto Mode" option automatically adjusts the basal insulin delivery every five minutes based on the sugar levels to keep the target range, all day and night.
Anywhere
Medtronic, USA,
https://www.medtronicdia-betes.com/con-tact-us
Com-mercial product
https://www.medtronicdi-abetes.com/products/min-imed-670g-insulin-pump-sys-tem
3.4
ADAMM (Intelligent Asthma Man-agement)
The Wearable: A patch-type, flexible wearable with a rechargeable battery that can be worn anywhere on the upper torso, front or back. Symptom Detection: Sensors in the wearable detect asthma symptoms such as tracking cough rate, respiration patterns, heartbeat, temperature and other symptoms of interest. Notifica-tions: Whenever the asthma symptoms deviate from the individual norm, the wearable vibrates, notifying of the deviation. If another person is designated, s/he will also get text notifications.
Anywhere
Health Care Originals, USA,
Com-mercial product
http://healthcareoriginals.com/

InnovatIve BIg Data approaches for capturIng anD analyzIng Data to MonItor anD achIeve the sDgs
73
SDG indica-
tor
SDG target Name Description
Data mash-up with oth-
er sourcesCountries
Organisations and contact
details
Type of project URL
Examples for similar approaches
(or further description of the approach)
3.5BACtrack Skyn
BACtrack Skyn is worn either integrated into an Apple Watch band or as a standalone wearable and continu-ously tracks the alcohol level in near real-time. With an app that syncs with either device, powerful, actionable data are provided. For instance, a notification when the alcohol level is increasing as a reminder to slow down or stop drinking.
Anywhere
BACtrack, USA,
Com-mercial product
https://www.bactrack.com/pages/bactrack-skyn-wear-able-alcohol-monitor
8.8 Kinetic
Lifting related injuries are the number one drivers of workers compensation costs in the USA. KINETIC makes smart wearable devices that can significantly reduce these costs. Sensors in the belt-mounted device, coupled with algorithms, tell workers when they are lifting well and provide immediate feedback when they are not.
Anywhere
Kinetic, USA,
Com-mercial product
http://wearkinetic.com/
10.2 Horus
Horus can be used by both blind and visually impaired people. It is a wearable device that observes, understands and describes the environment to the person using it, providing useful information with the right timing and in a discreet way using bone conduction. Horus is able to read texts and to recognize faces and objects.
Anywhere
Horus, Switzer-land and Italy,
Com-mercial product
https://horus.tech/?l=en_us
10.2
Mind-Con-trolled Bionic Prosthetic Lower Limbs for Amputees
Össur’s bionic prostheses are smart limbs capable of real-time learning and automatically adjusting to their user’s walking style (gait), speed and terrain. Amputees are able to control their bionic prosthetic legs with their thoughts, thanks to tiny implanted myoelectric sensors that have been surgically placed in their residual muscle tissue.
Anywhere
Össur, Iceland,
https://www.ossur.com/corpo-rate/about-ossur/contact-us
Com-mercial product
https://www.ossur.com/about-ossur/news-from-os-sur/1396-ossur-introduc-es-first-mind-controlled-bi-onic-prosthetic-low-er-limbs-for-amputees
14.a SHARC
The goal of the SHARC project is to develop a new low-cost generation tag dedicated to track migrating marine animals. Improvements for several key features include: smaller weight and size, increased lifetime, enlarged data storage and bidirectional communication with satellite leading to increased volume of the satellite data transfer.
Satellite and UAV imagery
Anywhere
AnSem, Belgium, European Space Agency,
Research project
https://artes.esa.int/projects/sharc
15.7, 15.c
Save the Elephants - GPS tracking
Save the Elephants uses GPS-tracking equipment, i.e. radio collars, to understand elephant lives, decisions and needs. The real-time monitoring system is being applied to identify poaching events too.
Kenya
Save the Ele-phants, Kenya,
NGO project
http://www.savetheelephants.org/project/tracking-re-al-time-monitoring/
https://www.mpg.de/9356217/gps-animal-track-ing-species-protection
Table 14 Big data approaches: Wearable technology

InnovatIve BIg Data approaches for capturIng anD analyzIng Data to MonItor anD achIeve the sDgs
74
biometric data
▶▶ Introduction
SDG target 16.9 is aiming for a legal identity for all, including birth registration. Currently, “more than 100 countries do not
accurately count births and deaths” and “the births of nearly one fourth of children under the age of 5 worldwide have never
been recorded.” (United Nations World Data Forum, 2017). Biometric data serve to identify a person and can be read by specific
sensors. A distinction has to be made on whether the sensor reads the biometric information directly from a person, e.g.
fingerprints or eye retina, or from an ID card where biometric information is stored (see Administrative data / citizen cards). A
future scenario can be envisaged where citizen cards become obsolete and people are tracked only through the sensing of
biometric data. The data previously stored on citizen cards would be then moved to a cloud where they are linked to specific
individuals by the biometric data.
A very ambitious project is “Aadhaar” in India, which started in 2016 and assigns a 12-digit unique identity number to all
Indian residents linked to demographic as well as the following biometric data: ten fingerprints, two iris scans and facial
photograph76.
The examples below show that sensing data for identification of people also support the achievement of other SDG targets.
76 See: https://uidai.gov.in/your-aadhaar/about-aadhaar.html

InnovatIve BIg Data approaches for capturIng anD analyzIng Data to MonItor anD achIeve the sDgs
75
▶▶ Approaches
SDG indica-
tor
SDG target Name Description
Data mash-up with oth-
er sourcesCountries
Organisations and contact
details
Type of project URL
Examples for similar approaches
(or further description of the approach)
2.3, 2.4Iris Biometrics for Animal Identification
Cattle identification and trace-ability are important to control disease and maintain consumer confidence in farm products. An iris biometric-based recognition method is non-invasive. Instead of tagging a metal or plastic on the animals, their iris biometric data will be captured and stored on a database/ PC/ cloud service together with other information records such as: date of birth, breed and sex, details of where it has moved from and to, calving histories, medical treatments.
Health records
Canada, USA
Iritech, Inc., USA,[email protected]
Com-mercial product
http://www.iritech.com/blog/iris-biometrics-animal-identifi-cation/
4.1, 4.5, 4.6
Biometric ID card for public school students
The government of Osun State in Nigeria has issued a smart identity card integrated with biometrics to all public school students in the state. The Osun Smart ID, an initia-tive of Chams Plc, is linked to a central database providing the state government with accurate data on the identity and number of students enrolled in its public schools.
Adminis-trative data / citizen cards
Nigeria
Osun State, Nigeria, Chams Plc, Nigeria,http://osun.gov.ng/directory/education/
Govern-ment project
http://www.biometricupdate.com/201408/osun-state-nigeria-government-to-issue-biometric-id-card-for-public-school-students
http://www.thehindu.com/news/national/other-states/maharash-tra-to-link-school-admis-sion-with-aadhaar/arti-cle7134236.ece
5.a, 8.10
Biometric Cash Assis-tance
Thanks to a partnership between UNHCR and Cairo Amman Bank, Jordan is the first country in the world to use iris scan technology to enable refugees to access their funds without the need for a bankcard or PIN code. Currently, around 23,000 Syrian families living in urban areas in Jordan benefit from monthly cash assistance.
Jordan
UNHCR, Cairo Amman Bank, Jordan,[email protected]
UN projecthttp://www.unhcr.org/inno-vation/labs_post/cash-assis-tance/
https://www.cgdev.org/files/1425165_file_Gelb_Deck-er_biometric_FINAL.pdf
11.7, 16.1, 16.4, 16.a
Biometrics and AI for crime pre-vention
The Dubai Police command room is getting new AI and biometric facial recognition software to help predict fu-ture crimes in areas of the city known to police. Thanks to biometric software, unique facial characteristics of known or wanted criminals can be automatically recognised via an international database through closed-circuit televi-sion cameras installed in public places
UAEDubai Police, UAE, [email protected]
Govern-ment project
http://gulfnews.com/news/uae/emergencies/dubai-police-to-use-biometrics-to-prevent-crime-1.1981638
5.3, 16.9
Identification for Develop-ment (ID4D)
ID4D helps countries analyse problems, design solutions, and implement new systems to increase the number of people with official identification and the development impact of the overall identification system. With the trans-formational potential of modern solutions—the advances in identification technology (both digital and biometric) and the dramatically falling costs of technology and imple-mentation—there is an opportunity to leapfrog traditional paper-based approaches and build strong and efficient identification systems at a scale not previously achievable.
Adminis-trative data / citizen cards
AnywhereWorld Bank,[email protected]
Govern-ment project
http://www.worldbank.org/en/programs/id4d#2
http://www.worldbank.org/en/topic/ict/brief/the-identity-target-in-the-post-2015-devel-opment-agenda-connections-note-19,https://uidai.gov.in/
Table 15 Big data approaches: Biometric data

InnovatIve BIg Data approaches for capturIng anD analyzIng Data to MonItor anD achIeve the sDgs
76
benefits, risks and recommendations
The benefits of massive additional sensing data, due to innovative sensors and the spreading of the IoT, can hardly be denied
since more data means more knowledge about the world, which is what humankind has always been striving for.
While satellite imagery constitutes the category with the most approaches presented here, it holds the challenges that it is
more expensive than other sensors and requires high computational/AI power. Often satellite images only provide proxy
indicators (e.g. nightlights or roofs) and the correlation with the actual indicator has to be validated and apophenia must be
avoided.
Sensors on earth often measure the actual indicator and are usually cheaper. Given that the IoT is only at early stages, it can be
expected that, in the near future, sensors measure many more details of the world and our daily lives. This could even lead to
the conclusion that exhaust data as well as proxy indicators are a tentative phenomenon, which may be progressively replaced
by precise sensors.
This holds the following challenges: The analysis phase of the data must not become a bottleneck, which can only be prevented
through powerful AI methodologies. Moreover, the monitoring of individuals, e.g. through biometric sensors, raises privacy
concerns, which must be addressed by strict guidelines.
Overall, it is recommended to initiate or extend approaches using sensing data for both, the calculation of SDG indicators as
well as the achievement of SDG targets. Sensors are very versatile, which is illustrated by the fact that examples for all, but
SDG 17 are presented. Among other applications they provide supportive data for development and disaster preparedness
(especially satellites), health (especially wearable technology), infrastructure (especially sensors in cities, transport and homes)
and life on land and water (especially sensors in nature, agriculture and water). While the ENEA countries have passed various
development targets, numerous other sensing data are relevant for them to tackle challenges of disaster resilience, health
(particularly of ageing populations), urbanization and the environment.

InnovatIve BIg Data approaches for capturIng anD analyzIng Data to MonItor anD achIeve the sDgs
77
DIGITAL ConTEnT
social media data
▶▶ Introduction
The rise of social media was perhaps the biggest development in the internet in the noughties. At a large-scale, internet
users started to produce digital content themselves, supported by new web services such as Facebook, Twitter, YouTube
and Flickr. Due to its significance, this phase has been dubbed as “Web 2.0” and is characterized by user-generated content
complementing content produced by media and corporations. Since also the proliferation of internet usage kept growing an
increasing part of the world’s population can make contributions in different formats, which includes commenting of media
articles.
This is the third source of big data, for which the UN Global Working Group on Big Data has established a dedicated task
team, called “Social Media Data”77. Social media data constitute on the one hand very interesting big data as this content
is intentionally produced, on the hand it is much more challenging to analyse since these data are more complex and
unstructured than e.g. mobile phone data or satellite images. In addition to written text, social media data also comprise
images, videos and sound, which require different techniques to interpret them.
The potential value of monitoring social media for various purposes has been acknowledged, and the process of filtering
and assessing what is being said about a particular topic has been coined “social listening”. Social listening could for example
reveal timely warnings about deteriorating situations such as food shortages, disease outbreaks, price increases or needs after
disasters.
While in most projects below patterns are explored in anonymous data, there is also one approach, which filters and analyses
digital footprints of individuals to determine creditworthiness, which is a pioneering option for people in developing countries
who often struggle to get loans (see below: Lenddo).
77 See: http://unstats.un.org/bigdata/taskteams/socialmedia/

InnovatIve BIg Data approaches for capturIng anD analyzIng Data to MonItor anD achIeve the sDgs
78
▶▶ Approaches
SDG indica-
tor
SDG target Name Description
Data mash-up with oth-
er sourcesCountries Organisations and
contact detailsType of project URL
Examples for similar approaches
(or further description of the approach)
2.c.1
Mining Indonesian Tweets to Understand Food Price Crises
The use of social media is widespread in Indonesia; the country has the fourth largest Facebook population in the world and the third largest number of Twitter users worldwide. A relationship was found between retrospec-tive official food inflation statistics and the number of tweets speaking about food price increases (r=0.42). Our research shows that automated monitoring of public sentiment on social media, combined with contextual knowledge, has the potential to be a valuable real-time proxy for food-related economic indicators.
IndonesiaUN Global Pulse Lab Jakarta, Indonesia,[email protected]
UN project
http://www.unglobalpulse.org/sites/default/files/Global-Pulse-Mining-Indonesian-Tweets-Food-Price-Crises%20copy.pdf
5.2.1, 16.1.3
5.2, 16.1
An Anal-ysis over Social Media Regarding Domestic Violence against Wom-en in Turkey
An analysis was performed by the content analysis method based on the fact that women use social media channel for their confessions especially regarding being subject of domestic violence. It was observed that the women were mostly below 30 and that the violence is arising mostly from the men in their lives as well as other members of the family such as their mother.
Turkey
Ondokuz Mayis University, Turkey,[email protected]
Research project
http://ijbssnet.com/journals/Vol_6_No_8_Au-gust_2015/10.pdf
http://www.bigmountainda-ta.com/project/data-visual-ization/
1.5, 11.5, 13.1
Early Flood Detection for Rapid Humanitarian Response: Harness-ing Near Real-Time Satellite and Twitter Signals
It is shown how two near-real-time data sources, satellite observations of water coverage and flood-related social media activity from Twitter, can be used to support rapid disaster response, using case-studies in the Philippines and Pakistan. Whereas satellite information has a typical delay of 24 hours or more, social media messages can already be accessed within minutes of publication.
Satellite and UAV imagery
Pakistan, Philippines
VU University Amsterdam, Neth-erlands, Floodtags, Netherlands, Utrecht University, Netherlands, Red Cross/Red Crescent Climate Centre, Netherlands, Inter-national Research Institute for Climate and Society, USA,[email protected]
Research project
http://www.mdpi.com/2220-9964/4/4/2246
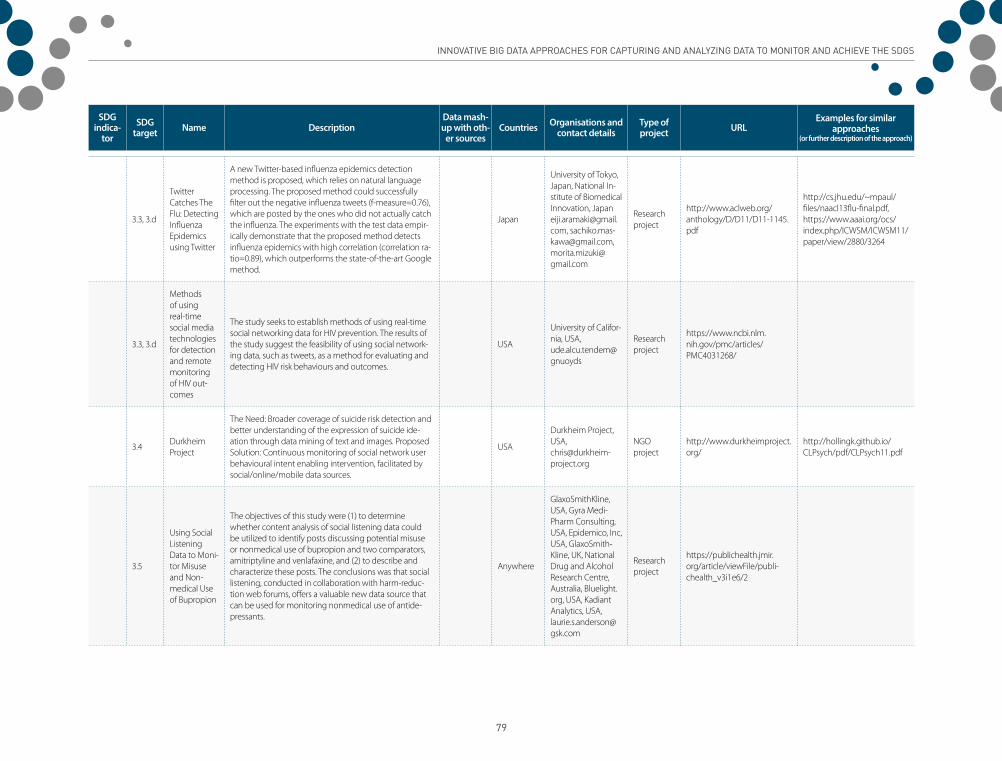
InnovatIve BIg Data approaches for capturIng anD analyzIng Data to MonItor anD achIeve the sDgs
79
SDG indica-
tor
SDG target Name Description
Data mash-up with oth-
er sourcesCountries Organisations and
contact detailsType of project URL
Examples for similar approaches
(or further description of the approach)
3.3, 3.d
Twitter Catches The Flu: Detecting Influenza Epidemics using Twitter
A new Twitter-based influenza epidemics detection method is proposed, which relies on natural language processing. The proposed method could successfully filter out the negative influenza tweets (f-measure=0.76), which are posted by the ones who did not actually catch the influenza. The experiments with the test data empir-ically demonstrate that the proposed method detects influenza epidemics with high correlation (correlation ra-tio=0.89), which outperforms the state-of-the-art Google method.
Japan
University of Tokyo, Japan, National In-stitute of Biomedical Innovation, [email protected], [email protected], [email protected]
Research project
http://www.aclweb.org/anthology/D/D11/D11-1145.pdf
http://cs.jhu.edu/~mpaul/files/naacl13flu-final.pdf, https://www.aaai.org/ocs/index.php/ICWSM/ICWSM11/paper/view/2880/3264
3.3, 3.d
Methods of using real-time social media technologies for detection and remote monitoring of HIV out-comes
The study seeks to establish methods of using real-time social networking data for HIV prevention. The results of the study suggest the feasibility of using social network-ing data, such as tweets, as a method for evaluating and detecting HIV risk behaviours and outcomes.
USA
University of Califor-nia, USA,ude.alcu.tendem@gnuoyds
Research project
https://www.ncbi.nlm.nih.gov/pmc/articles/PMC4031268/
3.4Durkheim Project
The Need: Broader coverage of suicide risk detection and better understanding of the expression of suicide ide-ation through data mining of text and images. Proposed Solution: Continuous monitoring of social network user behavioural intent enabling intervention, facilitated by social/online/mobile data sources.
USA
Durkheim Project, USA,[email protected]
NGO project
http://www.durkheimproject.org/
http://hollingk.github.io/CLPsych/pdf/CLPsych11.pdf
3.5
Using Social Listening Data to Moni-tor Misuse and Non-medical Use of Bupropion
The objectives of this study were (1) to determine whether content analysis of social listening data could be utilized to identify posts discussing potential misuse or nonmedical use of bupropion and two comparators, amitriptyline and venlafaxine, and (2) to describe and characterize these posts. The conclusions was that social listening, conducted in collaboration with harm-reduc-tion web forums, offers a valuable new data source that can be used for monitoring nonmedical use of antide-pressants.
Anywhere
GlaxoSmithKline, USA, Gyra Medi-Pharm Consulting, USA, Epidemico, Inc, USA, GlaxoSmith-Kline, UK, National Drug and Alcohol Research Centre, Australia, Bluelight.org, USA, Kadiant Analytics, USA,[email protected]
Research project
https://publichealth.jmir.org/article/viewFile/publi-chealth_v3i1e6/2

InnovatIve BIg Data approaches for capturIng anD analyzIng Data to MonItor anD achIeve the sDgs
80
SDG indica-
tor
SDG target Name Description
Data mash-up with oth-
er sourcesCountries Organisations and
contact detailsType of project URL
Examples for similar approaches
(or further description of the approach)
3.8, 3.b
Assessing Vaccination Sentiments with Online Social Media
Sentiments about vaccination can strongly affect individ-ual vaccination decisions. Measuring such sentiments - and how they are distributed in a population - is typically a difficult and resource-intensive endeavour. Publicly available data from Twitter are used to measure the evo-lution and distribution of sentiments towards the novel influenza A(H1N1) vaccine during the second half of 2009, i.e. the fall wave of the H1N1 (swine flu) pandemic.
USAPenn State Universi-ty, USA,[email protected]
Research project
http://journals.plos.org/plos-compbiol/article?id=10.1371/journal.pcbi.1002199
http://pediatrics.aappubli-cations.org/content/131/5/e1397
5.1
Identifying Trends in Discrimina-tion Against Women in the Workplace in Social Med
A feasibility study was conducted to explore online data as a source of real-time signals of discrimination against women in the workplace. Keywords were used to filter public tweets related to discrimination, identifying four topics with significant volume of discussions (over 100,000 tweets over three years).
Indonesia
UN Global Pulse Lab Jakarta, Indonesia, International La-bour Organization, Government of Indonesia,[email protected]
UN projecthttp://www.unglobalpulse.org/projects/indonesia-wom-en-employment
8.5
Unem-ployment Through the Lens of Social Media
This project investigates how social media and online user-generated content can be used to enrich the understanding of the changing job conditions in the USA and Ireland by analysing the moods and topics present in unemployment-related conversations from the open social web and relating them to official unemployment statistics.
Web scrap-ing
Ireland, USA
UN Global Pulse, SAS, USA,http://www.unglobalpulse.org/contact
UN project
http://www.unglobalpulse.org/projects/can-social-me-dia-mining-add-depth-un-employment-statistics
http://online.liebertpub.com/doi/abs/10.1089/big.2015.0017?src=recsys
8.10, 9.3
Lenddo
Lenddo uses non-traditional data to provide credit scoring and verification to economically empower the emerging middle class around the world. Lenddo has de-veloped its patented technology based on four years of actual online lending experience that included collection, analysis and processing of billions of data points. Lenddo now offers a simple and secure way to prove identity and establish a character online to unlock loans, online shopping and improve chances of employment.
Online search and access logs
20 coun-tries
Lenddo, Singapore, [email protected]
Com-mercial product
https://www.lenddo.com/ http://demyst.com/
10.7
Inferring International and Internal Migration Patterns from Twitter Data
Data about migration flows are largely inconsistent across countries, typically outdated and often inexistent. Trends in mobility and migration flows are analysed using geolocated Twitter data. A picture of very recent trends in OECD countries is provided.
OECD countries
City University of New York, USA, Qatar Computing Research, Stanford University Institute, Qatar,[email protected]
Research project
https://ingmarwe-ber.de/wp-content/uploads/2014/02/Inferring-Internation-al-and-Internal-Migration-Pat-terns-from-Twitter-Data.pdf

InnovatIve BIg Data approaches for capturIng anD analyzIng Data to MonItor anD achIeve the sDgs
81
SDG indica-
tor
SDG target Name Description
Data mash-up with oth-
er sourcesCountries Organisations and
contact detailsType of project URL
Examples for similar approaches
(or further description of the approach)
11.5
Tweeting Su-pertyphoon Haiyan: Evolv-ing Functions of Twitter during and after a Disas-ter Event
Twitter content related to Typhoon Haiyan is examined. The study reveals how Twitter conversations about disasters evolve over time, showing an issue attention cycle on a social media platform. Content analysis shows that the majority of tweets contain information about the typhoon or its damage, and disaster relief activities.
Philippines
University of the Philippines, Philip-pines,[email protected]
Research project
http://journals.plos.org/plosone/article?id=10.1371/journal.pone.0150190
http://www.sciencedirect.com/science/article/pii/S0747563215003076, https://www.cs.jhu.edu/~mdredze/publications/aaai_w3phi_sandy.pdf, https://www.ncbi.nlm.nih.gov/pmc/articles/PMC4803483/, http://www.jsnds.org/jnds/34_1_1.pdf
11.7, 16.1, 16.4, 16.a
Crime Sens-ing With Big Data
This paper critically examines the affordances and limitations of big data for the study of crime and disorder. It is demonstrated that an association exists between aggregated open-source communications data (e.g. from Twitter) and aggregated police-recorded crime data in London boroughs.
UK
Cardiff University, UK, [email protected]
Research project
https://academic.oup.com/bjc/article/doi/10.1093/bjc/azw031/2623946/Crime-Sensing-with-Big-Data-The-Affordances-and
16.1, 16.4, 16.5, 16.a
Measuring and moni-toring SDG 16 through social media analysis
Tunisia’s revolutionary wave between December 2010 and January 2011 is considered by many as a digital revolution due to the important role that technology and social media played in speeding it up. The aim of the project is to measure and analyse sentiment towards the different topics covered by SDG 16 (corruption, human rights, public administration, crime) as a means to mon-itor these different targets and see to which extent this could provide a value added.
Tunisia
National Statistics Institute, Tunisia,[email protected]
Govern-ment project
http://southsouthworld.org/mechanism/view?id=268
Table 16 Big data approaches: Social media data

InnovatIve BIg Data approaches for capturIng anD analyzIng Data to MonItor anD achIeve the sDgs
82
web scraping
▶▶ Introduction
Web scraping is another source of digital content and is about techniques to extract content from websites. While the details of
the techniques are not relevant here, it has to be noted that web scraping refers only to the process of capturing the data from
the web. To become meaningful, it requires a subsequent step for the analysis of the data. AI methods are being developed to
support or take over the interpretation part. Yet, these AI methods differ from what is required to analyse numeric exhaust or
sensing data since websites contain various data formats, such as text, tables, images, videos, sounds and also links. For this
purpose, for example natural language processing and object recognition technologies are used.
Web scraping is applied to all kinds of websites, such as news media, corporate content, including advertisements, and social
media, which are treated separately here (see Social media data). As the examples below show usually particular web-scraping
projects are restricted to specific websites; for example, the labour market in a country could be analysed by scraping the job
vacancy websites.

InnovatIve BIg Data approaches for capturIng anD analyzIng Data to MonItor anD achIeve the sDgs
83
▶▶ Approaches
SDG indica-
tor
SDG target Name Description
Data mash-up with oth-
er sourcesCountries
Organisations and contact
details
Type of project URL
Examples for similar approaches
(or further description of the approach)
2.c.1
Online and official price indexes: Measuring Argentina's inflation
The data were collected between October 2007 and March 2011 from the largest supermarket in each coun-try. In Brazil, Chile, Colombia and Venezuela online price indexes approximate both the level and main dynamics of official inflation. By contrast, Argentina's online inflation rate is nearly three times higher than the official estimate.
Argentina, Brazil, Chile, Colombia, Venezuela
Massachusetts Institute of Tech-nology, USA,[email protected]
Research project
https://papers.ssrn.com/sol3/papers.cfm?abstract_id=1906704
http://www.pricestats.com/, http://www.unglobalpulse.org/projects/comparing-glob-al-prices-local-products-real-time-e-pricing-bread, https://unstats.un.org/bigdata/inven-tory/?selectTitle=&selectCoun-try=&selectOrganization=&se-lectSource=Web+scraping+-data&selectstatArea=&selects-dgGoal=
2.1
Monitoring Food Secu-rity Issues Through News Media
This project explored whether is possible to track and comprehend thematic shifts in media attention through the automatic analysis of news articles. To do so, we analysed how the Francophone media reported on food security issues over the past eight years.
Anywhere
UN Global Pulse, Complex Systems Institute of Paris Île-de-France (ISC-PIF) - CAMS, CNRS, CorText, CREA, Ecole Polytechnique, ESIEE, Formism, INRA-SenS - and The Institute For Research, Innova-tion and Society, France,[email protected]
UN project
http://www.unglobalpulse.org/projects/news-aware-ness-and-emergent-infor-mation-monitoring-sys-tem-food-security
http://pulseweb.veilledy-namique.com
3.3 HealthMap
The web site and the mobile app 'Outbreaks Near Me' de-liver real-time intelligence on a broad range of emerging infectious diseases. HealthMap brings together disparate data sources, including online news aggregators, eyewit-ness reports, expert-curated discussions and validated official reports, to achieve a unified and comprehensive view of the current global state of infectious diseases. Through an automated process the system monitors, organizes, integrates, filters, visualizes and disseminates information about emerging diseases in nine languages, facilitating early detection of global public health threats.
Participato-ry Sensing / crowd-sourcing
Anywhere
Boston Children's Hospital, USA,[email protected]
NGO project
http://www.healthmap.org/en/
https://www.ncbi.nlm.nih.gov/pmc/articles/PMC3247107/

InnovatIve BIg Data approaches for capturIng anD analyzIng Data to MonItor anD achIeve the sDgs
84
SDG indica-
tor
SDG target Name Description
Data mash-up with oth-
er sourcesCountries
Organisations and contact
details
Type of project URL
Examples for similar approaches
(or further description of the approach)
5.2, 8.7, 16.2
Webscrap-ing as an Investigation Tool to Identi-fy Potential Human Trafficking Operations in Romania
This research paper investigates whether a web-scrap-ing tool could be employed to gather intelligence on organized crime groups at the recruitment stage of the trafficking operation as a means to understand their mo-dus operandi. Preliminary findings indicate that the UK is a popular destination country for job advertisements hosted in Romania and further analysis will be undertak-en to identify if there are in fact indicators of trafficking evident in these identified websites.
Romania, UK
Ulster University, UK,[email protected]
Research project
http://uir.ulster.ac.uk/34229/1/Poster%20with%20permission.pdf
https://arxiv.org/pdf/1703.03097.pdf
16.a Predata
Predata condenses data sources from around the web into clear and unified signals for geopolitical risk. Their algorithms measure volatility indicators for governments, economies and geographical points of interest. These in-puts are transformed into quantitative, actionable models for risk assessment. Using a proprietary event database and machine learning techniques, patterns in volatility around past events are identified.
Anywhere
Predata, USA,http://www.predata.com/products/#con-tact
Com-mercial product
http://www.predata.com/ http://gdeltproject.org
Table 17 Big data approaches: Web scraping

InnovatIve BIg Data approaches for capturIng anD analyzIng Data to MonItor anD achIeve the sDgs
85
participatory sensing / crowdsourcing
▶▶ Introduction
Participatory sensing is another kind of actively produced digital content by citizens. It is an organized effort to gather
knowledge for a specific purpose. The participating citizens provide sensing data from their own sensory organs or other
sensors they have access to, e.g. on their smart phones. What makes these data valuable is usually that they are linked to a
location or time when measured, while fixed sensors for that purpose are not available at this place. Recalling that, the IoT
aims to reduce the information gap between the world and the internet; then the function of participatory sensing is to
complement the sensors of the IoT whose coverage cannot be absolute for practical reasons (or could be damaged and limited
after a disaster).
The data are then uploaded to a platform, and a bigger picture of the situation emerges depending on the amount of data
gathered. This is also the reason why participatory sensing is not categorized under sensing data since the sensing process is
always complemented by the creation of (crowdsourced) content.
Participatory sensing differs from less organized social media postings. It is not easy to draw a line. While social media postings
could be also concentrated efforts, e.g. linked through common hashtags, another feature of participatory sensing is that
the outcome is presented in a specific way; maps are often a suitable format. Such mapping activities are also referred to as
“volunteered geographic information” (Goodchild, 2007). Examples are that citizens track damages and needs after a disaster or
environmental features such a spreading of animals and plants or pollution. The data can be then visualized in a map, e.g. the
OpenStreetMap78.
78 See: https://www.openstreetmap.org

InnovatIve BIg Data approaches for capturIng anD analyzIng Data to MonItor anD achIeve the sDgs
86
▶▶ Approaches
SDG indica-
tor
SDG target Name Description
Data mash-up with oth-
er sourcesCountries
Organisations and contact
details
Type of project URL
Examples for similar approaches
(or further description of the approach)
5.2.2, 11.7.2, 16.1.3, 16.2.3
5.2, 11.7, 16.1, 16.2
HarassMap
HarassMap crowdsources SMS and online reports of sexual harassment and assault and maps them on an online map. By using evidence from the reports and communications campaigns to create informational and educational material and offering workshops and other support, the HarassMap team aims to motivate a critical mass of bystanders to stand up to harassers and create an environment where sexual harassment is not tolerated.
EgyptHarassMap, Egypt,[email protected]
NGO project
http://harassmap.org/en/
https://timreview.ca/arti-cle/770, http://safecity.in/, http://sdgyouthactionmapper.org/, http://www.girlimpact-map.org/, http://ureport.ug/
5.3.2 5.3Crowd2Map Tanzania
Although illegal in Tanzania, FGM is still practiced by many tribes. To inform girls about their rights outreach is conducted in remote villages where they are most at risk. NGOs on the ground need better road and residential area data to facilitate their outreach work. Crowd2Map Tanzania is to help mapping these villages in order to allow better navigation and planning of services.
Tanzania
Tanzania Devel-opment Trust, Tanzania,http://www.tanzdevtrust.org/contact-us/
NGO project
https://blogs.iadb.org/abierto-al-publi-co/2016/11/08/6896/
https://crowd2map.wordpress.com/, http://tasks.hotosm.org/project/2501#
14.1.1 14.1Marine Debris Tracker
The Mobile App Marine Debris Tracker originated in 2010. With Marine Debris Tracker it just takes a few seconds to easily report where you find marine debris or litter anywhere in the world.
Anywhere
NOAA Marine Debris Program, USA, University of Georgia, USA,[email protected], [email protected]
Govern-ment project
http://www.marinedebris.engr.uga.edu/
15.5.1 BudBurst
Project BudBurst participants make careful observations of the timing of leafing, flowering and fruiting phases of plants throughout the year. There are two protocols, Single Reports and Regular Reports, for recording ob-servations. Scientists and educators can use the data to learn more about how plant species respond to changes in climate locally, regionally, and nationally.
USA
Chicago Botanic Garden, USA,[email protected]
Govern-ment project
http://budburst.org/home
16.5.1, 16.5.2 16.5 I paid a bribe
ipaidabribe.com is Janaagraha's unique initiative to tackle corruption by harnessing the collective energy of citizens. Citizens can report on the nature, number, pattern, types, location, frequency and values of actual corrupt acts on this website. The reports will, perhaps for the first time, provide a snapshot of bribes occurring across a particular city.
India
Janaagraha, India,www.ipaidabribe.com/ : Feedback button in the right bottom corner
NGO project
www.ipaidabribe.com/https://www.techinasia.com/lapor-indonesia-200000-users

InnovatIve BIg Data approaches for capturIng anD analyzIng Data to MonItor anD achIeve the sDgs
87
SDG indica-
tor
SDG target Name Description
Data mash-up with oth-
er sourcesCountries
Organisations and contact
details
Type of project URL
Examples for similar approaches
(or further description of the approach)
16.6.2 16.6
Citizen Feedback Monitoring Program
CFMP takes feedback from citizens who avail a govern-ment service such as police, health care or land registra-tion, using mobile phone technology. Whenever a citizen visits a government office, the transaction is recorded along with the phone number. The CFMP team acquires the data and makes robo calls followed by SMSs asking the citizens about the quality of the service and whether they were asked to pay any bribe.
Pakistan
Punjab Informa-tion Technology Board, Pakistan, [email protected]
Govern-ment project
https://www.pitb.gov.pk/CFMP_Reviving_Democracy_in_Pakistan
1.5, 11.5, 13.1
Increasing resilience to natural haz-ards through crowd-sourc-ing in St. Vin-cent and the Grenadines
Volcanic environments exposed to multiple hazards tend to be characterised by a lack of relevant data available both in real time and over the longer term (e.g. months to years). This can be at least partially addressed by active-ly involving citizens, communities, scientists and other key stakeholders in the collection, analysis and sharing of observations, samples and measurements of changes in the environment. Such community monitoring and co-production of knowledge over time can also build trusting relationships and resilience.
St. Vincent and the Grenadines
British Geological Survey, UK,[email protected]
Research project
http://nora.nerc.ac.uk/511949/1/OR15032.pdf
1.5, 11.5, 13.1
Digital Humanitarian Network
The purpose of the Digital Humanitarian Network is to leverage digital volunteers in support of 21st century humanitarian response. More specifically, the aim of this network-of-networks is to form a consortium of volunteer and technical communities and to provide an interface between formal, professional humanitarian organizations and informal yet skilled-and-agile volunteer and technical networks.
Anywhere
Digital Humani-tarian Network,http://digitalhu-manitarians.com/contact
NGO project
http://digitalhumanitarians.com/
https://www.ushahidi.com/, https://www.hotosm.org/, http://micromappers.com/, https://geotagx.org/, http://www.missingmaps.org/
3.4, 3.8 Figure 1
Figure 1’s mission is to democratize medical knowledge through crowdsourced photo sharing by health care pro-fessionals. Figure 1 is an app to enable doctors to share pictures of their patients. Users, i.e. other doctors, can view rare conditions, innovative treatments, and teaching cases from around the world and can also directly com-municate with their colleagues.
Anywhere
Figure 1, Canada,https://figure1.com/sections/contact/
Com-mercial product
https://figure1.com/
3.8, 4.5, 8.5, 10.2, 11.2
Wheelmap
Wheelmap is a map for finding wheelchair accessible places. The map works similar to Wikipedia: anyone can contribute and mark public places around the world according to their wheelchair accessibility. Wheelmap.org is based on the world map OpenStreetMap and shows 130 different types of places.
Anywhere
Wheelmap, Germany,https://news.wheelmap.org/en/contact/
NGO project
https://news.wheelmap.org/en/
https://www.jaccede.com/en/, https://www.axsmap.com/, http://ha.cnt.gr/index.php

InnovatIve BIg Data approaches for capturIng anD analyzIng Data to MonItor anD achIeve the sDgs
88
SDG indica-
tor
SDG target Name Description
Data mash-up with oth-
er sourcesCountries
Organisations and contact
details
Type of project URL
Examples for similar approaches
(or further description of the approach)
3.9
A Participa-tory Sensing Framework for Environ-ment Pollution Monitoring and Manage-ment
A participatory sensing based three-tier framework is proposed to fight environment pollution in urban areas of Bangladesh. The framework includes an android application named ‘My City, My Environment’, a server for storage and computation and also a web server for the authority to monitor and maintain environmental issues through expert decision-making. The app successfully engaged users to report and spread awareness among the citizens by sharing them in social network.
Bangla-desh
United Interna-tional University, Bangladesh,[email protected]
Research project
https://arxiv.org/pdf/1701.06429.pdf
http://research.gold.ac.uk/18006/1/Ga-brysPritchard_JGEData_EN-VIP201516.pdf
9.1 SeeClickFix
SeeClickFix is a communications platform for citizens to report non-emergency issues and for governments to track, manage, and reply; ultimately making communities better through transparency, collaboration, and coopera-tion.
USASeeClickFix, USA, [email protected]
NGO project
https://en.seeclickfix.com/
12.3 CropMobster
CropMobster ignites food system crowdsourcing. CropMobster’s mission is to empower communities to transform food waste, surplus and loss into new value, celebration and resource efficiency. By leveraging social media and instant alerts, we are able to spread the word quickly about local food excess and surplus from any supplier in the food chain, get healthy food to those in need, help local businesses recover costs, prevent food waste and connect our community in new and fun ways.
Social media data
USA
CropMobster, USA,http://cropmob-ster.com/contact/
NGO project
http://cropmobster.com/
12.5 Baidu Recycle
China produced over 3.5 million tons of electrical goods waste (“e-waste”). UNDP China worked with the internet company Baidu and developed a mobile application called “Baidu Recycle”, which links end-users to legally certified e-waste disposal companies for safe disposal and recycling.
China
UNDP, Baidu, China,[email protected]
UN project
http://www.asia-pacific.undp.org/content/rbap/en/home/ourwork/development-im-pact/innovation/projects/china-ewaste.html
Table 18 Big data approaches: Participatory sensing / crowdsourcing

InnovatIve BIg Data approaches for capturIng anD analyzIng Data to MonItor anD achIeve the sDgs
89
health records
▶▶ Introduction
Electronic health records contain very specific digital content. It is listed here since healthcare is seen as one of the most
promising fields synergizing IoT, big data and AI (see also Healthcare). A very important step in this regard is the standardized
digitization and centralized storage of health records of individual patients. This is augmented by access to an also digitized
collection of clinical and research studies, i.e. all types of academic health data. Both pools together create an unmatched
quantity of big data for medical doctors and researchers. In fact, the amount would be in most cases too overwhelming for
humans to read and process. Therefore, AI algorithms are being developed to compare and analyse patients and diagnoses
in real-time with the aim to discover patterns that would particularly strengthen preventive and predictive healthcare in
unprecedented ways. Because of different capacities and also policies, the implementation of electronic health records is at
different stages around the world.
All the approaches introduced below are linked to SDG 3, which is unsurprising as this is the SDG for “good health and well-
being”.

InnovatIve BIg Data approaches for capturIng anD analyzIng Data to MonItor anD achIeve the sDgs
90
▶▶ Approaches
SDG indica-
tor
SDG target Name Description
Data mash-up with oth-
er sourcesCountries
Organisations and contact
details
Type of project URL
Examples for similar approaches
(or further description of the approach)
3.8.1, 3.b.1 3.8, 3.b Khushi Baby
Kushi Baby built an inexpensive digital necklace that makes medical history wearable. Mobile health, wearable near-field communication technology and cloud com-puting are integrated to produce a complete platform to bridge world’s maternal and child health gap.
Wearable technology
IndiaKushi Baby, India,[email protected]
NGO project
http://www.khushibaby.org/
3.3, 3.4The HUMAN Project
The lives of 10,000 New York City residents in approximate-ly 4,000 households are studied over the span of decades by collecting measurements across multiple domains and disciplines and provide this massive dataset to the research community to achieve advancements in medicine. Thanks to advances in technology, such as wearables and micro-sensors, and maturation of multiple disciplines—including neuroscience, psychology, genetics, economics, and urban informatics—there are now the tools and knowledge nec-essary to create a long-term living portrait of how humans behave in a large urban environment.
Mobile phone data, Finan-cial transac-tions, Wearable technology
USA
KAVLI Foundation, USA,https://thehu-manproject.org/
NGO project
https://thehumanproject.org/
3.4
Predictive Modelling and Con-centration of the Risk of Suicide
Predictive modelling can identify high-risk patients for suicide who were not identified on clinical grounds. Mod-els are developed to enhance clinical care and to guide the delivery of preventive interventions.
USA
Department of Veterans Affairs, USA, National Institute of Mental Health, USA,[email protected]
Research project
http://ajph.aphapublica-tions.org/doi/abs/10.2105/AJPH.2015.302737
http://journals.plos.org/plosone/article?id=10.1371/journal.pone.0085733, http://ajp.psychiatryonline.org/doi/abs/10.1176/appi.ajp.2016.16010077
3.4, 3.8 Streams
The Streams app helps to transform the way nurses and doctors prevent avoidable patient deterioration in NHS hospitals. Streams provides nurses and doctors with quick and easy access to all of their patient’s test results. It notifies nurses and doctors as soon as observations or test results indicate a potential problem with a patient, helping to provide much faster care for widespread problems including acute kidney injury, sepsis and more. It presents clinicians with key facts about the patient’s medical history such as previous diagnoses, procedures and admissions, so clinicians have the fullest understand-ing of their condition in deciding the right care.
UK
DeepMind, UK, Royal Free London NHS Foundation Trust, UK,https://www.royalfree.nhs.uk/contact-us/patient-ad-vice-and-liai-son-service-pals/contact-pals-online-form/
Com-mercial product
https://deepmind.com/applied/deepmind-health/streams/
https://www.ibm.com/wat-son/health/, https://www.lumiata.com/

InnovatIve BIg Data approaches for capturIng anD analyzIng Data to MonItor anD achIeve the sDgs
91
SDG indica-
tor
SDG target Name Description
Data mash-up with oth-
er sourcesCountries
Organisations and contact
details
Type of project URL
Examples for similar approaches
(or further description of the approach)
3.4, 3.8
Improved cardiovascu-lar risk predic-tion using nonparamet-ric regression + electronic health record data
The study compares performance of various approaches for predicting risk of cerebro- and cardiovascular death, using traditional risk predictors versus more comprehen-sive electronic health record data. Despite the electronic health record lacking some risk factors and its imperfect data quality, healthcare systems may be able to substan-tially improve risk prediction for their patients by using internally developed electronic-health-record-derived models and flexible statistical methodology.
USA
Ann Arbor VA Health Services Research and Development (HSR&D) Center of Excellence, USA, University of Michigan, USA,[email protected]
Research project
https://www.ncbi.nlm.nih.gov/pmc/articles/PMC4081533/
https://www.ncbi.nlm.nih.gov/pubmed/26960568
Table 19 Big data approaches: Health records

InnovatIve BIg Data approaches for capturIng anD analyzIng Data to MonItor anD achIeve the sDgs
92
radio content
▶▶ Introduction
Another source of big data are radios, which existed already for a long time before the internet. The innovation here are
techniques to capture and analyse the content, which is transmitted through radios. As the example below shows, this
approach is addressing the digital divide. Large parts of the population targeted in particular by the SDGs do not have any
possibility to produce digital content online. Yet, in some of these areas, radios serve traditionally as platform for debates, i.e.
user-generated content in another format. However, the SDG targets and indicators, which are addressed by this approach, are
wide-ranging and not specified.

InnovatIve BIg Data approaches for capturIng anD analyzIng Data to MonItor anD achIeve the sDgs
93
▶▶ Approaches
SDG indica-
tor
SDG target Name Description
Data mash-up with oth-
er sourcesCountries
Organisations and contact
details
Type of project URL
Examples for similar ap-proaches (or further descrip-
tion of the approach)
un- specified
un- specified
Supporting decision - making through anal-ysis of public radio content
In rural areas, where almost 90% of the population in Uganda lives, radio serves as a vital platform for public discussion, information sharing and news. The UN initiative Pulse Lab Kampala, along with partners and with the support of the Embassy of Sweden in Uganda, is developing a prototype that makes it possible to conduct analysis of public discussions on the radio.
Uganda
UN Global Pulse Lab Kampala, Uganda,[email protected]
UN projecthttp://radio.unglobalpulse.net/uganda/
http://unglobalpulse.org/sites/default/files/Radio%20Con-tent%20Analysis%20Tool%202%20_Feb%202017_0.pdf
Table 20 Big data approaches: Radio content

InnovatIve BIg Data approaches for capturIng anD analyzIng Data to MonItor anD achIeve the sDgs
94
benefits, risks and recommendations
Digital content created by citizens thanks to new technologies constitute an innovative tool of democracy and contributes to
the maxim to “leave no one behind” (while keeping in mind that these technologies have not reached everyone in the world
yet). Yet, there are risks regarding the veracity of the information. Citizens could provide erroneous inputs, unintentionally
because they are no experts for the concerned topic, for example to observe developments in nature (see e.g. above BudBurst),
or intentionally because they have an adverse agenda and abuse the tool by spreading fake or misleading information. It is
the nature of crowdsourcing approaches that they are often created and maintained by communities, which is laudable, yet
risks are that they are neither standardized, e.g. regarding data standards and controlled vocabulary, nor sustainable. Both are
requirements if they were to be used for the SDG targets and indicators.
As with all approaches, effective AI methodologies for the increase in and for the non-manageable amounts of big data for
humans are another challenge, which has for digital content the additional dimension that there are various data types and
it tends to be less clean, as compared with structured exhaust and sensing data. Moreover, the reliability of predictions made
from these data is hard to prove (see e.g. above Predata).
The category of health records is different since only experts produce the content, thus ensuring standards, accuracy and
cleanliness. Yet, there are privacy and confidentiality concerns about centrally digitized health records.
The example of radio content is included because of its relevance to “leave no one behind”, but it is not significant for the
developed ENEA countries.
Overall, it is recommended to initiate or extend approaches using digital content for both, the calculation of SDG indicators
as well as the achievement of SDG targets. Despite the above concerns, content generated by citizens is filling a relevant gap.
As the examples show, this is especially relevant for the SDG 16 and also 5, i.e. those which deal with justice. Health records
are special and linked to SDG 3 and also have enormous potential for preventive and predictive healthcare, especially in the
developed ENEA countries.
Ai applications towards sdgs without big data
▶▶ Introduction
AI is a wide area of research with diverse sub-categories. In addition to supporting the analysis part of many of the above
approaches, for example through machine learning, speech or object recognition, there are also relevant approaches of
artificial intelligence, which are not linked to any of these big data sources. Some of these are promising to support the
achievement of the SDG targets and are introduced here. The field is very broad and the list below constitutes a selection.
The list is skipping approaches with potential, but not yet proven effect for the SDGs, such as robots for the reduction of child
labour and human trafficking and self-driving cars for the reduction of traffic accidents.

InnovatIve BIg Data approaches for capturIng anD analyzIng Data to MonItor anD achIeve the sDgs
95
▶▶ Approaches
SDG indica-
tor
SDG target Name Description
Data mash-up with oth-
er sourcesCountries
Organisations and contact
details
Type of project URL
Examples for similar approaches
(or further description of the approach)
2.3, 2.4 Plantix
Plantix is a plant diagnostic app. It provides users worldwide with customized information concerning best practices, information on preventive measures and inde-pendent options for action. Plantix offers the possibility to send pictures of affected plants directly via smart-phone and guides through an identification process to determine the plant disease in a very simple manner. The resulting metadata provides valuable insights into the spatial distribution of cultivated crops and most signifi-cant plant diseases e.g. in form of high-resolution maps.
Anywhere
Progressive Environmental and Agricultural Technologies, Germany,http://peat.tech-nology/#contact
Com-mercial product
http://plantix.net/
3.a
Classifying Smoking Urges Via Machine Learning
Different machine learning approaches are examined to use situational features associated with having or not having urges to smoke during a quit attempt in order to accurately classify high-urge states. The outcome of the analysis showed that algorithms based on feature selec-tion make it possible to obtain high classification rates with only a few features selected from the entire dataset. These numbers suggest that machine learning may be a suitable approach to deal with smoking cessation mat-ters, and to predict smoking urges, outlining a potential use for mobile health applications.
USA
University of Pittsburgh, USA,[email protected], [email protected], [email protected], [email protected]
Research project
http://imedlab.org/pdfs/pa-pers/classifying-smoking-urg-es-via-machine-learning.pdf
3.8
Supervised autonomous robotic soft tissue surgery
Autonomous robotic surgery—removing the surgeon’s hands—promises enhanced efficacy, safety, and im-proved access to optimized surgical techniques. In vivo supervised autonomous soft tissue surgery is demon-strated in an open surgical setting, enabled by a ple-noptic three-dimensional and near-infrared fluorescent imaging system and an autonomous suturing algorithm.
USA
Sheikh Zayed Institute for Pediatric Surgical Innovation, USA, Johns Hopkins University, USA,[email protected]
Research project
http://stm.sciencemag.org/content/8/337/337ra64

InnovatIve BIg Data approaches for capturIng anD analyzIng Data to MonItor anD achIeve the sDgs
96
SDG indica-
tor
SDG target Name Description
Data mash-up with oth-
er sourcesCountries
Organisations and contact
details
Type of project URL
Examples for similar approaches
(or further description of the approach)
4.1, 4.3, 4.4, 4.5, 4.6, 4.c
AI Teaching Assistant Jill Watson
Jill Watson is a virtual teaching assistant, implemented on IBM's Watson platform. She was one of nine teaching as-sistants in an AI online course. And none of the students guessed she was not a human.
USA
Georgia Institute of Technology, USA,[email protected], [email protected]
Research project
https://www.science-daily.com/releas-es/2016/05/160509101930.htm
https://singularityhub.com/2016/05/11/ai-teaching-assistant-helped-students-online-and-no-one-knew-the-difference/, http://www.slate.com/blogs/future_tense/2016/05/10/a_teach-ing_assistant_at_georgia_tech_was_actually_an_artificial_intelligence.html
10.2 LipNet
Lipreading is the task of decoding text from the move-ment of a speaker's mouth. LipNet is an end-to-end sentence-level lipreading model that achieves 95.2% accuracy in sentence-level, overlapped speaker split task, outperforming experienced human lipreaders and the previous 86.4% word-level state-of-the-art accuracy.
Anywhere
University of Ox-ford, UK, Google DeepMind, UK, CIFAR, Canada,{yannis.as-sael,brendan.shil-lingford,shimon.whiteson,nando.de.freitas}@cs.ox.ac.uk
Research project
https://arxiv.org/pdf/1611.01599.pdf
12.5ZenRobotics Recycler
ZenRobotics Recycler is the world’s first robotic waste sorting system. The robots accurately separate chosen waste fractions from solid waste streams. A typical robot with two arms makes up to 4,000 picks per hour. It sorts metals, different grades of wood and minerals, plastics and cardboard. Due to its accurate sensors and smart software, it can be trained to identify new types of waste.
Finland
ZenRobotics, Finland,[email protected]
Com-mercial product
http://zenrobotics.com/http://www.sadako.es/?page_id=39&lang=en
16.3 ROSS
ROSS is an artificial intelligence, which is powered by IBM’s Watson technology and serves as a legal researcher for law firms. It sifts through thousands of legal docu-ments to bolster the firm’s cases. The software allows the legal team to upvote and downvote excerpts based on the robot’s interpretation of the case. ROSS uses machine-learning technology to fine-tune its research methods. It is accessible via computer and billed as a subscription service.
USAROSS, USA,[email protected]
Com-mercial product
http://www.rossintelligence.com/
https://www.washingtonpost.com/news/innovations/wp/2016/05/16/meet-ross-the-newly-hired-legal-robot/?utm_term=.c124c69d106c, http://rmfyb.chinacourt.org/paper/html/2016-10/23/con-tent_117636.htm?div=-1
Table 21 Big data approaches: AI application towards SDGs without big data

InnovatIve BIg Data approaches for capturIng anD analyzIng Data to MonItor anD achIeve the sDgs
97
benefits, risks and recommendations
As mentioned, the above list is not comprehensive, but aims to give an idea of the versatile applications of AI. The general risks
of AI have been described earlier (see Challenges).
Overall, it is recommended to initiate or extend approaches using AI for both, the calculation of SDG indicators as well as the
achievement of SDG targets. Despite appropriate concerns a large potential of AI approaches has been revealed in recent
years. The ENEA countries have been pioneers in some fields of AI, e.g. robotics, and have the capacities to continue top-class
AI research, also towards the SDGs. However, efforts should be made to address the risks of AI too, which are currently mostly
examined by institutions in the USA and the UK.

InnovatIve BIg Data approaches for capturIng anD analyzIng Data to MonItor anD achIeve the sDgs
98
key findings and analysis
After showcasing around 140 big data approaches for the calculation of the SDG indicators and the achievement of SDG
targets, the key findings and an analysis of the usefulness of big data tools are delivered. An analysis follows which SDG
indicators and targets are captured by which approaches. (See also Table 25 in the Annex for an overview)
not suitable indicators for big data
Because of the extreme range of topics, the 230 SDG indicators are very diverse. Three types of indicators can be identified as
not suitable for big data. These are formulated in the following styles:
• Number or proportion of countries or governments (For example: “12.7.1 Number of countries implementing sustainable
public procurement policies and action plans”)
• Number of agreements or strategies (For example: “17.6.1 Number of science and/or technology cooperation agreements
and programmes between countries, by type of cooperation”)
• Financial flows or investments or budgets (For example: “15.b.1 Official development assistance and public expenditure on
conservation and sustainable use of biodiversity and ecosystems”)
The reason is that these indicators are neither about what people say or do, as Kirkpatrick described big data, nor can sensors
capture data about these indicators. For example, in the first category above these countries have to be somehow counted, i.e.
a method that does not require big data.
70 indicators fall in one these three categories, i.e. almost one third of all indicators. Of these 70 indicators 38 are tier 3
indicators, of which there are 84 in total. This means for over 45 per cent of the tier 3 indicators big data cannot support its
calculation. Also 7 of the overall 61 tier 2 indicators seem to be not suitable for big data. The SDGs 12, 13 and 17 have the
highest number of indicators that are not suitable for big data. The SDGs 12 and 13 also happen to have the highest numbers
of tier 2 and 3 indicators.
indicators with big data approaches
The showcased approaches in this report may support the calculation of 40 out of 232 SDG indicators. Of particular interest is
if the big data approaches can address tier 2 and 3 indicators as they can (at this stage) not be calculated through traditional
statistics. Table 22 illustrates the breakdown of potentially assisted indicators by tier.
Tier Exhaust data Sensing data Digital content Total
1 6 9 0 13
2 5 7 8 16
3 1 8 6 13
Total 12 24 14 421
Table 22 Approaches for calculation of indicators by tier category

InnovatIve BIg Data approaches for capturIng anD analyzIng Data to MonItor anD achIeve the sDgs
99
Table 23 illustrates the breakdown of potentially assisted indicators by SDG.
SDG Exhaust data Sensing data Digital content Total
1 4 4 0 4
2 5 1 1 6
3 1 0 2 3
4 0 0 0 0
5 1 0 3 4
6 0 4 0 4
7 0 2 0 2
8 0 2 0 2
9 0 1 0 1
10 0 0 0 0
11 1 5 1 6
12 0 0 0 0
13 0 0 0 0
14 0 2 1 2
15 0 3 1 3
16 0 0 5 5
17 0 0 0 0
Total 12 24 14 42
Table 23 Approaches for calculation of indicators by SDG▶▶ Observations:
• Big data approaches were found to assist the calculation of 42 SDG indicators, of which there are 232 in total. Of these 232,
70 have been listed as not suitable for big data, i.e. for 26 per cent of the remaining 162 indicators approaches that were
presented, which is more than one quarter.
• Approaches were identified to tackle 29 tier II or tier III indicators, of which there are 150 in total. Of these 150,45 have been
listed as not suitable for big data, i.e. for 28 per cent of the remaining 105 indicators approaches that were presented, which
is also more than one quarter.
• No approaches were found for the following SDGs 4, 10, 12, 13 and 17. It was mentioned above that the SDGs 12, 13 and 17
have the highest number of indicators that are not suitable for big data.
• Exhaust data appear to be useful particularly for indicators of SDGs 1 and 2, i.e. those, which are of concern in developing
countries.
• Sensing data address far more indicators than exhaust data and digital content, which could be because there are more
approaches overall and because they provide more precise information than exhaust data and digital content.
• As indicated before, digital content appears to support in particular indicators of SDGs, which deal with justice, i.e. 16 and 5.

InnovatIve BIg Data approaches for capturIng anD analyzIng Data to MonItor anD achIeve the sDgs
100
targets with big data approaches
The showcased approaches in this report may support the achievement of 66 out of 169 SDG targets. Table 24 illustrates the
breakdown of potentially assisted targets by SDG.
SDG Exhaust data Sensing data Digital content AI Total
1 1 1 1 0 1
2 0 3 1 2 4
3 4 7 7 2 10
4 0 3 1 6 6
5 2 2 3 0 4
6 0 5 0 0 5
7 1 2 0 0 2
8 2 3 3 0 4
9 0 1 2 0 2
10 1 1 2 1 2
11 4 4 3 0 5
12 1 1 2 1 2
13 1 2 1 0 2
14 0 4 1 0 4
15 0 5 0 0 5
16 4 4 6 1 8
17 0 0 0 0 0
Total 21 48 33 13 662
Table 24 Approaches for achievement of targets by SDG
▶▶ Observations:
• Big data and AI approaches were found to assist the achievement of 66 SDG targets, of which there are 169 in total. This is
39 per cent, i.e. a higher percentage than the 24.5 per cent that assist calculation of SDG indicators.
• The most targets were addressed within SDG 3, which are 10 and including repetitions even 20.
• As with the indicators, sensing data tackle also the most targets. Sensing data are important for SDGs 14 and 15 as they are
about tracking nature, which is not so much linked to what people say or do.
• While exhaust data and digital content support the same number of SDG indicators, far more approaches using digital
content than using exhaust data were found for the achievement of targets.
• The addition of further AI approaches gives an idea that some AI subcategories also have potential for the achievement of
certain SDG targets without requiring big data.

InnovatIve BIg Data approaches for capturIng anD analyzIng Data to MonItor anD achIeve the sDgs
101
Conclusion
After introducing the SDGs as well as the concepts of big data, IoT and AI in general, this report presented innovative big data
approaches that could support the calculation of SDG indicators and the achievement of SDG targets. The search for innovation
approaches is well-founded because of the high number of tier 2 and 3 indicators, for which traditional statistics are currently
struggling to establish methodologies and to secure data.
Since these research areas are developing, many projects are work in progress or at early stages. Therefore, while these
projects seem promising, it has to be monitored if an often restricted trial can be transformed to a universal approach, so that
standardized and comparable data are delivered. For the calculation of indicators, the project would have to be, if possible at
all, adjusted to the standards and methodology specified by the IAEG-SDGs.
Overall, the magnitude and the diversity of the presented approaches indicate that the potential opportunities of big data, IoT
and AI appear to be realistic.
An overall concern is the endangered right of data privacy, for which global policies are required. As mentioned earlier, UN Global
Pulse has developed a set of data privacy and data protection principles, which could serve as an initial template79. Moreover,
as also indicated, an additional policy framework is needed on agreed standards for big data and their interoperability.
Another general issue is to avoid an “analysis bottleneck” and keep the real-time promise, which can only be tackled by
powerful AI methodologies. Non-analysed raw data will mostly be of no use. Since ENEA countries have a track record for their
accomplishments in AI they are well positioned to contribute to this field.
While some approaches are more tailored for developing countries, various others appear to be suitable to be piloted in the
ENEA countries. The areas with the most potential through harnessing synergies between IoT, big data and AI for the ENEA
countries are health (SDG 3), smart cities (SDG 11) and disaster resilience (various SDGs).
Mass health data through digitization of health records as well as clinical research data in combination with data from
wearables and other sensors provide enormous potential for preventive and predictive healthcare. Also, the quality of urban
life can be increased significantly by implementing the introduced big data approaches, especially the sensor-based ones.
Resilience is crucial for the disaster-prone areas in the ENEA region. Several promising tools have been presented, again
primarily sensor-based, but also crowdsourcing approaches have potential.
Overall it is recommended that the ENEA countries promote and incentivize a vibrant environment for big data, IoT and AI,
which involves the private sector, including start-ups, academic research institutions as well as NGOs to further foster citizen
participation. The National Statistics Offices are encouraged to embrace these new partners with the aim to “share technology
and innovations for the common good”, which is one of the key recommendations of the report “A world that counts”
(Independent Expert Advisory Group on a Data Revolution for Sustainable Development, 2014, p. 3)
79 See http://www.unglobalpulse.org/privacy-and-data-protection.

InnovatIve BIg Data approaches for capturIng anD analyzIng Data to MonItor anD achIeve the sDgs
102
references
Anderson, Chris (2008). The End of Theory: The Data Deluge Makes the Scientific Method Obsolete. Wired. 16, issue 7.
Available from https://www.wired.com/2008/06/pb-theory/
Berti-Équille, Laure, and Javier Borge-Holthoefer (2015). Veracity of Data: From Truth Discovery Computation Algorithms to
Models of Misinformation Dynamics (Synthesis Lectures on Data Management). Morgan & Claypool Publishers.
Available from: http://www.morganclaypool.com/doi/abs/10.2200/S00676ED1V01Y201509DTM042
Bostrom, Nick (2014). Superintelligence: Paths, Dangers, Strategies. Oxford: Oxford University Press.
Chalmers, David (2010). The Singularity: A Philosophical Analysis. Journal of Consciousness Studies 17, pp. 7-65.
Chetty, Raj et al. (2011). The Long-term Impacts of Teachers: Teacher Value-added and Student Outcomes in Adulthood.
Working Paper 17699. National Bureau of Economic Research.
Available from https://www.ncbi.nlm.nih.gov/pubmed/27480367
Connelly, Roxanne et al. (2016). The role of administrative data in the big data revolution in social science research. Social
Science Research, 59, pp. 1 – 12.
Available from http://ac.els-cdn.com/S0049089X1630206X/1-s2.0-S0049089X1630206X-main.pdf?_tid=f729f3d0-51b7-11e7-
b8c5-00000aacb35e&acdnat=1497523802_73b31d147694e82d024fff8cbda2122f
Data-Pop Alliance (2015a). Big Data for Climate Change and Disaster Resilience: Realising the Benefits for Developing Countries.
Synthesis Report.
Available from http://datapopalliance.org/wp-content/uploads/2015/11/Big-Data-for-Resilience-2015-Report.pdf
Data-Pop Alliance (2015b). Beyond Data Literacy: Reinventing Community Engagement and Empowerment in the Age of Data.
White Paper Series.
Available from http://datapopalliance.org/wp-content/uploads/2015/11/Beyond-Data-Literacy-2015.pdf
Data-Pop Alliance (2015c). Opportunities and Requirements for Leveraging Big Data for Official Statistics and the Sustainable
Development Goals in Latin America. White Paper Series.
Available from http://cea.cepal.org/sites/default/files/lacbigdatansopapernov10finaldraft.pdf

InnovatIve BIg Data approaches for capturIng anD analyzIng Data to MonItor anD achIeve the sDgs
103
Datta , Amit et al. (2015). Automated Experiments on Ad Privacy Settings. Proceedings on Privacy Enhancing Technologies.
2015 (1), pp. 92–112.
Available from http://www.andrew.cmu.edu/user/danupam/dtd-pets15.pdf
Executive Office of the US President (2016). Big Data: A Report on Algorithmic Systems, Opportunity, and Civil Rights.
Available from https://obamawhitehouse.archives.gov/sites/default/files/microsites/ostp/2016_0504_data_discrimination.pdf
Eysenbach Gunther (2011). Infodemiology and infoveillance tracking online health information and cyberbehavior for public
health. American Journal of Preventive Medicine. 40 (5 Suppl 2), pp. 154–S158.
Available from https://www.ncbi.nlm.nih.gov/pubmed/21521589
Gardner, Howard (1987). The Mind’s New Science: A History of the Cognitive Revolution. Basic Books.
Goodchild, Michael F. (2007). “Citizens as sensors: the world of volunteered geography”. GeoJournal. 69 (4), pp. 211–221.
Available from http://ncgia.ucsb.edu/projects/vgi/docs/position/Goodchild_VGI2007.pdf
Independent Expert Advisory Group on a Data Revolution for Sustainable Development (2014). A world that counts: Mobilizing
a Data Revolution for
Sustainable Development.
Available from http://www.undatarevolution.org/wp-content/uploads/2014/11/A-World-That-Counts.pdf
Innovations for Poverty Action (2016). Sensing Impacts: Remote Monitoring Using Sensors.
Available from http://www.poverty-action.org/sites/default/files/publications/Goldilocks-Deep-Dive-Sensing-Impacts-Remote-
Monitoring-using-Sensors_0.pdf
International Council for Science and International Social Science Council (2015). Review of Targets for the Sustainable
Development Goals: The Science Perspective. Paris: International Council for Science (ICSU).
Available from www.icsu.org/publications/reports-and-reviews/review-of-targets-for-the-sustainable-development-goals-the-
science-perspective-2015/SDG-Report.pdf
International Telecommunication Union (2005). The Internet of Things. ITU Internet Report.
Available from https://www.itu.int/net/wsis/tunis/newsroom/stats/The-Internet-of-Things-2005.pdf
International Telecommunication Union (2013). Smart Cities Seoul: a case study. ITU-T Technology Watch Report February.
Available from https://www.itu.int/dms_pub/itu-t/oth/23/01/T23010000190001PDFE.pdf

InnovatIve BIg Data approaches for capturIng anD analyzIng Data to MonItor anD achIeve the sDgs
104
International Telecommunication Union (2015). Big data – cloud computing based requirements and capabilities. Series
Y: Global Information Infrastructure, Internet Protocol Aspects and Next-Generation Networks, Cloud Computing,
Recommendation ITU-T Y.3600.
Available from https://www.itu.int/rec/T-REC-Y.3600-201511-I
International Telecommunication Union and CISCO Systems (2016). Harnessing the Internet of Things for Global Development.
Available from http://www.itu.int/en/action/broadband/Documents/Harnessing-IoT-Global-Development.pdf
Laney, Douglas (2001). 3D Data Management: Controlling Data Volume, Velocity and Variety. META Group Inc. Application
Delivery Strategies.
Available from http://blogs.gartner.com/doug-laney/files/2012/01/ad949-3D-Data-Management-Controlling-Data-Volume-
Velocity-and-Variety.pdf
Lazer, David et al. (2014). The Parable of Google Flu: Traps in Big Data Analysis. Science, Vol. 343, Issue 6176, pp. 1203-1205
Available from http://science.sciencemag.org/content/343/6176/1203
Legg, Shawn, and Marcus Hutter (2007). Universal Intelligence: A Definition of Machine Intelligence. Minds and Machines. 17(4),
pp. 391-444.
Available from https://arxiv.org/pdf/0712.3329.pdf
Mayer-Schönberger, Viktor, and Kenneth Cukier (2013). Big Data. A Revolution That Will Transform How We Live, Work, and
Think. Eamon Dolan/Houghton Mifflin Harcourt.
Newell, Allen, and Herbert A. Simon (1976). Computer Science as Empirical Inquiry: Symbols and Search. Communications of
the ACM, 19 (3), pp. 113–126.
Available from http://facweb.cs.depaul.edu/mobasher/classes/csc426/notes/p113-newell.pdf
Open Data Institute (2015). Supporting sustainable development with open data. ODI-WP-2015-000.
Available from https://theodi.org/supporting-sustainable-development-with-open-data
Overseas Development Institute (2015). The data revolution. Finding the missing millions. Research Report 03.
Available from https://www.odi.org/sites/odi.org.uk/files/odi-assets/publications-opinion-files/9604.pdf
Sustainable Development Solutions Network (2015a). Data for Development: A Needs Assessment for SDG Monitoring and
Statistical Capacity Development.

InnovatIve BIg Data approaches for capturIng anD analyzIng Data to MonItor anD achIeve the sDgs
105
Available from http://unsdsn.org/wp-content/uploads/2015/04/Data-for-Development-Full-Report.pdf
Sustainable Development Solutions Network (2015b). Indicators and a Monitoring Framework for the Sustainable Development
Goals - Launching a data revolution for the SDGs. A report to the Secretary - General of the United Nations by the Leadership
Council of the Sustainable Development Solutions Network
Available from https://sustainabledevelopment.un.org/content/documents/2013150612-FINAL-SDSN-Indicator-Report1.pdf
Task Team on Lessons Learned from MDG Monitoring of the IAEG-MDG (2013). Lessons Learned from MDG Monitoring from a
Statistical Perspective.
Available from https://unstats.un.org/unsd/broaderprogress/pdf/Lesson%20Learned%20from%20MDG%20
Monitoring_2013-03-22%20(IAEG).pdf
Tourangeau, Roger et al., eds. (2014). Hard-to-Survey Populations. Cambridge University Press.
United Nations Economic and Social Commission for Asia and the Pacific (2016a). Committing to the effective implementation
of the 2030 Agenda for Sustainable Development in Asia and the Pacific. E/ESCAP/RES/72/6.
Available from https://www.unescap.org/sites/default/files/E72_RES6E.pdf
United Nations Economic and Social Commission for Asia and the Pacific (2016b). Harnessing science, technology and
innovation for inclusive and sustainable development in Asia and the Pacific. E/ESCAP/RES/72/12.
Available from https://www.unescap.org/sites/default/files/E72_RES12E.pdf
United Nations, General Assembly (2014). Outcome document of the special event to follow up efforts made towards achieving
the Millennium Development Goals. Resolution A/RES/68/6.
Available from http://www.un.org/en/ga/search/view_doc.asp?symbol=A/RES/68/6
United Nations, General Assembly (2015). Transforming our world: the 2030 Agenda for Sustainable Development. Resolution
A/RES/70/1
Available from http://www.un.org/en/ga/search/view_doc.asp?symbol=A/RES/70/1
United Nations Global Pulse (2012). Big Data for Development: Challenges and Opportunities.
Available from http://www.unglobalpulse.org/sites/default/files/BigDataforDevelopment-UNGlobalPulseJune2012.pdf
United Nations Global Pulse (2016). Integrating Big Data Into the Monitoring and Evaluation of Development Programmes.
Available from http://unglobalpulse.org/sites/default/files/IntegratingBigData_intoMEDP_web_UNGP.pdf

InnovatIve BIg Data approaches for capturIng anD analyzIng Data to MonItor anD achIeve the sDgs
106
United Nations, Inter-Agency and Expert Group on Sustainable Development Goal Indicators (2015). Report of the Inter-Agency
and Expert Group on Sustainable Development Goal Indicators. E/CN.3/2016/2/Rev.1
Available from https://unstats.un.org/unsd/statcom/47th-session/documents/2016-2-IAEG-SDGs-E.pdf
United Nations Office for the Coordination of Humanitarian Affairs (2014). Unmanned Aerial Vehicles in Humanitarian Response.
OCHA Policy and Studies Series 010.
Available from https://docs.unocha.org/sites/dms/Documents/Unmanned%20Aerial%20Vehicles%20in%20Humanitarian%20
Response%20OCHA%20July%202014.pdf
United Nations Secretary-General (2016). Progress towards the Sustainable Development Goals. E/2016/75.
Available from https://unstats.un.org/sdgs/files/report/2016/secretary-general-sdg-report-2016--EN.pdf
United Nations Secretary-General’s High-Level Panel on Women’s Economic Empowerment (2016). Leave no one behind – A
Call to Action for Gender Equality and Women’s Economic Empowerment.
Available from http://www.unwomen.org/~/media/headquarters/attachments/sections/news/stories/2016/unhlp-
womenseconomicempowerment-overview.pdf
United Nations World Data Forum (2017). Fact Sheet.
Available from http://undataforum.org/WorldDataForum/wp-content/uploads/2017/01/Fact-Sheet-20170106.pdf
World Bank (2016). Measuring Rural Access - Using new technologies.
Available from http://documents.worldbank.org/curated/en/367391472117815229/pdf/107996-REVISED-PUBLIC-
MeasuringRuralAccessweb.pdf
Ziesche, Soenke, and Sahar Motallebi (2013). Personalized Remotely Monitored Healthcare in Low-Income Countries through
Ambient Intelligence. In: M.J. O'Grady et al., eds. Evolving Ambient Intelligence. Ambient Intelligence 2013 Workshops,
Communications in Computer and Information Science, Vol. 413, pp. 196–204.
Available from http://link.springer.com/chapter/10.1007/978-3-319-04406-4_19

InnovatIve BIg Data approaches for capturIng anD analyzIng Data to MonItor anD achIeve the sDgs
107
Annex - SDG targets, indicators and big data approaches
ExpLAnATIonS:
columns:
• T cov: target covered by exhaust data, sensing data, digital content or AI approach
• T exh: target covered by exhaust data approach
• T sen: target covered by sensing data approach
• T con: target covered by digital content approach
• T AI: target covered by AI approach
• I cov: indicator covered by exhaust data, sensing data or digital content approach
• I exh: indicator covered by exhaust data approach
• I sen: indicator covered by sensing data approach
• I con: indicator covered by digital content approach
colouring:
• Black: indicator not suitable for big data
• Green: approach presented for the target or indicator

InnovatIve BIg Data approaches for capturIng anD analyzIng Data to MonItor anD achIeve the sDgs
108
Goals and targets Indicators Tier T cov T exh T sen T con T AI I cov I exh I sen I con
Goal 1. End poverty in all its forms everywhere
1.1 By 2030, eradicate extreme poverty for all people everywhere, currently measured as people living on less than $1.25 a day
1.1.1 Proportion of population below the international poverty line, by sex, age, employment status and geographical location (urban/rural)
1 1 1 1
1.2 By 2030, reduce at least by half the proportion of men, women and children of all ages living in poverty in all its dimensions according to national definitions
1.2.1 Proportion of population living below the national poverty line, by sex and age
1 1 1 1
1.2.2 Proportion of men, women and children of all ages living in poverty in all its dimensions according to national definitions
2 1 1 1
1.3 Implement nationally appropriate social protection systems and measures for all, including floors, and by 2030 achieve substantial cover-age of the poor and the vulnerable
1.3.1 Proportion of population covered by social protection floors/systems, by sex, distinguishing children, unemployed persons, older persons, persons with disabilities, pregnant women, newborns, work-injury victims and the poor and the vulnerable
2
1.4 By 2030, ensure that all men and women, in particular the poor and the vulnerable, have equal rights to economic resources, as well as ac-cess to basic services, ownership and control over land and other forms of property, inheritance, natural resources, appropriate new technology and financial services, including microfinance
1.4.1 Proportion of population living in households with access to basic services
3
1.4.2 Proportion of total adult population with secure tenure rights to land, with legally recognized documentation and who perceive their rights to land as secure, by sex and by type of tenure
3
1.5 By 2030, build the resilience of the poor and those in vulnerable situ-ations and reduce their exposure and vulnerability to climate-related extreme events and other economic, social and environmental shocks and disasters
1.5.1 Number of deaths, missing persons and directly affected persons attributed to disasters per 100,000 population
2
1.5.2 Direct economic loss attributed to disasters in relation to global gross domestic product (GDP)
2 1 1 1
1.5.3 Number of countries that adopt and implement national disaster risk reduction strategies in line with the Sendai Framework for Disaster Risk Reduction 2015-2030
2 1 1 1 1
1.5.4 Proportion of local governments that adopt and implement local disaster risk reduction strategies in line with national disaster risk reduction strategies
3

InnovatIve BIg Data approaches for capturIng anD analyzIng Data to MonItor anD achIeve the sDgs
109
Goals and targets Indicators Tier T cov T exh T sen T con T AI I cov I exh I sen I con
1.a Ensure significant mobilization of resources from a variety of sourc-es, including through enhanced development cooperation, in order to provide adequate and predictable means for developing countries, in particular least developed countries, to implement programmes and policies to end poverty in all its dimensions
1.a.1 Proportion of domestically generated resources allocated by the government directly to poverty reduction programmes
3
1.a.2 Proportion of total government spending on essential services (educa-tion, health and social protection)
2
1.a.3 Sum of total grants and non-debt-creating inflows directly allocated to poverty reduction programmes as a proportion of GDP
3
1.b Create sound policy frameworks at the national, regional and inter-national levels, based on pro-poor and gender-sensitive development strategies, to support accelerated investment in poverty eradication actions
1.b.1 Proportion of government recurrent and capital spending to sectors that disproportionately benefit women, the poor and vulnerable groups
3
Goal 2. End hunger, achieve food security and improved nutrition and promote sustainable agriculture
2.1 By 2030, end hunger and ensure access by all people, in particular the poor and people in vulnerable situations, including infants, to safe, nutritious and sufficient food all year round
2.1.1 Prevalence of undernourishment 1 1 1
2.1.2 Prevalence of moderate or severe food insecurity in the population, based on the Food Insecurity Experience Scale (FIES)
1 1 1 1 1
2.2 By 2030, end all forms of malnutrition, including achieving, by 2025, the internationally agreed targets on stunting and wasting in children under 5 years of age, and address the nutritional needs of adolescent girls, pregnant and lactating women and older persons
2.2.1 Prevalence of stunting (height for age <-2 standard deviation from the median of the World Health Organization (WHO) Child Growth Standards) among children under 5 years of age
1 1 1
2.2.2 Prevalence of malnutrition (weight for height >+2 or <-2 standard deviation from the median of the WHO Child Growth Standards) among children under 5 years of age, by type (wasting and overweight)
1 1 1
2.3 By 2030, double the agricultural productivity and incomes of small-scale food producers, in particular women, indigenous peoples, family farmers, pastoralists and fishers, including through secure and equal access to land, other productive resources and inputs, knowledge, fi-nancial services, markets and opportunities for value addition and non-farm employment
2.3.1 Volume of production per labour unit by classes of farming/pastoral/forestry enterprise size
3
2.3.2 Average income of small-scale food producers, by sex and indigenous status
3 1 1 1
2.4 By 2030, ensure sustainable food production systems and imple-ment resilient agricultural practices that increase productivity and production, that help maintain ecosystems, that strengthen capacity for adaptation to climate change, extreme weather, drought, flooding and other disasters and that progressively improve land and soil quality
2.4.1 Proportion of agricultural area under productive and sustainable agriculture
3 1 1 1 1 1

InnovatIve BIg Data approaches for capturIng anD analyzIng Data to MonItor anD achIeve the sDgs
110
Goals and targets Indicators Tier T cov T exh T sen T con T AI I cov I exh I sen I con
2.5 By 2020, maintain the genetic diversity of seeds, cultivated plants and farmed and domesticated animals and their related wild species, including through soundly managed and diversified seed and plant banks at the national, regional and international levels, and promote access to and fair and equitable sharing of benefits arising from the utilization of genetic resources and associated traditional knowledge, as internationally agreed
2.5.1 Number of plant and animal genetic resources for food and agriculture secured in either medium or long-term conservation facilities
2
2.5.2 Proportion of local breeds classified as being at risk, not-at-risk or at unknown level of risk of extinction
2 1 1
2.a Increase investment, including through enhanced international cooperation, in rural infrastructure, agricultural research and extension services, technology development and plant and livestock gene banks in order to enhance agricultural productive capacity in developing countries, in particular least developed countries
2.a.1 The agriculture orientation index for government expenditures 2
2.a.2 Total official flows (official development assistance plus other official flows) to the agriculture sector
1
2.b Correct and prevent trade restrictions and distortions in world agri-cultural markets, including through the parallel elimination of all forms of agricultural export subsidies and all export measures with equivalent effect, in accordance with the mandate of the Doha Development Round
2.b.1 Agricultural export subsidies 1
2.c Adopt measures to ensure the proper functioning of food commod-ity markets and their derivatives and facilitate timely access to market information, including on food reserves, in order to help limit extreme food price volatility
2.c.1 Indicator of food price anomalies 2 1 1 1
Goal 3. Ensure healthy lives and promote well-being for all at all ages
3.1 By 2030, reduce the global maternal mortality ratio to less than 70 per 100,000 live births
3.1.1 Maternal mortality ratio 2
3.1.2 Proportion of births attended by skilled health personnel 1
3.2 By 2030, end preventable deaths of newborns and children under 5 years of age, with all countries aiming to reduce neonatal mortality to at least as low as 12 per 1,000 live births and under-5 mortality to at least as low as 25 per 1,000 live births
3.2.1 Under-five mortality rate 1
3.2.2 Neonatal mortality rate 1 1 1

InnovatIve BIg Data approaches for capturIng anD analyzIng Data to MonItor anD achIeve the sDgs
111
Goals and targets Indicators Tier T cov T exh T sen T con T AI I cov I exh I sen I con
3.3 By 2030, end the epidemics of AIDS, tuberculosis, malaria and neglected tropical diseases and combat hepatitis, water-borne diseases and other communicable diseases
3.3.1 Number of new HIV infections per 1,000 uninfected population, by sex, age and key populations
2 1 1
3.3.2 Tuberculosis incidence per 100,000 population 1
3.3.3 Malaria incidence per 1,000 population 1
3.3.4 Hepatitis B incidence per 100,000 population 2
3.3.5 Number of people requiring interventions against neglected tropical diseases
1 1 1 1
3.4 By 2030, reduce by one third premature mortality from non-com-municable diseases through prevention and treatment and promote mental health and well-being
3.4.1 Mortality rate attributed to cardiovascular disease, cancer, diabetes or chronic respiratory disease
2
3.4.2 Suicide mortality rate 2 1 1 1 1
3.5 Strengthen the prevention and treatment of substance abuse, including narcotic drug abuse and harmful use of alcohol
3.5.1 Coverage of treatment interventions (pharmacological, psychosocial and rehabilitation and aftercare services) for substance use disorders
3
3.5.2 Harmful use of alcohol, defined according to the national context as alcohol per capita consumption (aged 15 years and older) within a calendar year in litres of pure alcohol
1 1 1 1
3.6 By 2020, halve the number of global deaths and injuries from road traffic accidents
3.6.1 Death rate due to road traffic injuries 1 1 1
3.7 By 2030, ensure universal access to sexual and reproductive health-care services, including for family planning, information and education, and the integration of reproductive health into national strategies and programmes
3.7.1 Proportion of women of reproductive age (aged 15-49 years) who have their need for family planning satisfied with modern methods
1
3.7.2 Adolescent birth rate (aged 10-14 years; aged 15-19 years) per 1,000 women in that age group
2
3.8 Achieve universal health coverage, including financial risk protec-tion, access to quality essential health-care services and access to safe, effective, quality and affordable essential medicines and vaccines for all
3.8.1 Coverage of essential health services (defined as the average coverage of essential services based on tracer interventions that include reproductive, maternal, newborn and child health, infectious diseases, non-communica-ble diseases and service capacity and access, among the general and the most disadvantaged population)
3
3.8.2 Proportion of population with large household expenditures on health as a share of total household expenditure or income
2 1 1 1 1 1

InnovatIve BIg Data approaches for capturIng anD analyzIng Data to MonItor anD achIeve the sDgs
112
Goals and targets Indicators Tier T cov T exh T sen T con T AI I cov I exh I sen I con
3.9 By 2030, substantially reduce the number of deaths and illnesses from hazardous chemicals and air, water and soil pollution and contami-nation
3.9.1 Mortality rate attributed to household and ambient air pollution 1
3.9.2 Mortality rate attributed to unsafe water, unsafe sanitation and lack of hygiene (exposure to unsafe Water, Sanitation and Hygiene for All (WASH) services)
2
3.9.3 Mortality rate attributed to unintentional poisoning 2 1 1 1
3.a Strengthen the implementation of the World Health Organization Framework Convention on Tobacco Control in all countries, as appropri-ate
3.a.1 Age-standardized prevalence of current tobacco use among persons aged 15 years and older
1 1 1
3.b Support the research and development of vaccines and medicines for the communicable and non-communicable diseases that primarily affect developing countries, provide access to affordable essential medicines and vaccines, in accordance with the Doha Declaration on the TRIPS Agreement and Public Health, which affirms the right of developing countries to use to the full the provisions in the Agreement on Trade-Related Aspects of Intellectual Property Rights regarding flexibilities to protect public health, and, in particular, provide access to medicines for all
3.b.1 Proportion of the target population covered by all vaccines included in their national programme
3
3.b.2 Total net official development assistance to medical research and basic health sectors
1 1 1 1
3.b.3 Proportion of health facilities that have a core set of relevant essential medicines available and affordable on a sustainable basis
3
3.c Substantially increase health financing and the recruitment, devel-opment, training and retention of the health workforce in developing countries, especially in least developed countries and small island developing States
3.c.1 Health worker density and distribution 1
3.d Strengthen the capacity of all countries, in particular developing countries, for early warning, risk reduction and management of national and global health risks
3.d.1 International Health Regulations (IHR) capacity and health emergency preparedness
2 1 1 1
Goal 4. Ensure inclusive and equitable quality education and promote lifelong learning opportunities for all
4.1 By 2030, ensure that all girls and boys complete free, equitable and quality primary and secondary education leading to relevant and effective learning outcomes
4.1.1 Proportion of children and young people: (a) in grades 2/3; (b) at the end of primary; and (c) at the end of lower secondary achieving at least a minimum proficiency level in (i) reading and (ii) mathematics, by sex
3,2 1 1 1
4.2 By 2030, ensure that all girls and boys have access to quality early childhood development, care and pre-primary education so that they are ready for primary education
4.2.1 Proportion of children under 5 years of age who are developmentally on track in health, learning and psychosocial well-being, by sex
3
4.2.2 Participation rate in organized learning (one year before the official primary entry age), by sex
1

InnovatIve BIg Data approaches for capturIng anD analyzIng Data to MonItor anD achIeve the sDgs
113
Goals and targets Indicators Tier T cov T exh T sen T con T AI I cov I exh I sen I con
4.3 By 2030, ensure equal access for all women and men to affordable and quality technical, vocational and tertiary education, including university
4.3.1 Participation rate of youth and adults in formal and non-formal educa-tion and training in the previous 12 months, by sex
2 1 1
4.4 By 2030, substantially increase the number of youth and adults who have relevant skills, including technical and vocational skills, for employ-ment, decent jobs and entrepreneurship
4.4.1 Proportion of youth and adults with information and communications technology (ICT) skills, by type of skill
2 1 1
4.5 By 2030, eliminate gender disparities in education and ensure equal access to all levels of education and vocational training for the vulnera-ble, including persons with disabilities, indigenous peoples and children in vulnerable situations
4.5.1 Parity indices (female/male, rural/urban, bottom/top wealth quintile and others such as disability status, indigenous peoples and conflict-affect-ed, as data become available) for all education indicators on this list that can be disaggregated
1, 2, 3
1 1 1 1
4.6 By 2030, ensure that all youth and a substantial proportion of adults, both men and women, achieve literacy and numeracy
4.6.1 Proportion of population in a given age group achieving at least a fixed level of proficiency in functional (a) literacy and (b) numeracy skills, by sex
2 1 1 1
4.7 By 2030, ensure that all learners acquire the knowledge and skills needed to promote sustainable development, including, among others, through education for sustainable development and sustainable lifestyles, human rights, gender equality, promotion of a culture of peace and non-violence, global citizenship and appreciation of cultural diversity and of culture’s contribution to sustainable development
4.7.1 Extent to which (i) global citizenship education and (ii) education for sustainable development, including gender equality and human rights, are mainstreamed at all levels in: (a) national education policies, (b) curricula, (c) teacher education and (d) student assessment
3
4.a Build and upgrade education facilities that are child, disability and gender sensitive and provide safe, non-violent, inclusive and effective learning environments for all
4.a.1 Proportion of schools with access to: (a) electricity; (b) the Internet for pedagogical purposes; (c) computers for pedagogical purposes; (d) adapted infrastructure and materials for students with disabilities; (e) basic drinking water; (f ) single-sex basic sanitation facilities; and (g) basic handwashing facilities (as per the WASH indicator definitions)
2
4.b By 2020, substantially expand globally the number of scholarships available to developing countries, in particular least developed coun-tries, small island developing States and African countries, for enrolment in higher education, including vocational training and information and communications technology, technical, engineering and scientific programmes, in developed countries and other developing countries
4.b.1 Volume of official development assistance flows for scholarships by sector and type of study
1
4.c By 2030, substantially increase the supply of qualified teachers, including through international cooperation for teacher training in developing countries, especially least developed countries and small island developing States
4.c.1 Proportion of teachers in: (a) pre-primary; (b) primary; (c) lower sec-ondary; and (d) upper secondary education who have received at least the minimum organized teacher training (e.g. pedagogical training) pre-service or in-service required for teaching at the relevant level in a given country
1 1 1

InnovatIve BIg Data approaches for capturIng anD analyzIng Data to MonItor anD achIeve the sDgs
114
Goals and targets Indicators Tier T cov T exh T sen T con T AI I cov I exh I sen I con
Goal 5. Achieve gender equality and empower all women and girls
5.1 End all forms of discrimination against all women and girls every-where
5.1.1 Whether or not legal frameworks are in place to promote, enforce and monitor equality and non-discrimination on the basis of sex
3 1 1
5.2 Eliminate all forms of violence against all women and girls in the public and private spheres, including trafficking and sexual and other types of exploitation
5.2.1 Proportion of ever-partnered women and girls aged 15 years and older subjected to physical, sexual or psychological violence by a current or former intimate partner in the previous 12 months, by form of violence and by age
2 1 1
5.2.2 Proportion of women and girls aged 15 years and older subjected to sexual violence by persons other than an intimate partner in the previous 12 months, by age and place of occurrence
2 1 1 1 1 1
5.3 Eliminate all harmful practices, such as child, early and forced mar-riage and female genital mutilation
5.3.1 Proportion of women aged 20-24 years who were married or in a union before age 15 and before age 18
2 1 1
5.3.2 Proportion of girls and women aged 15-49 years who have undergone female genital mutilation/cutting, by age
2 1 1 1 1 1 1
5.4 Recognize and value unpaid care and domestic work through the provision of public services, infrastructure and social protection policies and the promotion of shared responsibility within the household and the family as nationally appropriate
5.4.1 Proportion of time spent on unpaid domestic and care work, by sex, age and location
2
5.5 Ensure women’s full and effective participation and equal opportuni-ties for leadership at all levels of decision-making in political, economic and public life
5.5.1 Proportion of seats held by women in (a) national parliaments and (b) local governments
1,3
5.5.2 Proportion of women in managerial positions 1
5.6 Ensure universal access to sexual and reproductive health and repro-ductive rights as agreed in accordance with the Programme of Action of the International Conference on Population and Development and the Beijing Platform for Action and the outcome documents of their review conferences
5.6.1 Proportion of women aged 15-49 years who make their own informed decisions regarding sexual relations, contraceptive use and reproductive health care
2
5.6.2 Number of countries with laws and regulations that guarantee full and equal access to women and men aged 15 years and older to sexual and reproductive health care, information and education
3

InnovatIve BIg Data approaches for capturIng anD analyzIng Data to MonItor anD achIeve the sDgs
115
Goals and targets Indicators Tier T cov T exh T sen T con T AI I cov I exh I sen I con
5.a Undertake reforms to give women equal rights to economic resourc-es, as well as access to ownership and control over land and other forms of property, financial services, inheritance and natural resources, in accordance with national laws
5.a.1 (a) Proportion of total agricultural population with ownership or secure rights over agricultural land, by sex; and (b) share of women among owners or rights-bearers of agricultural land, by type of tenure
2
5.a.2 Proportion of countries where the legal framework (including custom-ary law) guarantees women’s equal rights to land ownership and/or control
3 1 1
5.b Enhance the use of enabling technology, in particular information and communications technology, to promote the empowerment of women
5.b.1 Proportion of individuals who own a mobile telephone, by sex 1
5.c Adopt and strengthen sound policies and enforceable legislation for the promotion of gender equality and the empowerment of all women and girls at all levels
5.c.1 Proportion of countries with systems to track and make public alloca-tions for gender equality and women’s empowerment
3
Goal 6. Ensure availability and sustainable management of water and sanitation for all
6.1 By 2030, achieve universal and equitable access to safe and afford-able drinking water for all
6.1.1 Proportion of population using safely managed drinking water services 1 1 1
6.2 By 2030, achieve access to adequate and equitable sanitation and hygiene for all and end open defecation, paying special attention to the needs of women and girls and those in vulnerable situations
6.2.1 Proportion of population using safely managed sanitation services, including a hand-washing facility with soap and water
1 1 1
6.3 By 2030, improve water quality by reducing pollution, eliminating dumping and minimizing release of hazardous chemicals and materi-als, halving the proportion of untreated wastewater and substantially increasing recycling and safe reuse globally
6.3.1 Proportion of wastewater safely treated 2
6.3.2 Proportion of bodies of water with good ambient water quality 3 1 1 1 1
6.4 By 2030, substantially increase water-use efficiency across all sectors and ensure sustainable withdrawals and supply of freshwater to address water scarcity and substantially reduce the number of people suffering from water scarcity
6.4.1 Change in water-use efficiency over time 3 1 1
6.4.2 Level of water stress: freshwater withdrawal as a proportion of available freshwater resources
2 1 1 1 1
6.5 By 2030, implement integrated water resources management at all levels, including through transboundary cooperation as appropriate
6.5.1 Degree of integrated water resources management implementation (0-100)
2
6.5.2 Proportion of transboundary basin area with an operational arrange-ment for water cooperation
2
6.6 By 2020, protect and restore water-related ecosystems, including mountains, forests, wetlands, rivers, aquifers and lakes
6.6.1 Change in the extent of water-related ecosystems over time 3 1 1 1 1

InnovatIve BIg Data approaches for capturIng anD analyzIng Data to MonItor anD achIeve the sDgs
116
Goals and targets Indicators Tier T cov T exh T sen T con T AI I cov I exh I sen I con
6.a By 2030, expand international cooperation and capacity-building support to developing countries in water- and sanitation-related activ-ities and programmes, including water harvesting, desalination, water efficiency, wastewater treatment, recycling and reuse technologies
6.a.1 Amount of water- and sanitation-related official development assis-tance that is part of a government-coordinated spending plan
1
6.b Support and strengthen the participation of local communities in improving water and sanitation management
6.b.1 Proportion of local administrative units with established and operation-al policies and procedures for participation of local communities in water and sanitation management
1
Goal 7. Ensure access to affordable, reliable, sustainable and modern energy for all
7.1 By 2030, ensure universal access to affordable, reliable and modern energy services
7.1.1 Proportion of population with access to electricity 1 1 1
7.1.2 Proportion of population with primary reliance on clean fuels and technology
1 1 1 1
7.2 By 2030, increase substantially the share of renewable energy in the global energy mix
7.2.1 Renewable energy share in the total final energy consumption 1 1 1
7.3 By 2030, double the global rate of improvement in energy efficiency 7.3.1 Energy intensity measured in terms of primary energy and GDP 1 1 1
7.a By 2030, enhance international cooperation to facilitate access to clean energy research and technology, including renewable energy, energy efficiency and advanced and cleaner fossil-fuel technology, and promote investment in energy infrastructure and clean energy technol-ogy
7.a.1 International financial flows to developing countries in support of clean energy research and development and renewable energy production, including in hybrid systems
3
7.b By 2030, expand infrastructure and upgrade technology for sup-plying modern and sustainable energy services for all in developing countries, in particular least developed countries, small island devel-oping States and landlocked developing countries, in accordance with their respective programmes of support
7.b.1 Investments in energy efficiency as a proportion of GDP and the amount of foreign direct investment in financial transfer for infrastructure and technology to sustainable development services
3
Goal 8. Promote sustained, inclusive and sustainable economic growth, full and productive employment and decent work for all
8.1 Sustain per capita economic growth in accordance with national circumstances and, in particular, at least 7 per cent gross domestic prod-uct growth per annum in the least developed countries
8.1.1 Annual growth rate of real GDP per capita 1 1 1
8.2 Achieve higher levels of economic productivity through diversifi-cation, technological upgrading and innovation, including through a focus on high-value added and labour-intensive sectors
8.2.1 Annual growth rate of real GDP per employed person 1

InnovatIve BIg Data approaches for capturIng anD analyzIng Data to MonItor anD achIeve the sDgs
117
Goals and targets Indicators Tier T cov T exh T sen T con T AI I cov I exh I sen I con
8.3 Promote development-oriented policies that support productive activities, decent job creation, entrepreneurship, creativity and inno-vation, and encourage the formalization and growth of micro-, small- and medium-sized enterprises, including through access to financial services
8.3.1 Proportion of informal employment in non-agriculture employment, by sex
2
8.4 Improve progressively, through 2030, global resource efficiency in consumption and production and endeavour to decouple economic growth from environmental degradation, in accordance with the 10-Year Framework of Programmes on Sustainable Consumption and Production, with developed countries taking the lead
8.4.1 Material footprint, material footprint per capita, and material footprint per GDP
3
8.4.2 Domestic material consumption, domestic material consumption per capita, and domestic material consumption per GDP
2
8.5 By 2030, achieve full and productive employment and decent work for all women and men, including for young people and persons with disabilities, and equal pay for work of equal value
8.5.1 Average hourly earnings of female and male employees, by occupa-tion, age and persons with disabilities
2
8.5.2 Unemployment rate, by sex, age and persons with disabilities 1 1 1 1
8.6 By 2020, substantially reduce the proportion of youth not in employ-ment, education or training
8.6.1 Proportion of youth (aged 15-24 years) not in education, employment or training
1
8.7 Take immediate and effective measures to eradicate forced labour, end modern slavery and human trafficking and secure the prohibition and elimination of the worst forms of child labour, including recruit-ment and use of child soldiers, and by 2025 end child labour in all its forms
8.7.1 Proportion and number of children aged 5-17 years engaged in child labour, by sex and age
1 1 1 1 1 1 1
8.8 Protect labour rights and promote safe and secure working environ-ments for all workers, including migrant workers, in particular women migrants, and those in precarious employment
8.8.1 Frequency rates of fatal and non-fatal occupational injuries, by sex and migrant status
1
8.8.2 Level of national compliance of labour rights (freedom of association and collective bargaining) based on International Labour Organization (ILO) textual sources and national legislation, by sex and migrant status
3 1 1
8.9 By 2030, devise and implement policies to promote sustainable tourism that creates jobs and promotes local culture and products
8.9.1 Tourism direct GDP as a proportion of total GDP and in growth rate 2
8.9.2 Proportion of jobs in sustainable tourism industries out of total tourism jobs
3
8.10 Strengthen the capacity of domestic financial institutions to en-courage and expand access to banking, insurance and financial services for all
8.10.1 (a) Number of commercial bank branches per 100,000 adults and (b) number of automated teller machines (ATMs) per 100,000 adults
1
8.10.2 Proportion of adults (15 years and older) with an account at a bank or other financial institution or with a mobile-money-service provider
1 1 1 1

InnovatIve BIg Data approaches for capturIng anD analyzIng Data to MonItor anD achIeve the sDgs
118
Goals and targets Indicators Tier T cov T exh T sen T con T AI I cov I exh I sen I con
8.a Increase Aid for Trade support for developing countries, in particular least developed countries, including through the Enhanced Integrated Framework for Trade-related Technical Assistance to Least Developed Countries
8.a.1 Aid for Trade commitments and disbursements 1
8.b By 2020, develop and operationalize a global strategy for youth employment and implement the Global Jobs Pact of the International Labour Organization
8.b.1 Existence of a developed and operationalized national strategy for youth employment, as a distinct strategy or as part of a national employ-ment strategy
3
Goal 9. Build resilient infrastructure, promote inclusive and sustainable industrialization and foster innovation
9.1 Develop quality, reliable, sustainable and resilient infrastructure, including regional and trans-border infrastructure, to support economic development and human well-being, with a focus on affordable and equitable access for all
9.1.1 Proportion of the rural population who live within 2 km of an all-season road
3 1 1
9.1.2 Passenger and freight volumes, by mode of transport 1 1 1 1
9.2 Promote inclusive and sustainable industrialization and, by 2030, significantly raise industry’s share of employment and gross domestic product, in line with national circumstances, and double its share in least developed countries
9.2.1 Manufacturing value added as a proportion of GDP and per capita 1
9.2.2 Manufacturing employment as a proportion of total employment 1
9.3 Increase the access of small-scale industrial and other enterprises, in particular in developing countries, to financial services, including affordable credit, and their integration into value chains and markets
9.3.1 Proportion of small-scale industries in total industry value added 3
9.3.2 Proportion of small-scale industries with a loan or line of credit 3 1 1
9.4 By 2030, upgrade infrastructure and retrofit industries to make them sustainable, with increased resource-use efficiency and greater adoption of clean and environmentally sound technologies and indus-trial processes, with all countries taking action in accordance with their respective capabilities
9.4.1 CO2 emission per unit of value added 1
9.5 Enhance scientific research, upgrade the technological capabilities of industrial sectors in all countries, in particular developing countries, including, by 2030, encouraging innovation and substantially increasing the number of research and development workers per 1 million people and public and private research and development spending
9.5.1 Research and development expenditure as a proportion of GDP 1
9.5.2 Researchers (in full-time equivalent) per million inhabitants 1
9.a Facilitate sustainable and resilient infrastructure development in developing countries through enhanced financial, technological and technical support to African countries, least developed countries, land-locked developing countries and small island developing States
9.a.1 Total official international support (official development assistance plus other official flows) to infrastructure
1

InnovatIve BIg Data approaches for capturIng anD analyzIng Data to MonItor anD achIeve the sDgs
119
Goals and targets Indicators Tier T cov T exh T sen T con T AI I cov I exh I sen I con
9.b Support domestic technology development, research and innova-tion in developing countries, including by ensuring a conducive policy environment for, inter alia, industrial diversification and value addition to commodities
9.b.1 Proportion of medium and high-tech industry value added in total value added
2
9.c Significantly increase access to information and communications technology and strive to provide universal and affordable access to the Internet in least developed countries by 2020
9.c.1 Proportion of population covered by a mobile network, by technology 1
Goal 10. Reduce inequality within and among countries
10.1 By 2030, progressively achieve and sustain income growth of the bottom 40 per cent of the population at a rate higher than the national average
10.1.1 Growth rates of household expenditure or income per capita among the bottom 40 per cent of the population and the total population
1
10.2 By 2030, empower and promote the social, economic and political inclusion of all, irrespective of age, sex, disability, race, ethnicity, origin, religion or economic or other status
10.2.1 Proportion of people living below 50 per cent of median income, by sex, age and persons with disabilities
3 1 1 1 1
10.3 Ensure equal opportunity and reduce inequalities of outcome, including by eliminating discriminatory laws, policies and practices and promoting appropriate legislation, policies and action in this regard
10.3.1 Proportion of population reporting having personally felt discriminat-ed against or harassed in the previous 12 months on the basis of a ground of discrimination prohibited under international human rights law
3
10.4 Adopt policies, especially fiscal, wage and social protection policies, and progressively achieve greater equality
10.4.1 Labour share of GDP, comprising wages and social protection trans-fers
1
10.5 Improve the regulation and monitoring of global financial markets and institutions and strengthen the implementation of such regulations
10.5.1 Financial Soundness Indicators 3
10.6 Ensure enhanced representation and voice for developing coun-tries in decision-making in global international economic and financial institutions in order to deliver more effective, credible, accountable and legitimate institutions
10.6.1 Proportion of members and voting rights of developing countries in international organizations
1
10.7 Facilitate orderly, safe, regular and responsible migration and mobility of people, including through the implementation of planned and well-managed migration policies
10.7.1 Recruitment cost borne by employee as a proportion of yearly income earned in country of destination
3
10.7.2 Number of countries that have implemented well-managed migra-tion policies
3 1 1 1
10.a Implement the principle of special and differential treatment for developing countries, in particular least developed countries, in accor-dance with World Trade Organization agreements
10.a.1 Proportion of tariff lines applied to imports from least developed countries and developing countries with zero-tariff
1

InnovatIve BIg Data approaches for capturIng anD analyzIng Data to MonItor anD achIeve the sDgs
120
Goals and targets Indicators Tier T cov T exh T sen T con T AI I cov I exh I sen I con
10.b Encourage official development assistance and financial flows, in-cluding foreign direct investment, to States where the need is greatest, in particular least developed countries, African countries, small island developing States and landlocked developing countries, in accordance with their national plans and programmes
10.b.1 Total resource flows for development, by recipient and donor coun-tries and type of flow (e.g. official development assistance, foreign direct investment and other flows)
1,2
10.c By 2030, reduce to less than 3 per cent the transaction costs of mi-grant remittances and eliminate remittance corridors with costs higher than 5 per cent
10.c.1 Remittance costs as a proportion of the amount remitted 3
Goal 11. Make cities and human settlements inclusive, safe, resilient and sustainable
11.1 By 2030, ensure access for all to adequate, safe and affordable housing and basic services and upgrade slums
11.1.1 Proportion of urban population living in slums, informal settlements or inadequate housing
1 1 1
11.2 By 2030, provide access to safe, affordable, accessible and sus-tainable transport systems for all, improving road safety, notably by expanding public transport, with special attention to the needs of those in vulnerable situations, women, children, persons with disabilities and older persons
11.2.1 Proportion of population that has convenient access to public trans-port, by sex, age and persons with disabilities
2 1 1 1 1 1 1 1
11.3 By 2030, enhance inclusive and sustainable urbanization and capacity for participatory, integrated and sustainable human settlement planning and management in all countries
11.3.1 Ratio of land consumption rate to population growth rate 2 1 1
11.3.2 Proportion of cities with a direct participation structure of civil society in urban planning and management that operate regularly and democrati-cally
3 1 1
11.4 Strengthen efforts to protect and safeguard the world’s cultural and natural heritage
11.4.1 Total expenditure (public and private) per capita spent on the pres-ervation, protection and conservation of all cultural and natural heritage, by type of heritage (cultural, natural, mixed and World Heritage Centre designation), level of government (national, regional and local/municipal), type of expenditure (operating expenditure/investment) and type of private funding (donations in kind, private non-profit sector and sponsorship)
3 1 1
11.5 By 2030, significantly reduce the number of deaths and the num-ber of people affected and substantially decrease the direct economic losses relative to global gross domestic product caused by disasters, including water-related disasters, with a focus on protecting the poor and people in vulnerable situations
11.5.1 Number of deaths, missing persons and directly affected persons attributed to disasters per 100,000 population
2
11.5.2 Direct economic loss in relation to global GDP, damage to critical infrastructure and number of disruptions to basic services, attributed to disasters
2 1 1 1 1 1 1

InnovatIve BIg Data approaches for capturIng anD analyzIng Data to MonItor anD achIeve the sDgs
121
Goals and targets Indicators Tier T cov T exh T sen T con T AI I cov I exh I sen I con
11.6 By 2030, reduce the adverse per capita environmental impact of cities, including by paying special attention to air quality and municipal and other waste management
11.6.1 Proportion of urban solid waste regularly collected and with adequate final discharge out of total urban solid waste generated, by cities
2
11.6.2 Annual mean levels of fine particulate matter (e.g. PM2.5 and PM10) in cities (population weighted)
1 1 1
11.7 By 2030, provide universal access to safe, inclusive and accessible, green and public spaces, in particular for women and children, older persons and persons with disabilities
11.7.1 Average share of the built-up area of cities that is open space for public use for all, by sex, age and persons with disabilities
3
11.7.2 Proportion of persons victim of physical or sexual harassment, by sex, age, disability status and place of occurrence, in the previous 12 months
3 1 1 1 1 1 1
11.a Support positive economic, social and environmental links be-tween urban, peri-urban and rural areas by strengthening national and regional development planning
11.a.1 Proportion of population living in cities that implement urban and re-gional development plans integrating population projections and resource needs, by size of city
3
11.b By 2020, substantially increase the number of cities and human settlements adopting and implementing integrated policies and plans towards inclusion, resource efficiency, mitigation and adaptation to climate change, resilience to disasters, and develop and implement, in line with the Sendai Framework for Disaster Risk Reduction 2015-2030, holistic disaster risk management at all levels
11.b.1 Number of countries that adopt and implement national disaster risk reduction strategies in line with the Sendai Framework for Disaster Risk Reduction 2015-2030
2
11.b.2 Proportion of local governments that adopt and implement local disaster risk reduction strategies in line with national disaster risk reduction strategies
3
11.c Support least developed countries, including through financial and technical assistance, in building sustainable and resilient buildings utilizing local materials
11.c.1 Proportion of financial support to the least developed countries that is allocated to the construction and retrofitting of sustainable, resilient and resource-efficient buildings utilizing local materials
3
Goal 12. Ensure sustainable consumption and production patterns
12.1 Implement the 10-Year Framework of Programmes on Sustainable Consumption and Production Patterns, all countries taking action, with developed countries taking the lead, taking into account the develop-ment and capabilities of developing countries
12.1.1 Number of countries with sustainable consumption and production (SCP) national action plans or SCP mainstreamed as a priority or a target into national policies
3
12.2 By 2030, achieve the sustainable management and efficient use of natural resources
12.2.1 Material footprint, material footprint per capita, and material footprint per GDP
3
12.2.2 Domestic material consumption, domestic material consumption per capita, and domestic material consumption per GDP
2

InnovatIve BIg Data approaches for capturIng anD analyzIng Data to MonItor anD achIeve the sDgs
122
Goals and targets Indicators Tier T cov T exh T sen T con T AI I cov I exh I sen I con
12.3 By 2030, halve per capita global food waste at the retail and consumer levels and reduce food losses along production and supply chains, including post-harvest losses
12.3.1 Global food loss index 3 1 1 1 1
12.4 By 2020, achieve the environmentally sound management of chemicals and all wastes throughout their life cycle, in accordance with agreed international frameworks, and significantly reduce their release to air, water and soil in order to minimize their adverse impacts on human health and the environment
12.4.1 Number of parties to international multilateral environmental agreements on hazardous waste, and other chemicals that meet their com-mitments and obligations in transmitting information as required by each relevant agreement
1
12.4.2 Hazardous waste generated per capita and proportion of hazardous waste treated, by type of treatment
3
12.5 By 2030, substantially reduce waste generation through preven-tion, reduction, recycling and reuse
12.5.1 National recycling rate, tons of material recycled 3 1 1 1
12.6 Encourage companies, especially large and transnational com-panies, to adopt sustainable practices and to integrate sustainability information into their reporting cycle
12.6.1 Number of companies publishing sustainability reports 3
12.7 Promote public procurement practices that are sustainable, in accordance with national policies and priorities
12.7.1 Number of countries implementing sustainable public procurement policies and action plans
3
12.8 By 2030, ensure that people everywhere have the relevant infor-mation and awareness for sustainable development and lifestyles in harmony with nature
12.8.1 Extent to which (i) global citizenship education and (ii) education for sustainable development (including climate change education) are mainstreamed in (a) national education policies; (b) curricula; (c) teacher education; and (d) student assessment
3
12.a Support developing countries to strengthen their scientific and technological capacity to move towards more sustainable patterns of consumption and production
12.a.1 Amount of support to developing countries on research and devel-opment for sustainable consumption and production and environmentally sound technologies
3
12.b Develop and implement tools to monitor sustainable development impacts for sustainable tourism that creates jobs and promotes local culture and products
12.b.1 Number of sustainable tourism strategies or policies and implement-ed action plans with agreed monitoring and evaluation tools
3
12.c Rationalize inefficient fossil-fuel subsidies that encourage wasteful consumption by removing market distortions, in accordance with national circumstances, including by restructuring taxation and phasing out those harmful subsidies, where they exist, to reflect their envi-ronmental impacts, taking fully into account the specific needs and con-ditions of developing countries and minimizing the possible adverse impacts on their development in a manner that protects the poor and the affected communities
12.c.1 Amount of fossil-fuel subsidies per unit of GDP (production and con-sumption) and as a proportion of total national expenditure on fossil fuels
3
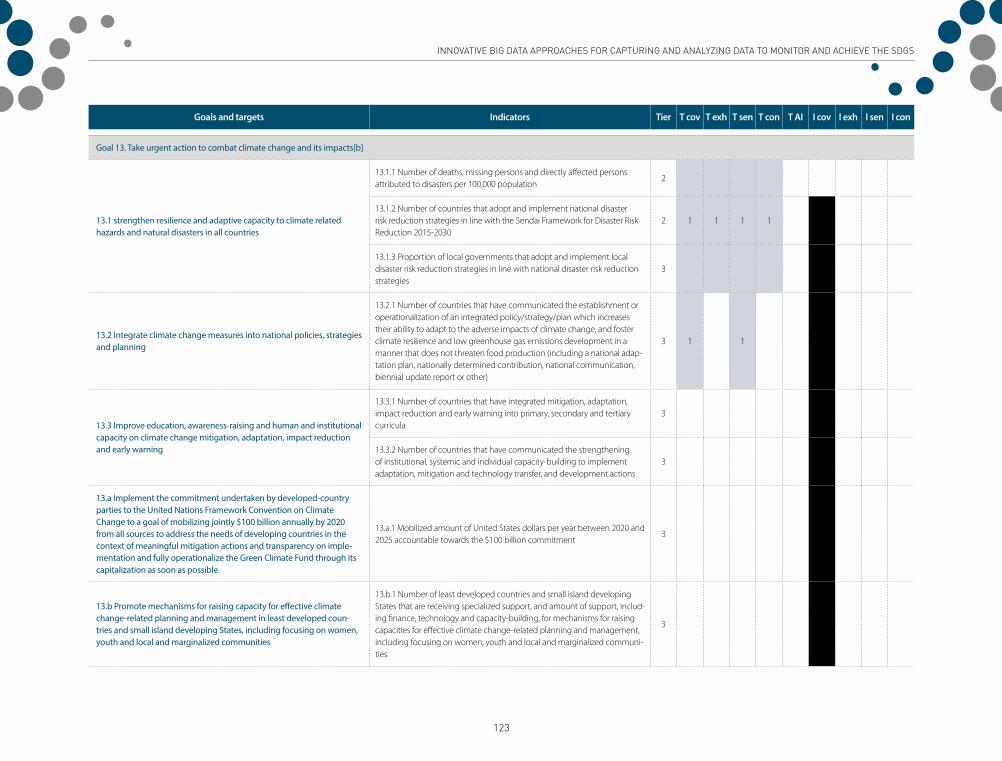
InnovatIve BIg Data approaches for capturIng anD analyzIng Data to MonItor anD achIeve the sDgs
123
Goals and targets Indicators Tier T cov T exh T sen T con T AI I cov I exh I sen I con
Goal 13. Take urgent action to combat climate change and its impacts[b]
13.1 strengthen resilience and adaptive capacity to climate related hazards and natural disasters in all countries
13.1.1 Number of deaths, missing persons and directly affected persons attributed to disasters per 100,000 population
2
13.1.2 Number of countries that adopt and implement national disaster risk reduction strategies in line with the Sendai Framework for Disaster Risk Reduction 2015-2030
2 1 1 1 1
13.1.3 Proportion of local governments that adopt and implement local disaster risk reduction strategies in line with national disaster risk reduction strategies
3
13.2 Integrate climate change measures into national policies, strategies and planning
13.2.1 Number of countries that have communicated the establishment or operationalization of an integrated policy/strategy/plan which increases their ability to adapt to the adverse impacts of climate change, and foster climate resilience and low greenhouse gas emissions development in a manner that does not threaten food production (including a national adap-tation plan, nationally determined contribution, national communication, biennial update report or other)
3 1 1
13.3 Improve education, awareness-raising and human and institutional capacity on climate change mitigation, adaptation, impact reduction and early warning
13.3.1 Number of countries that have integrated mitigation, adaptation, impact reduction and early warning into primary, secondary and tertiary curricula
3
13.3.2 Number of countries that have communicated the strengthening of institutional, systemic and individual capacity-building to implement adaptation, mitigation and technology transfer, and development actions
3
13.a Implement the commitment undertaken by developed-country parties to the United Nations Framework Convention on Climate Change to a goal of mobilizing jointly $100 billion annually by 2020 from all sources to address the needs of developing countries in the context of meaningful mitigation actions and transparency on imple-mentation and fully operationalize the Green Climate Fund through its capitalization as soon as possible
13.a.1 Mobilized amount of United States dollars per year between 2020 and 2025 accountable towards the $100 billion commitment
3
13.b Promote mechanisms for raising capacity for effective climate change-related planning and management in least developed coun-tries and small island developing States, including focusing on women, youth and local and marginalized communities
13.b.1 Number of least developed countries and small island developing States that are receiving specialized support, and amount of support, includ-ing finance, technology and capacity-building, for mechanisms for raising capacities for effective climate change-related planning and management, including focusing on women, youth and local and marginalized communi-ties
3

InnovatIve BIg Data approaches for capturIng anD analyzIng Data to MonItor anD achIeve the sDgs
124
Goals and targets Indicators Tier T cov T exh T sen T con T AI I cov I exh I sen I con
Goal 14. Conserve and sustainably use the oceans, seas and marine resources for sustainable development
14.1 By 2025, prevent and significantly reduce marine pollution of all kinds, in particular from land-based activities, including marine debris and nutrient pollution
14.1.1 Index of coastal eutrophication and floating plastic debris density 3 1 1 1 1 1 1
14.2 By 2020, sustainably manage and protect marine and coastal ecosystems to avoid significant adverse impacts, including by strength-ening their resilience, and take action for their restoration in order to achieve healthy and productive oceans
14.2.1 Proportion of national exclusive economic zones managed using ecosystem-based approaches
3
14.3 Minimize and address the impacts of ocean acidification, including through enhanced scientific cooperation at all levels
14.3.1 Average marine acidity (pH) measured at agreed suite of representa-tive sampling stations
3 1 1
14.4 By 2020, effectively regulate harvesting and end overfishing, illegal, unreported and unregulated fishing and destructive fishing practices and implement science-based management plans, in order to restore fish stocks in the shortest time feasible, at least to levels that can produce maximum sustainable yield as determined by their biological characteristics
14.4.1 Proportion of fish stocks within biologically sustainable levels 1 1 1
14.5 By 2020, conserve at least 10 per cent of coastal and marine areas, consistent with national and international law and based on the best available scientific information
14.5.1 Coverage of protected areas in relation to marine areas 1
14.6 By 2020, prohibit certain forms of fisheries subsidies which contrib-ute to overcapacity and overfishing, eliminate subsidies that contribute to illegal, unreported and unregulated fishing and refrain from intro-ducing new such subsidies, recognizing that appropriate and effective special and differential treatment for developing and least developed countries should be an integral part of the World Trade Organization fisheries subsidies negotiation[c]
14.6.1 Progress by countries in the degree of implementation of internation-al instruments aiming to combat illegal, unreported and unregulated fishing
3 1 1
14.7 By 2030, increase the economic benefits to small island developing States and least developed countries from the sustainable use of marine resources, including through sustainable management of fisheries, aquaculture and tourism
14.7.1 Sustainable fisheries as a proportion of GDP in small island develop-ing States, least developed countries and all countries
3
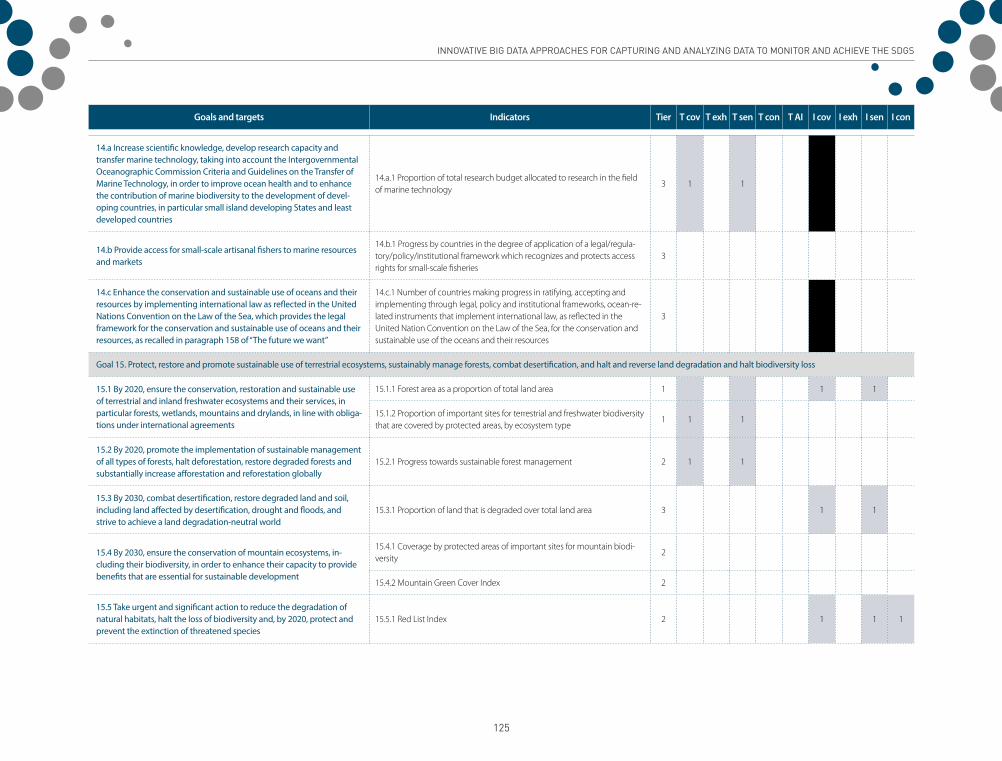
InnovatIve BIg Data approaches for capturIng anD analyzIng Data to MonItor anD achIeve the sDgs
125
Goals and targets Indicators Tier T cov T exh T sen T con T AI I cov I exh I sen I con
14.a Increase scientific knowledge, develop research capacity and transfer marine technology, taking into account the Intergovernmental Oceanographic Commission Criteria and Guidelines on the Transfer of Marine Technology, in order to improve ocean health and to enhance the contribution of marine biodiversity to the development of devel-oping countries, in particular small island developing States and least developed countries
14.a.1 Proportion of total research budget allocated to research in the field of marine technology
3 1 1
14.b Provide access for small-scale artisanal fishers to marine resources and markets
14.b.1 Progress by countries in the degree of application of a legal/regula-tory/policy/institutional framework which recognizes and protects access rights for small-scale fisheries
3
14.c Enhance the conservation and sustainable use of oceans and their resources by implementing international law as reflected in the United Nations Convention on the Law of the Sea, which provides the legal framework for the conservation and sustainable use of oceans and their resources, as recalled in paragraph 158 of “The future we want”
14.c.1 Number of countries making progress in ratifying, accepting and implementing through legal, policy and institutional frameworks, ocean-re-lated instruments that implement international law, as reflected in the United Nation Convention on the Law of the Sea, for the conservation and sustainable use of the oceans and their resources
3
Goal 15. Protect, restore and promote sustainable use of terrestrial ecosystems, sustainably manage forests, combat desertification, and halt and reverse land degradation and halt biodiversity loss
15.1 By 2020, ensure the conservation, restoration and sustainable use of terrestrial and inland freshwater ecosystems and their services, in particular forests, wetlands, mountains and drylands, in line with obliga-tions under international agreements
15.1.1 Forest area as a proportion of total land area 1 1 1
15.1.2 Proportion of important sites for terrestrial and freshwater biodiversity that are covered by protected areas, by ecosystem type
1 1 1
15.2 By 2020, promote the implementation of sustainable management of all types of forests, halt deforestation, restore degraded forests and substantially increase afforestation and reforestation globally
15.2.1 Progress towards sustainable forest management 2 1 1
15.3 By 2030, combat desertification, restore degraded land and soil, including land affected by desertification, drought and floods, and strive to achieve a land degradation-neutral world
15.3.1 Proportion of land that is degraded over total land area 3 1 1
15.4 By 2030, ensure the conservation of mountain ecosystems, in-cluding their biodiversity, in order to enhance their capacity to provide benefits that are essential for sustainable development
15.4.1 Coverage by protected areas of important sites for mountain biodi-versity
2
15.4.2 Mountain Green Cover Index 2
15.5 Take urgent and significant action to reduce the degradation of natural habitats, halt the loss of biodiversity and, by 2020, protect and prevent the extinction of threatened species
15.5.1 Red List Index 2 1 1 1

InnovatIve BIg Data approaches for capturIng anD analyzIng Data to MonItor anD achIeve the sDgs
126
Goals and targets Indicators Tier T cov T exh T sen T con T AI I cov I exh I sen I con
15.6 Promote fair and equitable sharing of the benefits arising from the utilization of genetic resources and promote appropriate access to such resources, as internationally agreed
15.6.1 Number of countries that have adopted legislative, administrative and policy frameworks to ensure fair and equitable sharing of benefits
2
15.7 Take urgent action to end poaching and trafficking of protected species of flora and fauna and address both demand and supply of illegal wildlife products
15.7.1 Proportion of traded wildlife that was poached or illicitly trafficked 2 1 1
15.8 By 2020, introduce measures to prevent the introduction and sig-nificantly reduce the impact of invasive alien species on land and water ecosystems and control or eradicate the priority species
15.8.1 Proportion of countries adopting relevant national legislation and adequately resourcing the prevention or control of invasive alien species
3
15.9 By 2020, integrate ecosystem and biodiversity values into national and local planning, development processes, poverty reduction strate-gies and accounts
15.9.1 Progress towards national targets established in accordance with Aichi Biodiversity Target 2 of the Strategic Plan for Biodiversity 2011-2020
3
15.a Mobilize and significantly increase financial resources from all sources to conserve and sustainably use biodiversity and ecosystems
15.a.1 Official development assistance and public expenditure on conserva-tion and sustainable use of biodiversity and ecosystems
1,3
15.b Mobilize significant resources from all sources and at all levels to fi-nance sustainable forest management and provide adequate incentives to developing countries to advance such management, including for conservation and reforestation
15.b.1 Official development assistance and public expenditure on conserva-tion and sustainable use of biodiversity and ecosystems
1,3 1 1
15.c Enhance global support for efforts to combat poaching and trafficking of protected species, including by increasing the capacity of local communities to pursue sustainable livelihood opportunities
15.c.1 Proportion of traded wildlife that was poached or illicitly trafficked 2 1 1
Goal 16. Promote peaceful and inclusive societies for sustainable development, provide access to justice for all and build effective, accountable and inclusive institutions at all levels
16.1 Significantly reduce all forms of violence and related death rates everywhere
16.1.1 Number of victims of intentional homicide per 100,000 population, by sex and age
1
16.1.2 Conflict-related deaths per 100,000 population, by sex, age and cause 3
16.1.3 Proportion of population subjected to physical, psychological or sexu-al violence in the previous 12 months
2 1 1
16.1.4 Proportion of population that feel safe walking alone around the area they live
2 1 1 1 1

InnovatIve BIg Data approaches for capturIng anD analyzIng Data to MonItor anD achIeve the sDgs
127
Goals and targets Indicators Tier T cov T exh T sen T con T AI I cov I exh I sen I con
16.2 End abuse, exploitation, trafficking and all forms of violence against and torture of children
16.2.1 Proportion of children aged 1-17 years who experienced any physical punishment and/or psychological aggression by caregivers in the past month
2
16.2.2 Number of victims of human trafficking per 100,000 population, by sex, age and form of exploitation
2
16.2.3 Proportion of young women and men aged 18-29 years who experi-enced sexual violence by age 18
2 1 1 1 1 1
16.3 Promote the rule of law at the national and international levels and ensure equal access to justice for all
16.3.1 Proportion of victims of violence in the previous 12 months who reported their victimization to competent authorities or other officially recognized conflict resolution mechanisms
2
16.3.2 Unsentenced detainees as a proportion of overall prison population 1 1 1
16.4 By 2030, significantly reduce illicit financial and arms flows, strengthen the recovery and return of stolen assets and combat all forms of organized crime
16.4.1 Total value of inward and outward illicit financial flows (in current United States dollars)
3
16.4.2 Proportion of seized, found or surrendered arms whose illicit origin or context has been traced or established by a competent authority in line with international instruments
3 1 1 1 1
16.5 Substantially reduce corruption and bribery in all their forms
16.5.1 Proportion of persons who had at least one contact with a public official and who paid a bribe to a public official, or were asked for a bribe by those public officials, during the previous 12 months
2 1 1
16.5.2 Proportion of businesses that had at least one contact with a public official and that paid a bribe to a public official, or were asked for a bribe by those public officials during the previous 12 months
2 1 1 1 1
16.6 Develop effective, accountable and transparent institutions at all levels
16.6.1 Primary government expenditures as a proportion of original ap-proved budget, by sector (or by budget codes or similar)
1
16.6.2 Proportion of population satisfied with their last experience of public services
3 1 1 1 1
16.7 Ensure responsive, inclusive, participatory and representative decision-making at all levels
16.7.1 Proportions of positions (by sex, age, persons with disabilities and population groups) in public institutions (national and local legislatures, public service, and judiciary) compared to national distributions
3
16.7.2 Proportion of population who believe decision-making is inclusive and responsive, by sex, age, disability and population group
3

InnovatIve BIg Data approaches for capturIng anD analyzIng Data to MonItor anD achIeve the sDgs
128
Goals and targets Indicators Tier T cov T exh T sen T con T AI I cov I exh I sen I con
16.8 Broaden and strengthen the participation of developing countries in the institutions of global governance
16.8.1 Proportion of members and voting rights of developing countries in international organizations
1
16.9 By 2030, provide legal identity for all, including birth registration16.9.1 Proportion of children under 5 years of age whose births have been registered with a civil authority, by age
1 1 1
16.10 Ensure public access to information and protect fundamental freedoms, in accordance with national legislation and international agreements
16.10.1 Number of verified cases of killing, kidnapping, enforced disappear-ance, arbitrary detention and torture of journalists, associated media person-nel, trade unionists and human rights advocates in the previous 12 months
3
16.10.2 Number of countries that adopt and implement constitutional, statutory and/or policy guarantees for public access to information
2
16.a Strengthen relevant national institutions, including through international cooperation, for building capacity at all levels, in particular in developing countries, to prevent violence and combat terrorism and crime
16.a.1 Existence of independent national human rights institutions in com-pliance with the Paris Principles
1 1 1 1 1
16.b Promote and enforce non-discriminatory laws and policies for sustainable development
16.b.1 Proportion of population reporting having personally felt discriminat-ed against or harassed in the previous 12 months on the basis of a ground of discrimination prohibited under international human rights law
3
Goal 17. Strengthen the means of implementation and revitalize the Global Partnership for Sustainable Development
Finance
17.1 Strengthen domestic resource mobilization, including through international support to developing countries, to improve domestic capacity for tax and other revenue collection
17.1.1 Total government revenue as a proportion of GDP, by source 1
17.1.2 Proportion of domestic budget funded by domestic taxes 1
17.2 Developed countries to implement fully their official development assistance commitments, including the commitment by many devel-oped countries to achieve the target of 0.7 per cent of gross national income for official development assistance (ODA/GNI) to developing countries and 0.15 to 0.20 per cent of ODA/GNI to least developed countries; ODA providers are encouraged to consider setting a target to provide at least 0.20 per cent of ODA/GNI to least developed countries
17.2.1 Net official development assistance, total and to least developed countries, as a proportion of the Organization for Economic Cooperation and Development (OECD) Development Assistance Committee donors’ gross national income (GNI)
1
17.3 Mobilize additional financial resources for developing countries from multiple sources
17.3.1 Foreign direct investments (FDI), official development assistance and South-South Cooperation as a proportion of total domestic budget
1
17.3.2 Volume of remittances (in United States dollars) as a proportion of total GDP
1

InnovatIve BIg Data approaches for capturIng anD analyzIng Data to MonItor anD achIeve the sDgs
129
Goals and targets Indicators Tier T cov T exh T sen T con T AI I cov I exh I sen I con
17.4 Assist developing countries in attaining long-term debt sustainabil-ity through coordinated policies aimed at fostering debt financing, debt relief and debt restructuring, as appropriate, and address the external debt of highly indebted poor countries to reduce debt distress
17.4.1 Debt service as a proportion of exports of goods and services 1
17.5 Adopt and implement investment promotion regimes for least developed countries
17.5.1 Number of countries that adopt and implement investment promo-tion regimes for least developed countries
3
Technology
17.6 Enhance North-South, South-South and triangular regional and international cooperation on and access to science, technology and innovation and enhance knowledge-sharing on mutually agreed terms, including through improved coordination among existing mechanisms, in particular at the United Nations level, and through a global technolo-gy facilitation mechanism
17.6.1 Number of science and/or technology cooperation agreements and programmes between countries, by type of cooperation
3
17.6.2 Fixed Internet broadband subscriptions per 100 inhabitants, by speed 1
17.7 Promote the development, transfer, dissemination and diffusion of environmentally sound technologies to developing countries on favourable terms, including on concessional and preferential terms, as mutually agreed
17.7.1 Total amount of approved funding for developing countries to promote the development, transfer, dissemination and diffusion of environ-mentally sound technologies
3
17.8 Fully operationalize the technology bank and science, technology and innovation capacity-building mechanism for least developed coun-tries by 2017 and enhance the use of enabling technology, in particular information and communications technology
17.8.1 Proportion of individuals using the Internet 1
Capacity-building
17.9 Enhance international support for implementing effective and targeted capacity-building in developing countries to support national plans to implement all the Sustainable Development Goals, including through North-South, South-South and triangular cooperation
17.9.1 Dollar value of financial and technical assistance (including through North-South, South-South and triangular cooperation) committed to devel-oping countries
1
Trade
17.10 Promote a universal, rules-based, open, non-discriminatory and equitable multilateral trading system under the World Trade Organiza-tion, including through the conclusion of negotiations under its Doha Development Agenda
17.10.1 Worldwide weighted tariff-average 1

InnovatIve BIg Data approaches for capturIng anD analyzIng Data to MonItor anD achIeve the sDgs
130
Goals and targets Indicators Tier T cov T exh T sen T con T AI I cov I exh I sen I con
17.11 Significantly increase the exports of developing countries, in particular with a view to doubling the least developed countries’ share of global exports by 2020
17.11.1 Developing countries’ and least developed countries’ share of global exports
1
17.12 Realize timely implementation of duty-free and quota-free market access on a lasting basis for all least developed countries, consistent with World Trade Organization decisions, including by ensuring that preferential rules of origin applicable to imports from least developed countries are transparent and simple, and contribute to facilitating market access
17.12.1 Average tariffs faced by developing countries, least developed coun-tries and small island developing States
1
Systemic issues
Policy and institutional coherence
17.13 Enhance global macroeconomic stability, including through policy coordination and policy coherence
17.13.1 Macroeconomic Dashboard 3
17.14 Enhance policy coherence for sustainable development17.14.1 Number of countries with mechanisms in place to enhance policy coherence of sustainable development
3
17.15 Respect each country’s policy space and leadership to establish and implement policies for poverty eradication and sustainable devel-opment
17.15.1 Extent of use of country-owned results frameworks and planning tools by providers of development cooperation
2
Multi-stakeholder partnerships
17.16 Enhance the Global Partnership for Sustainable Development, complemented by multi-stakeholder partnerships that mobilize and share knowledge, expertise, technology and financial resources, to support the achievement of the Sustainable Development Goals in all countries, in particular developing countries
17.16.1 Number of countries reporting progress in multi-stakeholder devel-opment effectiveness monitoring frameworks that support the achieve-ment of the sustainable development goals
2
17.17 Encourage and promote effective public, public-private and civil society partnerships, building on the experience and resourcing strate-gies of partnerships
17.17.1 Amount of United States dollars committed to public-private and civil society partnerships
3
Data, monitoring and accountability
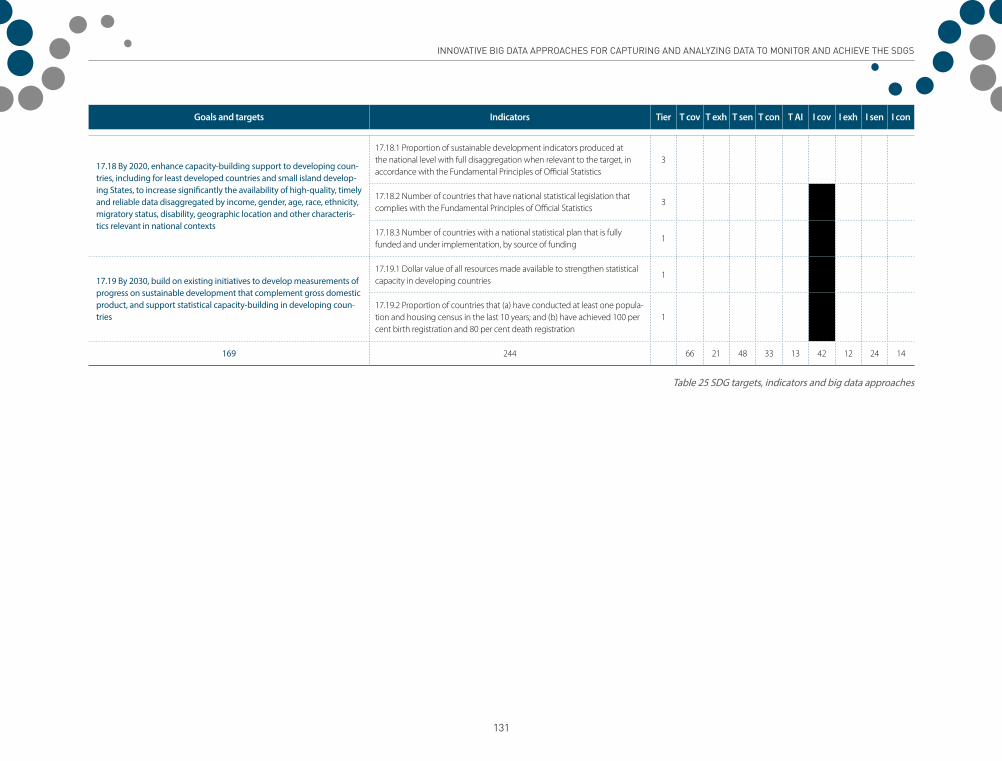
InnovatIve BIg Data approaches for capturIng anD analyzIng Data to MonItor anD achIeve the sDgs
131
Goals and targets Indicators Tier T cov T exh T sen T con T AI I cov I exh I sen I con
17.18 By 2020, enhance capacity-building support to developing coun-tries, including for least developed countries and small island develop-ing States, to increase significantly the availability of high-quality, timely and reliable data disaggregated by income, gender, age, race, ethnicity, migratory status, disability, geographic location and other characteris-tics relevant in national contexts
17.18.1 Proportion of sustainable development indicators produced at the national level with full disaggregation when relevant to the target, in accordance with the Fundamental Principles of Official Statistics
3
17.18.2 Number of countries that have national statistical legislation that complies with the Fundamental Principles of Official Statistics
3
17.18.3 Number of countries with a national statistical plan that is fully funded and under implementation, by source of funding
1
17.19 By 2030, build on existing initiatives to develop measurements of progress on sustainable development that complement gross domestic product, and support statistical capacity-building in developing coun-tries
17.19.1 Dollar value of all resources made available to strengthen statistical capacity in developing countries
1
17.19.2 Proportion of countries that (a) have conducted at least one popula-tion and housing census in the last 10 years; and (b) have achieved 100 per cent birth registration and 80 per cent death registration
1
169 244 66 21 48 33 13 42 12 24 14
Table 25 SDG targets, indicators and big data approaches

InnovatIve BIg Data approaches for capturIng anD analyzIng Data to MonItor anD achIeve the sDgs
132

InnovatIve BIg Data approaches for capturIng anD analyzIng Data to MonItor anD achIeve the sDgs
133
InnovatIve BIg Data approaches for capturIng anD analyzIng Data to MonItor anD achIeve the sDgs
134

InnovatIve BIg Data approaches for capturIng anD analyzIng Data to MonItor anD achIeve the sDgs
135

InnovatIve BIg Data approaches for capturIng anD analyzIng Data to MonItor anD achIeve the sDgs
136

InnovatIve BIg Data approaches for capturIng anD analyzIng Data to MonItor anD achIeve the sDgs
137