Innovative Assignment Process for a Statewide...
22
1 Innovative Assignment Process for a Statewide Model William G. Allen, Jr., PE TRB Innovations in Travel Modeling Conference Atlanta June 2018
Transcript of Innovative Assignment Process for a Statewide...

1
Innovative Assignment Process for a Statewide Model
William G. Allen, Jr., PE
TRB Innovations in Travel Modeling Conference
Atlanta
June 2018

2
New Statewide Travel Model for Kansas
Conventional four-step model Estimates weekday travel by four periods on all roads of Collector and
above Short- and long-distance travel by auto, transit, air Integrated goods movement model by truck and rail
Medium truck, heavy truck, light-duty commercial
Calibrated using recent observed travel data Includes user-friendly application package and documentation Uses the Cube software platform

3
What Makes It So Special?
Unique static assignment approach, combining Stochastic assignment Capacity-restraint with fixed iterations and weights Embedded toll diversion model
Probably the first time these techniques have been combined

4
Key Motivations
No prior statewide model existed Not a lot of congestion Keen interest in goods movement Major output: effect of economic growth, other factors on toll revenue Kansas Turnpike Authority was major project sponsor

5
Calibration Data
2009 Nationwide Household Travel Survey data Kansas: not enough records (189 HH) West North Central US: 5,758 HHs Iowa, Kansas, Missouri, Minnesota, North Dakota, Nebraska, South Dakota
Observed vehicle trips derived from cell phone signals AirSage nationwide tables by purpose, resident/non-resident Spring 2016
National freight databases Transearch (IHS Markit) Freight Analysis Framework (FAF4)
Traffic counts in Kansas Weekday (3,596 links) Hourly classification counts (642 links)
6
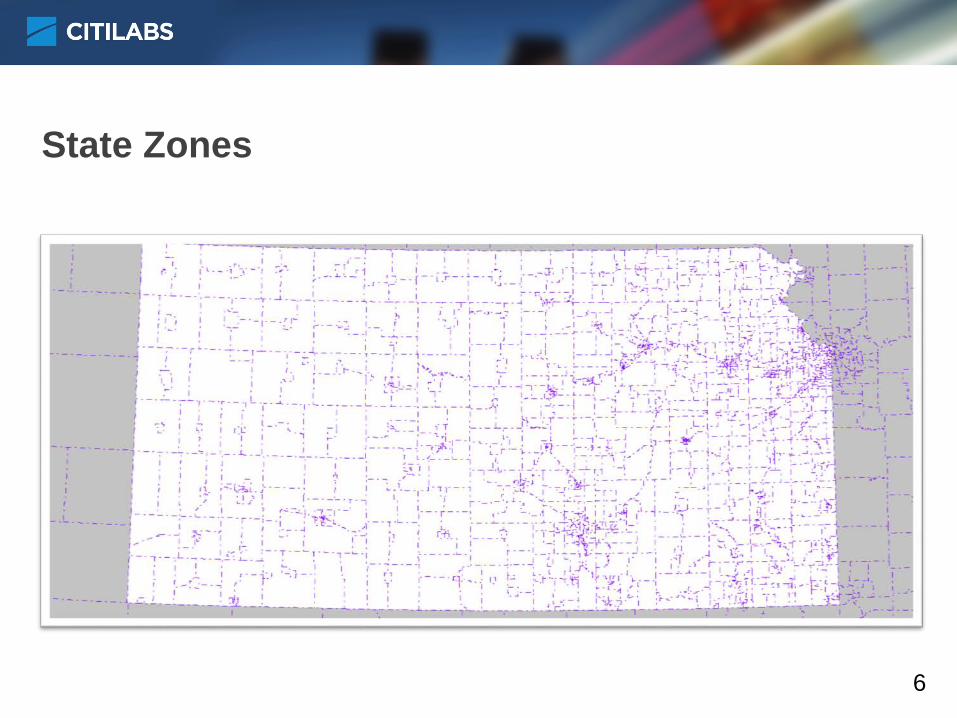
State Zones

7
External Zones

8
Person Travel Model
Standard four-step 1,258 zones in Kansas, 615 in “halo” area, 48 in rest of US Purposes: work, school, university, shop, other, NHB work, NHB other,
long-distance business, long-distance personal, light-duty commercial, medium truck, heavy truck Long-distance is over 50 miles
Conventional highway network Typical socioeconomic data

9
Statewide Network

10
Toll Coding
Different types of toll roads Closed toll (Kansas Turnpike, Oklahoma turnpikes) Barrier toll (E-470 Denver) Distance-based tolls (future?)
Toll options Can vary by time period and vehicle occupancy
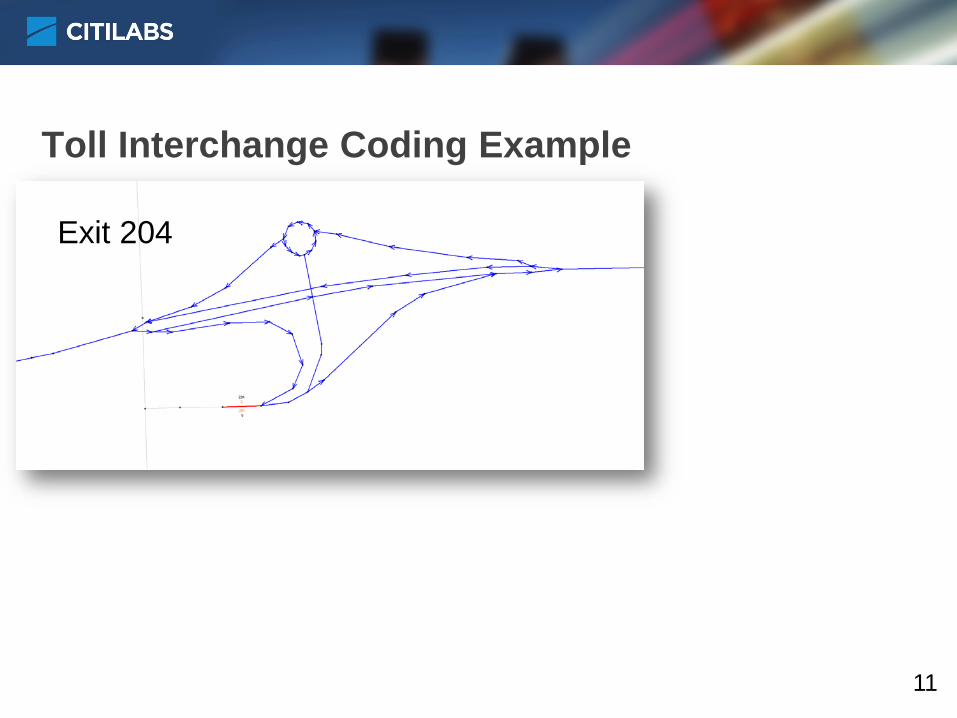
Kansas Turnpike uses closed toll system Coding is very elaborate Interchanges are coded in detail
Tolls represented in general Cash toll only Auto (2 axle) and semi-trailer (5 axle) tolls coded Total toll revenue based on fixed factors
11
Toll Interchange Coding Example
Exit 204

12
Goods Movement Model
Developed using Transearch and FAF4 data Conventional generation model by 8 commodity groups
Trip rates ∝ employment by type, with dummy variables Focus on agricultural goods Wichita: aviation manufacturing
Combined distribution/mode choice model Truck vs. rail Mode based on distance, time, and cost Short, medium, and long distance groups
Transport Logistics Nodes 51 intermodal facilities, major warehousing/transfer points
Vehicle model: converts payloads into trips Service model: light-duty commercial vehicles Implemented in Cube Cargo

13
Assignment Challenges
Mostly uncongested grid network Problems finding alternative paths without congestion Questions about equilibrium volume averaging process
Issues with stability Convergence feasibility Wanted reasonable run time
Needed toll diversion process to be incorporated in assignment Also wanted full assignment capabilities
Select link analysis Multi-path, multi-class assignment

14
Proposed Solutions
Uncongested grid: stochastic assignment Finds alternative paths
Equilibrium: capacity-restrained method with fixed iterations and weights Improves stability
Toll: logit toll model embedded within assignment Turnpike traffic and revenue drove the project
Can all of these be done at once?

15
The Grid Problem
The real network looks a lot like this grid
Path A-B-D looks very much like path A-C-D
Real traffic uses both paths How to model that?
A
C
B
D

16
Stochastic Assignment
Path-building uses a combination of time + distance Toll is handled separately
Create best path plus 3 more paths Use logit model to spread trips among paths
Split based on travel time difference Coefficient developed from previous work
Programmed in Cube

17
Equilibrium
Good experience using fixed iterations and weights Run equilibrium (Frank-Wolfe) with reasonable convergence criterion
to get the iterations and weights Hold those constant for scenarios One set for 2015, another for 2040
Not clear that equilibrium theory is valid at the statewide level Stability of results is very important

18
Tolls
Logit toll diversion model by period Toll, time saved, log of trip distance
Developed from prior work and surveys in other areas No local survey data
8 paths built (4 toll, 4 free) for 4 periods and 3 vehicle types AM peak, midday, PM peak, night SOV, HOV, Truck
Diversion is incorporated into the assignment Adjust bias coefficients based on Turnpike counts
19
Value of Time
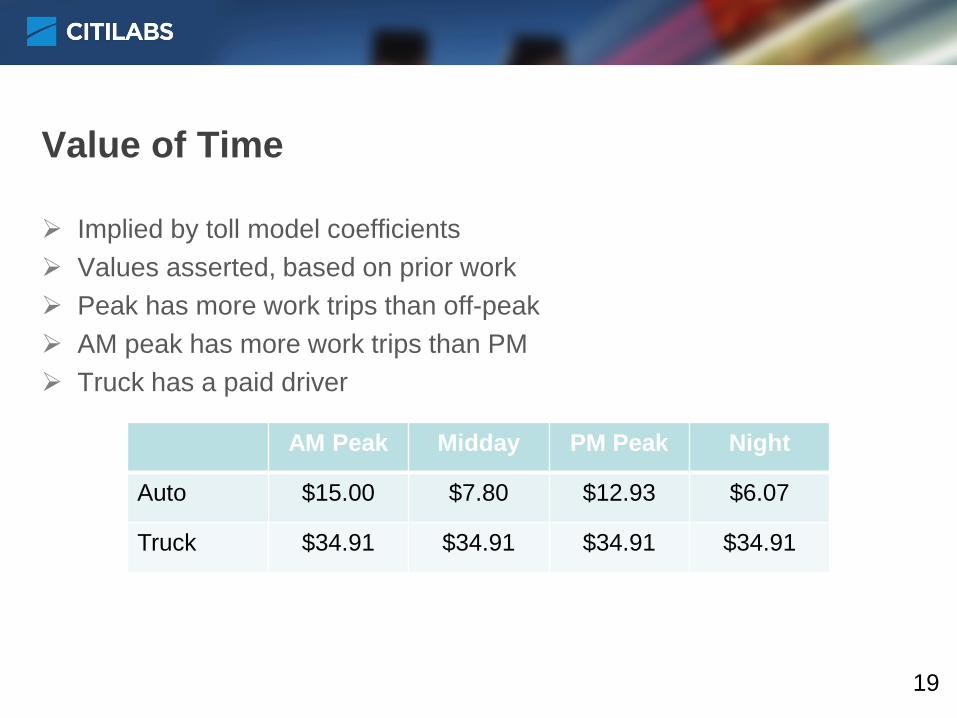
Implied by toll model coefficients Values asserted, based on prior work Peak has more work trips than off-peak AM peak has more work trips than PM Truck has a paid driver
AM Peak Midday PM Peak Night
Auto $15.00 $7.80 $12.93 $6.07
Truck $34.91 $34.91 $34.91 $34.91

20
Toll Diversion
Effect of Toll
Effect of Time Savings

21
Implementation
All 3 methods can be implemented at the same time, in Cube Probably the only time this has been done Cube Cluster used for multiprocessing (8 cores) Excellent match of volumes to counts
Overall volume/count difference = -0.9% Volume/count on all facility types within ±2% RMSE = 25% Link r2 = 0.992
Assignment run time (4 periods): 82 minutes