Innovative Approach to Validation of Ultraviolet (UV ...
24
Ho-’omalamalama: Building a Sustainable Infrastructure in the Asia Pacific Region CECAR7 CIVIL ENGINEERING CONFERENCE IN THE ASIAN REGION Waikiki, Oahu, Hawaii ǀ August 30 – September 2, 2016 Innovative Approach to Validation of Ultraviolet (UV) Reactors for Disinfection in Drinking Water Systems Jeffrey Adams U.S. Environmental Protection Agency ORD, NRMRL, WSWRD, WQMB Cincinnati, Ohio, 45268
Transcript of Innovative Approach to Validation of Ultraviolet (UV ...
Ho-’omalamalama: Building a Sustainable Infrastructure in the Asia Pacific Region
CECAR7 CIVIL ENGINEERING CONFERENCE IN THE ASIAN REGION Waikiki, Oahu, Hawaii ǀ August 30 – September 2, 2016
Innovative Approach to Validation of Ultraviolet (UV) Reactors for Disinfection in
Drinking Water Systems
Jeffrey Adams U.S. Environmental Protection Agency
ORD, NRMRL, WSWRD, WQMB Cincinnati, Ohio, 45268

Project Collaborators
PIs: Jeffrey Adams ([email protected]); Sam Hayes ([email protected]) TL: Sally Gutierrez ([email protected])
EPA: (OW) Mike Finn, Derek Losh, Greg Carroll; (ORD) Laura Boczek, Hodon Ryu, Eric Rhodes, Jennifer Cashdollar, Jill Hoelle, Jonathan Popovicci, Emma Huff, Mark Rodgers, Ann Grimm, Tom Speth
External: (Carollo)Harold Wright, Mark Heath, Traci Brooks; Linda Hills (Cadmus); Karl Linden (U of Colorado), Tom Hargy (Corona); GAP-Microbial Services; Corona Environmental Consulting; Jim Malley (UNH); Trojan; Wedeco
2

Background: Evolving Use of UV for Drinking Water Disinfection in U.S.
• State credited UV systems are third-party validated for Dose-Inactivation operating range, consistent with source water, and require continuous monitoring
• 2006-UVDGM is ‘Guidance’ on recommended approach for UV Validation, installation, & monitoring but alternative approaches may be acceptable to States
• EPA not planning formal update of UVDGM or UV dose tables in near future, but issues persist with interpretation of UVDGM by State permitting agencies
• Since 2006, UV research and commercial validation experiences have provided significant lessons-learned, modified validation practices, and identified new implementation challenges

Evaluation Objectives of EPA Study
• Practical approach for validating LP and MP UV reactors for Adenovirus & Cryptosporidium inactivation using various test microbes, i.e., MS2, B. pumilus, AD2, T1
• Apply UV dose algorithms based on theory vs empirical that predict log-I and RED as a function of the UV sensitivity of the microbe (combined variable criteria), flow, lamp-sensor output, DL, w/wo UVT
• Assess capabilities of test microbe for predicting target pathogen, assess credibility with second test microbe vs bracketing
• Evaluate UV lamp sensor technology that accounts for germicidal contributions of low-and high-wavelength UV light within MP reactors

Evaluation Objectives of EPA Study
• Address approaches for propagating and assayingAD2, B. pumilus, MS2, and methods for determining low and high wavelength ASCFs using collimated beam LP & MP UV lamps
• Determine & apply low and high wavelength ASCFs to predict Cryptosporidium and Adenovirus credit using MS2, B. pumilus, or T1 test data
• Simplify Validation-Factor (VF) analysis of uncertainties/biases
• Develop recommendations document from recent lessons learned applicable to GWR / SWTR describing alternative approaches for UV validation and implementation, and changes needed from previous UVDGM

Full-scale UV Reactor Testing – EPA Study
• LPHO UV Reactor:
60 test conditions, MS2, Adenovirus, Bacillus pumilus
25-700gpm flows; UVTs 70, 80, 90, 98; Lamp power 60-100 %
• MP UV Reactor:
103 test conditions, MS2, AD2, B. pumilus
17-400gpm flows; UVTs 70, 80, 90, 98; Lamp power 0.9-2KW
Synthetic & type 219 quartz sleeves, superhume-LSA
Sensors: low wave 200-240nm; ONORM high wave 240-300nm

UV Dose-Response of MS2 and B. Pumilus Brackets Adenovirus
7

UV Dose-Response MS2 & QA/QC Bounds

UV Dose-Response B. pumilus

UV Dose-Response Adenovirus AD2

New UV Dose Algorithm
2C+D×UVA +E×UVA254 254 SH × ASCF H B×UVA SA 0Hlog I = 10 ×UVA 254 × D ×Q L
2H +I ×UVA +J ×UVA220 220 SL × ASCF L G×UVA SF 0L+10 ×UVA ×220
D ×Q L
Low wavelength UV dose monitoring component uses low wavelength UV sensor and UVT at 220 nm

LP UV: Relationship between Measured log Inactivation and S/S0/Q/DL
12
At a fixed UVT, log inactivation of any microbes occurs at a similar value of S/S0/Q/DL

LP UV: Relationship between Measured log Inactivation and S/S0/Q/DL
13

LP UV: algorithm calibrated with T1 Predicts MS2, T7, and A. Brasilienis
y = 0.9843x R² = 0.9727
0
1
2
3
4
5
6
0 1 2 3 4 5 6
Pred
icted
Logi
Measured Logi
MS2 T1 T7 A. brasiliensis
Predictions Limited to Validated Range of S/S0/Q/DL defined by T1

LP UV: Measured vs. Predicted log I Calibrated Using MS2
010log UVABA
DQ S
S UVA i ×
× ××=
2C +D×UVA+E×UVA
L

LP UV: Algorithm Fit to MS2 & B. Pumilus Data Predicts Adenovirus No Better Than MS2 Alone

MP Predictive Algorithm w/ high & low wavelength sensor and UVA measurements maps MS2 data well
y = 0.9953x R² = 0.9935
0
1
2
3
4
5
6
0 1 2 3 4 5 6
log
i mea
sure
d
log ipredicted
Synthetic Quartz Type 219 Quartz

5
6
70%-MS2 80%-MS2
MP UV: MS2 Log I vs. SH/S0H/Q/DL
y = 391.75x0.6655
R² = 0.9464
y = 53.087x0.3886
R² = 0.9979
y = 1550.3x0.7976
R² = 0.9974
y = 3984.9x0.888
R² = 0.9944
y = 8805.4x0.9596
R² = 0.998
0
1
2
3
4
0 0.0002 0.0004 0.0006 0.0008 0.001 0.0012
Log
i
S/S0/Q/DL
90%-MS2 90%-Adeno 95%-MS2 98%-MS2
Type 219
y = 276.65x0.6365
R² = 0.9919
y = 673.35x0.6749
R² = 0.9813
y = 1237.4x0.7006
R² = 0.9932
y = 15192x0.9511
R² = 0.9978
y = 20149x0.9761
R² = 0.9981
0
1
2
3
4
5
6
7
0 0.0005 0.001 0.0015 0.002 0.0025
Log
i
S/S0/Q/DL
70%-MS2 80%-MS2 90%-MS2 95%-MS2 98%-MS2
Synthetic

MP UV: Measured vs. Predicted log I Calibrated Using MS2
y = 1.0022x R² = 0.993
y = 0.9576x R² = 0.8956
y = 0.974x R² = 0.668
0
1
2
3
4
5
6
0 1 2 3 4 5 6
log
i mea
sure
d
log ipredicted
MS2 - Lab 2 B. pumilus - Lab 2 Adeno - Lab 3
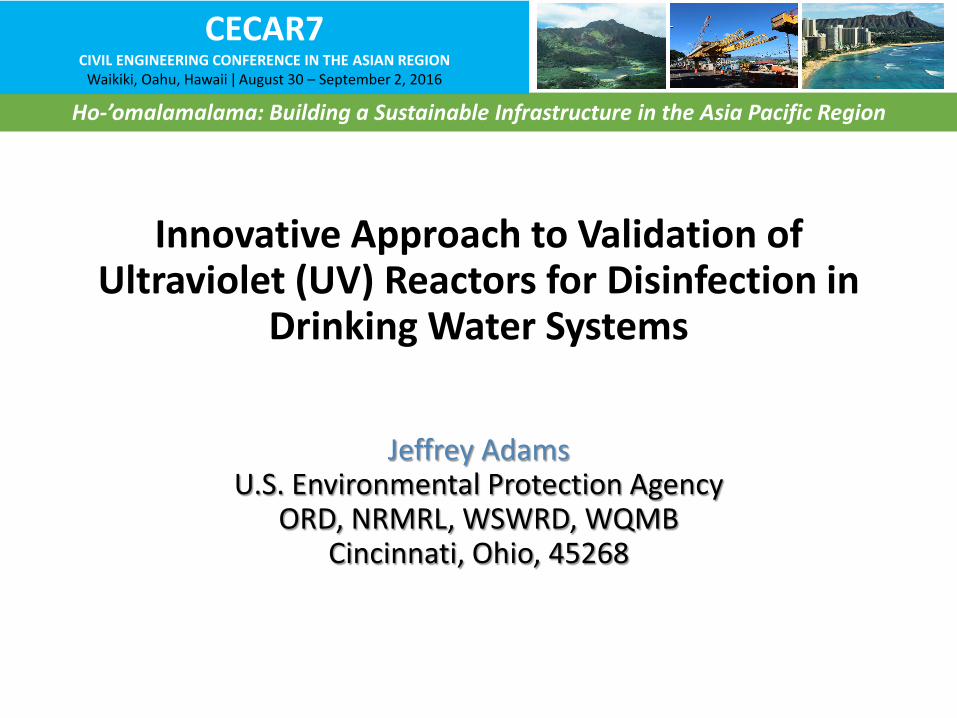
MP UV: B. pumilus Predicts
Adenovirus

Lessons-Learned To-Date
Use of Adenovirus microbes in conventional validation is impractical; if used the dataset should be large to assess high point-to-point variability/uncertainty
In both LP & MP analyses, MS2 microbes alone provided good correlations and conservative predictions of AD2 inactivation, better than B. pumilus alone or combined with MS2
Low-wavelength sensor paired with typical ONORM sensor can be effective for monitoring UV full germicidal range

Lessons-Learned To-Date
The UV industry will need to develop verification & calibration standards for low-wave sensors
Credit for low-wave UV contributions results show 2-3X lower REDs than LP AD2 RED=186 (4-log kill) so benefits of MP vs LP demonstrated in UV reactor scenarios
Combined Variable S/Q/DL algorithm variants & ASCFs, map UV reactor- validation datasets well, useful for predicting Crypto & AD2 scenarios with test microbes, and simplifies uncertainty/bias factors for VF

Questions & Discussion Jeffrey Adams Environmental Engineer USEPA, ORD, NRMRL, WSWRD, WQMB [email protected]
2323

--- - --
CECAR7 For aBetter Qualityof LifeCIVIL ENGINEERING CONFERENCE IN THE ASIAN REGION