INNOVATIVE AND ECONOMICS RESERCH JOURNAL
177
PUBLISHED BY: FOR THE PUBLISHER: EDITOR IN CHIEF: CO-EDITORS: TECHNICAL EDITOR AND GRAPHIC DESIGN: TRANSLATION TO ENGLISH: PAPERS PUBLISHED IN “ECONOMICS“ JOURNAL ARE ABSTRACTED AND INDEXED BY: PRINTED BY: KATALOGIZATION: EDITORIAL BOARD: INTERNATIONAL BOARD: “OIKOS INSTITUTE” d.o.o. Bijeljina PhD Zoran Mastilo, Director PhD Petar Đukić ASISTANT EDITORS IN CHIEF: PhD Andrzej Niemiec - Poland PhD Taro Abe - Japan Borjan Divljanović, Graphic studio PIXEL - 76 300 Bijeljina, BiH Mojic, d.o.o Bijeljina Number of copies: 300 primjeraka Printed issue: ISSN 2303-5005 Online issue: E-ISSN 2303-5013 Desicion of the Ministry of Education and Culture of the Republic of Srpska No.: 07.061-053-52-12/13, od 10.12.2013, The Journal “Economics“ entered in the Register of Public Media as item No. 645 Nemanja Jovanović EBSCO: EBSCO Discovery Service; De Gruyter open; DOAJ; DOI Srpska; Baidu Scholar; Celdes; CNKI Scholar; SIS - Scientific Indexing Services; CNPIEC; ERIH PLUS; Google Scholar; J-Gate; Journal TOCs; Naviga; Primo Central (ExLibris); ReadCube; Research Papers in Economics; (RePEc); MIAR; ADRESS OF THE EDITORIAL BOARD: Neznanih junaka 9-11 76300 Bijeljina Republic of Srpska Bosnia and Herzegovina e-mail: [email protected] Web site: www.oikosinstitut.org/economics.html www.economicsrs.com https://content.sciendo.com/view/journals/eoik/eoik-overview.xml Bank account: 5550000004916269, Nova banka, Filijala Bijeljina ID: 44035724600004 Russia: Oleg PhD Roy; Ludmila N. PhD Ivanova; Liliya PhD Kiyanova; Perpelkin PhD Viacheslav; USA: Tom PhD Gillpatrick; Leland PhD Buddress; Roofa PhD Galeshi; Jason PhD Caudill; Spain: Elena PhD De la Poza; Maisam PhD Ranjbari; Italy: Ubaldo PhD Comite Sweden: Christer PhD Thörnqvist India: Manjit PhD Das; Ray PhD Titus; Rudrarup PhD Gupta; Romania: Alexandru PhD Nedelea; Rocsana PhD B.Manea Tonis; Tailand: Napat PhD Harnpornchai; Fiji: Ranasinghe PhD Amaradasa; Albania: Elez PhD Osmanović; Brilanda PhD Bushati; Fatbardha PhD Molla Bequiri; Elidiana PhD Bashi; Slovakia: Ivan PhD Brezina; Martina PhD Blašková; Macedonia: Predrag PhD Trpeski; Moldavia: Corina PhD Gribincea; Marica PhD Dumitrasco; Croatia: Dragoljub PhD Stojanov Lorena PhD Škuflić; Zoran PhD Wittine; Montenegro: Boban PhD Melović; Milivoje PhD Radović; Rade PhD Ratković; Ivo PhD Županović; Darko PhD Lacmanović; Ana PhD Stranjančević; Iva PhD Bulatović; Anđelko PhD Lojpur; Serbia: Marko PhD Sekulović; Gojko PhD Rikalović; Nenad PhD Vunjak; Petar PhD Vrgović; Gordana PhD Kokeza; Božidar PhD Stavric; Kristijan PhD Ristić; Snežana PhD Milićević; Drago PhD Cvijanovic; Snezana, PhD Radukic; Saudi Arabia: Bashar Y. PhD Almansour; Yassin PhD Eltahir; Scotland: Kieran PhD James; Slovenia: Andrej PhD Raspor; Marjana PhD Merkač; Iran: Gholamreza PhD Jandaghi; Brasil: Arcione PhD Ferreire Viagi; Fábio PhD Albergaria de Queiroz; Poland: Piotr PhD Wisniewski; Algeria: Kherchi PhD Ishak; Ukraine: Olha PhD Komelina; Tetiana PhD Paientko; Belorussia: Oksana PhD Koshulko; Sri Lanka: Ahamed PhD Labbe Mohamed Aslam; Turkey: Hüseyin PhD Işıksal; Metin PhD Toprak; Zeki Atil PhD Bulut; New Zeland: Tauisi PhD Taupo; Indonesia: Teguh PhD Sugiarto; Oman: Mythili PhD Kolluru; Greece: Konstantinosdr PhD Malagas; Constantinos PhD Challoumis; Egypt: Azza PhD Mohamed Kamal; Uganda: Michael PhD Okoche; Czech Republic: Lucie PhD Andreisová; Bulgaria: Julia PhD Stoyancheva Stefanova; Morocco: Fouzi PhD Belmir Bosnia and Herzegovina: Šefkija PhD Berberović, emeritus; Kadrija PhD Hodžic; Mladen PhD Rebić; Branko PhD Krsmanović; Aleksandar PhD Stojanović; Marko PhD Šarčević; Goran PhD Popović; Hamid dr Alibašić; Nikola PhD Gluhović; Cviko PhD Jekić; Zoran PhD Mastilo; Radmila PhD Čičković; Armina PhD Hubana; Srdjan PhD Lalić; Nenad PhD Lalić; Drago PhD Vuković; Rajko PhD Radović; Milenko PhD Krajišnik; Jamila PhD Jaganjac; Slobodan PhD Subotić; Muharem PhD Karamujić; Djordje PhD Lazic; Ognjen PhD Eric; Dejan Mastilo, Faculty of Business Economics, Bijeljina Vesna Miletić, Oikos Institute Bijeljina INNOVATIVE AND ECONOMICS RESERCH JOURNAL
Transcript of INNOVATIVE AND ECONOMICS RESERCH JOURNAL

PUBLISHED BY:
FOR THE PUBLISHER:
EDITOR IN CHIEF:
CO-EDITORS:
TECHNICAL EDITOR AND GRAPHIC DESIGN:
TRANSLATION TO ENGLISH:
PAPERS PUBLISHED IN “ECONOMICS“ JOURNAL ARE ABSTRACTED AND INDEXED BY:
PRINTED BY:
KATALOGIZATION:
EDITORIAL BOARD:
INTERNATIONAL BOARD:
“OIKOS INSTITUTE” d.o.o. Bijeljina
PhD Zoran Mastilo, Director
PhD Petar Đukić
ASISTANT EDITORS IN CHIEF:PhD Andrzej Niemiec - PolandPhD Taro Abe - Japan
Borjan Divljanović, Graphic studio PIXEL - 76 300 Bijeljina, BiH
Mojic, d.o.o BijeljinaNumber of copies: 300 primjeraka
Printed issue: ISSN 2303-5005Online issue: E-ISSN 2303-5013
Desicion of the Ministry of Education and Culture of the Republic of Srpska No.: 07.061-053-52-12/13, od 10.12.2013, The Journal “Economics“entered in the Register of Public Media as item No. 645
Nemanja Jovanović
EBSCO: EBSCO Discovery Service; De Gruyter open; DOAJ; DOI Srpska; Baidu Scholar; Celdes; CNKI Scholar; SIS - Scientific Indexing Services; CNPIEC; ERIH PLUS; Google Scholar; J-Gate; Journal TOCs; Naviga; Primo Central (ExLibris); ReadCube; Research Papers in Economics; (RePEc); MIAR;
ADRESS OF THE EDITORIAL BOARD:Neznanih junaka 9-1176300 BijeljinaRepublic of SrpskaBosnia and Herzegovinae-mail: [email protected] site: www.oikosinstitut.org/economics.html www.economicsrs.com https://content.sciendo.com/view/journals/eoik/eoik-overview.xmlBank account: 5550000004916269, Nova banka, Filijala BijeljinaID: 44035724600004
Russia: Oleg PhD Roy; Ludmila N. PhD Ivanova; Liliya PhD Kiyanova; Perpelkin PhD Viacheslav; USA: Tom PhD Gillpatrick; Leland PhD Buddress; Roofa PhD Galeshi; Jason PhD Caudill; Spain: Elena PhD De la Poza; Maisam PhD Ranjbari; Italy: Ubaldo PhD Comite Sweden: Christer PhD Thörnqvist India: Manjit PhD Das; Ray PhD Titus; Rudrarup PhD Gupta; Romania: Alexandru PhD Nedelea; Rocsana PhD B.Manea Tonis; Tailand: Napat PhD Harnpornchai; Fiji: Ranasinghe PhD Amaradasa; Albania: Elez PhD Osmanović; Brilanda PhD Bushati; Fatbardha PhD Molla Bequiri; Elidiana PhD Bashi; Slovakia: Ivan PhD Brezina; Martina PhD Blašková; Macedonia: Predrag PhD Trpeski; Moldavia: Corina PhD Gribincea; Marica PhD Dumitrasco; Croatia: Dragoljub PhD Stojanov Lorena PhD Škuflić; Zoran PhD Wittine; Montenegro: Boban PhD Melović; Milivoje PhD Radović; Rade PhD Ratković; Ivo PhD Županović; Darko PhD Lacmanović; Ana PhD Stranjančević; Iva PhD Bulatović; Anđelko PhD Lojpur; Serbia: Marko PhD Sekulović; Gojko PhD Rikalović; Nenad PhD Vunjak; Petar PhD Vrgović; Gordana PhD Kokeza; Božidar PhD Stavric; Kristijan PhD Ristić; Snežana PhD Milićević; Drago PhD Cvijanovic; Snezana, PhD Radukic; Saudi Arabia: Bashar Y. PhD Almansour; Yassin PhD Eltahir; Scotland: Kieran PhD James; Slovenia: Andrej PhD Raspor; Marjana PhD Merkač; Iran: Gholamreza PhD Jandaghi; Brasil: Arcione PhD Ferreire Viagi; Fábio PhD Albergaria de Queiroz; Poland: Piotr PhD Wisniewski; Algeria: Kherchi PhD Ishak; Ukraine: Olha PhD Komelina; Tetiana PhD Paientko; Belorussia: Oksana PhD Koshulko; Sri Lanka: Ahamed PhD Labbe Mohamed Aslam; Turkey: Hüseyin PhD Işıksal; Metin PhD Toprak; Zeki Atil PhD Bulut; New Zeland: Tauisi PhD Taupo; Indonesia: Teguh PhD Sugiarto; Oman: Mythili PhD Kolluru; Greece: Konstantinosdr PhD Malagas; Constantinos PhD Challoumis; Egypt: Azza PhD Mohamed Kamal; Uganda: Michael PhD Okoche; Czech Republic: Lucie PhD Andreisová; Bulgaria: Julia PhD Stoyancheva Stefanova; Morocco:Fouzi PhD Belmir
Bosnia and Herzegovina: Šefkija PhD Berberović, emeritus; Kadrija PhD Hodžic; Mladen PhD Rebić; Branko PhD Krsmanović; Aleksandar PhD Stojanović; Marko PhD Šarčević; Goran PhD Popović; Hamid dr Alibašić; Nikola PhD Gluhović; Cviko PhD Jekić; Zoran PhD Mastilo; Radmila PhD Čičković; Armina PhD Hubana; Srdjan PhD Lalić; Nenad PhD Lalić; Drago PhD Vuković; Rajko PhD Radović; Milenko PhD Krajišnik; Jamila PhD Jaganjac; Slobodan PhD Subotić; Muharem PhD Karamujić; Djordje PhD Lazic; Ognjen PhD Eric;
Dejan Mastilo, Faculty of Business Economics, BijeljinaVesna Miletić, Oikos Institute Bijeljina
INNOVATIVE AND ECONOMICS RESERCH JOURNAL

CONTENTS
IS THE OCCURRENCE OF A GLOBAL CRISIS REALLY LESS LIKELY? ............................. 3Prof dr Petar Đukić
BUSINESS-GOVERNMENT INTERACTION A THEMATIC ANALYSIS ............................ 7Oleg Roy
IMPACT OF GREEN PRACTICES ON BUYING HABITS INPAKISTAN’S FOOD SECTOR ............................................................................................. 19Rana Adeel Jafar, Aiza Shabbir, Farzana Kousar
EFFECTS OF DIGITAL TRANSFORMATION AND NETWORK EXTERNALITIESIN THE TELECOMMUNICATION MARKETS .................................................................. 31Snežana Radukić, Zoran Mastilo, Zorana Kostić
MODELLING HUMAN BEHAVIOUR IN THE DIGITAL ERA: ECONOMIC AND SOCIAL IMPACTS ................................................................................ 43Elena de la Poza, Lucas Jódar
THE EU ENLARGEMENT. HOW TO BE LIKE THE IRISH AND NOT THE GREEK? ..... 49Tahir Mahmutefendić
CAN SLEEP DURATION HELP EXPLAIN DIFFERENCES IN THE HAPPINESS INDEX ACROSS NATIONS? ............................................................................................... 59Azza Mohamed Kamal
DEVELOPING A TOOL FOR QUALITY AND ACCREDITATION OF A NEW GENERATION UNIVERSITY IN THE DIGITALIZED SOCIETY: THE CASE OF A THEMATIC-TECHNICAL UNIVERSITY ....................................................................................................................... 69Metin Toprak, Yüksel Bayraktar, Armağan Erdoğan, Deniz Kolat, Mehmet Şengül
ANALYSIS OF MACROECONOMIC FACTORS EFFECT TO GROSS DOMESTIC PRODUCT OF BOSNIA AND HERZEGOVINA USING THE MULTIPLE LINEAR REGRESSION MODEL ................................................................................................................................. 91Stanko Stanić, Željko V. Račić
FOREIGN TRADE LIBERALISATION AND ECONOMIC GROWTHTHE CASE OF THE REPUBLIC OF SRPSKA ..................................................................... 99 Goran Popović, Ognjen Erić, Srđa Popović
CAN CORPORATE SOCIAL STRATEGY CREATE SHARED VALUE TOWARD CREATIVE BUSINESS? “VOLVO SOCIAL STRATEGY MODEL” ................................... 109Ishak Kherchi, Fellague Mohamed, Haddou Samira Ahlem
DIGITAL VILLAGE TRANSFORMATION: A MODEL FOR RELATIVIZINGREGIONAL DISPARITIES IN THE REPUBLIC OF SERBIA ............................................ 125Aleksandar Manasijević, Marko Milojković, Dejan Mastilo
THE DIGITAL TRANSFORMATION OF MARKETING:IMPACT ON MARKETING PRACTICE & MARKETS ..................................................... 139Tom Gillpatrick
APPLICATION OF THE T-TEST IN HEALTH INSURANCE COST ANALYSIS:LARGE DATA SETS ........................................................................................................... 157Bojan Kresojević, Milica Gajić

3
Volume 7, No.2 2019ISSN 2303-5005
Once this issue becomes available to the readers, the global and regional balances of economic developments and political developments and achievements in the world for 2019 will be summarized. What are the prospects for the year 2020? Well, it seems that the only thing that can be said for sure is that any possible assumption would be shadowed by uncertainty and controversy. It is a fact that the growth rate of global economic activity is slowing down. Since last year’s above-average growth of 3.6%, (10-year averages are below 3%), the following forecasts have been steadily declining, resulting in this October’s rather modest forecast of 3 % growth for the entire 2019, compared to estimated 3.7% (IMF, early 2019). As if the world had reached its maximum growth two years ago (3.8% for 2017) of this temporary (?) growth surge, which is why it is high time to start contemplating realistically and pessimistically due to various reasons. From the standpoint of two years ago, it seems that the growth downturn phase occurred too straightforwardly, although it remains possible for the global growth to somewhat recover after 2019. The following year 2020, should reach a growth rate of around 3.5%, according to IMF forecasts. Pessimism and slight optimism are shifting in the assessments of business structures and professionals, both in foreign trade and investment, as well as in terms of employment and growth. Objectively speaking, there are numerous reasons for concern, primarily political ones. We are predominantly referring to the risks of trade and technological co-operation slowdowns due to protectionism, uncertainties about “hard” or “soft” Brexit, and even latent international conflicts in the Middle East. The effects of the long-term risks regarding smouldering conflicts and internal conflicts, the migrant crisis and the continuing escalation of the effects of climate change cannot be underestimated. The rise of inequality as a constant of global economic reality, fuelled by globalization and technological progress, continuously fuels the fire of possible social unrest and conflict. Even the fact that development-based inequalities of individual countries are diminishing globally does not dispute the findings that internal inequalities are increasing in each of the 200 countries of the world, and that in most cases they cause internal dissatisfaction and social tensions. The world of the market economy and today’s model of globalization, regardless of the number of positive effects they may bring, have their ugly side, producing crises that are increasingly difficult to control.
THE WHOLE WORLD IN TURMOIL
The unrest in Hong Kong, caused by the dissatisfaction of the local population with the Chinese administration seem to have no end. At the time of writing this text, the conflicts that have been ongoing since early June have escalated greatly. Initially, they broke out on an extradition bill that provided for the extradition of suspects to Beijing, but soon grew into a fight for democratic rights and the preservation of civil liberties guaranteed to Hong Kong in 1997 when Britain returned the territory to China. The “yellow vest” movement unrests in France began because of environmental fuel price charges, only for them to eventually be recognised as a social movement of the majority of
IS THE OCCURRENCE OF A GLOBAL CRISIS REALLY LESS LIKELY?
Prof dr Petar ĐukićEditor-in-Chief of Economics, Innovative and Economics Research Journal
Editorial
INCEPTION

ECONOMICS
4
the lower middle class in France. Recently, they have furiously marked the anniversary of their great (class) rebellion.Sharp political conflicts are taking place in Iran, but their causes are mostly socio-economic. Latin America is nearly on fire with social unrest, triggered by poor political decisions and government behaviour following patterns left over from General Pinochet’s oppressive dictatorship (Chile 1973). Even in the seemingly very tidy and peaceful Czech Republic, hundreds of people found themselves on the streets of Prague in November 2019 (the highest number of people reported since the fall of communism) seeking the resignation of the Prime Minister ... At the same time, in Spain, the right party has gained powerful support from the people. As if all of the above fails to be a sufficient cause for concern of leading economists, not even of the institutions such as the IMF and the World Bank. The odd combination of risk and economic serenity is explained by low, near-zero or even by negative interest rates. Private and public debts are on the rise, whereas the cost of maintaining them remains low. It is speculated that a relaxation of global funds could occur due to monetary reliefs. Simply put, money is printed, its price remains exceptionally low, but it does not cause a pro-inflationary effect. Compared to the assessment of financial risks from a year ago, nowadays they seem less severe. The US and China have reduced the risk of an escalating trade war through bilateral agreements, with the reduction of the risk of a US-Iran war as well, making the possibility of an oil crisis that would plunge the world into recession less likely.
RECESSIONARY TRENDS AND/OR DEBT CONTROVERSIES
Recently, one of the world’s most famous contemporary economists (Nobel laureate Nouriel Roubini, who is probably the only one who predicted the previous great crisis of 2008-9) during his visit to Belgrade, said that all the looming risks are lower than they initially appeared and that the world is probably not in danger of another major crisis in the following year, not even in 2021. Although he did leave the possibility of recession in some of the major economies of the world, he stressed that the main risks are not such as to trigger a global recession. Taking full account of his arguments, we must ask ourselves about the risks acting in the long run. If Rubini’s forecast is true, then something is very contradictory and unpredictable in today’s world. In a time of recession in Germany - Europe’s largest economy, China’s slowdown, too long stagnation in Russia, the widening gap between major global competitors such as the US, China, the EU and the rising costs of Brexit, and at the time of a simultaneous poor arms control and increasing focus tensions in the Middle East and Latin America… the world seems to keep moving on its clumsy march towards an economic and technological domination, maintaining its primordial struggle for the same goal.An elementary precondition for a sustainable state without an open crisis would be to control the redundant and harmful escalation of the conflict of the greatest powers. What will happen to Bolivia, Venezuela, Iran or Hong Kong is of little interest to the world leaders, unless their own interests are mutually confronted. After all, the above was already unmasked in the Ukrainian crisis, in Syria, the migrant issue, particularly in Europe. Problems can be resolved, politically and painstakingly, but can also be postponed... And that’s probably something.Today, the United States are indebted by $21 trillion, the UK as much as by 7.5 trillion, Germany 4.8 trillion and the entire Eurozone as much as $14 trillion. However, it seems that there is no real trigger for the crisis yet. Is there anyone else not concerned about the effects of global climate change leading to extreme weather, storms and hurricanes, droughts and floods, more frequent and increasingly extensive fires? Has anyone, so far, dealt with the new continuous waves of migration across the planet in the second decade of the 21st century? Can it be said with certainty that the deglobalization, isolationism (by the large and more powerful ones) as well as the fragmentation of smaller and weaker economic and political entities has come to an end in today’s world?

ECONOMICS
5
The aforementioned strengthening of the extreme right-wing parties in Spain, a country that was not prone to right-wing politics, says the opposite. The extreme right is a risk in itself as it deepens divisions, whereas it is also extremely conservative, often exclusive and militant. Such was the former fascist and Nazi right-wing party who led the bloody feast named World War II. Today’s variants of right-wing extremism increasingly tend to resemble it, regardless of whether they may come from Trump’s extreme US Republican right-wing party (as Noam Chomsky warns us) or from Turkey, Poland, Austria, Italy or Hungary. In most cases, the new extreme right is belligerent and very restrictive to foreigners and neighbours. They have very little concern about the sustainability of economic flows, international solidarity and cooperation, natural balances, social care and social justice. There are as many justices as there are people - that’s the good old truth. However, this does not mean that it should not be sought after.
EXTREME AND ANY OTHER TENDENCIES: INCREASINGLY DIFFICULT CONFLICT CONTROL
What does extremism actually mean today? Simply put, it is an extreme position of an attitude, that simply makes no compromises. Extremists are generally recognized for their strong and exclusive ideological values. As this article comes to light, news coming from far and wide: Latin America, France (“Yellow vests”), Iran to Hong Kong and beyond - also warn that processes of spreading confrontation, intolerance and conflict are emerging across the globe, and they are not keen on reconciliation. If the US, being on one side, and China, North Korea or Iran, on the other, somehow manage to find modus vivendi in terms of controlling mutual last-minute intensifications, by means of reducing tension and through bilateral agreements, this may not always apply to mass, street or city protests of certain socially disadvantaged groups, from Latin America, through Iran to Hong Kong or any other part of the world. Protests that paralyze normal life may arise from a relatively small cause such as the price of fuel, the cost of transportation in the subway, electricity cost, changes in tax rates, of the abolition of a social right of the people. The Internet and globalized media tend to spread news and influences very quickly. Social networks rapidly become oversaturated with the resentment and anger of people (probably caused by all the fear and suffering). All of the aforementioned is very frequently fuelled by the highly flammable fuel of ideological and other hatred, or by moderate aggression. Social conflicts are becoming increasingly difficult to control and contain.
SHOULD THE WORLD BE WORRIED?
Even in the event that a new global crisis is avoided in the short term, and even if the world growth remains above the 3% rate, all the risks and threats to the global economy and politics remain in place. The downward adjustments of growth by 0.3 to 0.5 percent have little significance to certain economies, particularly to the large, emerging ones (such as China and India). The World Economic Outlook (IMF, October 2019) may even succumb to further declines, with no major consequences for growth prospects in the upcoming years.However, a permanent environmental crisis, which largely causes a migrant, demographic and even social crisis, is a dangerous threat to the world in the long run. Global institutions are experiencing a major standstill. Their actions are burdened with a multitude of misunderstandings and controversies that mainly concern the interests of the most powerful players. Responsibility for the future of the planet and the global community of people is shared by all, with the most powerful ones carrying the heaviest burden.
December 2019.

ECONOMICS
6

7
Volume 7, No.2 2019ISSN 2303-5005
ABSTRACT
The article analyzes the interaction between business and government, the purpose of which is to identify the leading thematic blocks, where the most significant issues underlying this interaction are concentrated. Highlighting two meanings in the practice of interaction between business and the state, in one of which the state merges with business, and in the other - disagrees with it on key issues, the author proposes to use the theory of stakeholders of I. M. Jawahar and G. L. McLaughlin. The use of this theory allows to identify several types of interaction, including six main functions: facilitating, stimulating, control, sanctions, arbitration and regulatory. The content of these functions is concentrated in the list of basic activities of authorities in the field of regulation of business processes. For the purpose of complex and systematic consideration of these functions, the article proposes a 3D model of interaction between government and business. On the basis of this model the author carries out the content analysis of materials of the leading among businessmen of the Omsk region newspaper “Commercial news” on the basis of which the leading thematic blocks of interaction of the power and business updated by various types of lighting are allocated (analytical article, interview, reportage, a note). The important role of the media in assessing and structuring the relationship between public authorities and business structures determines the usefulness content analysis and the choice of the object of the study. The study highlighted a number of leading thematic blocks of interaction, updated on the pages of the weekly in the period from 2018 to mid-2019. Based on the study, the author identified and ranked thematic blocks considered in the context of his proposed 3D- model, formulated the most characteristic problems of interaction between business and government at the present stage.
BUSINESS-GOVERNMENT INTERACTION: A THEMATIC ANALYSIS
Oleg Roy1
date of paper receipt:01.10.2019.
JEL: Z13
Original Article doi: 10.2478/eoik-2019-0018 UDK: 005.584.1:334.72.021(47)
date of sending to review: 03.10.2019.
date of review receipt:11.10.2019.
1 Omsk State University, Faculty of Economics, Russia
Keywords:Business, government, stakeholder theory, content analysis, media, social interaction, small business, publication theme, institutional sustainability

ECONOMICS
8
INTRODUCTION
The problem of interaction between business and government is one of the most relevant and developed in social science. The problematic nature of this interaction is manifested in the lack of trust among the parties and the fuzziness of the basis for the consolidation of their interests. Each side of the interaction relies on socially sanctioned institutions, developing its own strategy of behavior. Historically, the interaction of government and business can take different forms, the quality that is assessed by individual indicators of the economic condition of the society where this interaction takes place. However, by what indicators can be identify a particular form of interaction, the use of which empirical base will allow to form an adequate idea of the nature of the relationship between business and government? At present, the questions of how compatible the interests of business and government and in what areas it is possible to achieve maximum consolidation of their interests are becoming extremely relevant for the Russian economy? Answers to these questions will help to identify critical points in the interaction between business and government and develop possible options for optimizing these relations.
1. THEORETICAL ANALYSIS OF THE PROBLEM
The analysis of scientific sources testifies to rather deep differences existing in positions of business and the government. On the one hand, the importance of merging business and government, which causes deterioration of the business climate and contributes to corruption risks, is negatively assessed [1,2]. On the other hand, there is a deep divergence of interests between business and government, caused by the growing distrust of the parties to each other [3]. In Russian science, research interest is mainly aimed at highlighting several issues of interaction between business and government:The problem of authority criminalizing, lobbying for the interests of some companies in government [4];Building of partnerships between business and government, overcoming administrative barriers to business development [5];Development of public-private partnership mechanisms [6];The interaction of business and government in solving new urgent problems (the development of the Arctic, the transition to digital technology, etc.) [7];Improving communication interaction (awareness of organizations on the issues of legislative regulation, development of consulting services, etc.), creation of business incubators [8,9].Thus, we can state a wide variety of manifestations of interaction between government and business – from positive to negative results.A good methodological basis for the study of the interaction of business and government can be the theory of stakeholders of I. M. Jawahar and G. L. McLaughlin [10]. According to this theory, by interacting with each other, the authorities and the business community develop a certain line of behavior that allows them to adequately distribute efforts depending on the position of the counterparty and the intentions expressed by him. The theory focuses on the typical nature of strategic decisions in interaction with counterparties (shareholders, investors, customers, governments, etc.), manifested in a certain set of rules determined by the nature of such interaction.The main types of interaction are:- proactive - aimed at showing attention to the problems of stakeholders; - adaptations - characterized by consideration of stakeholder problems, but not strictly mandatory response to them; - protection-providing for the use of a minimum of actions in building relationships with stakeholders; - reaction-consisting either of fighting against solutions to the problems of stakeholders, or their complete disregard.

ECONOMICS
9
By interacting with each other, authorities and business structures solve certain tasks for themselves, which can be represented in the form of functions of such interaction. In our opinion, the main functions of interaction are: facilitating, stimulating, control, sanctions, arbitration and regulatory. All presented functions can be represented in the plane of three main axes, two of which reflect the two fundamental modes of public administration – “laissez faire (night watchman)” and “public Manager”. The third axis is designed to ensure harmonization and synchronization of the actions of government in the implementation of the main functions. The first two functions are generally positive for business, while the other two are negative. Being the dominant of interaction, which determines the rules of this interaction, the government forces business to bear additional founding costs, allowing the entrepreneurial structure to become a party to this interaction. After all, being turned off from this interaction, the business unit loses a large list of opportunities, giving it the opportunity to realize all its abilities. with the assistance of the third pair - arbitration and regulatory functions - the government seeks to balance the interests of society and business, developing a list of direct and indirect ways to solve local problems and contentious situations.Thus, the axis of development involves the facilitative and stimulative functions (“mode public administrator”), the axis of institutional stability - control and sanctions (mode “night watchman”), and the axis of operation - arbitration and governance. Based on the theoretical reconstruction of the problem, a 3D model can be built . It based on the connection of the three main axes of interaction discussed above: institutional stability, operation and development (Fig. 1).
Figure 1. The structure of the model of interaction between business and government (3D-Model)
2. ISTITUTIONAL STABILITY
As practice shows, the manifestation of a particular function depends on the type of enterprise, its location, industry affiliation, as well as its age, i.e. position on the life cycle curve. Younger organizations are more likely to seek the inclinations of the government than established companies. Therefore, the question arose: on what thematic blocks there is a consolidation of interests of the government and business, and on what – no? The identification of such thematic blocks will improve the economic policy of the government, focusing it on solving the most pressing problems.Unfortunately, the relationship between the government and the corporate sector in Russia is not symmetrical. The government’s interest in the corporate sector is embodied mainly in the use of its tax proceeds and the transfer of a number of social obligations to its shoulders. As a result, according to Rosstat, in 2018, 290 288 enterprises were opened in Russia, while during the same period, 622 111 companies ceased their activities. That is, the number of enterprises closed for the year exceeded the number of those opened by 2.14 times. At the end of the year, only in five regions of the Russian Federation, the number of newly created enterprises exceeded the number

ECONOMICS
10
of closed ones. The main causes of death of enterprises experts call the high credit rate, limiting access to financial resources, lack of necessary business skills, personnel shortages, difficult access to markets and even lack of information about the support measures that offer a particular region [11].Therefore, the attitude of the corporate sector to the government is embodied mainly in the desire to avoid its influence, to minimize their the tax and administrative costs. Especially difficult is the attitude of business to public policy in small enterprises the development of which is quite sensitive to changes in government policy in the economic sphere. Small businesses receive from the state not only a tax burden, but also help in solving their problems.There are different ways to support the corporate sector in different countries, but the most common form is government support for small businesses. Small business is antimonopoly by nature, and with a narrow specialization and the use of the latest technology, small business can become a serious competitor to large corporations. This quality of small business has played a significant role in weakening and overcoming the tendency of industrialized countries to monopolize large capital and delay technological progress.In some countries, the share of products produced by small enterprises reaches 80-90%. In order to stimulate their activities and increase their role in the economy, the authorities determine a set of incentives measures for the appropriate types of enterprises. So in the United States significantly increased the threshold number of employees of small and medium-sized enterprises, which include firms with the number of employees up to 500 people in manufacturing, in wholesale trade up to 100 people in retail and other industries up to 50 people. The number of employees is an important criterion for classifying small businesses in Japan. There it should be less than 1,000 people in mining, less than 300 people for all other industries, transport, communications and construction, less than 100 people in wholesale and less than 50 people in retail and services.The support of individual business areas makes the government to go to the adjustment of previously entered rules. So in 1966, the American administration of small business referred to the category of small enterprises rather large company “American motors”. This was done in order to give the company the opportunity to bid for government contracts, despite the fact that “American motros” was considered the 63rd largest manufacturer, had 32 thousand employees and sales revenue of $ 991 million. The small business Administration justified its decision by saying that the company did not dominate the industry and its position and support could play a key role in ensuring the sustainability of the national automotive industry [12].Similar measures were implemented at the time by the Chinese government , when tax incentives for small businesses were introduced in 2012. Thus, since August 1, 2013 the country has frozen the value added tax and turnover tax for small businesses, whose monthly sales volume does not exceed 20 thousand yuan (about 3.3 thousand dollars). USA. )Thus, we can state the experience of positive influence of the state on the development of entrepreneurship, embodied in various forms of government support. But here, too, the issue of the thematic profile of such support and the areas where the points of disagreement between the parties are concentrated becomes extremely relevant.One of the least investigated problems of assessing the current state of business-government interaction is its actualization of the media. The role of the media in the development of interaction between business and government is relevant due to the fact that the mass media form the image of this interaction in the eyes of the public, that directly affects public policy in the field of regulation of the business.

ECONOMICS
11
3. EMPIRICAL EVALUATION OF THE RESULTS OF INTERACTION BETWEEN GOVERNMENT AND BUSINESS IN THE OMSK REGION In order to identify the thematic blocks of contact between the positions of the government and the business community at the regional level in August 2019, the author conducted a content analysis of the media covering this issue. The applied method allowed to identify the leading topics that make up the subject of the relationship between government and business. The study used latent coding aimed at revealing the hidden, implicit meanings of the text content [13, p. 123]. The usefulness of this method of coding is manifested in the fact that, as a rule, many topics are scattered across different types of messages and do not have a strict identifier. When prioritizing a topic, consideration was given not only to the frequency of the topic and the nature of the message (analytical article, interview, report or note), but also to the time dispersion of the topic, which confirmed the persistence of interest in the topic over a long period. In the media, this issue becomes not only the subject of public discussion, but also acquires a primary expert assessment. Print media formulate the problem, correlating it with the prevailing socio-economic and political context, embedding it in the existing institutional structure of society. The positions of the authorities and business communities are displayed on the pages of the print media, which are usually represented in the courtrooms, at meetings of the legislative and Executive authorities, in public speeches of their representatives.The subject of the author’s research was the allocation of basic strategies of the government and business communities, made on the basis of the analysis of the stories presented on the pages of the popular in Omsk printed publication “Commercial news”, specializing in coverage of the problems of business development in the region, and having a fairly wide popularity among readers. The stories that get on the pages of the weekly newspaper cover the most interesting and illustrative examples of the collision of positions of authorities and entrepreneurs, which makes it possible to classify them and better understand the values of the conflicting parties. Weekly newspaper “Commercial news” is the leading business publication of the Omsk region, which is widely popular among entrepreneurs in the region.The selection of the Omsk weekly newspaper meets the necessary requirements for the typicality of the edition being taken. The weekly newspaper specializes in coverage of issues most sensitive to public perception. In Omsk, as in most Russian cities, the share of people employed in the business sector is at least 40% of the working population. And therefore, the media is aimed at covering topics that are most relevant for this category of employees.Empirical evaluation of the results of interaction between government and business can be performed in the context of the functions implemented within this interaction, the value of which should be determined by the degree of actualization of the relevant topic on the pages of the leading business publication of the region. This assessment can be done in the context of the 3D model, which allows us to consider the practice of interaction between business and government in the aggregate of all possible functions. The axis of development is associated with the expectations of business to receive state support for projects and organizations performing socially-oriented work, as well as with the proposal of measures for the competitive allocation of budget resources for the execution of tasks demanded by public authorities.. The development regime is confirmed in the framework of this study by the number of publications that consider various forms of business support or participation of business communities in the placement of state and municipal orders. The support and stimulation functions that ensure the development reflect the ability and readiness of the authorities to offer promising forms of business development, aiming at expanding the scope of its activities. The main objectives of the government in relation to the development of the corporate sector are:- reduction of innovation costs for private companies;- redistribution of budget resources in order to stimulate socially significant projects [14].

ECONOMICS
12
The mode of operation is predicated on the need to regulate the current socio-economic relations in the business environment associated with the entry of new players into this environment or the observance by all participants of the relations of the established rules. In this study, the mode of operation is identified by the number and direction of publications on disputes between business communities, business communities and authorities, the formation of conditions for business communities to conduct their production activities. The main areas of operation are the rental and property relations, litigation, taxes, administrative barriers, etc. Included in the axis of operation of the arbitration function provides assurance of the company from illegitimate claims or arbitrary action on other individuals and entities, determines the procedure of the introduction legal actions and settlement of disputes in the current mode. Thanks to the regulatory function, the authorities carry out law enforcement in the implementation of decisions, undertake operational activities to enter the territorial markets of new players and cut off those who infringe on established rules.The mode of institutional sustainability is aimed at the formation and support of basic principles and legislative provisions that define the rules of business, as well as the rules of participation of state and municipal authorities in the regulation of current socio-economic and political processes. The control function underlying this mode is manifested in the presence of a balanced regulatory system that ensures the adjustment of the actions of counterparties in achieving their goals in accordance with the established norms. The actual problems of interaction within this function are the issues of redundancy of control, its inefficiency. Closely associated to the control function, the sanctions function is performed by specially authorized services designed to observe the rights of citizens to a safe and comfortable accommodation . However, the effectiveness and expediency of many sanctions is the subject of serious public debate due to their isolation from the alleged harm, arbitrariness of the security services initiating them, biased courts in disputes between public and private organizations.Institutional stability is the most important condition for the existence of society, and the formation of the institutional environment is one of the most popular areas of state participation in the development of the corporate sector. D. North wrote that “the institutional environment determines the set of capabilities that certain conditions make it more profitable (economically) redistributive activity, and in other productive activities” [15, p.17]. The institutional environment helps to reduce transaction costs of the company, to overcome opportunistic behavior of business partners.In this study, the mode of institutional sustainability is determined through the actualization of issues of administrative pressure or bureaucratic impediments, excessive regulation or the impact on business behavior of judicial precedents. In contrast to the mode of operation, we are not talking about direct ways of influence of administration on the activities of enterprises, but about a system that supports such influence, which has both positive and negative consequences for business. If the mode of operation involves the resolution of issues in the current order, in the mode of institutional stability the rules and regulations are systemic, objective in nature, and the authorities and the business community can only adapt to these rules.Coverage of the problems of interaction between government and business in the print media is embodied in the form of: small notes, interviews with managers, analytical articles (research), reports (from the courtroom, forums and meetings). Analytical articles provide a discussion of the topic with a focused analysis of the problem. As a rule, these articles precede the issue, serve as an expression of its main theme. The analytical article reveals the content of the actualized problem, the list of parties involved in its actualization, conclusions and an invitation to discussion. Reports are information summaries from current events (court sessions, conferences, government meetings, etc.). The reports highlight the essence of the problem situation, the participants and initiators of the discussions. The reports do not provide conclusions and are intended mainly to draw attention to the problem. Notes are summaries of issues that are addressed primarily in the context of other issues. Notes do not disclose the content of the problem and only inform about the events that accompany the processes that cause these problems. And finally, the interview is a

ECONOMICS
13
way of presenting the positions of a specialist, a Manager, in the process of which the actual topics, problem situations and the attitude of the interviewee are highlighted. Several actual topics may stand out in an interview, however, their coverage is subjectively colored and detailed.Coverage of the topic in the print media can be carried out in physical and verbal contexts. The allocation of these aspects is actualized in the framework of the event analysis, which receives special additional content through coverage in the print media [16,17]. The physical context is expressed in the representation of the problem through the real interaction of counterparties, expressed in public actions, competitions, discussions, the use of expert and legal expertise, etc. Verbal context does not imply a real interaction between the parties and is primarily a form of understanding, understanding of the problem, more information about participants, etc. the Physical context is embodied in such forms of interaction as actively discouraged.and complicity. And verbal - in expectant observation and cognitive interest.Actively discouraged.is a stable and reasoned position of one of the parties aimed at blocking the actions of the counterparty and protecting its interests. Such position in interaction of the government and business is taken by the business which is carrying out the activity by the rules established by its counterparty. Such opposition in the relevant institutional structure is carried out by business by applying to judicial and supervisory bodies. Complicity is seen here as a positive aspect of physical interaction that allows one of the parties – business – to benefit from contacts with state (municipal) bodies, improve the business environment, reduce the financial burden or obtain new sources of financing.. The most characteristic form of participation can be, for example: participation of a business structure in public procurement, grants, organization of various forms of equal and mutually beneficial cooperation, etc. The expectant observation does not involve detailed coverage of the event, making assessments and judgments. The object of expectant observation is an unfamiliar sphere of business or regulatory innovations. The interest here is not people, but mechanisms, the use of which has a high degree of uncertainty. Cognitive interest is focused on more topical issues that have a wide awareness among the participants of the interaction. Therefore, the interest is details of heightened engagement, role of specific individuals in their initiation and participation, the impact of these events on social processes, etc. Thus, in contrast to expectant observation cognitive interest means the reflection of the reader to the materials, the emphasis on identifying underlying mechanisms of events. In the center of expectant observation lies the plot, the story, the narrative.In carrying out the content analysis of the materials of the business newspaper of the Omsk region “Commercial news”, taken for the period from 2018 to August 2019, priority problems of interaction between business and government were identified, which received the most coverage on the pages of the weekly. In total, 79 issues of the weekly Newspaper were analyzed (49 issues in 2018 and 30 issues in 2019).The prioritization was assessed by calculating the frequency of the topic being mentioned in the print edition and by taking into account the nature of the communication, the highest being the analytical article and the lowest - the note. The most pressing issues highlighted on the pages of the weekly were the following topics:
1. The level of rent and redemption prices for urban real estate;2. Abundance of control checks and coordination procedures in supervisory bodies;3. The inability of business structures to resist illegal actions of law security services that limit business opportunities;4. Corruption in government.
The allocation of thematic blocks of the problems of interaction between business and government, covered in the media, allows us to diagnose the contradictions between the parties that are specific to modern Russia. The resolution of these contradictions can be carried out in the form of model agreements fixing the area of intersection of the interests of the government and the business community.

ECONOMICS
14
The publication topics identified in the study can be divided into three groups corresponding to the axes of interaction identified above. The mode operation displays the current activities of the authorities and business communities in the framework of the fulfillment of their obligations without the need to bring this interaction to a higher level. The publication topics included in this group actualize the ability of the authorities to create conditions for the creation and support of existing business communities, resolve or overshadow the emerging differences, make decisions to correct crisis situations. The position of the authorities in relation to business in this case is neutral, aimed at forming long-term rules and following them.The mode operation (functions-arbitration, regulation) is represented by such topics as:Setting the rent rate for land, the determining of purchase price of real estate; The entry of the regional debris operator into the regional market; Declaring bankruptcy;Discussions on the regulation of street trade (holding a tender for the construction of shopping malls);Fulfillment of obligations by foreign companies (China national chemical engineering company);Problems of regulation of cemetery business.In contrast to the operation mode, the Development mode assumes positive expectations of business from the government, being focused on publication topics that reflect the active actions of the government to increase the entrepreneurial activity of citizens, the promotion of some enterprises or industries on qualitative new level . The Development mode (functions - assistance, support) “ is represented by the following topics :Introduction of concession mechanism in the construction of social facilities;Support of some enterprises of public importance (Omskelektro, “Heat company, etc.);Development of self-employment; The provision of incentives for small businesses; Development of the entrepreneurship support Fund.A special place in the model of interaction between business and government is given to the mode”Institutional stability”, in which the most debated problems in the social discourse are concentrated and where the authorities have a limiting influence on their counterpart. Here the government manifests itself as the Supreme regulator, establishing patterns of sanctioned and unauthorized behavior of regulated entities, setting current precedents and demonstrating the reaction of the authorities to the existing rules.The mode “Institutional sustainability (control functions, sanctions)” consists of the following topics: Theft from the accounts SRO (Self-regulating organizations) “First Guild of builders” Stinko (insurance of civil liability of participants of participatory construction, “the case of Matzilevich»);Civil liability of participants in participatory construction;Influence of security services on the state of business in the regionFiscal discipline.The themes covered in this Newspaper were divided between 4 message types as follows (table 1):

ECONOMICS
15
Table 1. The division of thematic blocks by message types
Thematic block Message types
Analytical articles
Reports Interviews Small notes
OperationSetting the rent rate for land, the determining of purchase price of real estate;
8 8 12 14
The entry of the regional debris operator into the regional market;
5 4 14 14
Declaring bankruptcy; 6 6 12 16Discussions on the regulation of street trade (holding a tender for the construction of shopping malls);
4 4 9 8
Fulfillment of obligations by foreign companies (China national chemical engineering company);
2 4 4 6
Problems of regulation of cemetery business. 2 3 4 4DevelopmentIntroduction of concession mechanism in the construction of social facilities;
3 5 6 6
Support of some enterprises of public importance (Omskelektro, “Heat company, etc.);
2 3 4 4
Development of self-employment; 1 3 3 3The provision of incentives for small businesses;
1 1 2 2
Development of the entrepreneurship support Fund.
2 2 3 3
Institutional sustainabilityTheft from the accounts SRO (Self-regulating organizations) “First Guild of builders” Stinko (insurance of civil liability of participants of participatory construction, “the case of Matzilevich»);
6 10 8 6
Civil liability of participants in participatory construction;
2 4 4 3
Influence of security services on the state of business in the region
3 5 5 7
Fiscal discipline. 3 4 8 6
Analysis of the intensity of coverage of the above topics, carried out by calculating these topics by types of publications, showed that the greatest interest in the pages of the newspaper caused the mode of operation. The dominant role of the mode of operation in the interaction of business and government is determined mainly by the fact that the results of the study revealed the instability of the institutional structure and the unwillingness of government and business to change anything

in it. The main efforts to improve this interaction were made mainly within competence of the regional authorities, that need of tax revenues from business structures. Therefore, the first place of public discussions in the media are the issues of economic feasibility of rental rates for state and municipal property or methods of regulation of some industry markets (primarily trade).The extremely low degree of actualization is demonstrated by the axis of development, which has not received decent coverage on the pages of the weekly. The low capacity of the regional authorities to support entrepreneurship significantly contain this vector of interaction. Typical in this regard is the example of the use of the concession mechanism in the construction of the cinema “Pervomaisky”, the legal controversies on the opening of which scared off the business from turning to this mechanism. The analysis of publications revealed a significant deficit in obtaining ideas about promising forms of doing business and ways to stimulate the corporate sector.The vector of institutional stability can be measured by the number of topical stories about the inability (unwillingness) of the current legislation and existing social institutions to regulate various spheres of entrepreneurial activity. The weakness of the institutional stability factor is manifested in the lack of effective measures that can be taken by the local authorities in the framework of the protection of local enterprises due to contradictions in Federal legislation, the influence of large holding structures, the inefficiency of the judicial system, etc. That institutional instability made possible the updating of the “case of Matzilevich”, the coverage which the media was given a large number of publications. The peculiarity of this case was the lack of a number of necessary regulators that would limit the possibility of extracting the benefits of unscrupulous entrepreneurs from the accumulation of funds for insurance needs.
CONCLUSION
Thus, our analysis allowed us to reconstruct the structure of interaction between government and business through its actualization in the printed business weekly. This technique made it possible to understand the negative trends in the development of the business environment recorded by statistical documents and to compliment the reconstruction with verbal ways of updating information about the forms of such interaction. Print media currently perform the most important function of translating the attitudes and expectations of society, and the stories placed on their pages, act as a picture of the real problems faced by the subjects in their daily lives. The model of interaction between business and government developed in the framework of the study provides an opportunity to structure the problems of interaction between the leading contractors of social relations, as well as to regularly assess changes in public expectations and the relevance of problematic issues.3-d model has a universal character for the analysis of the interaction between business and government and can be used as the instrument of diagnostics of the state of interaction between business and government. The definition of numerical values for each of the 3 axes of the presented model, that attests to the actualization of some form of thematic block, gives the opportunity to the government to adjust the policy in the field of business facilitation, to find adequate measures for increasing of quality of such interaction
ECONOMICS
17
REFERENCES
[1] Bogachev M. I. (2011) Splicing as the oldest mechanism of dialogue between government and business in Russia. Business. Society Power. No. 6, 74-83. (In Russian)[2] Galitsky E., Levin, M. (2007). Corruption in the relationship between business and government (the case of empirical analysis). Problems of Economics.. No. 1,17-32 (In Russian)[3] Oleynik A. (2011). Political Economy of power: approaches to the analysis of relations between the state and business in Russia. Questions of economy. No. 5, 19-33 (In Russian)[4] Barysheva G.A., Nekhoroshev Yu.S. (2005) Government and business: legal and criminal mechanisms of interconnection. News of TPU.. No. 6, .203-206 (In Russian)[5] Butova T.V.,. Erkhov M.V. (2007) Government and business in modern society, Moskow, Maroseyka, (In Russian)[6] Shevchenko E.A. (2017) The role of public-private partnership in the system of interaction between business and government. Economics and Management: Problems and Solutions.. No 3 (3), 13-17 (In Russian) [7] Alieva T. (2017) Model of the interaction of Government and business in the field of environmental management in the Russian Arctic. Problems of theory and practice of management.. No 1, 19-25 (In Russian)[8] Government and Business in Russia: Interaction in a Crisis: Monograph / Ed. A.N.Shokhin. [2016], Moskow, SU-HSE (In Russian) [9] Government and business: communication resources (2011). Collection of scientific articles. Series “Communicative research”, Issue 5, Moskow, HSE (In Russian) [10] Jawahar I. M., McLaughlin G. L. (2002). Towards a descriptive stakeholder theory: An organizational life cycle approach. Academy of Management Review 26 (3): 397-414.[11] Business mortality: in 2018 in Russia closed twice as many companies than opened: June 6, 2019, from https://finexpertiza.ru/press-service/researches/2019/smertnost-biznesa-za-2018/ (In Russian)[12] Little and slowly. (2015). Rossiyskaya Gazeta, from https://rg.ru/2015/04/14/dola.html]. (In Russian)[13] Newman L. (1998) Nonreactive research and available data / / Sociological researches. No. 6, 119-129 (In Russian)[14] Sablin K. S. (2012) The role of the institutional environment in the formation of development institutions. Journal of institutional studies (journal of institutional studies), Volume 4, No 2. 2012, 32-42 (In Russian)[15] North, D.(1998). Five Propositions about Institutional Change // Explaining Social Institutions / Ed. by J. Knight and I. Sened. Michigan: The University of Michigan Press, 15-27[16] Mannheim George.B., Rich R. K. (1997) Political Science: research methods: TRANS. Moskow, the whole world (In Russian)[17] Borishpolets K. P. (2005) Methods of political research: Studies. Manual for students. Higher educational. Moskow, Aspect press (In Russian)
Internet source:[1] www.bbc.com/russian/rolling_news/2013/07/130725_rn_china_growth_boost.shtml[2] Newspaper”Commercial news” http://kvnews.ru/

ECONOMICS
18

19
Volume 7, No.2 2019ISSN 2303-5005
ABSTRACT
The review intends to research the green advertising practices and its consequences for the client’s image inclination in sustenance segment of Pakistan.Design/methodology/approach- Data is gathered by using 5 point scale through strongly disagree to strongly agree .it include 15 items about respondents graphics It contains questions about demographics, green brand image, environment concern, green brand awareness, and green brand preferences. The data was collected from different Universities (G.C University, University of Punjab, University of Engineering and Technology) in Lahore Pakistan. In this study cluster sampling is used.Findings- This study shows significant results with respect to green brand preference and its critical characteristics of student brand awareness. This study concluded that the importance of green brand elements (green brand image, environment concern, on green brand awareness, H1 H2 H4.H4 are accepted.Originality - Past writing recommends an Essential association among green showcasing and purchaser mark inclinations yet in Pakistan there is an absence of such examination. So to fill this hole this exploration is led by utilizing quantitative procedures. We circulate poll 60 shoppers and capability of sustenance segment on the premise of accommodation examining to get the outcomes with regards to Pakistan.
IMPACT OF GREEN PRACTICES ON BUYING HABITSIN PAKISTAN’S FOOD SECTOR
Rana Adeel Jafar1, Aiza Shabbir1, Farzana Kousar1
date of paper receipt:04.07.2019.
JEL M31L66 L17 L1 K23
Review Article doi:10.2478/eoik-2019-0012 UDK: 641:339.13]:334.72.021(549.1)
date of sending to review: 08.07.2019.
date of review receipt:26.07.2019.
1Department of Economics, Superior University-Raiwind Road Lahore, Pakistan
Keywords:Green brand image, Environmental concern, Green brand awareness, Green brand preferences.

ECONOMICS
20
INTRODUCTION:
Green advertising is one of the most recent showcasing ideas. It has possessed the psyche and creative energy from the late twentieth century. It is a more up to date idea of showcasing to speak with clients by getting a handle on their consideration through making them understand that it is so imperative to protect nature. What’s more, that everybody must be a section in doing as such and the piece of a shopper is to utilize green items and bolster and incline toward the brands that are becoming environmentally viable and are doing endeavors to make this world a more secure place for all of us. The relating impacts of Green showcasing are more secure condition, clients concern, and more client fascination. By advancing these organizations pass on their message to clients in an all the more persuading way. Green advertising includes numerous business practices which mean satisfy shopper request additionally decreased the awful impact on the common habitat.Green advertising additionally considers to an association that puts its battles into supporting, estimating, and dispersing products with eco-concerns. Around the globe there are resorts that are beginning to propel themselves as “ecotourism” workplaces, i.e., workplaces that “rehearse” in experiencing nature or working in a way that limits their environmental impact. In the more amplified term, the journey for viability will ask for fundamental changes to the organization perspective which underpins publicizing and exchange business limits. The establishments of green publicizing can be taken after back to the inundation of normal stress of the 1970s which created the ‘natural advancing’ thought.
1. OBJECTIVES OF THE STUDY
• To identify the effects of Green brand image on consumer brand preference.• To Measure the relation of environmental concern and green brand preferences.• To find the effects of Green brand awareness on customer brand preferences.
2. LITERATURE REVIEW
Despite appearing in the mid-1980s, it is only now that greenwashing is mostly accepted, and people seem to relate it to the practice of exaggerated and undeserved claims of environmental friendliness to gain higher market shares (Mukherjee and Ghosh, 2014). Greenwashing is described as the practices of companies over claiming the environmental functionality of their green product or brand that cannot be sustained (Parguel et al., 2011).Apart from that, it hurts brand image creating doubt among consumers about green marketing activities of the company (Polonsky et al., 2010). Companies try hard to enhance brand loyalty for increasing the sale of their green products or brands by improving functionality (Chen, 2013).Schubert, Kandampully, Solnet, and Kralj (2010), stated that foodservice manufacturing can have a destructive effect on the environment by the giving those products which clean up the surroundings; excessive use of water; non-recyclable commodities and uncreative procedures of reproducing; consumption of harmful chemical substances in our products can have adverse effects on the environment. Brand Preference Newing (2011). Worldwide, 74 % customers declared they are green or desire for green environment friendly foodstuffs. Vermeir & Verbeke (2004) sustainable manufacturing and utilization is improved at all stages of cultivation and foodstuff will boost the potential influence of sustainability retains on buyer choice for buying” Sustainable products are encouraged by highlighting individual consequence and significance to individual. Various consumers reveal that sustainable foodstuff is healthier as flavor; feature, protection, and originality are measured (Vermeir & Verbeke, 2004). Customers favor those hotels which approve green practices; for the reason they increase green practices, customers will build up a taste for them as well as they get awareness about those hotels which apply green practices (Manaktola & Jauhari 2007).

ECONOMICS
21
Consumers are appreciably aware of green commodities; but the performance of the attribute functioning is an elusive task to do with by the application of green marketing (Juwaheer, 2005). The ecological impact of green stratagem is clear to the society due to which government has changed its laws as a result of which the demand of consumer has also changed; as fallout, there’s greater stress on the firms (Anonymous, 2014). Cherian & Jacob (2012) derived that customers lack green awareness and because of this less awareness, firms are still not spotlighting towards expansion of green products. Consumers are enthusiastic to give for commodities that are mutually and economically in command (Kalafatis& Pollard, 1999).Environmental concern promotes individual’s uncertainties, kindheartedness, similar to and dissimilar as regards to the surroundings which are corresponded through a quality (Yeung, 2005). When customers have a greater concern regarding the atmosphere, than greater number of consumers is agreed to pay for environment friendly products having little products that have a less injurious impact on the atmosphere (Peattie, 1995).Men are less fearful concerning ecological problem than are women (Mostafa, 2007). Stern, Dietz, and Kalof, (2005), Women as compared to men, focus on those standards of the products that are going green. Bang, Alexander, John, and Traichal, (2000) disclosed in their learning that customers who have greater concern about the atmosphere are willing to pay more for environmentally friendly products as compared to those consumers who have less concern regarding the atmosphere. Dunlap (1994) declared that residents of Asia have a negative perception about their environment of their locality as compared to that of the other countries such as Europe. Moser &Uzzell (2003), for instance, contend that audience’s perception of the seriousness of the pollution the media’s interpretation of pollution levels have an effect on problems.Chen (2009) has prepared a theoretical sketch which represents the Green Brand Image, Green Satisfaction and Green Trust can enhance the green brand equity. Brand image is the judgment in the attitude of the consumer associated with the contribution. Product quality of firm desires to be enhanced with the intention to get a positive position among the competitors. Olsen (2002) stated that the extent of overall satisfaction experienced by a consumer is the fulfillment which is derived from the implementation of customer’s necessities, requirements, and expectation by the brand. With distinctive feature of goods can discriminate the company’s goods from their pretender (Parasuraman, Zeithaml, and Berry, 1988).Benefits for foodservice establishments of going green include the encouragement of a brand image in optimistic way that provides uniqueness over other restaurants in their segment, (Graci & Dodds, 2008).Adapted from (Mourad & Ahmed, Perception of the green brand in an emerging innovative market, 2012) Model suppose that there is direct link between green brand preference as dependent variable and green practices as independent variable with additional sub independent as green brand image, green brand awareness, and environmental concern.Green Brand Preference shows that how much people will prefer green products over conventional product. It is a dependent variable which tells how much it is depending on independent variable and its dimensions.

ECONOMICS
22
3. RESEARCH MODEL
4. HYPOTHESIS FORMULATION
H1: There is a significant relationship between Green Awareness and Consumer’s Brand Preference.H2: There is a significant relationship between environmental concern and Consumer’s Brand Preference.H3: There is a significant relationship between green brand image and Consumer’s Brand Preference.Methodology: Data is gathered by using 5 point scale through strongly disagree to strongly agree .it include 15 items about respondents graphics It contains questions about demographics, green brand image, environment concern, green brand awareness, and green brand preferences. The data was collected from different Universities (G.C University, University of Punjab, University of Engineering and Technology) in Lahore Pakistan.
5. SAMPLING TECHNIQUE
The population of this study is 350 students from different Universities (G.C University, University of Punjab, University of Engineering and Technology) in Lahore Pakistan. In this study, cluster sampling is used in which the population is divided into different groups known as clusters after this population is selected randomly from these clusters. In this sampling technique population is mutually homogeneous while internally heterogeneous.

ECONOMICS
23
5.1. EMPIRICAL FINDING
Table 1 Missing Value Analysis Variables N Count PercentageGreen Brand Awareness 350 0 .0Green Brand Awareness a 349 1 .3Green Brand Awareness b 350 0 .0Green Brand Awareness c 347 3 .3Green Brand Awareness d 345 5 1.4Green Brand Awareness e 349 1 .3Environmental Concern 344 6 1.7Environmental Concern a 350 0 0Environmental Concern b 349 1 .3Environmental Concern c 345 5 1.4Environmental Concern d 348 2 .6Environmental Concern e 348 2 .6Green Brand Image 347 3 .3Green Brand Image a 345 1 1.4Green Brand Image b 350 0 0Green Brand Image c 347 3 .3Green Brand Image d 348 2 .6Green Brand Image e 348 2 .6Green Brand Preference 347 3 .3Green Brand Preference a 348 2 .6Green Brand Preference b 347 3 .3Green Brand Preference c 348 2 .6Green Brand Preference d 347 3 .3Green Brand Preference e 348 2 .6Age 347 3 .3Marital status 345 5 1.4Economic class 344 6 1.7

ECONOMICS
24
5.2. FREQUENCY TABLE
Frequency of the data is used to explain the quantity of the data. It explains the demographic data more precisely that how much data contain on male and female when under discussion demographic characteristics is gender.Demographic profile of respondents:385 items are divided to star 350 questionnaires completed by the respondent which shows 92% efficiency. This able consist of respondent information. Universities (G.C University, University of Punjab, University of Engineering and Technology) in Lahore Pakistan
Table 2.
Respondents Demographics Frequency Percentage %Gender(N=347)MaleFemale
42.0147
5842
occupation(N=350)EmployedUnemployed
88262
25.174.9
Age(N=346)Below2021-2526-3031-3536-40Above40
10122508020708
28.964.22.20.62.02.3
Marital status (N=345)MarriedSingleDivorcedWidow
422980307
12850.82.0
Economic class(N=340)UpperUpper middleMiddleLower middleLower
831091042826
23.731.729.78.07.4
The table shows that out of 347 respondents 147 (42%) are males and 420 (58%) are female; three respondents did not provide any information regarding their gender. Of the 350 respondents 101 (28.9) are below the age of 20 years, 225 (64.2%) are within 21-25 years, 08 (2.2) are within 26-30 years, 02(0.6) are in the age group of 31-35, 07 (20) are in the age of 36-40 and 08 (2.3)are aged above 40. 346 give their information on the basis of their occupation: 88 (25.1%) are employed, 262 (74.9).Of the 350 respondents,345, provided information on their marital status: 42(12%) are married, 298 (85%) are single.03 (0.8) are divorced and 07(2.0%) are widow. Out of 350 respondents 341provided information on the basis of their economic class: 83(23.7) are from upper class, 109(31.7%) are from lower middle class, 104(29.7) are from middle class, 28(8.0%) from lower middle class 26(7.4) belongs from lower class.

ECONOMICS
25
Table 3. Respondent profile
Items N Min Max Mean Std.DvI have heard of environment friendly products. 347 1.00 4 2.47 1.03If you notice the environmental label on brand you’ll prefer to use it
345 1.00 4 2.92 0.97
Environmental advertisements play their role to make me aware of green brands.
350 1.00 5 1.7 1.02
Newspaper and magazine are also a source of awareness regarding green brands.
348 1.00 5 2.1 0.82
I get awareness about green brands from friends and relatives.
347 1.00 5 2.04 0.96
I’m more concerned about protection of environment.
342 1.00 5 2.10 0.97
I would describe myself as environmentally responsible.
342 1.00 5 2.200 0.96
Environmental degradation has risen in last decade
339 1.00 5 2.18 0.94
Environmental protection will help people have better quality of life.
347 1.00 5 2.03 0.90
Organizations promoting green products are concerned about the environment.
349 1.00 5 2.06 0.94
Branded products satisfy my expectations about environment safety.
345 1.00 5 2.05 0.93
Packaging of Well-known branded products is recyclable.
346 1.00 5 2.06 0.92
The brand’s environmental repute is handled appropriate manner.
348 1.00 5 2.29 1.04
Quality of organic products is better than conventional products.
348 1.00 5 2.12 0.91
The brand is successful in its environmental performance.
347 1.00 5 2.25 1.10
I prefer to buy those brands which are environment friendly.
338 1.00 5 2.200 0.96
I prefer to buy products of those companies who have “Green certification”
339 1.00 5 2.18 0.94
I prefer to consume green products because they increase my prestige.
339 1.00 5 2.04 0.90
I prefer green products over conventional products.
346 1.00 5 2.10 0.92
I prefer green products because they are easy to dispose of.
342 1.00 5 2.06 1.00
ECONOMICS
26
6. RESULTS AND ANALYSIS
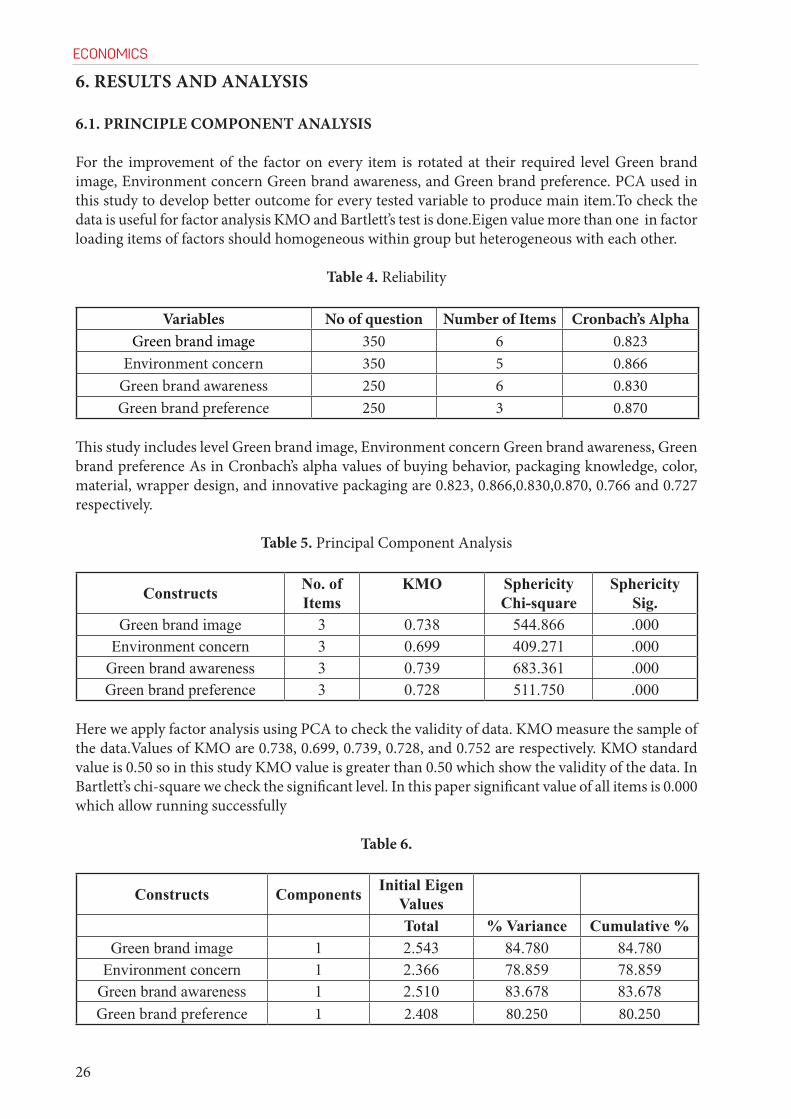
6.1. PRINCIPLE COMPONENT ANALYSIS
For the improvement of the factor on every item is rotated at their required level Green brand image, Environment concern Green brand awareness, and Green brand preference. PCA used in this study to develop better outcome for every tested variable to produce main item.To check the data is useful for factor analysis KMO and Bartlett’s test is done.Eigen value more than one in factor loading items of factors should homogeneous within group but heterogeneous with each other.
Table 4. Reliability
Variables No of question Number of Items Cronbach’s AlphaGreen brand image 350 6 0.823
Environment concern 350 5 0.866Green brand awareness 250 6 0.830Green brand preference 250 3 0.870
This study includes level Green brand image, Environment concern Green brand awareness, Green brand preference As in Cronbach’s alpha values of buying behavior, packaging knowledge, color, material, wrapper design, and innovative packaging are 0.823, 0.866,0.830,0.870, 0.766 and 0.727 respectively.
Table 5. Principal Component Analysis
Constructs No. of Items
KMO Sphericity Chi-square
Sphericity Sig.
Green brand image 3 0.738 544.866 .000Environment concern 3 0.699 409.271 .000
Green brand awareness 3 0.739 683.361 .000Green brand preference 3 0.728 511.750 .000
Here we apply factor analysis using PCA to check the validity of data. KMO measure the sample of the data.Values of KMO are 0.738, 0.699, 0.739, 0.728, and 0.752 are respectively. KMO standard value is 0.50 so in this study KMO value is greater than 0.50 which show the validity of the data. In Bartlett’s chi-square we check the significant level. In this paper significant value of all items is 0.000 which allow running successfully
Table 6.
Constructs Components Initial Eigen ValuesTotal % Variance Cumulative %
Green brand image 1 2.543 84.780 84.780Environment concern 1 2.366 78.859 78.859
Green brand awareness 1 2.510 83.678 83.678Green brand preference 1 2.408 80.250 80.250
ECONOMICS
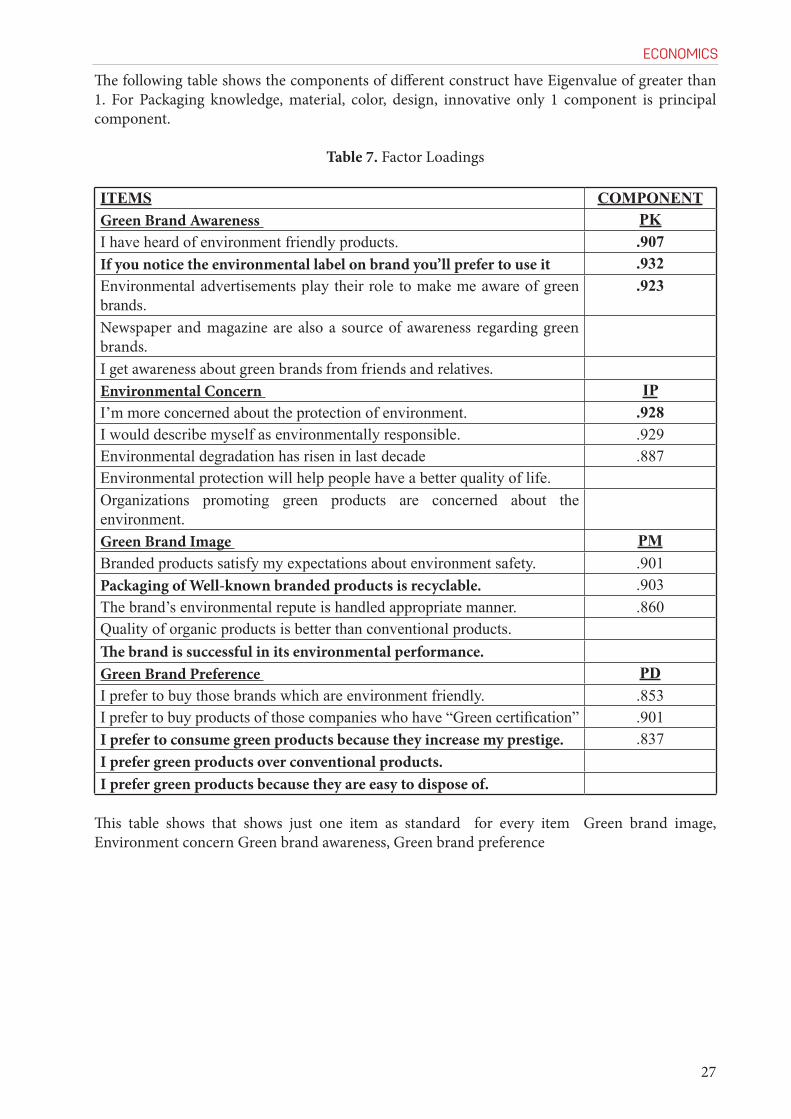
27
The following table shows the components of different construct have Eigenvalue of greater than 1. For Packaging knowledge, material, color, design, innovative only 1 component is principal component.
Table 7. Factor Loadings
ITEMS COMPONENTGreen Brand Awareness PKI have heard of environment friendly products. .907If you notice the environmental label on brand you’ll prefer to use it .932Environmental advertisements play their role to make me aware of green brands.
.923
Newspaper and magazine are also a source of awareness regarding green brands.I get awareness about green brands from friends and relatives.Environmental Concern IPI’m more concerned about the protection of environment. .928I would describe myself as environmentally responsible. .929Environmental degradation has risen in last decade .887Environmental protection will help people have a better quality of life.Organizations promoting green products are concerned about the environment.Green Brand Image PMBranded products satisfy my expectations about environment safety. .901Packaging of Well-known branded products is recyclable. .903The brand’s environmental repute is handled appropriate manner. .860Quality of organic products is better than conventional products.The brand is successful in its environmental performance. Green Brand Preference PDI prefer to buy those brands which are environment friendly. .853I prefer to buy products of those companies who have “Green certification” .901I prefer to consume green products because they increase my prestige. .837I prefer green products over conventional products. I prefer green products because they are easy to dispose of.
This table shows that shows just one item as standard for every item Green brand image, Environment concern Green brand awareness, Green brand preference

ECONOMICS
28
Table 8. Correlation Analysis:
Variables Green brand image
Environment concern
Green brand awareness
Green brand preference
Green brand imageSig. ( 2 tailed)N
1
350
.039
.464350
.461**.000350
.719**.000350
Environment concernSig. ( 2 tailed)N
.039
.464350
1
350
.131*.014350
.050
.353350
Green brand awarenessSig. ( 2tailed)N
.461**.000350
.131*.014350
1
350
.549**.000350
Green brand preferenceSig. ( 2 tailed)N
.719**.000350
.719
.000350
.549**.000350
1
350
Correlation shows the strength of the relationship between variables. It can be perfect positive +1 to perfect negative -1.
Table 9.
Coefficient range Strength.00-.19 Very week.20-.39 Weak.40-.59 Moderate.60-.79 Strong.80-1.0 Very strong
As shown in the table There is an insufficient weak linear relationship of there is significant linear relationship Green brand image, Environment concern Green brand awareness, Green brand preference.There is a very strong correlation Environment concern Green brand awareness.H1: There is a significant relationship between Green Awareness and Consumer’s Brand Preference.H2: There is a significant relationship between environmental concern and Consumer’s Brand Preference.H3: There is a significant relationship between green brand image and Consumer’s Brand Preference.
Table 10. Regression Analysis
Regression Un standardizedCo-efficient
CoefficientError Standard
T value Sig
Constant -7.064E-18 .028 .000 .000Green brand image .306 .49 6.263 .000
Environment concern .90 .028 3.230 .001Green brand awareness .001 .034 .027 .978Green brand preference .274 .047 5.806 .000

ECONOMICS
29
The following table shows that there is significant and positive relationship. Green brand image, Environment concern Green brand awareness, Green brand preference.
Table 11. Necessary Statistics
R2 Adj. R2 F-statistics Prob.(F-statistics).859 .739 194.429 .000
Adjusted R2 = .739 in this case which means that impact of product packaging on student buying behavior is explained variance 73%. F-test (F statistics =194.429 p-value = 0.00) means that all independent variable effect on dependent variable is significant and our model is a good fit.H1: There is a significant relationship between Green Awareness and Consumer’s Brand Preference.H2: There is significant relationship between environmental concern and Consumer’s Brand Preference.H3: There is a relationship between green brand image and Consumer’s Brand Preference.
CONCLUSION AND RECOMMENDATIONS
This study shows significant results with respect to green brand preference and its critical characteristics of student brand awareness. This study concluded that the importance of green brand elements (green brand image, environment concern, on green brand awareness, H1 H2 H4.H4 are accepted.H1: There is a significant relationship between Green Awareness and Consumer’s Brand Preference.H2: There is a significant relationship between environmental concern and Consumer’s Brand Preference.H3: There is a significant relationship between green brand image and Consumer’s Brand Preference.
THEORETICAL LIMITATIONSThis study has a limitation on selected little sample size with dead timeline. The student is in negligence mode while completing questionnaire .This study performed in only Universities (G.C University, University of Punjab, University of Engineering and Technology) in Lahore Pakistan
PRACTICAL IMPLICATIONThis study is applicable for the manufacturers and managers they must take in view green brand awareness when introducing products in the market.If they take poor in strategy and products may destroy in market. It is very necessary for managers to involve all green brand awareness to create student awareness and policies to attract student
FUTURE RECOMMENDATIONSThis study is used on constraint timeline in the city Universities (G.C University, University of Punjab, University of Engineering and Technology) in Lahore Pakistan due to small resources of money. In next-generation population sample size can be wide for accurate output to develop green brand awareness to capture student awareness about green brand.

ECONOMICS
30
REFERENCES
[1] Chen, Y.-S. (2008), The driver of green innovation and green image – green core competence, Journal of Business Ethics, (81).[2]Chen, Y.-S. (2010), The drivers of green brand equity green brand image, green satisfaction, and green trust, Journal of Business Ethics, (93).[3]Dunlap, R.E. (1994), (International attitudes towards environment and development), in Bergesen, H.O.[4] Parmann, G. (Eds), Green Globe Yearbook of International Co-operation on Environment and Development 1994, Oxford University Press, Oxford.[5] Parasuraman, A., Zeithaml, V.A. and Berry, L.L. (1988), (SERVQUAL: a multiple-item scale for measuringconsumer perceptions of service quality), Journal of Retailing.[6] Peattie, K. (1995), Environmental Marketing Management, Pitman Publishing, London.[7] Nik Abdul Rashid, N.R. (2009), (Awareness of eco-labelin Malaysia’s green marketing initiative), International Journal of Business and Management.[8]Newing, R. (2011), (Environment: long-term impact ofgreen issues played down), Financial Times, 18 May.[9] Parmann, G. (Eds), Green Globe Yearbook of International Co-operation on Environment and Development 1994, Oxford University Press, Oxford.[10] Bang, H., Alexander, E., John, H. and Traichal, P.A. (2000), (Consumer concern, knowledge, belief, and attitude toward renewable energy: an application of the reasonedaction theory) Psychology and Marketing, (17)[11] Crispell, D. (2001). Going Green. Public Perspective, September/October 2001.[12] Vermeir, Iris, and Wim Verbeke (2004), (Sustainable Food Consumption: Exploring the Consumer “AttitudeBehavioral Intention” Gap), Journal of Agricultural and Environmental Ethics,19 (October).[13] Olsen, S.O. (2002), (Comparative evaluation and therelationship between quality, satisfaction, and repurchase loyalty), Journal of the Academy of Marketing Science, (30).[14] Dunlap, R.E. (1994), (International attitudes towardsenvironment and development), in Bergesen, H.O. and Parmann, G.[15] Graci, S. and Dodds, R. (2008), (Why go green? Thebusiness case for environmental commitment in theCanadian hotel industry), Anatolia, (19) .[16] Moser, G. and Uzzell, D. (2003), Environmentalpsychology, in Weiner, I.,Millon, T. and Lerner,M. (Eds), Handbook of Psychology, Personality and Social Psychology, JohnWiley& Sons, Inc., Hoboken, NJ.(Mourad & Ahmed, Perception of green brand in an emerging innovative market, 2012)[17] Newing, R. (2011), (Environment: long-term impact ofgreen issues played down), Financial Times, 18 May.

31
Volume 7, No.2 2019ISSN 2303-5005
ABSTRACT
The main purpose of the paper is to address the effects of digital transformation in the telecommunications markets which are characterized by network externalities. By acknowledging disruptive effects of digital transformation age, the paper highlights challenges which were created by advancement of technological capabilities. The specific aim of the paper is to present a methodological framework for measuring the information society. The research will be based on an analysis of the number of subscribers by types of telecommunication services, in developed and developing countries, in the last two decades. In this regard, increasing the number of subscribers leads to higher value of the selected network. We expect confirmation of both hypotheses respectively (H1: Digital transformation affects the simultaneously continuous growth of the number of subscribers and the continuous decline in prices of telecommunication services; H2: There are similar trends in developed and developing countries, which are related to the number of the telecommunication services subscribers). Therefore, digital transformation and the effect of network externalities contribute to increasing the number of subscribers, reducing the number of networks (distortion of the market competition) and reducing the prices of telecommunication services.
EFFECTS OF DIGITAL TRANSFORMATION AND NETWORKEXTERNALITIES IN THE TELECOMMUNICATION MARKETS
Snežana Radukić1, Zoran Mastilo2, Zorana Kostić3
date of paper receipt:11.05.2019.
JEL: D47, O33
Original Article doi: 10.2478/eoik-2019-0019 UDK: 621.391:004.738.5
date of sending to review: 13.05.2019.
date of review receipt:21.05.2019.
1 University of Niš, Faculty of Economics, Serbia2 University of East Sarajevo, Faculty of Business Economy, Bijeljina, Bosnia and Herzegovina3 University of Niš, Faculty of Science and Mathematics, Serbia
Keywords:Digital Transformation, Network Externalities, Telecommunication Markets, Subscribers, Prices

ECONOMICS
32
INTRODUCTION
Network effects are a very often discussed phenomenon in the literature. Despite strong empirical support on network effects generally, there is a need to measure, evaluate their influence and operationalization in digital environments where customer satisfaction and new revenue streams driving digital transformation. Thanks to digital transformation, networks are becoming increasingly complex, as well as the services delivered by them. Subscribers expect a network which will meet their needs and offer innovative digital services. 5G is expected to play a key role in digital environments, enhancing citizens’ life experiences and creating new business opportunities. The high speeds and low latency promised by 5G will accelerate companies into a new age of the Internet of Things (Table 1).
Table 1. Evolution of Mobile Networks
1G 2G 3G 4G 5G
Approximate deployment date 1980s 1990s 2000s 2010s 2020s
Theoretical download speed 2kbit/s 384kbit/s 56Mbit/s 1Gbit/s 10Gbit/s
Latency N/A 629 ms 212 ms 60-98 ms < 1 msSource: [1, p. 6]
In the electronic communications markets, such as telecommunications, digital changes are encouraged by rapid technological progress. The rapid development of the mobile networks of the fourth generation (4G), was marked the electronic communications market in the first and the second decade of the 21st century. The fifth generation (5G) networks will be characteristic for the post 2020 period. Variations in the adoption of new technology by companies operating in a network-based industry, such as telecommunications, could be explained as a function of three network effects: 1. the conversion effect (driven by operations-related increasing returns to scale); 2. the consumption effect (driven by demand-side increasing returns to scale); and 3. an imitative effect. Some authors expect that the conversion effect is more strongly during earlier phases of a technology’s evolution[2].According to[3], ten guiding principles of a digital transformation are:Stage 1 Defining value: 1. Secure senior management commitment; 2. Set clear, ambitious targets; 3. Secure investmentStage 2 Launch and acceleration: 4. Start with lighthouse projects; 5. Appoint a high-caliber launch team; 6. Organize to promote new, agile ways of working; 7. Nurture a digital cultureStage 3 Scaling up: 8. Sequence initiative for quick returns; 9. Build capabilities; 10. Adopt a new operating model.Network externalities present the effects on a user of a product (service) of others using the same or compatible products (services). If the benefits or marginal utility are an increasing function of the number of other users, there are positive network externalities. On the other hand, if the benefits are a decreasing function of the number of other users, there are negative network externalities. The concept of network externalities can be presented graphically. If the economic agents behave rationally, they choose the amount of services which will maximize their profits by equlizing the marginal costs to marginal benefits. In the absence of externalities, the optimizing quantity corresponds to the lower equlibrium price. The total marginal beneft received by the network subscriber is higher than this level. Every subscriber that joins the network receives additional benefits created by other subscribers, including future subscribers. The distance AB shows the value of additional benefits generated by the network externalities (Figure 1).

ECONOMICS
33
Figure 1. Network Externalities and the Battle for Critical Mass
Source:[4]
In the digital economy, value comes from plenty: if something is more demanded and more expected to be demanded, it becomes more valuable. Expectations are so important in driving demand, so a point where the momentum is so overwhelming that success becomes a runaway event is known as a ”winner-takes-all” phenomenon (Figure 1).The electronic communications market is crucial infrastructure sector which directly or indirectly, affects the development of all other sectors in one national economy. This sector includes: mobile telecommunications market, fixed telecommunication market, internet market, and media market, which refers to the distribution of media contents. Some of the main characteristics of these markets are: large fixed costs and very low, close zero, marginal costs, large capital investments, constant innovation in supply side, and shorter life cycle of service. Investing in the development of this markets can accelerate the development of society as a whole, regardless it is a developed country or a developing country[5, p. 226-227].The paper is organized as follows. This introductory section will be followed by a Section on the literature review and the Section on the research methodology. It sets the scene for the research results and discussion the key trends over time. The last Section provides the conclusions and gives recommendations for further research in this field.
1. LITERATURE REVIEW
One of the most commonly used measure for digital transformation is the Digitalisation Index, proposed by Sabbagh[6] and Katz and Koutroumpis[7]. It is created in order to measure the cumulative, holistic impact of discrete information and communication technologies. This index consists of sixteen indicators divided into six groups of digitalization categories: affordability, infrastructure reliability, network access, capacity, use, and human capital. Some empirical studies explore the multiplicative effects of digital transformation on business environments. In this regard, one comprehensive measure of digital convergence is consructed (Weighted Digital Convergence Indicator, WDCI). The speed of digital convergence and the size of the digital gap depend on many factors including the degree of the development of information society, the regulatory framework, the political context and the general business environment[8]. Network externalities play a central role in digital environment. In an effort to describe the demand for new networks, the critical mass phenomena, that characterize network externalities, should be especially emphasized[9]. Network externality has been defined as a change in the benefit, or surplus, that an agent derives from a good when the number of other agents consuming the same kind of good changes. This allows, in principle, the value received by consumers to be separated into two parts: the value generated by the product even if there are no other users, and the additional value derived from being able to interact with other users of the product. This latter value that is the

ECONOMICS
34
essence of network effects[10]. Bental and Spiegel[11, p. 197] proposed ”the model identifies the quality of a network product with the number of consumers using it. Hence the producer cannot unilaterally control the quality of his product. If producers can enter the market freely, market coverage with non-compatible networks will be larger. However, if there is no free entry, market coverage is larger with a single industry-wide standard”.The Table 2 gives an overview positive and negative network effects for information goods, distinguished between content and software. It can be stated that network effects are omnipresent with all information goods, but the degree or intensity of network effects differs by information good.
Table 2. Positive and Negative Network Effects for Information Goods
Information Good / Network Effects Direct Network Effects Indirect Network Effects
SoftwarePositive: Data transfer, cooperation,troubleshootingPossibly negative: Congestion
Positive: hardware, additionalprogramsPossibly negative: Viruses
ContentPositive: Communication advantagesNegative: Undesirable distribution ofexclusive information
Positive: e.g. end devices,complementary content onlineNegative: advertising, fraudulent
Product featuresthat supportnetwork effects
Integrated technologiesIntegrated communication applications
File formatsSystem interfacesSource code access (open source)
Network effects Data exchange, Information exchangeMutual support, Product evaluations
Media reviews, Additional applications and contentSoftware suppliersAccessories, Professional trainings
Source: Adapted from[12, p. 59; 13]
We have identified the following product features that encourage and support network effects: integrated technologies, integrated communication applications, file formats, system interfaces and source code access. In addition to the product features that encourage and support network effects, the following indicators specify and describe direct network effects: Data exchange, Information exchange, mutual support and product evaluations. Media reviews, additional applications and software suppliers, accessories and professional trainings are further operationalizing indirect network effects.In theory the telecommunications sector has two sector-specific characteristics: network externalities and discriminatory pricing. The estimated demand function based on a discreet consumer choice model indicates that termination-based discriminatory pricing can facilitate network expansion. Therefore, price liberalization could acelerate the development of the telecommunications network led by the private sector[14]. Chung and Yoo[15] analyse the effect of government policy on the diffusion of mobile telecommunication services in member countries of the Organization for Economic Cooperation and Development (OECD). They examine how the competition in and standard policies of each country affect cellular diffusion through interactions with positive and negative network externalities. The obtained results show that the positive effects dominate the negative effects

ECONOMICS
35
initially, the negative network externality effects become larger and outweigh the positive externality effects after a certain level of diffusion rate has been achieved. In particular, a single standard policy and the speed of technological innovation combined with the penetration rate generate a positive network externality on the diffusion of mobile telecommunications. However, a competition policy increases the rate of new subscriptions but does not generate any interacting effects[15].The latest research in this field deals with issues related to externalities between on-line contents drive telecom operators’ incentives to provide quality open internet through neutral network[16]. Also, some papers explore the role of network effects in the consumer’s choice. This contributes to the existing literature by taking a new approach which allows to analyse the impact that the immediate social network has on consumer choice in network markets. There is some evidence that individual choice of operator is influenced by the total number of subscribers for each operator, but a much stronger effect is the operator choice of other household members[17].Trifunovic, Mitrovic, and Ristic[18] have determined that users of the network with the largest market share benefit the most from call externalities. In addition, one network does not price discriminate between outgoing and incoming roaming calls, which implies that users of this network have higher level pecuniary externalities in roaming compared to users of price discriminating networks[18].The existence of positive externalities between contents and applications available on Internet and their effects on the incentives of network operators to provide neutral access, emphasize the importance of regulating this area. Net neutrality is the principle that internet service providers treat all data on the internet the same, without discrimination, which could be blocking, throttling or paid prioritization. Jaunaux and Lebourges[16] compare the economic foundations of net neutrality regulation to the actual practices of internet service providers and their incentives to discriminate or the contrary to preserve an open and neutral internet[16].The impact of policy and regulatory frameworks on the growth of markets for digital services and applications should not be ignored. Considering that the growth of digitization is primarily driven by the private sector, we point out that policy and regulatory variables are important factors and drivers of growth in the digital economy[25].
2. RESEARCH METHODOLOGY
This Section presents an overview of methodological framework, based on data collected by the International Telecommunication Union (ITU) in the period from 2001 to 2018. The following indicators were especially analyzed: Fixed-telephone subscriptions per 100 inhabitants; Mobile-cellular subscriptions per 100 inhabitants; Individuals using the Internet per 100 inhabitants. This set of indicators cover different aspects of information society. Data will be presented at the global and regional level by development status of the country. The research is based on an analysis of the number of subscribers by types of services in developed and developing countries in the last two decades. Having in mind the context of the research, the basic hypothesis are defined as follows: H1: Digital transformation affects the simultaneously continuous growth of the number of subscribers and the continuous decline in prices of telecommunication services;H2: There are similar trends in developed and developing countries, which are related to the number of the telecommunication services subscribers.The mobile-cellular subbasket refers to the price of a standard basket of mobile monthly usage for 30 outgoing calls per month (on-net/off-net to a fixed line and for peak and off-peak times) in predetermined ratios, plus 100 SMS messages. It is calculated as a percentage of a country’s average monthly GNI per capita. The mobile-cellular subbasket is based on prepaid prices, although postpaid prices are used for countries where prepaid subscriptions make up less than two per cent of all mobile-cellular subscriptions.

ECONOMICS
36
The fixed-broadband subbasket refers to the price of a monthly subscription to an entrylevel fixed-broadband plan. It is calculated as a percentage of a country’s average monthly GNI per capita for the least develop countries (LDCs). For comparability reasons, the fixed-broadband subbasket is based on a monthly data usage of (a minimum of) 1 GB. For plans that limit the monthly amount of data transferred by including data volume caps below 1 GB, the cost for the additional bytes is added to the subbasket. The minimum speed of a broadband connection is 256 kbit/s.Some authors developed[23] and implemented[24] econometric models which consist of four equations: an aggregate production function and, subsequently, three functions: demand, supply and output. In the case of mobile telecommunications, the econometric specification of the model can be presented as follows: the aggregate production function (GDP is linked to the fixed stock of capital, labour and the mobile infrastructure proxied by mobile penetration):the demand function (links mobile penetration to the average consumption propensity of individuals proxied by GDP per capita, the price of a mobile service proxied by ARPU (average revenue per user), the per cent rural population, and the level of competitive intensity in the mobile market measured by the HHI (Herfindahl Hirschman) index; the supply function (which links aggregate mobile revenues to mobile price levels proxied by ARPU, the industry concentration index of the mobile market (HHI), and GDP per capita);and the output equation links annual change in mobile penetration to mobile revenues, used as a proxy of the capital invested in a country in the same year.
3. RESEARCH RESULTS AND DISCUSSION
The results of the World Bank survey show that the significance of the telecommunication markets, which are characterized by network externalities, in the less developed countries is large and that the increase in penetration of broadband access (ie the number of subscribers per 100 inhabitants) of 10% leads to economic growth measured by growth rate of gross domestic product for 1.38%. This increase is significantly higher than developed countries can counted (1.21%)[19]. Firstly, there is upward trend in the access to and use of Information and Communication Technologies (ICT). Except for fixed-telephone subscriptions, all indicators have consistently been increasing. More importantly, penetration rates are approaching saturation levels, especially in the developed countries.
Figure 2. Global ICT Developments

ECONOMICS
37
Note: * EstimationSource: Authors’ presentation according to[20] Secondly, broadband access continues to grow strongly. In particular, the number of active mobile-broadband subscriptions keeps growing. With the global penetration rate standing at 69.3 per cent at the end of 2018, there is still plenty of room for further growth in the next period. In this regard, the fixed-broadband penetration rate also grew rapidly.
Figure 3. Number of Users per 100 Subscriptions (inhabitants) by Type of Services in Developed and Developing Countries
Notes: * Estimation. The developed/developing country classifications are based on the UN M49[21]Source: Authors’ presentation according to[20]

ECONOMICS
38
Thirdly, mobile access is becoming ever more predominant. Fixed-telephone subscriptions have been in decline for a long time, while mobilecellular telephone subscriptions keep growing, even when there are already more subscriptions than people on Earth. The world has crossed the halfway line in 2018 in terms of Internet use, with 51.2 per cent of the world population using the Internet. Nevertheless, growth rates for selected indicators have been more modest in recent years compared to the first decade of the century.This part of the paper is devoted to the latest ICT price data and affordability of three key ICT services (mobile-cellular, fixed-broadband and mobilebroadband), as well as, to the highlighting key trends over time. Information and communication technology prices have dropped globally in the last decade, in parallel with the increase in access to and use of ICT services. It is worth mentioning that improved regulation and policy-making have played a pivotal role in creating the conditions for the reduction of prices in the period 2008–2017.
Figure 4. Global Fixed-Broadband Price Basket (left axis) and Fixed-Broadband Subscriptions per 100 inhabitants (right axis)
Source:[22, p. 97]
The two vertical axes are scaled proportionally based on the 2008 values. It means that a 10 per cent increase in subscription penetration takes the same range as a 10 per cent decrease in proces.
Figure 5. Global Mobile-Cellular Price Basket (left axis) and Mobile-Cellular Subscriptions per 100 inhabitants (right axis)
Source:[22, p. 97]

ECONOMICS
39
Mobile-cellular prices has a sustained decreasing trend in the period from 2008 to 2015. From 2015, mobilecellular prices have been higher and the mobile-cellular basket (51 minutes and 100 SMS messages per month) cost on average USD 12.5 per month at the end of 2017, which is half of the average price of the fixed-broadband basket, and 35 per cent higher than the average for the handset-based mobile-broadband basket. Taking into account the above, it can be concluded that there is still room for lower mobile-cellular prices.
Figure 6. Global Mobile-Broadband Price Basket, Prepaid Handset-based 500 MB (left axis) and Mobile-Broadband Subscriptions per 100 inhabitants (right axis)
Source:[22, p. 98]
The price of a handset-based mobile-broadband basket including 500 MB per month followed a decreasing trend worldwide in the period 2013–2016. The global average was driven down by strong reductions in prices in developing countries. The price of a computer-based mobile-broadband basket including 1 GB per month followed a similar trend as the handset-based mobile-broadband basket. Despite the sustained decrease in prices in developing countries, average data allowances continued to increase.In 2017, almost all developed countries had computer-based mobile-broadband prices corresponding to less than 2 per cent of Gross National Income per capita The economic commitment that an average family in the developing world need to face to connect to the Internet at home is larger than the average share of budget allocated to ICTs in most countries (household expenditure on ICT as a percentage of total household expenditure is below 8%)[22].

ECONOMICS
40
CONCLUSION
Numerous studies have confirmed evidence of a direct network effect in a digital environment. Conducted research shed light on the number of subscribers of digital services and the prices trends, particularly with respect to national development levels. The paper shows that a total network size, measured by number of subscribers, is an important network externality factor affecting the success of a network. However, consumer’ satisfaction with network services and consumers’ surplus are additional network externality determinants. The significance of this research arises from the current debate whether digital transformation and network externalities could increase consumer welfare in telecommunications markets.Finally, the conducted research confirmed the Hypothesis 1: Digital transformation affects the simultaneously continuous growth of the number of subscribers and the continuous decline in prices of telecommunication services, as well as Hypothesis 2: There are similar trends in developed and developing countries, which are related to the number of the telecommunication services subscribers.On the one hand, digital transformation and the effect of network externalities contribute to: increasing the number of subscribers, reducing the number of networks (distortion of the market competition), and reducing the prices of telecommunication services. On the other hand, increasing the number of subscribers increases the value of the selected network.This paper summarises relevant theoretical and practical evidence about the effects of digital transformation in the telecommunications markets which are characterized by network externalities. Obtained results give a good basis for further research due to taking into account the state analysis and determines key trends in this area. In addition, it offers suggestions for measuring the information society in national economies. Finally, it suggests companies to take into account a planty digital transformation opportunities in order to increase the value of their networks. It is noted that the impact of regulatory framework on the growth of telecommunication markets is significant, so this analysis provided base for further evidence of the importance of the regulatory and institutional variable in driving digital ecosystem growth. Future research might be focused on the development of the model which examines the interplay between digital transformation and network externalities. In this sense, it would be possible to use selected variables in order to adequately describe the analyzed interdependence. Since further changes in network based sectors is expected, the issue of effects of the digital transformation will be topical in the next period.
ACKNOWLEDGEMENT
The paper is a part of the research done within the projects 44007 and 179066 funded by the Ministry of Education, Science and Technological Development of the Republic of Serbia.

ECONOMICS
41
REFERENCES
[1] International Telecommunication Union. (2018). Setting the Scene for 5G: Opportunities & Challenges 2018. Geneva. Switzerland. [2] Majumdar, S. K., & Venkataraman, S. (1998). Network effects and the adoption of new technology: evidence from the US telecommunications industry. Strategic Management Journal, 19(11), 1045-1062)[3] McKinsey&Company. (2019). https://www.mckinsey.com/industries/financial-services/our-insights/a-roadmap-for-a-digital-transformation, 20.5.2019.[4] Wiley Encyclopedia of Management 3rd edition Vol 12 Strategic Management, Chapter: Network Externalities. John Wiley & Sons. Editors: John McGee & Tanya Sammut-Bonnici. https://www.researchgate.net/figure/Winner-takes-all_fig3_280247421 (Accessed 21 May, 2019) [5] Novaković, I., Stojanović, B., & Kostić, Z. (2018). Reflection of innovations and concentration on competition in the electronic communications market. In: Western Balkans Economies in EU Integration - Past, Present and Future. CEMAFI International Association, Nice, France. (Editors: Xavier Richet, Dejan Erić, Srdjan Redžepagić, Ivan Stošić, Duško Bodroža). pp. 222-240.[6] Sabbagh, K., Friedrich, R., El-Darwiche, B., Singh, M., Ganediwalla, S., & Katz, R. (2012). Maximizing the impact of digitization. In Geneva: World Economic Forum and INSEAD, edited by Dutta, S., and BilbaoOsorio, B., The global information technology report 2012: Living in a hyperconnected world. pp. 121–134. [7] Katz, R. L., & Koutroumpis, P. (2013). Measuring digitization: A growth and welfare multiplier. Technovation, 33(10). pp. 314–319. doi: https://doi.org/10.1016/j.technovation.2013.06.004[8] Stojanović, B., & Kostić, Z. (2018). Convergence Challenges in Digital Business Environment of Western Balkan Countries. In: Digital Transformation New Challenges and Opportunities. Silver and Smith Publishers, London, UK. (Editors: Ivana Domazet, Institute of Economic Sciences, Belgrade, Serbia; Mirjana Radović-Marković, Institute of Economic Sciences, Belgrade, Serbia; Aleksandra Bradić-Martinović, Institute of Economic Sciences, Belgrade, Serbia). pp. 31-52.[9] Allen, D. (1988). New telecommunications services: Network externalities and critical mass. Telecommunications Policy, 12(3), 257-271. https://doi.org/10.1016/0308-5961(88)90024-9 [10] Liebowitz, S. J., & Margolis, S. E. (1998). Network effects and externalities. The new Palgrave dictionary of economics and the law, 2, 671-674.[11] Bental, B., & Spiegel, M. (1995). Network competition, product quality, and market coverage in the presence of network externalities. Journal of Industrial Economics, 43, 197-197.[12] Linde, F. & Stock, W.G. (2011). Information Markets: A Strategic Guideline for the I-Commerce, De Gruyter, Berlin/New York.[13] Linde, F., Kock, M., & Gorges, A. (2012). Network Effects of Digital Information Goods a Proposal for the Operationalization of Direct and Indirect Network Effects. International Journal of Business Research, 12(3), p1.[14]Iimi, A. (2007). Price structure and network externalities in the telecommunications industry: Evidence from Sub-Saharan Africa. The World Bank.[15]Chung, J. H., & Yoo, T. H. (2015). Government policy, network externalities and mobile telecommunication services: evidence from OECD countries. Applied Economics, 47(21), 2173-2183. https://doi.org/10.1080/00036846.2015.1005816[16] Jaunaux, L., & Lebourges, M. (2018). Externalities between on-line contents drive telecom operators’ incentives to provide quality open internet through neutral network. Available at SSRN 3241542[17] Birke, D., & Swann, G. P. (2004). Network effects in mobile telecommunications: An empirical analysis. J. Evol. Econ. v16 i1-2, 65-84.[18] Trifunovic, D., Mitrovic, D., & Ristic, B. (2015, September). Network Externalities in Telecommunication Industry: An Analysis of Serbian Market. In Proceedings of International

ECONOMICS
42
Academic Conferences (No. 2704575). International Institute of Social and Economic Sciences.[19]World Bank. (2009). Information and Communications for Development: Extending Reach and Increasing Impact. https://openknowledge.worldbank.org/handle/10986/2636, 20.5.2019.[20]International Telecommunications Union. World Telecommunication/ICT Indicators Database online https://www.itu.int/pub/d-ind-wtid.ol (20.4.2019.)[21]International Telecommunications Union http://www.itu.int/en/ITU-D/Statistics/Pages/definitions/regions.aspx (20.4.2019.)[22]Telecommunication Union. (2018). Measuring the Information Society Report 2018 Volume 1. Geneva. Switzerland.[23]Roeller, L-E, & Waverman, L. (2001). Telecommunications Infrastructure and Economic Development: A Simultaneous Approach. The American Economic Review, 91 (4), 909-923.[24]Koutroumpis, P. (2009). The Economic Impact of Broadband on Growth: A Simultaneous Approach. Telecommunications Policy, 33, 471-485.[25]International Telecommunication Union. (2018). The economic contribution of broadband, digitization and ICT regulation. Geneva. Switzerland.

43
Volume 7, No.2 2019ISSN 2303-5005
ABSTRACT
This paper critically analyses the implications the digitalisation process has on individuals and organization ‘s behaviour. The digital era has positive aspects such as the access to information on real time from almost any geographical place combined with the shorten the length of time of processes. In addition, new economic trends and paradigms emerge in the digital era. However, we cannot deny the existence of negative or at least unexpected aspects of the digitalization. This work highlights some of the most alarming aspects of digitization that require the attention and implementation of measures by public authorities to prevent from the collateral damages the digitalisation can produce on citizenship well-being.
MODELLING HUMAN BEHAVIOUR IN THE DIGITAL ERA: ECONOMIC AND SOCIAL IMPACTS
Elena de la Poza1, Lucas Jódar2
date of paper receipt:17.04.2019.
JEL: O30;O31; J6; L2.
Review Article doi: 10.2478/eoik-2019-0015 UDK: 004.738.5:658.8
date of sending to review: 19.04.2019.
date of review receipt:07.05.2019.
1 Universitat Politècnica de València, Camino de Vera s/n. 46022, Valencia, Spain
Keywords:digitalisation; behaviour; socio-economic impact; robotisation; hyper connection era; metric criteria; performance assessment.

ECONOMICS
44
INTRODUCTION
Digitalisation, understood as the mass access of most of the population to the Internet and to products and/or services from mobile and/or set platforms, strongly impacts society because it affects the economy and social behaviour habits.From the economy point of view, technology allows increased productivity because it extends contacts between sellers and customers in terms of the number and time of the seller-buyer interaction [1], which reduces transaction costs. At the same time, high-risk collateral effects come into play. Like all revolutions, there is an initial stage with mass job destruction, and then the subsequent creation of new jobs. Indeed many bank branches, travel agencies, employers of distribution services and jobs in physical shops have disappeared or intend to. Shortly afterwards, administrative-type jobs disappear given the continuous digitisation and robotisation process that is reaching sectors like agriculture.In the initial stage, when mass job loss occurs, tax issues are complicated and new formulae to capture income via State taxes must be sought because the traditional formula is relegated. If the technology revolution is accompanied by the State being slow in making reforms, particularly reforms in the occupational domain, then technological beneficiaries are the stakeholders (businesspeople or employees) in the market that first adapt to the technology. Indeed technology-based companies appear that facilitate products and services, and the most demanded job posts are those requiring ITC skills. One of the consequences is a lower price due to the reduction in marginal costs, which also benefits rational customers.
1. SOCIO-ECONOMIC IMPACTS OF THE TECHNOLOGICAL REVOLUTION
As Damasio [2] stated (2018), people are moved by emotions and technology, the so-called Big Data, which is mainly Internet user’s intimacy being violated by platforms allowed to sell much more online, which increases logistic work, packaging, courier services, transport, etc.The most important effects are jobs being destroyed, precarious work, tax evasion, and with all this, inequality grows. One of the key factors in this process is that salaries do not increase as a result of the loss of workers’ negotiation. This situation must ultimately be due to lack of government measures to watch over workers. In short, we cannot blame robots, but political leaders [3].In other words, robotisation destroys jobs and creates other (more qualified) ones, but salaries worsen because politicians do not act by not making policies to motivate training and recycling workers; that is, they do not anticipate changes, and even if they do, they do not occur as quickly as the pace at which the market moves. Consequently, employers make the most of this gap and (some) pay as little as possible [4].However, the worst consequence we are witnessing as a result of technology abuse is the appearance of social diseases. The effect of technology is positive when it is used consciously as a tool for improving processes, reaching labour goals and enhancing progress. However, when technology is used limitless and unconsciousness it can destroy individuals moral and lives. Being addicted to games, betting, pornography and shopping are very serious diseases that are copied in other people, and how it can be stopped is unknown. Nowadays, young children are addicted to screens, videogames and being permanently busy using digital means that make correct education, motivation to make efforts, paying attention and empathy difficult, and personal relationships are relegated to a digital relationship based on an image and a constant image of happiness.Screen (technology-related) abuse makes individuals impatient and superficial, and they are unable to endure anything. It isolates people and encourages individuals’ solitude. Proof of this is British government creating a Ministry of Solitude which paradoxically emerges during the hyper connection era that the Internet and social networks provide.

ECONOMICS
45
2. RISKS IN THE DIGITAL ERA
Nowadays, technological progress has placed at our disposal vast amounts of information, but we cannot or do not know how to discriminate it. Although it is true that technology helps save lots of time, we also lose much more time being distracted by the digital world. We do not go into contents in-depth, being superficial is encouraged, and not only when studying or solving problems, but also in occupational and personal relationships with individuals. Moreover, the number of contacts and communication frequency increase, but the quality of relations does not.Risks go beyond information on platforms, which compile information about people decisions’ by “spying on individuals” and using artificial intelligence, which can even change the electoral performance of a population that normally uses digital media by sending it information (not necessarily “fake news”), which is segmented and adapted to its profiles. In fact online misinformation on a grand scale and the potential for digital wildfires were listed by the World Economic Forum [5] in 2016 as some of the major risks of our society.In short, population has lost freedom and intimacy because is monitored and can end up doing what others (with access to information) want; that is, interests that go beyond individuals model their behaviour, and their activity is at third parties’ service.Apparently with data being more accessible, information automatically improves the assessments made of activities (regardless of them being business, physical; i.e., or those performed by an individual or by organisations). This fact is much more relevant than it would appear because many people’s professional promotion is at risk and, as cited later on, so is people’s health or security.Assessments are certainly necessary because what is not assessed can be devalued by laziness, convenience or lack of motivation. However as pointed out earlier, humans are taken in by their emotions [2], and thus assessment criteria have to be designed in such a way that they attempt to reduce, or eliminate, perverse effects like greed, vanity or impatience.However, more data do not necessarily mean better information. Information has to be analysed to remove repetitions that are not apparent, or voluntarily concealed. “Lots of little bits make a lot”, but many poor averages do not spell excellence, but plenty of mediocrity.The cobra effect deserves special attention when evaluating human performance. It occurs when an attempted solution to a problem makes the problem worse, and acts like a kind of unintended consequence. The term is used to illustrate the causes of incorrect stimulation in economy and politics [6].In other words, an appropriate evaluation criterion may produce a bad evaluation.
3. USE OF METRICS IN PERFORMANCE ASSESSMENTS
Evaluating complex human activity cannot be done metrically, and the quantity of outputs does not determine what is better when comparing different questions. What is more, they can encourage mistaken or fraudulent activity to obtain a better score. What is most impressive might not be the best, but may even be a great mediocrity instead of excellence [7].Metric criteria based on quantity mean an objective seducer aspect for scientists, which may objectively appear false [8].How can the activity of a teacher, researcher, doctor, police officer, company, etc., be assessed?It is not true to state that the best teacher is (s)he who passes more students, nor is the best research (s)he who publishes more articles. The best doctor is not necessarily the most successful one, and the best businessperson does not necessarily sell the most products if they are not well measured. However, what is even worse than bad criteria, given their imperfection, is the perverse trend/s that these criteria produce, like approving someone who does not deserve it: like introducing fraud into research, not attending a difficult patient, or confirming that someone innocent has committed a crime [9].Some theories demonstrate just how complicated assessing human activity is [6,10], and how using numerical metrics for these assessments is not suitable [11].Assessment criteria must take into account:Include quantitative and qualitative criteriaLimit each one and analyse the level of repetition Demand sufficient experience

ECONOMICS
46
Demand variety in production and innovationThe metric criteria that appeared in the 1960s in the USA and applied by Robert MacNamara were shown to be unsuitable for assessing the management of military conflicts, especially the Vietnam War [12]. What is surprising is that they are still widely used by public management agents in Europe.Metric criteria failed during the Vietnam War because the war was not won by the side with the fewest deaths, but by the side that managed to exhaust its rival. The side with the most victims can resist, and can win [13].In an assessment of researchers, the determining criterion cannot be the number of publications, not even the journals selected. This criterion implies maximising the quantity of publications and ignores innovation by repeating and concealing ideas, avoiding risky research and, what is worse, improperly educating young researchers in such practices.The seriousness of criteria firstly lies in being considered good and are, thus, never corrected. Moreover, even though researchers realise, they have to follow the rules of the game because they will be evaluated with these criteria in order to be promoted. So they are imprisoned by a perverse criterion [14].In the digital domain, new indicators constantly appear that measure the performance of organisations from economic, social or more complex areas. Some examples are environmental indicators, which encompass the three aforementioned areas. These indicators, some of which offer public access, and others private access, quantify the performance of organisations over time, and their position in relation to competitor organisations and to industry as a whole. It is interesting to observe how harmony does not often exist in the results obtained by the various indicators created for one same company. This is explained by the different algorithms used to quantify the performance of organisations [15].Recently, many indicators have emerged that quantify customer perceptions of the products and/or services received physically or digitally. In any case, these indicators become a powerful digital marketing tool assessed by service companies.Thus the position occupied by restaurants or hotels depends not so much on their performance, but on how users perceive them, who decide to publicly provide opinions about their perception of the received service.
CONCLUSIONS
This paper highlights the relevance and effect of digitalisation on individual’s behaviour. Undoubtedly digitalisation transforms our habits and the way we perform on daily basis but also organizational processes and management. A positive impact of the digitalisation is the blooming of new sectors of economic activity, such as technology-based companies, which facilitate products and services and demand highly skilled jobs. Ina addition, digitalisation benefits rational customers due to the reduction in production costs. On the other hand, the technological revolution causes negative impacts such as the rise of precarity and social inequality and its abuse has brought the appearance of social diseases.The possible compilation of information and the techniques for its management has created a myriad range of metrics that attempt to measure what we do, produce, expect and desire as consumers, but also as workers, patients, provider, etc. The intrinsic risks of a meta-metric system arise when the quantity superimposes on quality. Digitalisation has not only brought this meta-metric system but also has generated the belief of being top rank adds value to individuals and organizations when it is not often the case. Pervasive individual strategies can flood in organizations trying to manage individual’s behaviour looking for the high-performance of organizations. In addition, digitalisation fosters individual’s hyper connection, which derive in constant but superficial relationship that instead of enriching individuals’ spirits impoverish them.

ECONOMICS
47
REFERENCES
[1] J. Rifkin. (2011) The Zero Marginal Cost Society. New York: Palgrave Macmillan. [2] A. Damasio. (2018). The Strange Order of Things. Life, Feelings, and the Making of Cultures. Barcelona, Spain: Planeta (in Spanish).[3] P. Krugman. Los robots no tienen la culpa de los precios bajos, El Pais, 17 Marzo, 2019. (in Spanish). Available at: https://elpais.com/economia/2019/03/15/actualidad/1552651704_169047.html [4] R. Botsman. Who Can You Trust? How Technology Brought Us Together and Why It Could Drive Us Apart, Penguin Random House, 2017.[5] World Economic Forum, Digital Wildfires in a Hyperconnected World, 2016.[6] C.A.E. Goodhart. Money, Information and Uncertainty, The McMillan Press Ltd., London, 1975.[7] S.E. Merry. The Seduction of Quantification: Measuring Human Rights, Gender Violence, and Sex Traffiquing, The University of Chicago Press, Chicago, 2016[8] T.M. Porter. Trust in Numbers: The Pursuit of Objetivity in Science and Public Life, Princeton Univ. Press, Princeton, 1995.[9] K. Cukier and V. Mayer-Schonberger. The Dictatorship of Data, MIT Technology Review, may, 2013.[10] D.T. Campbell. Assessing the Impact of Planned Social Change, The Public Affairs Center, Darmouth College, New Hampshire, USA, 1976.[11] J.Z. Muller. The Tyranny of Metrics, Princeton Univ. Press, Princeton, 2018[12] J.S. Baskin. According To U.S. Big Data, We Won The Vietnam War, Forbes Magazine, 2014. Available at:https://www.forbes.com/sites/jonathansalembaskin/2014/07/25/according-to-big-data-we-won-the-vietnam-war/#395975054c5a [13] E.N. Luttwak. The Pentagon and the Art of War, Simon and Schuster, New York 1985.[14] D. Ravitch. The Death and Life of Great American School System, Basic Books, New York, 2010.[15] M.A. Alcaide, E. De La Poza & N. Guadalajara. Assessing the Sustainability of High-Value Brands in the IT Sector. Sustainability 2019, 11, 1598.

ECONOMICS
48

49
Volume 7, No.2 2019ISSN 2303-5005
ABSTRACT
Apart from the former EFTA members (Iceland, Lichtenstein, Norway and Switzerland) and a few former republics of the Soviet Union (Bjelorussia, Moldova and Ukraina) the countries of the Western Balkans are the only European states outside of the European Union. They are very keen to join the Union. The Balkans have always been the poorest part of Europe. The appeal of the wealthy European Union is apparent. Access to the largest market in the world, investment, modern technologies and generous regional funds give a hope that by joining the EU the Western Balkans countries will join the rich club. At the moment performance of the Western Balkan countries does not guarantee that they will become rich by joining the European Union. Their current production and trade structure makes it likely that the Western Balkan countries will be locked in inter-industry trade in which they will export products of low and medium technological and developmental level and import products of high technological and developmental level. This might lead to divergence rather than convergence between them and the European Union. In other to overcome this problem the Western Balkan countries need to conduct radical reforms in the public sector, fiscal policy, industrial trade and investment policy. They also need to tackle corruption, simplify administrative procedure, strenghten property rights and the lawful state. All this with the aim to change economic structure and shift from achievements of the second and third to fourth technological revolution. Only if these reforms are successfuly implemented the Western Balkan countries can hope to avoid the Greek scenario and possibly experience the Irish scenario.
THE EU ENLARGEMENT. HOW TO BE LIKE THE IRISH AND NOT THE GREEK?
Tahir Mahmutefendic1
date of paper receipt:02.11.2019.
JEL: F50
Review Article doi: 10.2478/eoik-2019-0021 UDK: 341.217.02(4-672EU):338.124.4(495+416)
date of sending to review: 05.11.2019.
date of review receipt:13.11.2019.
1 SSST – Sarajevo School of Science and Technology and SSST Grammar School, Bosnia and Herzegovina
Keywords:Gravity Model, Ricardian Theory of Comparative Advantage, H-O-S Theory, Consumer Preference Theory, Inter-industry Trade, Intra-industry Trade, EU Core, EU Periphery

ECONOMICS
50
INTRODUCTION
One of the most frequently mentioned topics in the media is further EU enlargement. It refers to the largest part of Europe which has remained outside of the biggest market in the world; theWestern Balkans comprises Serbia, Bosnia and Herzegovina, Montenegro, Northern Macedonia, Albania and Kosovo. Five of these six countries were part of the former Yugoslavia.During the 1980s Yugoslavia experienced economic stagnation, accompanied by hyperinflation, high unemployment and soaring external and internal debt. This precipitated its bloody dissolution, although frictions and tensions existed between its constituent units, republics and autonomous provinces, even before 1980s in a more favourable economic environmentThe main conflict in the former Yugoslavia revolved around a rivalry between the largest and politically strongest Serbia and most developed and richest Slovenia and Croatia. Serbia complained that it was economically exploited by Slovenia and Croatia, who in turn were unhappy because of alleged Serbian political hegemony. Conventional explanation of tensions and eventual break-up of Yugoslavia was that Serbia, on one hand, and Slovenia and Croatia on the other, belong to different civilisations. This theory looks superficial since the Czech Republic and the Slovak Republic belong to the same civilisation and still parted. More plausible explanation seems to be the fact that unlike Italy and Germany, where Piedmont and Prussia provided political and military leadership and were the most developed parts of the two states, in Yugoslavia politically and militarilly strongest Serbia was not economically and culturally most developed. Its leadership was dreaded by Slovenia and Croatia, fearing that it could drag them down and increase the gap between them and Western Europe. Serbia, on the other hand, did not want to accept a leadership of the two most developed republics, fearing that it would increase the gap between them in the level of development. The other three republics feared political subjugation by Serbia and economic exploatation by Slovenia and Croatia.In such a situation none was happy with the common state. This includes Serbia, which paid a lip service to a Yugoslav unity. In fact, Serbia was the first to secede from Yugoslavia from the legal point of view. The Serbian constitution, passed on the 28th November 1990, stated that the federal constitution and federal laws are valid on the territory of Serbia only if they do not contradict republican constitution and republican laws.As independent states all the former Yugoslav republics have been enthusiastic to join the European Union. They have been more than willing to accept the leadership from Brussels and to surrender a good part of their sovereignty to various centres of power and to unelected and unaccountable bureaucrats and technocrats ( Many political and economic commentators and analysts state that Croatia had more sovereignty as a republic in the Yugoslav federation than as an independent state within the European Union).So, what was wrong with Yugoslavia and what is right with the European Union? Apparent reason, obvious even to ordinary citizens is the level of development. The European Union consists of a highly developed countries with a high incomes per capita. A membership in the European Union will provide an access to the largest market in the world, state-of-art technologies, investment, new organisational and management methods, and above all generous regional funds. This would enable them to join the rich club.This work will try to critically evaluate the accuracy of such thinking. The work is divided into four parts. The first part presents some relevant facts related to the European Union. The second part analyses the relevance of the gravity model in explanation of the core and periphery of the European Union. The third part compares Southern and Eastern peripheries of the European Union with Northern and Western peripheries of the European Union. The fourth part briefly analyses economic performance of the Western Balkan States and measures needed to catch up with the European Union.The EU – Some Relevant Facts

ECONOMICS
51
1.1. POPULATION
After Croatia joined the European Union in July 2013 the population of the Union exceeded half a billion. Countries of the European Union differ significantly according to their size and population. They can be divided into the following groups:Very big countries have the population of 35 million or more. In the EU there are six of these – Germany, the UK, France, Italy, Spain and Poland. Germany is the biggest country in the group, more than two times greater than the smallest one, Poland. The total population of this groups accounts for about three quarters of the population of the Union.Big countries comprise only two members; Romania, with a population of 21.8 million and the Netherlands with a population of 16 million.The medium nations have populations between 8 and 11 million. There are eight countries in this group; Greece, Portugal, Belgium, the Czech Republic, Hungary, Sweden, Austria and Bulgaria.The small nations have populations between 1,4 million and 4 million. This group includes Denmark, Slovakia, Finland, Ireland, Lithuania, Latvia, Slovenia and Estonia.The tiny nations have populations below one million.This group includes Cyprus, Luxembourg and Malta.
1.2. INCOMES
Income per capita varies significantly in the EU member states. This is often a problem in setting common policies.According to the average income EU countries can be classified into three groups – high, medium and low. Luxembourg is by far the richest nation with the average income exceeding the one in Sweden and France together.The high-income category is defined as income above the EU average, which amounted to 25,900 euros in 2008. This group includes 12 of the EU nations (Luxembourg, Ireland, the Netherlands, Austria, Sweden, Denmark, Finland, Belgium, the UK, Germany, France and Spain). The medium income category includes countries whose GDP per capita was between 10,000 and 25,500 euros. This group includes Italy, Greece, Portugal, Cyprus, Slovenia, Malta, the Czech Republic, Hungary, Slovakia, Lithuania, Poland, Latvia, Estonia and Croatia.Low-income group comprises only two countries, Bulgaria and Romania, whose income is slightly below 10,000 euros.
1.3. SIZE OF EU ECONOMIES
Combining population and average income we arrive at size of economy. According to this criterion all the EU nations could be divided into four categories; big, small, tiny and miniscule.Big countries include Germany, the UK, France, Italy, Spain and the Netherlands. These six countries account for more than 80 per cent of the GDP of the whole EU.Small economies account for between 1 and 3 per cent of the EU output. This group consists of Sweden, Belgium, Austria, Denmark, Poland, Finland, Greece, Portugal, Ireland and Romania.Tiny economies are those that account for less than 1 per cent of the total. These are the Czech Republic, Hungary, the Slovak Republic, Luxembourg, Slovenia, Lithuania, Bulgaria and Cyprus.Miniscule are countries whose contribution to total GDP is less than 0.1 per cent. Latvia, Estonia and Malta are the nations in this category.The 2004 enlargement had very little impact on the overall size of the EU economy. The ten newcomers’ economies amount to only 5 per cent of the EU 15’s GDP, with Poland alone accounting for about half of this 5 per cent. (Baldwin & Wyplosz 2009)

ECONOMICS
52
2. GRAVITY MODEL AND THE EU CORE
Economics borrowed many concepts from Physics. One of them is a Gravity Model. In Physics two bodies are more attracted to each other if their weight is similar and if they are close to each other.The same principle applies in Economics. Two countries are more „attracted“ to each other (have more intensive trade and other economic links) if their weight is more similar(level of development measured by GDP per capita) and if distance between them is smaller. This relationship could be expressed as a function:
E.L= f(Ya,Yb) (+), d (-),
Where E.L. stands for trade, investment and other economic links between countries A and B, Ya and Yb are incomes per head in countries A and B and D is distance between countries A and B.„Weight“ (GDP per capita) is directly and distance inversely related to economic links.The following table shows GDP per capita in PPP terms for the EU core countries:
Table 1. GDP per capita (PPP) in dollars in the EU core countries
EU Core Countries GDP per capita(PPP) in dollars
Index
Austria 54, 084 141Belgium 49,705 129France 47,113 124
Germany 54,984 143Luxembourg 112,622 294
The Netherlands 59,105 155EU Average 38,274 100
Core EU Average 52300 136Source: World Bank International Comparison Program Data 2019 – international dollars. Last row and last column are the author’s calculations.
The table reveals three things. Firstly, the EU core has higher GDP per capita compared to the EU average. Secondly, every individual core country has above average GDP per capita. Thirdly, core countries have a similar GDP per capita. If we exclude Luxembourg, whose size is negligible, the most developed the Netherlands has GDP per capita only 25 per cent higher than the least developed France. The core countries, have therefore, a similar „weight“.The core countries are situated in proximity with each other. Germany is in the centre of Europe and borders most of the other countries. The greatest distance is between Austria and the Benelux countries, but they are separated only by Germany. The gravity model, therefore, explains why the core countries are more developed than the EU average.3.The EU peripheriesAccording to the gravity model it is expected that peripheries of the EU are less developed than its core. There are four peripheries in the EU; Southern, Eastern, Northern and Western.Southern periphery includes PIGS countries – Portugal, Italy, Greece and Spain. After sixth enlargement in 2004 it also comprises Cyprus and Malta. All these countries have GDP per capita lower than the EU core countries:

ECONOMICS
53
Table 2. GDP per capita (PPP) in the EU Southern Periphery
Country GDP per capita Index (EU core = 100)Cyprus 41,572 78Greece 30,522 57
Italy 40,737 76Malta 47,061 91
Portugal 33,409 64Spain 42,120 79
EU core 53,200 100Source: World Bank International Comparison Program Data 2019 – international dollars. Last row and last column are the author’s calculations.
In this group of countries the gravity model is best verified in the case of the poorest country, Greece. Greece joined the EEC in 1981. Its membership in the community was forced by the conservative New Democracy and strongly opposed by the Socialist and Communist party. As a member of the EEC Greece experienced relative retardation in its development. In 1981 its GDP per capita stood at 77 per cent of the community’s average. It slipped to 62 per cent in 1990. Some authors find the explanation for this in Geography and the fact that Greece was involved in inter-industry instead of intra-industry trade with the other members of the community. (Petrakos & Totev – editors, 2001)Greece’s plight has been intensified after the introduction of the euro. Greece’s „qualified“ for the euro in May 2000. After the credit crunch it transpired that the Greek government of George Papandreou struck a deal called AEOLOS, named after the Greek god of the winds, with Goldman Sachs. Goldman Sachs helped Greece to borrow billions recording them as a financial derivative „swap“ through financial creative engineering. Goldman Sachs received for that service a fee of $300 million. Greece promised a fiscal deficit of 3.7 per cent of GDP in 2009. It was actually four times higher. (Mahmutefendic 2015)Austerity measures which accompanied bail out packages included spending cuts, tax increases and privatisation. The public sector wages were reduced by 20 per cent. The so called 13th and 14th salary were to be replaced by an annual lump sum the size of which varies with the wage. Wages and salaries were frozen for three years. Employment in the public sector was reduced. For every worker hired, five were retired. Unemployment benefits were cut, and poverty support schemes that had been put in place in December 2009 were suspended. The cuts were spilled into the private sector. (Ibid)Austerity measures had two aims; to reduce fiscal deficit and public debt and to improve competitiveness. It was assumed that slashing salaries and wages would bring down nominal labour costs and close a competitiveness gao between Greece and Germany and to a lesser extent the other core countries. The logic went that the release of resources from the public sector as a result of spending cuts, as well as the reduction in private spending brought on by tax increases, would reduce aggregate demand and increase unemployment. The resulting excess supply in the economy and increased pressure to win business and keep jobs would lower costs, prices and wages and improve competitiveness. This was an outright deflationary policy applied in the 1930’s which proved wanting. This time it acquired a new euphemism, „internal devaluation“.This process of „internal devaluation“ was extremely slow, considering the fact that the competitiveness gap between Greece and Germany was in a range of 30-40 per cent. Although the competitiveness gap decreased in 2013, the price in soaring fiscal deficit, public debt and unemployment was heavy. (Ibid)Eastern periphery comprises former communist countries; Bulgaria, Croatia, the Czech Republic, Estonia, Hungary, Latvia, Lithuania, Poland, Romania, Slovakia and Slovenia. All these countries

ECONOMICS
54
have lower GDP per capita than the EU core countries. Also, they are less developed than the countries of the Southern periphery.
Table 3. GDP per capita (PPP) in the countries in Eastern EU periphery
Country GDP per capita Index (EU core = 100)Bulgaria 24,577 47Croatia 27,664 53
The Czech Republic 39,337 76Estonia 36,346 69
Hungary 33,409 64Latvia 31,215 59
Lithuania 37,162 71Poland 33,472 64
Romania 27,753 53Slovakia 37,268 71Slovenia 38,841 74
EU core average 52,300 100Source: Wordl Bank International Comparison Program Data 2019 – international dollars. Last row and last column are the author’s calculations.
In addition to the gravity model argument part of explanation of a relative poverty of the Eastern periphery lies in its communist past. The argument goes that the communist countries performed less well than their counterparts in the Western Europe. While this is undoubtedly true for the Czech Republic and to a lesser extent to Slovakia, it is questionable whether this argument is valid for the other countries, especially for the Balkan ones. The Balkans have always been the poorest part of Europe, so historical factors might prevail in the explanation of its relative backwardness.Northern periphery comprises three Scandinavian countries; Sweden, Denmark and Finland. The first two countries have GDP higher and Finland lower than the EU core.
Table 4. GDP per capita (PPP) in the countries in the Northern EU periphery
Country GDP per capita Index (EU core = 100)Sweden 54,474 104
Denmark 54,564 104Finland 48,221 93EU core 52300 100
Source: World Bank International Comparison Program Data 2019 – international dollars. Last row and last column are the author’s calculations.
Finland fell behind and the other two countries diminish its advantage compared to the EU core. Explanation for higher level of development in the Northern periphery usually is found in the Weberian thesis. (A thesis espoused by the German sociologist Max Weber in his book ‘The Protestan Ethics and the Spirit of Capitalism’, according to which the Protestant nations are best suited to the capitalist models of economy and society. Weber found the explanation for his thesis in the fact that Protestantism, more than other confessions, inspires hardwork, parsimony and devotion to a chosen job. He linked the latter with a word which means profession, a calling. The

ECONOMICS
55
word ‘call’ in English and ‘Beruf ’ in German have stronger connotations than ‘vocation’ in French, or ‘vocazione’ in Italian, two languages of non-Protestant countries.)Western Periphery consist of only two countries; the UK and Ireland. The UK fell behind and has a lower GDP per capita compared to the EU core. Irish GDP per capita by far exceeds the EU core average.
Table 5. GDP per capita (PPP) in the countries in the Western EU periphery
Country GDP per capita Index (EU core = 100)The United Kingdom 47,042 90
Ireland 81,686 156EU core 52300 100
Source: World Bank International Comparison Program Data 2019 – international dollars. Last row and last column are the author’s calculations.
Ireland is the only EU member whose GDP was lower than average GDP of the EU core when it joined the EEC and now by far exceeds the Union’s average. In 1980, seven years after joining the EEC, Irish GDP per capita stood at 7,000 international dollars while all the other EU core countries had GDP per capita exceeding 10,000 international dollars. Ireland experienced a vigorous growth from 1984 to 2007. This growth was interrupted by the Great Recession and a sovereign debt crisis, but it was resumed after a several years. Ireland is an open economy (6th on the Index of Economic Freedom)and ranks 5th of 187 in the IMF table and 6th of 195 in the World Bank table according to GDP per capita. (World Economic Outlook 2019) Foreign owned multinational companies play a decisive role in Irish prosperity , making up 14 of the top 20 firms (by turnover), employing 23 per cent of the private sector labour-force and paying 80 per cent of corporation tax collected. The Irish economy is knowledge economy, focused on services into high-tech, life sciences, financial services and agrobusiness including agrifood. (Ibid)4.Is it possible to be Irish and not to be Greek ?If countries in the Western Balkans join the EU they will make a fifth periphery.
Table 6. GDP per capita (PPP) in the Western Balkans countries
Country GDP per capita Index (EU core = 100) Index (EU average = 100)Albania 14,143 27 36
Bosnia and Herzegovina
14,291 27 36
Montenegro 19,734 37 51Northern
Macedonia16,253 31 41
Serbia 17,076 33 44EU core 52,300 100 100
EU average 38,784 100 100Source: World Bank International Comparison Program Data 2019 – international dollars. Last row and last column are the author’s calculations.
The Western Balkans is the least developed region in Europe. Its GDP per capita is far less than GDP of the EU average. Only Montenegro reached half of the GDP per capita of the EU average.The Western Balkans fairs even worse in comparison with the EU core. Most countries have GDP

ECONOMICS
56
which is in range between ¼ and 1/3 of the EU core. The Balkans have always been the poorest region in Europe, so historical factors prevail in explanation of its backwardness.Professor Vjekoslav Domljan list the characteristics of the economy of Bosnia and Herzegovina, most of which apply to the other Western Balkan countries:GDP and the standard of living are amongs lowest in Europe;High rate of unemployment which is amongst biggest in the world. As a result there is a strong outflow of a highly qualified workforce (brain drain) abroad;Suboptimal growth rates of GDP, which do not contribute to a significant decrease in unemployment rate;High macroeconomic imbalances reflected in large balance of payments deficits and to a lesser extent budget deficits. Macroeconomic imbalances are result of the fact that Bosnia and Herzegovina is one of the rare countries which records a negative rate of domestic savings and that national savings is positive only owing to remittances from abroad, but it is insufficient to cover investment;The lowest degree of computerisation and digitalisation in Europe;Unfavourable economic structure, mainly based on the achievements of the Second Industrial Revolution;Unfavourable production and export structure, dominated by low or medium technological content, with the exception of antibiotics created at Bosnalijek;The greatest production of negative externalities in Europe, which is a logical consequence of the aforementioned characteristics expressed in the Kuznets’ U-curve;Overblown public sector, which is the biggest employer and the strongest pillar of the power of ethno-cartels:Too heavy burdened private sector by taxes and contributions, which leads to „crowding-out“ and an informal economy which accounts for 25 per cent of GDP;A bad tax structure, dominated by indirect regressive taxes;Health and pension system, snowed under by unfavourable ratio between active and inactive population. This ratio is 1.13:1, while in the communist Bosnia and Herzegovina it was 2.8:1. (Domljan 2018)To this list one could add corruption, a red tape, complicated procedure in registering new firms, weak protection of property rights and a lack of lawful state.If Bosnia and Herzegovina and the other Western Balkan countries join the EU with such or similar performances they will be locked in inter-industry trade (Kos 1998) in which they will export products of low to medium technological and developmental level and import products of a high technological and developmental level. (Domljan 2018). This will turn the Western Balkan countries into economic colonies of the European Union and increase the gap in the level of development between them.In order to avoid the Greek scenario and try to play the Irish scenario Professor Vjekoslav Domljan suggests the following:Create vision, strategy and development strategy;Significantly decrease widespread corruption and strengthen contract enforcement through enhancement of the lawful state; Release creative energy of entrepreneurs through creation of the market economy from the bottom. In order to achieve this fiscal policy should be radically changed, through fiscal devaluation and increase of direct taxes, especially income tax and property tax;Enhance domestic competitiviness and not to expose domestic producers to unrestrained import liberalisation;Introduce new financial institutions and financial instruments and adequate regulation and supervision of financial markets;Significantly increase investment in research and development, which currently stands at paltry 0.15 per cent of GDP;

ECONOMICS
57
Modernise educational system by abandoning rote learning and its replacement by problem solving. Also, educational system should be unified and liberated from ethno-national parochialisms;Introduce softwares and robots in production, which will help transformation of the economy from second and third to fourth technological revolution;Change the structure of public expenditure by increasing productive public expenditures, such as investment in research and development and infrastructure;Support development of value chains and clusters of production by linking entrepreneurs, innovators, investors and exporters;Conduct an adequate price policy and its stabilisation using merchadise reserves. (Domljan 2018)Experience of countries which started their take-off from much lower level of development, particularly the Asian Tigers, show that implementation of these measures can create modern economy and achieve high income. Governing elites in the Western Balkans pay a lip service to these reforms, but are reluctant to implement them. Probably because they would erode their power and endanger their vested interests.Future will show whether the Western Balkans will experience Greek or Irish scenario.
CONCLUSION
The European Union consists of a core and four peripheries; Southern, Eastern, Northern and Western. The Southern and Eastern peripheries are less developed than the core. The Northern periphery is more developed than the core. In the Western periphery the UK fell behind, but Ireland is more developed than the core.There are two conspicious experiences after joining the EU. Greece experienced relative retardation. Ireland joined at GDP lower than the core, but owing to a vigorous growth for more than two decades surpassed the core coming second in the table only after Luxembourg.The Western Balkans countries are desperate to join the European Union. If they do so they will be the fifth periphery of the European Union. The Balkans have always been the poorest part of Europe. Appeal of the wealthy European Union is apparent. Access to the largest market in the world, investment, modern technologies and generous regional funds give a hope that by joining the EU the Western Balkans countries will join the rich club.At the moment performance of the Western Balkan countries does not guarantee that they will become rich by joining the European Union. Their current production and trade structure makes it likely that the Western Balkan countries will be locked in inter-industry trade in which they will export products of low and medium technological and developmental level and import products of high technological and developmental level. This might lead to divergence rather than convergence between them and the European Union. In other words, the Greek scenario is looming.In other to overcome this problem the Western Balkan countries need to conduct radical reforms in the public sector, fiscal policy, industrial trade and investment policy. They also need to tackle corruption, simplify administrative procedure, strenghten property rights and the lawful state. All this with the aim to change economic structure and shift from achievements of the second and third to fourth technological revolution. Only if these reforms are successfuly implemented the Western Balkan countries can hope to avoid the Greek scenario and possibly experience the Irish scenario.Apart from the former EFTA members (Iceland, Lichtenstein, Norway and Switzerland) and a few former republics of the Soviet Union (Bjelorussia, Moldova and Ukraina) the countries of the Western Balkans are the only European states outside of the European Union. They are very keen to join the Union. The Balkans have always been the poorest part of Europe. The appeal of the wealthy European Union is apparent. Access to the largest market in the world, investment, modern technologies and generous regional funds give a hope that by joining the EU the Western Balkans countries will join the rich club.

ECONOMICS
58
At the moment performance of the Western Balkan countries does not guarantee that they will become rich by joining the European Union. Their current production and trade structure makes it likely that the Western Balkan countries will be locked in inter-industry trade in which they will export products of low and medium technological and developmental level and import products of high technological and developmental level. This might lead to divergence rather than convergence between them and the European Union. In other words, the Greek scenario is looming.In other to overcome this problem the Western Balkan countries need to conduct radical reforms in the public sector, fiscal policy, industrial trade and investment policy. They also need to tackle corruption, simplify administrative procedure, strenghten property rights and the lawful state. All this with the aim to change economic structure and shift from achievements of the second and third to fourth technological revolution. Only if these reforms are successfuly implemented the Western Balkan countries can hope to avoid the Greek scenario and possibly experience the Irish scenario.
REFERENCES
[1] Larry Allen (2013) The Global Economic Crisis – a Chronology, Reaktion Books, UK [2] Ilias Asseb (2019)The EU Core and Peripheries – Comparison between Belgium and Greece, unpublished project done at the SSST[3]Richard Baldwin and Charles Wyplosz (2009)The Economics of European Integration – Third Edition, Mc Graw-Hill, London, p 80-83[4] Roger Bootle (2014)The Trouble with Europe, Nicholas Brealey Publishing, London – Boston [5]Vjekoslav Domljan (2014) Put u zaposlenost, Ekonomski Institut Sarajevo[6] Vjekoslav Domljan (2018)Vitalni (N)racionalni interes, Lijepa riječ, Tuzla, p 56-58 [7]Azra Hadžiahmetović (2011) Ekonomija Evropske Unije, University Press Sarajevo[8] Miroslav N Jovanović (2013)Economics of European Integration Second Edition, Edward Elgar, UK [9] Costas Lapavitsas et al (2012)Crisis in the Euro Zone, Verso, London and New York, p 117 & 118[10] Marko Kos (1998)Trends in Development of Transition Countries, Characteristics and Possibilities of Slovenia in Comparison with Other Post-Communist Countries and the European Union [11] Paul R Krugman, Maurice Obstfeld & Marc J. Melitz (2015)International Economics – Theory and Policy – Tenth Edition, Pearson Education Limited[12]Tahir Mahmutefendić (2015) The Great Recession, the Balkans and the Euro, Xlibris, p [13] taken from Larry Allen (2013), p210; taken from Costas Lapavitsas et.al. (2012), p 117 & 118; taken from Roger Bootle (2012), p 95 & 96[14] Tahir Mahmutefendić (2018)Balkanske tranzicijske i globalizacijske teme- eseji i prikazi, Lijepa riječ, Tuzla [15] Tahir Mahmutefendić (2019)Kratak leksikon ekonomskih pojmova/A Short Lexicon of Economic Concepts, Markos Banjaluka [16] George Petrakos and Stoyan Totev (editors) (2001)The Development of the Balkan Region, Ashgate Publishing Company Limited[17] Brue Stanley L. & Grant Randy R. (2013)The Evolution of Economic Thought – eight edition, South Western Cengage Learning, USA[18] Max Veber (1972)Protestantska etika i duh kapitalizma, Veselin Masleša Sarajevo [19] World Bank International Comparison Program Data 2019[20] World Economic Outlook, IMF 2019

59
Volume 7, No.2 2019ISSN 2303-5005
ABSTRACT
Inadequate sleep is an important public health problem that can affect one in every three adults; however, it received little attention in the economics of happiness research. The objective of this article is to examine whether sleep adequacy contributes to the explanation of variation in happiness index levels across countries. Analysis was undertaken using ordinary least squares regression method. The dependent variable is the self-reported happiness index developed by the Gallup poll and published in the World Happiness Report. Two alternative model specifications were used. The first included average sleep minutes per country, GDP per capita(purchasing power parity), unemployment rate, and environmental performance index. The second model specification included average sleep minutes per country, GDP (purchasing power parity), and economic freedom index. Both model specifications met several robustness checks, and showed overall significance and significant coefficients. Results showed that an increase in average sleep duration by 10 minutes is associated with an improvement in the happiness score by 0.1 and 0.15 points in the first and second model specifications respectively, noting an average happiness score of 6.2 in the country sample. The conclusion that sleep duration contributes to explaining variation in happiness levels across countries is a call for policy makers to consider policies targeting improvement in sleep adequacy as priority, and to direct more resources to further research in the area of sleep economics. Previous studies in the area of happiness economics did not consider sleep in explaining differences in happiness among countries, and previous studies in the area of economics of sleep did not consider the happiness index at a global level.
CAN SLEEP DURATION HELP EXPLAIN DIFFERENCES IN THE HAP-PINESS INDEX ACROSS NATIONS?
Azza Mohamed Kamal1
date of paper receipt:29.08.2019.
JEL: 118, 131
Original Article doi: 10.2478/eoik-2019-0014 UDK: 334.72.02:159.9.019.4(100)
date of sending to review: 02.09.2019.
date of review receipt:09.09.2019.
1 MSA University, Egypt
Keywords:Happiness Economics, Happiness Index, Sleep Economics, Sleep Deprivation, Inadequate Sleep

ECONOMICS
60
INTRODUCTION
Inadequate sleep is an important public health problem that can affect one in every three adults [1]. Some cases of inadequate sleep could relate to clinical sleep disorders, but many cases could relate to work, school, and life-style related factors [1] including a lack of physical activity, school start time, unrealistic time pressures at work, working irregular hours and long commuting times and digital media use [2]. Insufficient sleep is related to higher mortality risks, as an individual that sleeps on average less than six hours per night, has a 13% higher mortality risk than an individual who sleeps between 7 and 9 hours-the recommended healthy sleep duration [2]. The annual costs of inadequate sleep as a percentage of GDP are estimated to reach 3.3%, 2.6%, 1.8%, 1.6%, and 1.5%, by the year 2030, in Japan, United States, United Kingdom, Germany and Canada respectively [2]; such cost estimates relate to mortality and work productivity effects of inadequate sleep. Sleep has received little attention in happiness research, whether from the medical or the economic point of view [3,4]. While the link between sleep and life satisfaction could be bi-directional, there is evidence that good sleep might affect how positively a person evaluates their life [3]. Baglioni et.al. (2011) meta-analysis of 21 studies found that the non-depressed people with insomnia have double the risk of developing depression compared to others without sleep difficulties [5]. Therefore, that study recommended a general preventive strategy based on early treatment programs for insomnia in order to reduce the risk for developing depression in the general population. Dinges et. al. (1997) experiment found that individuals who slept only 4.5 hours per night for one week recorded fatigue, confusion, tension, emotional complaints and total mood disturbance during the study [6]. It took them two full days to recover after resuming normal sleep, and they reported significant improvement in mood. Piper uses the German Socio Economic Panel (SOEP) which has, since 2008, included questions about the amount of sleep a respondent has, along with questions about how satisfied a person is with their life, and several demographic and socio-economic questions[4]. The study found that sleep is an important factor for life satisfaction and that maximum life satisfaction is associated with about eight hours of sleep on a typical weekday. However, the average sleep duration of Germans included in the study was 7 hours, so more sleep would lead to a higher reported satisfaction with life.Several studies attempted to explain the differences between happiness levels (or self-reported subjective well-being) across countries. A large strand of the happiness literature focused on the question of whether richer nations are happier. The “Easterlin Happiness-Income Paradox” arising from Easterlin (1974) was sometimes misinterpreted in the literature as indicating no relation between happiness and economic development [7]. However, the Easterlin paradox states that “at a point in time both among and within nations, happiness varies directly with income, but over time, happiness does not increase when a country’s income increases. We are talking here about the time series relationship of happiness and income in the long term, usually at least 10 years, sometimes more” [8]. Several studies published after 1974 tried to criticize and disproof Easterlin (1974) based on misinterpretation [8]. For example, Stevenson and Wolfers (2008) found that income and economic growth contribute to explaining the differences in subjective well-being across nations; however, their analysis was for short term effects[9], which does not contradict the Paradox [8]. The results of Deaton (2008) [10] confirming the relationship between happiness and income were widely used in the economic and non-economic literature as a disproof of the Happiness-Income paradox, but it relied on cross-sectional data at a one point in time, which again does not disproof the paradox as the later only applies to the long-term relationship [8]. Gropper, Lawson, and Thorne( 2012) used per capita GDP and the economic freedom index to explain differences in happiness levels across countries, and both variables contributed significantly to explaining the variation in happiness[11]. The World Happiness Report of 2019 used per capita GDP, perception of corruption, social support, healthy life expectancy at birth, generosity, and freedom to make life choices to explain variation in happiness levels across countries [12] . Gorham,

ECONOMICS
61
Lehman, and Kelly (2019) examined the relationship between the Environmental performance index and six variables, where the relationship with each variable is examined separately[13]. The study found a linear relationship between the environmental index and the happiness index, but the study suggested correlation rather than causality. Majeed and Mumtaz (2017) used the environmental degradation indicators of the Environmental Performance Index (EPI) along with income to explain the variability of happiness levels across nations[14]. However, to the knowledge of the author, no previous study examined whether there is a linkage between sleep duration and the happiness index differences across nations. Therefore, the current study aims at examining whether sleep duration contributes to the explanation of variation in happiness index levels across countries. The results will be useful for drawing the attention of policy makers towards the importance of polices that address the problem of sleep inadequacy, and along with evidence from previous research that estimates the economic cost of inadequate sleep, could provide a justification for expenditures directed to such policies and to further research in the area of sleep and happiness.
1. DATA AND METHODOLOGY
In order to estimate the relationship between average sleep duration and the overall happiness in a country, the Ordinary Least Squares Multiple Regression Model is employed. The dependent variable is the happiness index from the World Happiness Report of 2019 [12]. For the independent variables, two alternative model specifications were tested. The first included average sleep minutes per country, GDP (purchasing power parity), unemployment, and environmental performance index. The second model specification included average sleep minutes per country, GDP (purchasing power parity), and economic freedom index.
1.1. FIRST MODEL SPECIFICATION
The first model specification is as follows:
(1)
where represents the happiness index, represents the average daily sleep minutes of country j, represents per capita GDP in purchasing power parity terms, Unemploymentj refers to unemployment rate , and Environment refers to the Environmental quality index of each country. The dependent variable Happinessj is the Happiness Index from World Happiness Report of 2019. The index depends on responses to a Cantril ladder question, using a survey collected by Gallup of 430,000 respondents from 103 countries, who were asked to value their lives today on a 0 to 10 scale, with the worst possible life as a 0 and the best possible life as a 10. This index is selected because it measures happiness based on people’s perception directly (self-reported) rather than being inferred from a model, and because recent data is available. Another potential measurement of self-reported happiness is the World Value Survey report which requests respondents to answer a question: “Taking all things together, would you say you are (i) Very happy, (ii) Rather happy, (iii) Not very happy or (iv) Not at all happy”. It comprises a long time series, but the most recent published database is for 2014. The independent variables are: average sleep hours per day by country, GDP per capita (Purchasing power parity), unemployment rate, and environment quality index. Data about average sleep hours by country is available for 55 countries from Asia, Europe, North America, Latin America, Middle East and North Africa, and South Africa ( Figure A.1 in the appendix shows the countries included in the sample) . The data is obtained from Troser(2019) [15] based on data from Sleep Cycle. Sleep Cycle is a sleep tracking app which collects data from its users [16]. Therefore, the data could be

ECONOMICS
62
characterized by selection bias. However, this is, currently, the most comprehensive cross-country dataset available about average sleep hours. GDP purchasing power parity data and unemployment rate data of 2017 are extracted from the World Development Indicators Database [17]. Environment quality is measured by the 2018 environmental performance index developed by the Yale’s Center for Environmental Law and Policy and other collaborators [18]. It is a composite index of several indicators of ecosystem vitality and environmental health like water quality, carbon emissions, and tree cover loss. There are several other independent variables that could be suggested. However, many of the potential variables would have high collinearity with the other independent variables. For example, the rule of law index (World Justice Project, 2018) was added to the above equation but estimating the correlation matrix of coefficients showed high correlation with each of GDP per capita and sleep hours[19]. The same applies to the corruption perceptions index published by Transparency International [20]. Therefore, those variables were excluded from the model. Also, the omitted variable test did not show that there is a specification error with equation 1. It should be noted that the 2019 World Happiness Report tested a regression model of the happiness index on several independent variables including corruption [12]. However, the corruption variable is defined differently, because it is based on the respondents’ view of corruption, rather than the global index. Lang (2012) tested a regression of the Gallup happiness index on the corruption index of transparency, among other variables, but the coefficient of this variable was not significant, which could indicate correlation with other variables in her model like unemployment or human development index [21].
1.2. SECOND MODEL SPECIFICATION
This specification builds on the model of Gropper, Lawson, and Thorne (2012) which included the economic freedom index and per capita GDP as determinants of happiness [11]. Using several definitions of happiness, and alternative model specifications like interaction variable between GDP and the economic freedom index, the model proved to be significant. Therefore, the second model specification adds the number of sleep hours as a third independent variable to Gropper, Lawson, and Thorne (2012) model specification [11] to explain happiness.
(2)
where represents the happiness index in country j, represents the average daily sleep minutes of country j, Economicfreedom j represents the economic freedom index. The index of economic freedom employed in this study is developed by the Heritage Foundation [22]. It is a composite index of 12 indicators covering the four broad categories of rule of law (government integrity, property protection, judicial effectiveness), government size ( government spending, tax burden, fiscal health), regulatory efficiency ( business, labor, monetary freedom), and open markets( trade, investment, and financial freedom). Gropper, Lawson, and Thorne (2012) used the same specification of equation 2, and a similar specification with an interaction term between economic freedom index and GDP [11] , suggesting the possibility that the effect of economic freedom on happiness could vary by GDP level (equation (3)). A similar approach is adopted in this study. Because of the low correlation between sleep and the economic freedom index, no interaction term is employed between the two variables.
(3)
where GDPj ×Economicfreedom j represents the interaction term between GDP and economic freedom.

ECONOMICS
63
2. RESULTS AND DISCUSSION
2.1. FIRST MODEL SPECIFICATION
A summary of the variables statistics is shown in table 1. The regression model results are shown in table 2. The model and the variables are significant at the 5% level. The standardized beta coefficient which shows the change in one standard deviation of the dependent variable, given a change in one standard deviation of the independent variable shows similar coefficients (0.2) for sleep minutes, per capita GDP, and unemployment ( table 2(a)). This coefficient means that a change in one standard deviation of sleep minutes, per capita GDP or unemployment, results in a change in the happiness index by about 20% of its standard deviation. Meanwhile, the standardized beta coefficient of the environment performance index is higher, as it shows that an increase in the environment performance index by 1 standard deviation results in a change in the happiness index by 40% of its standard deviation. Examining unstandardized beta coefficients, an increase in sleep time by 10 minutes, results in an improvement in the happiness score by 0.1 points, noting that the average happiness score is 6.2 in the country sample. Increasing the per capita GDP by 10,000 International Dollars improves the happiness score by 0.1 points. Decreasing unemployment rate by 1%, improves the happiness score by 0.05 points.
Table 1. Summary Statistics of the Study VariablesVariable N Mean Std. Dev. Min MaxHappiness Score 55 6.2 0.9 4.0 7.8Sleep Duration in Minutes 55 427.2 19.6 377.0 460.0Environmental Performance Index 55 66.7 11.5 30.6 87.5Per Capita GDP (PPP)-thousand international dollars
55 37.4 22.5 6.9 107.6
Index of Economic Freedom 55 69.0 9.2 51.9 90.2Unemployment Rate % 55 6.3 4.5 0.7 27.0
Table 2. Ordinary Least Squares of Happiness Score- First Model Specification (N=55)Variable All Independent
Variables(a)
Dropping Per Capita GDP(b)
Dropping Environmental
Performance Index(c)
B β B β B βSleep Duration in minutes
0.01** 0.22 0.01** 0.22 0.02*** 0.40
Unemployment Rate % -0.05** -0.22 -0.05** -0.27 -0.05** -0.22Environmental Performance Index
0.04 *** 0.48 0.05*** 0.60 - -
Per Capita GDP (PPP), Int$1000
0.01** 0.22 - - 0.02*** 0.45
Intercept -0.78 - -1.21 - -2.29 -F 24.11*** 29.17*** 20.85***Adjusted R-squared 0.63 0.61 0.52
B: Beta Coefficient, b: Standardized Beta Coefficient** p-value <5%, *** p-value <1%

ECONOMICS
64
Using the Breusch-Pagan / Cook-Weisberg test for heteroscedasticity [23], the null hypothesis of constant variance of residuals was not rejected at any of the conventional levels of significance (p-value=0.14) [23]. Also, the Ramsey test for omitted variables was employed to test the null hypothesis that there are no omitted variables [23] , and the null hypothesis was not rejected at any significance level (p-value=0.9).To test for multicollinearity, the variance inflation factor is employed as a test for whether the variance of any of the independent variables or the overall model is inflated due to multicollinearity [23]. None of the variables show a value greater than 2.1, which indicates that the multicollinearity issue is not of high concern (the conventional threshold for indicating multicollinearity is above 10). However, the correlation between the estimated regression model coefficients test indicated weak to average correlation between the environmental performance index and each of sleep minutes and GDP per capita. While Troser (2019) suggests correlation between per capita GDP and sleep duration[15] , the post estimation correlation matrix of coefficients showed weak correlation between the two variables that did not exceed -0.33 (noting that the sign of the post estimation correlation coefficients are opposite to the actual correlation between the variables since they indicate the degree to which the correlation affects the estimated coefficients; a coefficient of -0.33 indicates that the sleep coefficient is slightly underestimated due to this correlation). While the above should be noted for further examination in future studies, multicollinearity did not have a substantial impact on the model coefficients, which remained significant. Removing the environmental performance coefficient resulted in doubling the beta coefficients for each of GDP per capita and sleep hours, but unemployment was not affected as it did not correlate with environmental performance (table 2(b)). However, the adjusted R-squared was reduced from 63% to 55%. Removing the GDP variable (table 2(c)), the sleep duration coefficient did not change, but the environment coefficient increased from 0.47 to 0.6, and the adjusted R-squared decreased slightly compared to the original specification from 63% to 61%. This indicates that the environment performance coefficient captured most of the effect of the variability caused by differences in per capita GDP level. It can also be concluded that the sleep coefficient remained robust to different model specifications.
2.2. SECOND MODEL SPECIFICATION
The results are shown in table 3. Using equation (2), the regression and the variable coefficients are significant at the 5% level, but the economic freedom index is only significant at the 8% level. Building on Gropper, Lawson and Thorne [11] and given the correlation between GDP and economic freedom, an interaction term is tested using equation (3). Under this specification, all the model variables are significant at the 1% level. The interaction term is negative which means that the effect of improvement in economic freedom increases at lower GDP levels. The standardized beta of sleep duration under this model specification is close to that of the first model specification (0.32 under equation (2) and 0.26 under equation (3) versus 0.22 under equation (1)). Similar to the first model specification, the values of standardized beta coefficients of sleep duration and per capita GDP are close to each other in equation 2. Under the second model specification, a 10 minute increase in sleep duration leads to an improvement in the happiness score by 0.12 to 0.15 points (compared to 0.1 points under equation 1, and 0.2 points when the environmental performance index variable was dropped from that equation). It can be concluded that the relationship between sleep duration and happiness index proved to be significant with consistent estimates at different model specifications. In both equations 2 and 3, using the Breusch-Pagan / Cook-Weisberg test for heteroscedasticity, the null hypothesis of constant variance of residuals was not rejected at any of the conventional levels of significance. Also, the Ramsey test for omitted variables was employed to test the null hypothesis that there are no omitted variables, and the null hypothesis was not rejected at any significance level (p-value=0.9). For equation 2, the variance inflation factor did not detect an alarming level of
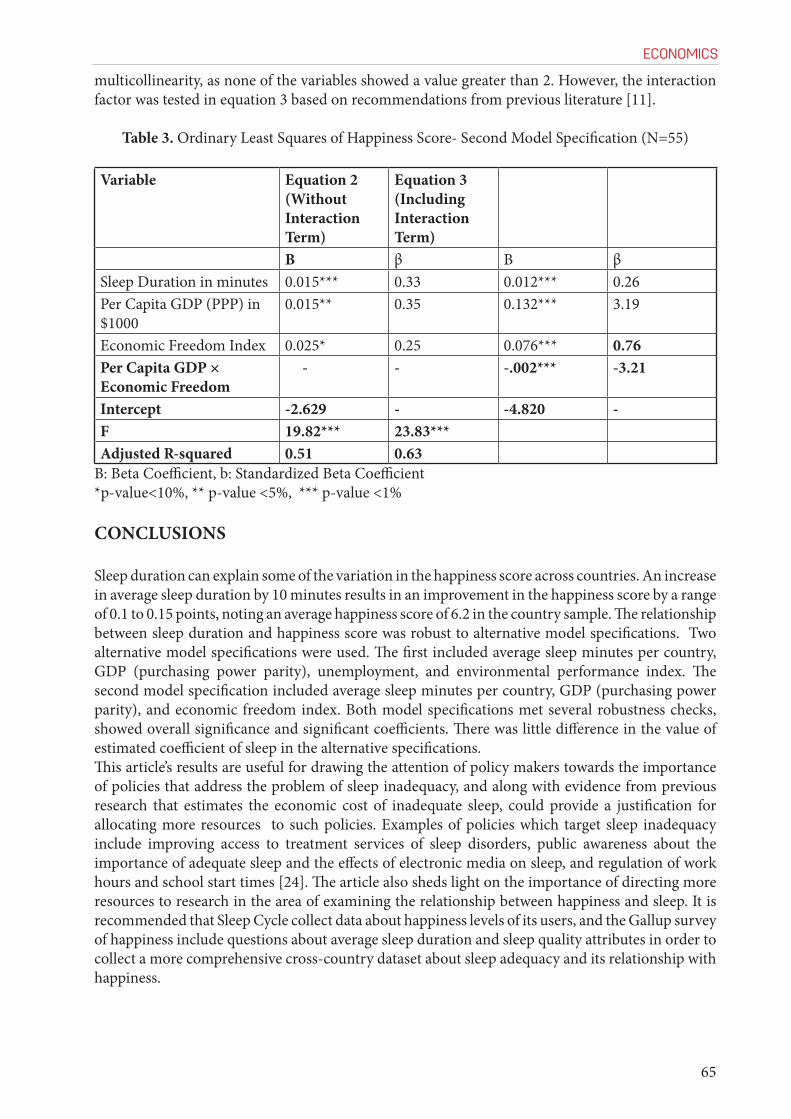
ECONOMICS
65
multicollinearity, as none of the variables showed a value greater than 2. However, the interaction factor was tested in equation 3 based on recommendations from previous literature [11].
Table 3. Ordinary Least Squares of Happiness Score- Second Model Specification (N=55)
Variable Equation 2 (Without Interaction Term)
Equation 3 (Including Interaction Term)
B β B βSleep Duration in minutes 0.015*** 0.33 0.012*** 0.26Per Capita GDP (PPP) in $1000
0.015** 0.35 0.132*** 3.19
Economic Freedom Index 0.025* 0.25 0.076*** 0.76Per Capita GDP × Economic Freedom
- - -.002*** -3.21
Intercept -2.629 - -4.820 -F 19.82*** 23.83***Adjusted R-squared 0.51 0.63
B: Beta Coefficient, b: Standardized Beta Coefficient*p-value<10%, ** p-value <5%, *** p-value <1%
CONCLUSIONS
Sleep duration can explain some of the variation in the happiness score across countries. An increase in average sleep duration by 10 minutes results in an improvement in the happiness score by a range of 0.1 to 0.15 points, noting an average happiness score of 6.2 in the country sample. The relationship between sleep duration and happiness score was robust to alternative model specifications. Two alternative model specifications were used. The first included average sleep minutes per country, GDP (purchasing power parity), unemployment, and environmental performance index. The second model specification included average sleep minutes per country, GDP (purchasing power parity), and economic freedom index. Both model specifications met several robustness checks, showed overall significance and significant coefficients. There was little difference in the value of estimated coefficient of sleep in the alternative specifications. This article’s results are useful for drawing the attention of policy makers towards the importance of policies that address the problem of sleep inadequacy, and along with evidence from previous research that estimates the economic cost of inadequate sleep, could provide a justification for allocating more resources to such policies. Examples of policies which target sleep inadequacy include improving access to treatment services of sleep disorders, public awareness about the importance of adequate sleep and the effects of electronic media on sleep, and regulation of work hours and school start times [24]. The article also sheds light on the importance of directing more resources to research in the area of examining the relationship between happiness and sleep. It is recommended that Sleep Cycle collect data about happiness levels of its users, and the Gallup survey of happiness include questions about average sleep duration and sleep quality attributes in order to collect a more comprehensive cross-country dataset about sleep adequacy and its relationship with happiness.

ECONOMICS
66
REFERENCES
[1] Hillman, D. et al. (2018). The economic cost of inadequate sleep, Sleep, 41(8): 1- 13, https://doi.org/10.1093/sleep/zsy083[2] Hafner, M., et al. (2016). Why sleep matters — the economic costs of insufficient sleep: A cross-country comparative analysis. Santa Monica, CA: RAND Corporation. https://www.rand.org/pubs/research_reports/RR1791.html.[3] Shin, J. E., and Kim, J. K. (2018).: The Role How a Good Sleep Predicts Life Satisfaction of Zero-Sum Beliefs About Happiness. Frontiers in psychology, 9, 1589. doi:10.3389/fpsyg.2018.01589.[4] Piper, A.T. (2015). Sleep duration and life satisfaction. The German Socio-Economic Panel study. 745, Berlin: DIW.[5] Baglioni, C, et al. (2011). Insomnia as a predictor of depression: a meta-analytic evaluation of longitudinal epidemiological studies. Journal of affective disorders, 135( 1-3): 10-9. doi: 10.1016/j.jad.2011.01.011.[6] Dinges, D.F, et al. (1997). Cumulative sleepiness, mood disturbance, and psychomotor vigilance performance decrements during a week of sleep restricted to 4-5 hours per night. Sleep. 20(4):267-77.[7] Easterlin, R A.(1974). Does Economic Growth Improve the Human Lot? Some Empirical Evidence. In David, P.A. and Reder, M.V(Eds), Nations and Households in Economic Growth: Essays in Honor of Moses Abramovitz (pp. 89-125). New York: Academic Press. Available at: https://carleton.ca/linr/wp-content/uploads/15-Easterlin-1974-and-2010-1.pdf[8] Easterlin, R. A. et al. (2011).The Happiness-Income Paradox Revisited. IZA Discussion Paper No. 5799. [9] Stevenson, B. and Wolfers, J. (2008). Economic Growth and Subjective Well-Being: Reassessing the Easterlin Paradox. Brookings Papers on Economic Activity. Economic Studies Program, The Brookings Institution, 39(1 (Spring), 1-102. [10] Deaton, A. (2008). Income, health, and well-being around the world: Evidence frovariablevariablem the Gallup World Poll. Journal of Economic Perspectives. 22:53–72.[11] Gropper, D., R. Lawson and J. Thorne, Jr. 2011. Economic freedom and happiness. Cato Journal. 31: 237-255. [12] Helliwell, J., Layard, R., and Sachs, J. (2019). World Happiness Report 2019, New York: Sustainable Development Solutions Network.[13] Gorham, E., Lehman, C. and Kelly. J. (2019). Relationships of the Environmental Performance Index to Six Interrelated Variables in Nations Around the World. The Bulletin of the Ecological Society of America. 100(2):e01525. https://doi.org/10.1002/bes2.1525[14] Majeed, M.T. and Mumtaz, S. (2017). Happiness and Environmental Degradation: A Global Analysis. Pakistan Journal of Commerce and Social Sciences. 11 (3), 753-772.[15]Troser, J. (2019). Which Countries get the most sleep?. The Economist. https://www.1843magazine.com/data-graphic/what-the-numbers-say/which-countries-get-the-most-sleep[16] Sleep Cycle (2014). New Zealand got the most sleep of all countries in November. https://www.sleepcycle.com/wp-content/uploads/2014/12/November-World-of-Sleep.pdf[17] World Bank. (2019). World Development Indicators. Washington, D.C.: The World Bank (producer and distributor). http://data.worldbank.org/data-catalog/world-development-indicators[18] Wendling, Z. et al. (2018). 2018 Environmental Performance Index. New Haven, CT: Yale Center for Environmental Law and Policy. https://epi.yale.edu/[19]World Justice Project. (2018). WJP Rule of Law Index 2017-2018. IBSN (online version): 978-0-9882846-3-0. Washington, D.C. : World Justice Project. https://worldjusticeproject.org/sites/default/files/documents/WJP-ROLI-2018-June-Online-Edition_0.pdf[20] Transparency International (2019). Corruption Perceptions Index 2018. https://www.transparency.org/cpi2018[21] Lang, J. (2012). The Most Influential Factors in Determining the Happiness of Nations. Major

ECONOMICS
67
Themes in Economics. 14 (5). https://scholarworks.uni.edu/mtie/vol14/iss1/5[22] Miller, T., Kim, A.B., and Roberts, J.M. (2019). 2019 Index of Economic Freedom. 25th Anniversary Edition. Washington, D.C. :The Heritage Foundation. https://www.heritage.org/index/pdf/2019/book/index_2019.pdf[23] STATA(2019). Basic Reference Manual-Post Estimation Tools for Regress. https://www.stata-press.com/manuals/r_regresspost.pdf[24] Barnes, C.M and Drake, C.L.(2015). Prioritizing Sleep Health: Public Health Policy Recommendations. Perspectives on Psychological Science. 10(6): 733-737.
APPENDIX
Sleep Duration and Happiness Score of the countries included in the Sample
Figure A.1 Sleep Duration and Happiness Score by Country
Source: Sleep data from [15 ] and Happiness Score from [12].

ECONOMICS
68

69
Volume 7, No.2 2019ISSN 2303-5005
1 Istanbul University, Department of Economics, Turkey2 Social Sciences University of Ankara, Faculty of Foreign Languages, Department of English Language and Literature, Turkey3 Batman University, Vocational Higher School, Program of Banking and Insurance, Turkey4 Mustafa Kemal University, Rectorate, Turkey
*This study is based on a project supported by The Ostim Technical University (Turkey). We are thankful for its support.
ABSTRACT
In Turkey, digitalization of curricula, teachers, course materials, and educational technologies is relatively slower when compared with the ones in economic sectors and state services in general. In this study, we proposed a model for a new generation university in a digitalized society. The Council of Higher Education classifies universities in three categories (mission) to respond to technological and economic developments in the societal life: research, regional-development oriented and thematic universities. At national level, a digital transformation office acts as a coordination and orchestration body among governmental institutions in order to carry and transform public services into digital environment. The private sector naturally has to be digitalized by national and international severe competition. The tool developed in this study based on the model developed by Toprak et al. (2019). That model aims to compensate for coordination gaps in the traditional university hierarchical structure, which is designed as department, faculty board, university board and senate, from administration to governance. Five innovations can be mentioned in terms of organizational and functional configuration of a university model proposed there: (i) profile of graduate and mission of the new generation university in the fields of education, research and community services, (ii) policy development and implementation offices, (iii) university ecosystem consultation and steering committee and other committees and boards, (iv) concept courses and branded courses, (v) coop education and solution partnerships. The Rector’s Office acts as an executive committee to prevent coordination gap in the proposed model.A checklist has been developed for the processing of that model and hence it is made possible to measure the performance of an applied university and degree of compatibility with the model. Thus, the framework and content of the mechanism and tools traditionally used in quality assurance and accreditation will need to be updated in line with this model.
Keywords:New generation university, university 4.0, university governance, digital society, mission university.
DEVELOPING A TOOL FOR QUALITY AND ACCREDITATION OF A NEW GENERATION UNIVERSITY IN THE DIGITALIZED SOCIETY:
THE CASE OF A THEMATIC-TECHNICAL UNIVERSITY*
Metin Toprak1, Yüksel Bayraktar1, Armağan Erdoğan2,Deniz Kolat3, Mehmet Şengül4
date of paper receipt:30.04.2019.
JEL: I23, I25, O35, P46
Review Article doi: 10.2478/eoik-2019-0017 UDK: 378.014.3/.4
date of sending to review: 03.05.2019.
date of review receipt:23.05.2019.

ECONOMICS
70
INTRODUCTION: MOTIVATION AND RESOURCE
The digitalization phenomenon presents a challenge for economic sectors, state services, and education in all societies if they fail to implement the appropriate digitalization strategies. Digitalization of media, production and thinking brings new opportunities to the societies adopting it well and introduces threats to those lagging behind. The term “information and communication technologies” is enriched and updated with new explanations and inspirations on a daily basis. Education system of a country is the only asset that enables or disables that country to be updated or outdated. Turkey officially changed its system of governance with the 2018 presidential and parliamentary election. Presidential government system introduced a new model based on four pillars: (i) ministries,(ii) offices,(iii) policy boards, (iv) directorates. After almost one year of its implementation, it has now been discovered that the necessary mechanisms and instruments to ensure that the working of the system was not designed and integrated into the system before it took effect. However, the design of the new government system is in line with the agenda of the EU 2020 and especially digital Europe vision. Since Turkey is an official candidate for the EU, all measures and items on the EU agenda are compulsory to be implemented by Turkey. It is evident that fancy and trendy systems and visions are necessary but not sufficient for upgrading and updating a system, and adequacy of human resources is also crucial. Ostim Technical University (OTU) is newly established (2017) and getting ready to be fully functioning in the 2019 Fall semester. Our research team was asked to develop a university model compatible with the European Higher Education Area (EHEA) reform topics: 21st century skills (Cedefop, 2016; Shapiro, Lauritzen and Irving, 2011; Erdoğan and Toprak, 2014; Holtzman and Kraft, 2011), active participation of stakeholders (Chapleo and Sims, 2010), and corporate governance principles (OECD-IMHE, 2009; Toprak and Bayraktar, 2017). A model and its checklist have been developed (Toprak et al., 2019). In this study, the model developed is summarized and the comprehensive checklist is detailed with its various dimensions. Turkish University system has been adopting EHEA agenda since 2001 when Turkey became a signatory of the Bologna Process (EHEA, 1998, 2018, 2019). The model of OTU constitution (statute) was developed by the research team based on the approach developed for a new generation university (Ostim Technical University, 2018).The main data source for specifying dimensions, parameters and variables used in this study is the group of experts in various fields in Turkish universities. During establishing a practice-based education model and curricula of study programs, checklist dimensions and items were also developed simultaneously. The expert group consisting of a total of 20 people evaluated early drafts of the tool (checklist) and then the tool was finalized based on the suggestions of this group of experts. The checklist developed in this study would rather be used for accreditation and institutional evaluation.
1. THE NEED FOR NEW UNDERSTANDING AND NEW MODEL IN THE UNIVERSITY SYSTEM
Whether universities have the necessary mechanisms and instruments to fill the gap between industry and university is a hot topic of discussion in Turkey. The direct access to an entrepreneurial university must begin with governmental initiation. Then industry & university collaboration will follow the first step. Thus, government-university‐industry triple helix will be an interactive mechanism that is assumingly synergetic. The last step in the process will be on demand coming

ECONOMICS
71
from industry to university and thus university‐pushed triple helix will occur (Bizri et al., 2019; Etzkowitz et al., 2013; Zhou, 2008). The main benefit expected from triple helix is the synergy accruing from normative control of government, wealth generation of industry and novelty production of university (Murphy, 2011; Lee, 2011; Lu, 2008; Ughetto, 2007). The 4th generation university model slightly differs from triple helix paradigm and includes one more dimension, i.e., society (Savignon, 2018; Scalia, 2018; Galvão et al., 2017; Yang and Holgaard, 2012). Technological improvements, deeper understanding of tertiary governance systems in terms of their organizational and functional architecture, and experience of the research team in implementation of the EHEA reform topics in Turkey allowed the compilation of a holistic model for a new generation university model and its checklist that can be used by quality assurance units and accreditation agencies. However, the main obstacle against the employment of this mechanism would be intellectual capital in decision making bodies in higher education sector (Lombardi et al., 2019; Kabashkin, 2018; Dewar, 2017; Kireçci et al., 2016; Toprak and Erdoğan, 2013; Toprak, Erdoğan and Açıkgöz, 2013; Baker and Henson, 2010; Hawkins, 2000). The holistic approach consists of the following components and framework: 1. Centrally regulated and supervised with an active participation of stakeholders, and
autonomously operating units, offices and committees (integrated governance through information technologies),
2. Higher interaction of units and committees (internal-external, horizontal-vertical),3. Effective stakeholders’ engagement (public sector, business world, employees, alumni, education
and training staff, students),4. High diversity (staff and student),5. Based on competitiveness,6. Focusing on change & innovation and a high degree of interdependence,7. Focusing on production and commercialization,8. Adopting a utilitarian philosophy,9. The outcome-oriented (reviewing the processes according to the result) to equip the alumni
with the necessary knowledge and skills to ensure competencies for employability. 10. Based on pre-established standards (qualifications framework, professional / occupational
standards, core competencies),11. Ensuring quality assurance,12. High accountability to the community (public) and other stakeholders,13. Focusing on learning by doing and on the job training,14. Implementing internationalization as a priority dimension,15. Not neglecting the social dimension (considering the needs of disadvantaged groups and
individuals).
2. RESEARCH PROBLEM, RESEARCH TEAM, DATA SOURCES
The problem of this study can be formulated as Why does (the Council of Higher Education (CoHE) try to direct universities by linking them with research and regional development, and Why are Turkish universities lagging behind in comparison to peer universities in Europe? Our hypothesis is the organizational and functional structuring and operating model of Turkish universities is the main factor in comparatively inadequate performance. Due to their duties, the researchers who make this study spend a significant portion of their work in the fields and subjects mentioned above. In addition, the research team also included experts in various fields while developing curricula. The university model established in this study is called applied thematic-technical new generation university.The research team consists of researchers working in the vocational education and reforms in higher education at the national level. The research team has involved directly and deeply in the

ECONOMICS
72
development of Turkish Qualifications Framework (CEC, 2015), qualifications framework of Turkish higher education institutions (Council of Higher Education, 2010), national occupational standards (CEC, 2019) and quality assurance. Therefore, the research team is competent due to this direct engagement. Considering the organizational and functional architecture envisaged in the Law No. 2547, it was considered that it is possible to develop a model within the framework of existing legal and institutional arrangements without requiring legal changes. Therefore, a university model based on international and national developments in the fields and subjects identified as the vision above has been designed.
3. DIMENSIONS OF GOVERNANCE MODEL OF A NEW GENERATION UNIVERSITY
The new generation model developed is not presented in this study. However, via evaluation checklist, main parameters and variables can be easily detected. A checklist has been developed to evaluate performance and adaptation of the new generation university (NGU) to changing conditions (EC, 2017; Alan, 2016; Erdoğan and Toprak, 2012; Deema, Mokb and Lucasa, 2008). Mechanisms and instruments of the NGU are supposed to update inputs, processes and outcomes automatically via traditional academic / administrative units, newly introduced offices, committees, solution partnerships and concept / branded courses. The following dimensions will be evaluated in the context of NGU in the stages of quality assurance and accreditation assessment:
3.1. BRIEF INTRODUCTION OF THE UNIVERSITY
Every university has a welcome note to its stakeholders and assessors. Here, the university is introduced to the evaluator briefly such as university’s motto, the nature of education and the greeting message to the general audience. Thus, it will be possible to get the first impression of the university to be evaluated.
3.2. DESCRIPTION OF PRACTICE-BASED EDUCATION
A general short description of the practice-based education that the university has adopted is given under this title, and during the evaluation it will be taken as benchmark. The concept of practice-based education covers on-the-job-training, work-based training, learning by doing, laboratory work and workshop. Learning outcomes are evidence-based. Practice-based education approach describes systemic and systematic model in terms of framework, content, mechanisms and instruments. With this holistic model, it will be possible to secure the vision of the university and guarantee the realization of its objectives. For the impact of practice-based education on the university organizational and functional operating model (Artut and Bal, 2018; Estébanez, 2017; Cedefop. 2016; Drewery, Nevison and Pretti, 2016; Johnson, Johnson and Smith, 2013; Cedercreutz and Cates, 2010; Bulut, 2010; Johnson, Johnson and Holubec; 2008; Haddara and Skanes, 2007; and Barbeau, 1973).
3.3. VISION AND PURPOSE
The university’s vision is to teach its students at the international standards, deliver practice-based education and adequate social & physical infrastructure. It aims to have graduates who are able to work effectively in projects, designing, entrepreneurship and innovation. Sensitivity to social and cultural issues is another strength of the education it delivers.The university aims at delivering skill-based, vocationally-oriented and learner-centered education. All social stakeholders actively participate in the educational processes. Commercialization /

ECONOMICS
73
branding, patent, design, and copyrights complement the education system at the university. Knowledge production is, in principle, project-based and research-based (Piirainen, Andersen and Andersen, 2016; Deus, Battistelle and da Silva. 2016; Reyes, 2016; Striukova and Rayna, 2015; Liu, 2012; Weenen, 2000).
3.4. OUTLINE OF THE UNIVERSITY’S PRACTICE-BASED EDUCATION MODEL
In the practice-based education model, education and research are intertwined with implementation and industry, and feedback mechanisms are internal to the system. The university is positioned as an integral part of the ecosystem. In this way, it will be ensured that the university is motivated to keep itself up to date due to interactive communication with internal and external stakeholders.Criteria for evaluating the design and performance of the concept of practice-based education can be summarized as follows according to the framework given in the appendix.Profile of the graduate is one of the key factors in any education model. The intention and direction of the education program may easily be detected based on designation of profile(s) of graduates. For instance, graduate of management program may have four types of graduates: - accounting-finance-commercial law; -management and commercial law; - production management and marketing; and - quantitative methods. However, there is only one profile of graduate foreseen at bachelor’s degree in general. Design of curriculum is a multi-dimensional phenomenon: the ratio of compulsory-elective courses, the design of the concept and branded courses, and compatibility level of the design curriculum with the vision and aims of the university. The ratios of compulsory and elective courses directly affect the designation of curriculum and share of concept and branded courses. National regulations and occupational standards must be considered in designing the model. The changing ratios of theoretical, application and competence-based courses thru education years are directly related to the model chosen. While cornerstone courses are mainly theory and instrument (statistics, quantitative decision-making techniques etc.) oriented, capstone courses are mostly job market and skills oriented. The teaching and learning ways and the environments of education and training can give strong clues regarding the characteristics of the model. Classroom, laboratory, multimedia, workshop, company (university owned or outside university) are main places for the model. The share of each of these places in both theory-based and practice-based courses also show if the model is really practice based.Compatibilities with modular design of curriculum, compliance with profile differentiation, suitability for field diversification / differentiation, and eligibility to improve the social dimension are elements in the cross-check tool if design of curriculum allows the practice-based model. In the new generation university model, a university is assumed to specify some concepts that its graduates will have some distinguished skills and competences that coming from education of these concepts. For example, a thematic technical university allows the following concepts to be obtained by its graduates at various levels and contents: idea and concept of design; project / process design and management; R & D and innovation; algorithm and coding; entrepreneurship, leadership, coaching, mentoring and tendency to innovation; preparation to business world; transformational history of industry and company; environmental sustainability and sustainable development; digital media, communication design and content production; and quality assurance. All these concepts must be considered during curriculum formation and updating. In the new generation university model, collaboration of the university with the industry goes toward the model of “educating and training students together”. The university may specify some courses provided by the industry (associations, companies, public institutions, NGOs, etc.). The branded courses determined by the thematic-technical university are as follows: occupational law and regulations (related profession); financial technology; international trade and taxation; insurance management; participation (Islamic) banking; commercial banking; digital marketing; digital media, communication design and content production; IT management in business; health, safety and environmental management; supply chain and logistics; network systems engineering;

ECONOMICS
74
advanced web technology; big data analysis; forensic IT; cloud computing and applications; IoT and Industry 4.0; application development for android devices; and graphics and design.Regulatory framework has inside and outside dimensions. National regulations and frameworks (outside) are mandatory for all higher education institutions and institutional regulations (inside) must be in line with national ones. If national regulations are not flexible enough, it is quite hard to implement a uniquely developed model without going around. European and hence Turkish regulations and frameworks are quite flexible and allow a wide diversity in designing programs. The following items are the main components of a checklist while assessing national regulations: Actuality, the degree of allowing profile differentiation, applicability, compliance with international standards, and innovative aspect. The institutional regulation regarding a study program is program key learning outcomes (PKLOs). After assuring the compatibility of PKLOs with national frameworks, content designation and learning outcomes (LOs) of the individual courses can be described in line with PKLOs. In evaluating PKLOs if they allow effective practice-based education model the following items are assessed: actuality; compliance with international standards; knowledge propositions; skill propositions; propositions for taking responsibility and working autonomously; stakeholder engagement; consistency of goal, context and verb; applicability / feasibility; originality; the degree of allowing profile differentiation; innovative aspect; learning and teaching environments and methods; measurement and evaluation methods; environments and methods of theoretical education; environments and methods of practical education.Design and feasibility of solution partnership must be in line with the practical training model. The following items are taken into account during evaluation: inclusion of relevant stakeholders in designing solution partnerships; feasibility / applicability; suitability of defined solution partnerships for education & training; eligibility of defined solution partnerships for project and research; suitability of defined solution partnerships for practice; suitability of defined solution partnerships for skill development; and cost advantages / disadvantages of defined solution partnerships over traditional education system. In the context of thematic & technical university model, the most probable solution partnerships are following: tutorials; laboratory; multimedia laboratory; foreign language; workshop; practice (workplace: ‘industry’); skill development (workplace: workshop at university garage / hangar); employment; project development; product and service development; R&D and innovation; curriculum update and program development; Vocational Qualifications Authority (VQA) standards and qualifications; 21st century skills; national and global network design and management; entrepreneurship and leadership; broadcast development; equal opportunity and ethical issues; disadvantaged; digital agenda; quality assurance and accreditation; and internal control and internal audit. Potential and capacity of a university is crucial to make the practice-based model successful. The degree of the physical, financial and infrastructural facilities of the university must allow the practice-based education model. In addition, the degree of the academic and research staff of the university must be enough to implement the relatively higher cost model. While assessing the facilities of a university regarding its potential and capacity the leading items are following: research & publication performance, field experience and educational background of academics and research staff; university financial capacity and opportunities allocated to education and research; physical environment, social facilities, transportation, and housing; laboratory, IT infrastructure, and library; and adequacy and readiness of network and ecosystem outside the university. All the above explanations related to type of courses, design of curriculum, engagement of stakeholders and solution partnerships affect directly the design of the teaching and learning ways. By assessing teaching and learning ways obtained from implementation of teaching and learning ways can give direct indicators if the model is effective practice-based. When talking about the content and tools of practice-based education & training model, we also imply organizational and functional structure and operating model. Beside committees and boards, policy development and implementation offices are also envisaged as new units. In traditional

ECONOMICS
75
university system program, department, faculty and rectorate are envisaged and hierarchy is quite simple and mostly vertical. In the new generation model new offices, committees and stakeholders must involve all decision making, implementation and revision processes. In order to assure this effective functioning and involvement of stakeholders in the committees and boards the following criteria must be assured in the establishment and functioning: the relationship between the university purpose and vision; stakeholder engagement; accountability; applicability of decisions; consistency of the operating model; effectiveness of the operating model; focus on output; and focus on process. It is very important to whom or to which units these committees / boards will report, or which units or persons will report to these committees / boards. The list of committees / boards is provided in the appendix. New functions and responsibilities of a new generation university necessitate intermediary committees and bodies. The committees / boards envisaged here are designed to fill the gap resulting from coordination, cooperation and implementation processes of traditional and new generation units. (Toprak et al., 2019).The other important organizational and functional new units are policy development and implementation offices. The following offices are assumed to fill the gap in the traditional university structure: strategy development, standards and quality assurance office; external relations office; project development and management office; technology transfer office; career planning and on-the-job training office; business and alumni relations office; entrepreneurship and leadership office; new jobs and new skills office; lifelong learning office; internal control and internal audit office. In order to assess to what extent the design of policy development and implementation offices contribute to the practical training model, the following items can be used: the relationship between the university purpose and vision; stakeholder engagement; accountability; applicability of decisions; consistency of the operating model; effectiveness of the operating model; output orientation; and process orientation.The comprehensive illustration that portrays all items in the governance model of the new generation university model panoramically is given at Figure 1.
3.5. PROFILE OF GRADUATE
Single or multiple alumni profiles can be designed in the curriculum on modular system. The type and design of the alumna profile are determined through the consensus and active participation of the stakeholders in line with the needs of the business world and the framework of the curriculum (Kulkarni and Kulkarni, 2019; McRae and Ramji, 2017; Patton, 2017; Wagenaar, 2016; Sheety et al., 2016; Bruton, 2014; Sumanjeet, 2012; Holtzman and Kraft, 2011; EC, 2010; Wagner, 2009; EC, 2008). Each course in the practice-based education model is designed in three dimensions: theory, practice and competency. In terms of these three dimensions, the average ratios are calculated as follows (for the management program):for the theoretical part : 56,2% for the practice-based part : 30,0%for the competency part : 13,8 %
3.6. THE KNOWLEDGE, SKILLS AND COMPETENCE DIMENSIONS OF THE CURRICULUM
In a bachelor’s degree program (the pilot program as an example), while the ratio of theoretical education gradually decreases over the years, the skills and competency dimensions increase. In our example (management program), the share of the theoretical part in the curriculum decreased from 74% in the 1st year to 33% in the last year. While the share of the practice-based education in the curriculum is 17% in the 1st year, it increases to 51% in the last year. Similarly, the share of competency in the curriculum is 9% in the 1st year and 16% in the last year.

ECONOMICS
76
3.7. THE WAYS COURSES ARE TAUGHT
The way in which the theoretical parts of courses or pure theoretical courses are given, or the environments in which the knowledge gained in the classroom environment are differentiated in the practice-based education model. In the acquisition of theoretical knowledge, learning by doing environments (laboratory, multimedia environment, workshop, companies) and skill development classrooms (solution partnerships of the personnel of the university staff) are expected to play an important role.
3.8. QUALIFICATION INFORMATION FORM
The content design of the diploma information form, or alias qualification information form provides important clues about the effectiveness of the practice-based education model. The level of the design and implementation of the concept of the practice-based education model can easily be tracked in this form.
3.9. UNIVERSITY POSSIBILITIES AND CAPABILITIES
The practice-based education model needs more attention of managers of university and program as well as academic staff, in terms of program design, implementation, monitoring and review. In addition to financial opportunities, research and education infrastructure, qualified academic staff brings higher education cost. Practice-based experience, project skills and competency of lecturers and research staff are much more demanding when compared to traditional classroom-based system. However, in case of lack of infrastructure and qualified teaching staff required by the practice-based education model, the risk of failure of the model is quite high and the academic competency of the alumni tends to worsen.
3.10. TURKISH HIGHER EDUCATION QUALIFICATIONS FRAMEWORK DESIGN AND PRACTICE-BASED EDUCATION
The Turkish Higher Education Qualification Framework (TQF-HE) is developed by the CoHE, which is the national regulatory and supervisory authority for higher education system in Turkey. The level of compliance of practice-based education model with TQF-HE is critical. Since practice-based education means a significant balance shift in terms of knowledge and skills & competences; LOs described in the TQF-HE should allow this shift. For this reason, not only curricula of education program but TQF-HE should also be reconsidered.
3.11. PROGRAM KEY LEARNING OUTCOMES
The program key learning outcomes (PKLOs) indicate the knowledge, skills and competencies that graduates of an education program will have. The analysis of the PKLOs gives an idea about the profile of the program, the profile of graduates and the orientation of education. The scope of the practice-based education model will affect the PKLOs structurally. For this reason, PKLOs are vital in evaluating a program which describes the profile of the graduate.
3.12. RELATIONSHIP BETWEEN PKLO AND TQF-HE
PKLOs are more concrete and specific than the TQF-HE level descriptors. In evaluating the compliance of practice-based education model with PKLOs and TQF-HE; the weights are 0,75 for PKLOs and 0,25 for TQF-HE.

ECONOMICS
77
3.13. COURSE LEARNING OUTCOMES
The course learning outcomes (CLOs) show the scope of the course, the way it is taught, the relative position of the course in the curriculum, the set of knowledge, skills and competences acquired by the students and the environments and forms of acquisition of this set. CLOs are more concrete, observable, measurable and comparable than PKLOs. It should be possible to set a relationship between CLOs and PKLOs and conclude whether PKLOs are based on solid foundations.
3.14. THE RELATIONSHIP OF CLOS AND PKLOS
Since CLOs are more concrete and specific than PKLOs, in the evaluating compatibility of CLOs and PKLOs with the practice-based education model, the weight ratio of CLOs is higher than that of PKLOs. In evaluating compliance of practice-based education model with CLOs and PKLOs; the weights are 0,75 for CLOs and 0,25 for PKLOs.
3.15. COMPULSORY-ELECTIVE COURSE RATIO
The ratios of compulsory courses and elective courses in total significantly determine the composition of major, minor or double major. Organizing elective courses on the basis of individual courses (at the level of program, faculty or university) or on the basis of modules (bundle of courses) depends on the profiles of the program and the graduate.
3.16. COMPULSORY-ELECTIVE COURSE DESIGN
Designing compulsory and elective courses in line with the practice-based education model is critical in terms of program profile and graduate profile. While designing the compulsory and elective courses, the following points are critical: the thematic and sequential relationship between compulsory courses, the relation of education program with other ISCED detailed and narrow fields, the conformity with the modular design, the design as concept courses and branded courses, and the design in the form of professional proficiency certificate programs.
3.17. DESIGN OF SOLUTION PARTNERSHIP
In the practice-based education model, it is not possible for the university to equip its students with the prescribed outcomes, to carry out research and projects only with its own means. All social stakeholders in the ecosystem are expected to take part in education at different levels in the practice-based education model. Stakeholders need to be in close cooperation with the university programs in the fields of education, research, projects, laboratories, workshops, internships, etc. University governance model should take corporate governance principles into consideration while designing new generation committees & boards policy development and implementation offices, solution partnerships, concept and branded courses. This is a key factor for a successful model (Cozza and Blessinger, 2016a; Cozza and Blessinger, 2016b; Liu and Kong, 2015; Toprak and Erdoğan, 2012; Antal et al., 2014; Macpherson, 1997).
3.18. CONCEPT COURSES AND BRANDED COURSES RATIOS
Concept courses play a critical role in the realization of the vision and purpose of the university, which is the fundamental justification of the foundation of the university. The proportion of concept courses and branded courses in the curriculum is also an important indicator for the profile of the graduates (Gartland and Smith, 2018; Olsson, 2016; Poon and Brownlow, 2015; Farnsworth, 1970).

ECONOMICS
78
3.19. DESIGN OF CONCEPT COURSES
The concept courses differentiate the university from other universities in terms of the vision and the purpose. The privilege of graduates is mainly based on the outcomes acquired via concept courses. That the graduates of the university can be expected to be positively treated and accepted by employers since they have learning outcomes acquired thru concept courses. The concept courses in the curriculum are developed based on a wide consultation and direct evaluations of the business world (Hasan et al., 2017; Rubens et al., 2017; Bacanlı et al., 2016; Marri et al., 2002).Design (innovative thinking, multi-dimensional thinking); algorithm and coding (CIT, computing technologies and cloud computing, data base analysis); project / process planning and management; R&D and innovation (process from idea to product: “patent, trademark, license”); entrepreneurship and leadership; preparation for business world; environmental sustainability and sustainable development; digital marketing, communication design, content production and quality assurance have been determined as the concepts of the university. While preparing curricula for the university’s diploma and certificate programs, the above thematic concepts will need to be designed individually or as a combination of course, practice, internship, project, research and community service activity. These thematic concepts will be transformed into output in the form of academic competencies that the graduates are assumed to have. As an authenticity of the thematic applied university, it is envisaged that an office and committee will work in order to successfully implement and update these thematic concepts determined by a wide consultation.It can be said that, the thematic concepts emphasized by a university aiming to be established within the organized industrial zone (OIZ) are not designed in national or international qualifications frameworks following the aforementioned approach. Therefore, when the thematic university is in question, it is necessary for national authorities to encourage such conceptual priorities. A university operating in the OIZ and specifying a unique set of concepts does not necessarily exclude other common / popular competencies. For example, it is not a handicap for any thematic university to acquire the competencies developed as the 21st century skills in all higher education programs besides the university-specific concepts.Since the spectrum of the concept courses is remarkably wide, it is not economically feasible to have students achieve the predetermined learning outcomes of conceptual courses only by a university’s own means. In fact, in the practice-based education model, active participation of the related stakeholders in the processes is essential. Stakeholders who have potential and capacity in some concept courses should play an active role to help students to acquire these competencies. Since the implementation of these concept courses is quite costly, the critical point here is implementing an operating model in the design of these concepts. The main reason for practice-based education is based on the deficiencies of the graduate in these concepts. Therefore, designing, implementing, reviewing and updating of the concept courses is a priority. Recognition of prior learning is an instrument that is essential in the practice-based education model. Since student learning takes place in the practice environment, unplanned and unintended learning is also expected to occur frequently. In this case, implementation of the RPL approach will be an important source of motivation for students’ learning.
3.20. DESIGN OF BRANDED COURSES
One noteworthy phenomenon in industry-oriented universities is the application of branded courses. Famous brands are opening courses to promote and disseminate their soft or hard products. These courses are given mostly by the professionals in these companies. This application, which is a new form of university - industry interaction, is predicted to create a significant synergy through feedback. For example, Microsoft offers more than a dozen of courses in the field of information and communication technologies in the Microsoft Virtual Academy platform. It is also possible to make assessment of these courses in accredited Microsoft exam centers.

ECONOMICS
79
Globally manufacturing companies, especially those in the technology and IT sectors, have significant competitive advantages and wide and integrated product range in the market. These companies frequently develop strategies that can lead to market closure.Companies such as Microsoft, Apple and IBM bring an important step to vocational education and university education with the course modules they develop. For example, the courses offered by Microsoft cover almost half of the university program on computer science. Since this trend will continue to be evident, designing and incorporating products and brands of companies that are significantly influential in the global market as courses or modules (bundle of courses) will provide a significant advantage for graduates in entering the labor market. It is of strategic importance that the subjects that overlap with the university education programs should be designed as courses and modules and these proposals should be offered to companies when necessary.
3.21. ORGANIZATION AND GOVERNANCE MODEL
3.21.1. COMMITTEES AND BOARDSIn the organizational and functional architecture of the traditional university, hierarchical structure is defined at the program, faculty and rectorate levels. Duties, authorities and responsibilities are also well defined. Therefore, policies aimed at directing universities to research, project, innovation and new generation learning technologies at national level in recent years cannot be at the desired speed and scale.Subjects such as the concept courses, branded courses, recognition of prior learning, the policy development and implementation offices which constitute the basis of the practice-based education model are complementary to the traditional university organization and operating model because it is not possible to reach the desired result by only traditional organizational structures and functions. The committees and boards will need to be designed and operated as complementary and supportive. The most effective way of stakeholders’ active engagement will be the creation and operation of committees and boards, and these bodies will be the most important instrument for the university system to remain updated and dynamic (Lombardi et al., 2019; Dewing and Williams, 1995).
3.21.2. POLICY DEVELOPMENT AND IMPLEMENTATION OFFICESCreating new generation offices, committees and boards is crucial in the implementation of new academic and administrative functions and tasks not found in the traditional university organization and operating model. To call these offices as administrative or academic offices does not seem proper because both academic staff and subject matter expert staff will work together in these offices. Therefore, traditional classification of academic and administrative staff does not serve the purpose and their positions within the university organization should be determined appropriately. Policy development and implementation offices are important in terms of ensuring active stakeholder participation, keeping the education programs and the university agenda up-to-date and proactive. These offices and committees are also necessary for implementing corporate governance principles in the most effective manner. If these offices or committees are not functioning effectively, the benefits designed for the practice-based education model within the traditional university system cannot be obtained. Even worse, the new model may cause excessive bureaucracy and unnecessary paperwork (Block and Khvatova, 2017; Otala, 1994).
3.21.3. GOVERNANCE MODELThe Ostim Technical University, which positions itself as a new generation institution and focuses on practice-based education, with new organizational units and new functions added to the traditional university organizations and functions, will have quite complicated structure and functions. As it is not possible to change the legally-regulated subjects with the decisions of the university, it is necessary to develop a hybrid structure and operation in accordance with the laws and regulations as well as the application of the new generation applied university concept.
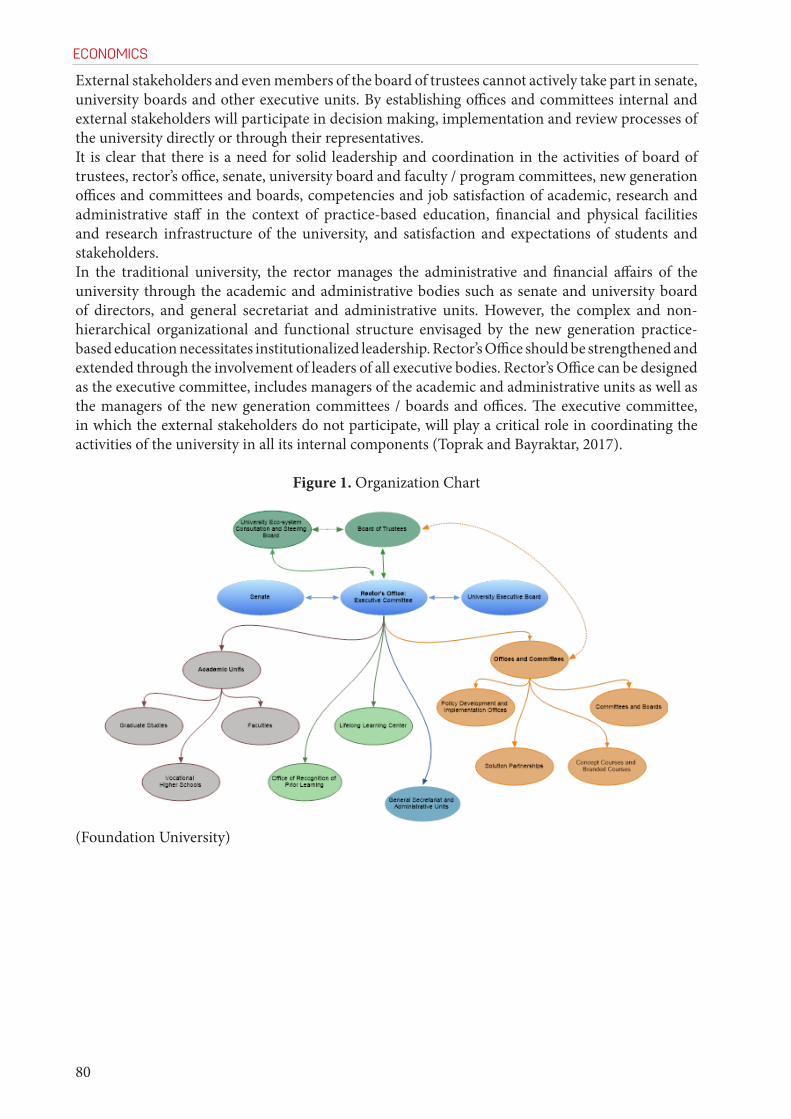
ECONOMICS
80
External stakeholders and even members of the board of trustees cannot actively take part in senate, university boards and other executive units. By establishing offices and committees internal and external stakeholders will participate in decision making, implementation and review processes of the university directly or through their representatives. It is clear that there is a need for solid leadership and coordination in the activities of board of trustees, rector’s office, senate, university board and faculty / program committees, new generation offices and committees and boards, competencies and job satisfaction of academic, research and administrative staff in the context of practice-based education, financial and physical facilities and research infrastructure of the university, and satisfaction and expectations of students and stakeholders. In the traditional university, the rector manages the administrative and financial affairs of the university through the academic and administrative bodies such as senate and university board of directors, and general secretariat and administrative units. However, the complex and non-hierarchical organizational and functional structure envisaged by the new generation practice-based education necessitates institutionalized leadership. Rector’s Office should be strengthened and extended through the involvement of leaders of all executive bodies. Rector’s Office can be designed as the executive committee, includes managers of the academic and administrative units as well as the managers of the new generation committees / boards and offices. The executive committee, in which the external stakeholders do not participate, will play a critical role in coordinating the activities of the university in all its internal components (Toprak and Bayraktar, 2017).
Figure 1. Organization Chart
(Foundation University)

ECONOMICS
81
4. DIMENSIONS OF EVALUATION: CHECKLIST TOOL
Developing a thematic-technical new generation university model (Toprak et al., 2019) needs to be confirmed by internal and external assessors. Focusing on practice-based education model, not only institutional (internal) bodies but also accreditation & evaluation agencies will use a tool to ensure that the model proposed is implemented effectively. A checklist with 20 parameters has been developed. Each parameter has different number of items regarding the content and scope of that parameter. The parameters are composed of variables that can be observable, measurable, periodically trackable, comparable, and usable for accountability, assessing performance, accreditation and institutional evaluation. They include the goal, vision and motto of university; profile(s) of graduate; curriculum design and qualifications framework based on level descriptors (knowledge, skills and competences); program key learning outcomes, course learning outcomes, design of compulsory and elective courses; design of concept courses and branded courses; teaching and learning methods and environments; university capacity in terms of human, physical and financial resources; solution partnerships and stakeholder engagement; and compatibility of governance model.
5. FUTURE RESEARCH DIRECTIONS
Developing a new generation model has various implications regarding resources (sufficient finance and other resources allocated in the beginning; depending on students fees; depending on public funds; profit-seeking, non-profit etc..), type (education, research, implementation), field (in the context of ISCED), ownership (private, public, foundation), and operating model (simple hierarchical organization or professionally operated complex organization which necessitates horizontal hierarchical management with effective stakeholder engagement). The first step is to decide aim, vision, type, financial model, field of education and operating model. After establishing and operating the university, the next step will be external assessment (accreditation and institutional evaluation).In this study a tool has been developed based on experts in various academic fields. The views of experts used here indicate that, if a university is based on the model with the components like thematic, practice-based, stakeholder engagement, and new organizational and functional units, then evaluation tool also would be quite differentiated. Various types of new generation university models would be evaluated based on uniquely developed tool for accreditation and institutional evaluation. Specialization of knowledge production also force knowledge institutions (university) to be assessed specifically. In the recent couple of years, Turkish Council of Higher Education (CoHE) has initiated new directions for public universities such as research university, mission university with regional development oriented, innovative and entrepreneurial university. The tool for each university type for measuring the performance and identifying the current status are not developed yet. The evaluation model developed here evaluates whole process inputs-process outputs based on outcomes and impact (Kotosz et al., 2016). Since the function and responsibility of the university institution has not been fully recognized and tracked in the regulations, works on this issue are done by rule of thumb (Estermann and Jorgensen, 2019; Kostosz, 2016).

ECONOMICS
82
CONCLUSION
It is recommended that the CoHE must develop nation-wide sets of accreditation and evaluation tools for specific types of universities, such as research university, regional development-oriented university, mission university, social sciences university, health sciences university. Here, a tool is proposed for thematic-technical university which prioritizes practice-based education model. After seeing outcomes, it would be possible to conduct an impact analysis and revise the proposed tool.The assumed missing link between university education and economic development would be much more effectively constructed thru mechanisms and instruments among government, industry and university. In the new generation university understanding, economic development, innovativeness, increased competitiveness and boosting entrepreneurship spirit are proposed mottos for any kind of higher education institutions. Decision making, implementation and review processes in the Turkish higher education and research areas need to be handled in a holistic approach. Otherwise, the gap between economic development and the universities we witness today will last longing.In a digitalized society and economy, it is not possible for a university, which is the main medium of the human resources, to remain outside of the trend. Turkey’s governmental system in the context of digitalized society and digitalized government has been changing for two years. As in the EU, the reform agenda of universities in Turkey is fairly loaded. In this study, a checklist has been developed for a thematic university founded in OIZ in order to make quality assurance, accreditation, and review mechanisms more effective. Organizational and functional architecture of new generation university model is based on the following features: centrally regulated and supervised with the active participation of stakeholders, and autonomously operating units, offices and committees; higher interaction of units and committees; effective stakeholders engagement; high diversity; based on competitiveness; focusing on change & innovation and a high degree of interdependence; focusing on production and commercialization / branding; adopting the utilitarian philosophy; the outcome-oriented; to equip the alumni with the necessary knowledge and skills to ensure competencies for employability; based on pre-established standards (qualifications framework, professional / occupational standards, core competencies); ensuring quality assurance; high accountability to the community (public) and other stakeholders; focusing on learning by doing and on-the-job training; implementing internationalization as a priority; prioritizing social dimension. While developing the tool here, various dimensions of practice-based education model have been taken into consideration and internal & external evaluations would be effectively based on the items in this tool. The previous descriptive framework article (Toprak et al., 2019) and this tool are two complementary instruments to create a holistic approach for the accountability of the model.

ECONOMICS
83
REFERENCES
[1]Antal, Natalie, Kingma, Bruce, Moore, Duncan and Streeter, Deborah. (2014). University-wide entrepreneurship education. In, Innovative pathways for university entrepreneurship in the 21st century. Published online: 07 October. 227-254. https://doi.org/10.1108/S1048-473620140000024009[2]Artut, Perihan Dinç and Bal, Ayten Pinar. (2018). Learning implementations about cooperative learning method, a case study in Turkey. International Journal of Progressive Education, 14(6), 168-176.[3]Bacanlı, Hasan et al. (2016). Being a university student in turkey: A comparative study in the context of city people, Turkish and international students. Journal of Higher Education. 6(2), 49–61.[4]Baker, Geoff and Henson, Debra. (2010). Promoting employability skills development in a research‐intensive university. Education + Training. 52(1), 62-75.[5]Barbeau, Joseph E. (1973). Cooperative education in America - its historical development, 1906-1971. 231p. Northeastern Univ., Boston. https://files.eric.ed.gov/fulltext/ED083913.pdf, (Access: April 5, 2019).[6]Bizri, Rima, Hammoud, Jamil, Stouhi, Marwa, Hammoud, Manar. (2019). The entrepreneurial university: a proposed model for developing nations. Journal of Management Development. 38(5), 383-404.[7]Block, Madeleine and Khvatova, Tatiana. (2017). University transformation: Explaining policy-making and trends in higher education in Russia. Journal of Management Development. 36(6), 761-779, https://doi.org/10.1108/JMD-01-2016-0020.[8]Bruton, Alex. (2014). Innovating university-based entrepreneurship in order to inform innovation for the 21st century. In, Innovative pathways for university entrepreneurship in the 21st century, Published online: 7 October, 145-170.[9]Cedefop. (2016). Application of learning outcomes approaches across Europe: A comparative study., Cedefop reference series, No. 105, 201p. http://www.cedefop.europa.eu/files/3074_en.pdf, (Accessed: April 1, 2019). [10]Cedercreutz, Kettil and Cates, Cheryl. (2010). Cooperative education at the University of Cincinnati: A strategic asset in evolution. Peer Review, 12(4), https://www.aacu.org/publications-research/periodicals/cooperative-education-university-cincinnati-strategic-asset, (Accessed: April 1, 2019).[11]Chapleo, Chris and Sims, Chris. (2010). Stakeholder analysis in higher education. Perspectives, January, 14, 12-20. [12]Cozza, Barbara and Blessinger, Patrick. (2016a). Innovative approaches in university partnerships: An Introduction to university partnerships for academic and program development. In, University partnerships for academic programs and professional development. Published online: 17 August. 3-17. https://doi.org/10.1108/S2055-364120160000007001[13]Cozza, Barbara and Blessinger, Patrick. (2016b). Pioneering approaches in university partnerships: An introduction to university partnerships for international development. In, University partnerships for international development. Published online: 12 December. 3-17. https://doi.org/10.1108/S2055-364120160000008001[14]Deus, Rafael Mattos, Battistelle, Rosane Aparecida Gomesand da Silva, Gustavo Henrique Ribeiro. (2016). Sustainability insights from the mission statements of leading Brazilian universities. International Journal of Educational Management. 30(3), 403-415.[15]Dewing, Ian P. and Williams, Bernard C. (1995). The role of audit committees in UK universities. Managerial Auditing Journal. 10(6), 10-16, https://doi.org/10.1108/02686909510088369.[16]Drewery, David, Nevison, Colleen and Pretti, T. Judene. (2016). The influence of cooperative education and reflection upon previous work experiences on university graduates’ vocational self-concept. Education + Training, 58(2), 179-192.
[17]EC. (2008). TUNING - Generic competences, http://www.relint.deusto.es/TuningProject/index.htm, (Erişim, 1 Eylül 2018).[18]EC. (2010). Europe 2020: European strategy for smart, sustainable and inclusive growth. http://

ECONOMICS
84
ec.europa.eu/eu2020/pdf/COMPLET%20EN%20BARROSO%20%20%20007%20-%20Europe%202020%20-%20EN%20version.pdf, (Erişim, 26 Eylül 2018).[19]EHEA. (1998). Sorbonne Joint Declaration. [20]EHEA. (2018a). European higher education area and Bologna Process. http://ehea.info/page-qualification-frameworks, (Erişim, 1 Nisan 2019).[21]EHEA. (2018b). The European higher education area in 2018. https://eacea.ec.europa.eu/national-policies/eurydice/sites/eurydice/files/bologna_internet_0.pdf, (Erişim, 3 Eylül 2018).[22]EHEA. (2019). The Bologna process revisited: The future of the European higher education area. http://ehea.info/media.ehea.info/file/2015_Yerevan/71/1/Bologna_Process_Revisited_Future_of_the_EHEA_Final_613711.pdf, (Erişim, 1 Nisan 2019).[23]Erdoğan, Armağan and Toprak, Metin. (2012). Governance of higher education in Turkey. Leadership and governance in higher education, 3, 95-120.[24]Erdoğan, Armağan and Toprak, Metin. (2014). What kind of higher education? References, scope and tools. Yeni Turkiye, 58(May-June), 707-718.[25]Estébanez, Raquel Pérez. (2017). An approachment to cooperative learning in higher education, comparative study of teaching methods in engineering. EURASIA Journal of Mathematics Science and Technology Education, 13(5),1331–1340.[26]Estermann, Thomas and Jorgensen, Thomas. (2019). Enabling frameworks: What universities need in the age of open innovation? https://www.eua.eu/resources/expert-voices/102:enabling-frameworks-what-universities-need-in-the-age-of-open-innovation.html (Accessed: June 24, 2019).[27]Etzkowitz, Henry and Dzisah, James. (2013). Bottom‐up Triple Helix: science policy in the states of the USA. Journal of Knowledge-based Innovation in China. 5(2), 80-96.[28]Farnsworth, Terry. (1970). How to select external courses. Industrial and Commercial Training, 2(6), 262-264.[29]Galvão, Anderson et al. (2017). A quadruple helix model of entrepreneurship, innovation and stages of economic development. Review of International Business and Strategy. 27(2), 261-282.[30]Gartland, Clare Elizabeth and Smith, Christine. (2018). Supporting progression to HE: the role of colleges and vocational courses. Education + Training, 60(6), 637-650.[31]Haddara, Mahmoud and Skanes, Heather. (2007). A reflection on cooperative education, from experience to experiential learning. Asia-Pacific Journal of Cooperative Education, 8(1), 67-76.[32]Hasan, Mahmudul, Khan, Eijaz Ahmed and Un Nabi, Noor. (2017). Entrepreneurial education at university level and entrepreneurship development, Education + Training. 59(7/8), 888-906.[33]Holtzman, Diane and Kraft, Ellen. (2011). Skills needed in the 21st century workplace: A comparison of feedback from undergraduate business alumni and employers with a national study. Business Education & Accreditation, 3(1), 61-76.[34]Johnson, David W., Johnson, Roger T. and Holubec, Edythe Johnson. (2008). The new circles of learning: Cooperation in the classroom, Edina, MN, Interaction Book Company. [35]Johnson, David W., Johnson, Roger T. and Smith, Karl A. (2013). Cooperative learning: Improving university instruction by basing practice on validated theory, University of Minnesota, 26p., (Accessed: September 1, 2018).[36]Kireçci, Mehmet Akif et al. (2016). “The internationalization of higher education in Turkey: Creating an index”. Education and Science, 41(187),1-28. [37]Kotosz, Balazs et al. (2016). How to measure the local economic impact of universities? Methodological Overview. Online at https://mpra.ub.uni-muenchen.de/73725/ MPRA Paper No. 73725, posted 23 September 2016 09:04 UTC.[38]Kulkarni, Sharvari and Kulkarni, D.G. (2019). Gap analysis of Soft skills in the curriculum of higher education: A case study of management institutes in Karnataka. Advances in Management, 12(1), 64-67.[39]Lee, JungEun. (2011). The capitalization of knowledge: A triple helix of university-industry-government. Journal of Educational Administration. 49(3), 345-348.[40]Liu, Chunlin and Kong, Lanlan. (2015). Government-driven university-industry linkages in an emerging country: the case of China. Journal of Science & Technology Policy Management, 6(3), 263-282.
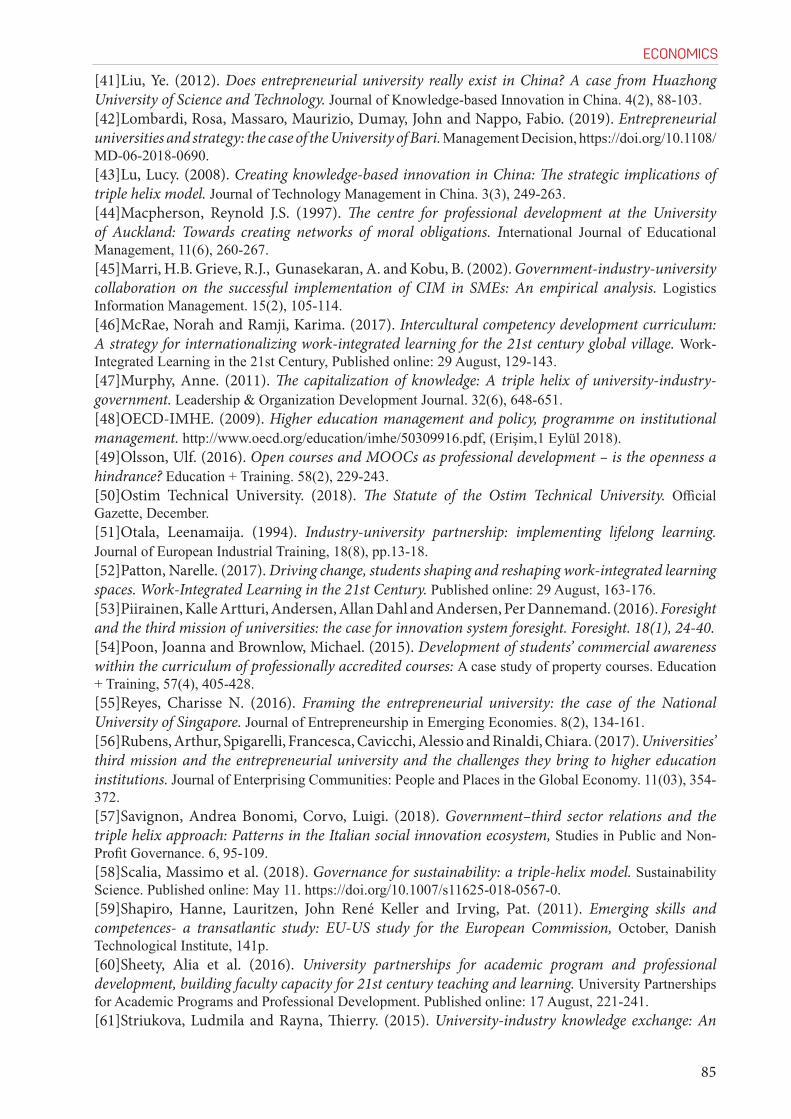
ECONOMICS
85
[41]Liu, Ye. (2012). Does entrepreneurial university really exist in China? A case from Huazhong University of Science and Technology. Journal of Knowledge-based Innovation in China. 4(2), 88-103.[42]Lombardi, Rosa, Massaro, Maurizio, Dumay, John and Nappo, Fabio. (2019). Entrepreneurial universities and strategy: the case of the University of Bari. Management Decision, https://doi.org/10.1108/ MD-06-2018-0690.[43]Lu, Lucy. (2008). Creating knowledge-based innovation in China: The strategic implications of triple helix model. Journal of Technology Management in China. 3(3), 249-263.[44]Macpherson, Reynold J.S. (1997). The centre for professional development at the University of Auckland: Towards creating networks of moral obligations. International Journal of Educational Management, 11(6), 260-267. [45]Marri, H.B. Grieve, R.J., Gunasekaran, A. and Kobu, B. (2002). Government-industry-university collaboration on the successful implementation of CIM in SMEs: An empirical analysis. Logistics Information Management. 15(2), 105-114.[46]McRae, Norah and Ramji, Karima. (2017). Intercultural competency development curriculum: A strategy for internationalizing work-integrated learning for the 21st century global village. Work-Integrated Learning in the 21st Century, Published online: 29 August, 129-143.[47]Murphy, Anne. (2011). The capitalization of knowledge: A triple helix of university-industry-government. Leadership & Organization Development Journal. 32(6), 648-651.[48]OECD-IMHE. (2009). Higher education management and policy, programme on institutional management. http://www.oecd.org/education/imhe/50309916.pdf, (Erişim,1 Eylül 2018).[49]Olsson, Ulf. (2016). Open courses and MOOCs as professional development – is the openness a hindrance? Education + Training. 58(2), 229-243.[50]Ostim Technical University. (2018). The Statute of the Ostim Technical University. Official Gazette, December.[51]Otala, Leenamaija. (1994). Industry-university partnership: implementing lifelong learning. Journal of European Industrial Training, 18(8), pp.13-18.[52]Patton, Narelle. (2017). Driving change, students shaping and reshaping work-integrated learning spaces. Work-Integrated Learning in the 21st Century. Published online: 29 August, 163-176.[53]Piirainen, Kalle Artturi, Andersen, Allan Dahl and Andersen, Per Dannemand. (2016). Foresight and the third mission of universities: the case for innovation system foresight. Foresight. 18(1), 24-40.[54]Poon, Joanna and Brownlow, Michael. (2015). Development of students’ commercial awareness within the curriculum of professionally accredited courses: A case study of property courses. Education + Training, 57(4), 405-428.[55]Reyes, Charisse N. (2016). Framing the entrepreneurial university: the case of the National University of Singapore. Journal of Entrepreneurship in Emerging Economies. 8(2), 134-161.[56]Rubens, Arthur, Spigarelli, Francesca, Cavicchi, Alessio and Rinaldi, Chiara. (2017). Universities’ third mission and the entrepreneurial university and the challenges they bring to higher education institutions. Journal of Enterprising Communities: People and Places in the Global Economy. 11(03), 354-372.[57]Savignon, Andrea Bonomi, Corvo, Luigi. (2018). Government–third sector relations and the triple helix approach: Patterns in the Italian social innovation ecosystem, Studies in Public and Non-Profit Governance. 6, 95-109.[58]Scalia, Massimo et al. (2018). Governance for sustainability: a triple-helix model. Sustainability Science. Published online: May 11. https://doi.org/10.1007/s11625-018-0567-0.[59]Shapiro, Hanne, Lauritzen, John René Keller and Irving, Pat. (2011). Emerging skills and competences- a transatlantic study: EU-US study for the European Commission, October, Danish Technological Institute, 141p.[60]Sheety, Alia et al. (2016). University partnerships for academic program and professional development, building faculty capacity for 21st century teaching and learning. University Partnerships for Academic Programs and Professional Development. Published online: 17 August, 221-241.[61]Striukova, Ludmila and Rayna, Thierry. (2015). University-industry knowledge exchange: An

ECONOMICS
86
exploratory study of open innovation in UK universities. European Journal of Innovation Management, 18(4), 471-492.[62]Sumanjeet, Singh. (2012). Developing e-skills for competitiveness, growth and employment in the 21st century: The European perspective. International Journal of Development Issues, 11(1), 37-59.[63]Toprak, Metin and Bayraktar, Yüksel. (2017). Corporate governance practices of Turkey, A critical review, The IUP Journal of Corporate Governance, XVI(2), 54-75.[64]Toprak, Metin and Erdoğan, Armağan. (2012). Lifelong Learning: Concept, policy, instruments and implementation. Journal of Higher Education and Science, 2(2), 69-91. [65]Toprak, Metin and Erdoğan, Armağan. (2013). European approach to graduate studies. 6th national graduate education symposium proceedings. Sakarya University Institute of Educational Sciences. 10-36.[66]Toprak, Metin et al. (2019). New generation university: An organizational and functional governance model proposal for a thematic-technical university. Journal of Higher Education. Forthcoming, (2019 fall). [67]Toprak, Metin, Erdoğan, Armağan and Açıkgöz, Ömer. (2013). Field qualifications: A framework suggestion. The New Educational Review. 31(1), 153-164.[68]Ughetto, Elisa. (2007). Foresight as a triple helix of industry, university and government relations. Foresight. 9(5), 14-22.[69]van Weenen, Hans. (2000). Towards a vision of a sustainable university. International Journal of Sustainability in Higher Education, 1(1), 20-34. [70]Wagenaar, Robert. (2016). Modernisation of education II, education policy and programme, innovation, EIT and MSCA. Developing future skills in higher education, ET2020 – Peer learning activity (PLA). Brussels, 25-26 February, Key Findings, http://cced-complete.com/documentation/developing_future_skills_in_higher_education_eng.pdf, (Accessed: September 10, 2018).[71]Wagner, Tony. (2009). The global achievement gap. New York, Perseus Books Group, 344p. https://archive.org/details/globalachievemen00wagn/page/n5, (Accessed: April 15, 2019).[72]Yang, Yan and Holgaard, Jette Egelund. (2012). The important role of civil society groups in eco-innovation: a triple helix perspective. Journal of Knowledge-based Innovation in China. 4(2), 132-148.[73] Zhou, Chunyan. (2008). Emergence of the entrepreneurial university in evolution of the triple helix: The case of Northeastern University in China. Journal of Technology Management in China. 3(1), 109-126.

ECONOMICS
87
APPENDIX
A.1.CRITERIA FRAMEWORK FOR EVALUATING THE DESIGN AND PERFORMANCE OF PRACTICE-BASED EDUCATION
1. the degree to which the design of the graduate profile allows for the practice-based education model;
2. the degree to which the compulsory-elective course ratio and its design allow for the practice-based education model;
3. the degree to which the design of the concept and branded courses and form of acquisition of their learning outcomes allow for the practice-based education model;
4. compatibility level of the design of the practice-based education model in the diploma & certificate forms with the vision and aims of the university;
5. The degree to which the physical, financial and infrastructural facilities of the University permit the practice-based education model;
6. the degree to which the academic and research staff of the university allow for the practice-based education model;
7. the degree to which the design of the higher education qualifications framework (QF) allows for the practice-based education model;
8. the degree to which the design of the program key learning outcomes (PKLOs) allows for the practice-based education model;
9. the degree to which the learning outcomes of the courses (LOs) allow for the practice-based education model;
10. the degree to which the design of the solution partnerships allows for the practice-based education model;
11. the degree to which the design of the teaching and learning ways of courses allow for the practice-based education model;
12. The degree to which the design of the boards and the committees allows for the practice-based education model;
13. the degree to which the offices of the policy development and implementation allow for the practice-based education model;
14. The degree to which the governance model of the university allows for the practice-based education model.

ECONOMICS
88
A.2. COMMITTEES / BOARDS AND RELATED TARGET GROUPS / STAKEHOLDERS
Committee / board Related / Targeted groupUniversity ecosystem consultation and steering board I. Board of Trustees and Rector’s
OfficeExecutive committee (Rector’s Office) II. Rector’s OfficeCommittee for the recognition and transfer of prior learning III. Workpeople: IndustryLearning management systems committee IV. StudentsCoop-education committeeProfessional / vocational qualifications committeeForeign language committeeIndividual learning support committeeEntrepreneurship and leadership committeeJoint degree programs committeeScholarship students committeeStudent councilStudent clubsCurriculum committeeResearch and project steering committee V. Personnel: AcademiciansResearch, project, publication and social activity promotion committeeCommittee for the appointment and promotion of academic staffAcademic staff performance evaluation committeeEquality of opportunity and ethics affairs board VI. Personnel: Academic and
administrative staffHuman resources committeeAdministrative staff appointment and promotion committee VII. Personnel: AdministrativeAdministrative staff performance evaluation committee Application and complaint monitoring committee VIII. University: Academic and
administrative units, offices, committees / boards
Website monitoring committeeCommittee on business development and cooperation with stakeholders IX. University: Industrialists and
business worldCommittee of clusters X. University: Clusters’ associations,
industrialists and business world, study programs’ curricula and learning systems
Digital agenda committeeEuropean Higher Education Area compliance committee XI. University: Diploma and
certificate programsQuality assurance and accreditation committeeInternal control and internal audit committee XII. University: Administrative units,
offices, committees / boardsExchange programs committee XIII. University: Students, academic
and administrative staffCommittee for disadvantaged persons Information management committee XIV. University: Software & hardware
and data managementDiversity committee

ECONOMICS
89
A.3. CHECKLIST: DIMENSIONS OF EVALUATION
1. There are several items to be evaluated in the following dimensions. The number and content of dimensions under each item vary depending on the type of university, such as research university, teaching college, professional / vocational oriented university or college, and regional development-oriented mission university.
2. Motto of the university3. University’s vision and purpose (criterium to be taken as benchmark).4. The consolidated performance of the practice-based education model (summary: 20
dimensions). 5. Identifying the graduate profile in accordance with practice-based education model (4 profiles). 6. Dimensioning the curriculum in terms of knowledge, skills and competence (3 dimensions).7. The ways courses are taught (6 ways).8. Compatibility of practice-based education with the vision and purpose of the university
designed in the qualification description form (9 items).9. Compatibility of the physical / financial / infrastructure capacity and the academic / researcher
capacity of the university with the practice-based education model (5 items).10. Compatibility of TR-HE-QF with the practice-based education model (5 items).11. Compatibility of program key learning outcomes with the practice-based education model (15
items).12. Compatibility of the relationship of PKLOs and TR-HE-QF with the practice-based education
model. 13. Compatibility of CLOs with the practice-based education model (18 items).14. Compatibility of the relationship of CLOs and PKLOs with the practice-based education model.15. Compatibility of determining of ratios of compulsory and elective courses with the practice-
based education model.16. Consistency of the relationship of compulsory and elective courses in the context of the practice-
based education model (4 items).17. Consistency the design and feasibility of solution partnerships within the context of the
practice-based education model (7 items).18. Proportion of concept courses and branded courses within the curriculum.19. Contribution of the concept courses in the format of solution partnerships to the practice-
based education model (10 items).20. Contribution of the branded courses in the format of solution partnerships to the practice-
based education model (19 items).21. Contribution of the committees and boards to the practice-based education model (8 items).22. Contribution of the policy development and implementation offices to the practice-based
education model (8 items).23. Contribution of the governance model (organization, coordination and leadership) to the
operation of the practice-based education model (20 items).

ECONOMICS
90

91
Volume 7, No.2 2019ISSN 2303-5005
ABSTRACT
This paper presents the application of the multiple regression analysis model in macroeconomic research using the model of Bosnia and Herzegovina in the period from 2005 to 2018. The objective of the research is to evaluate the effects of macroeconomic factors (independent variables) to gross domestic product (dependent variable), and based on theoretical and methodological research. Applying the Enter method, out of six independent variables, they are all included in the regression model, whereas the sequence of inclusion in the model is the following: foreign direct investments, Import, Export, Growth rate, unemployment and inflation. Numerous research indicate positive connection between gross domestic product as the dependent variable and foreign direct investments, Import, Export, Growth rate, unemployment and inflation, as independent variables. Other factors negligibly explain the most important indicator of economic activities of a country. Our assignment is to either confirm or reject the abovementioned statement.
ANALYSIS OF MACROECONOMIC FACTORS EFFECT TO GROSS DOMESTIC PRODUCT OF BOSNIA AND HERZEGOVINA USING
THE MULTIPLE LINEAR REGRESSION MODEL
Stanko Stanić, Željko V. Račić1
date of paper receipt:27.11.2019.
JEL: C44
Original Article doi: 10.2478/eoik-2019-0022 UDK: 330.101.541:332.155(497.6)
date of sending to review: 29.11.2019.
date of review receipt:06.12.2019.
1 University of Banja Luka, Faculty of Economics, Bosnia and Herzegovina
Keywords:Gross domestic product, multiple regression linear model, Enter method, determination coefficient.

ECONOMICS
92
INTRODUCTION
Numerous factors have effect on economic growth and country development, and one of the most important ones is gross domestic product (GDP). On the other hand, many factors also influence the gross domestic product. The selection of these factors represents a subjective issue of the decision-maker and the analyst (researcher). Besides these, there are also other factors important for the functioning of economies: market openness, offer and demand for goods and services, unequal income distribution, population, political situation etc. Natural factors have equally important influence on economic growth: climate changes, diversification and sustainable development.With the purpose of quantification of relation between economic growth and other macroeconomic indicators, we have selected extended multiple linear regression model by applying Enter method and regression procedures, as well as residual analysis. Enter method gradually includes independent variables, and then one by one variable is removed from the model (in accordance with the previously set criteria). The sequence of including independent variables in the model is determined by the contribution of each specific independent in the explanation of the variability of the dependent variable.
1. PREVIOUS RESEARCH
Economic growth includes the processes of implementing successful development strategies of a country and determines the level of its wealth. The issue of relation between export, foreign direct investments and economic growth has caused great attention and interest of both economists and creators of economic politics worldwide.Regardless of the fact whether a country is developed, in transition or under-developed, market openness encourages economic growth (Etale, 2016).When analysing the relations and possible effects of macroeconomic factors to GDP of the Western Balkans countries, it is necessary to define the ”new growth model” (Estrin and Uvalic, 2013). Taking into account unfavourable structure of foreign direct investments, export/import, instability of political and social circumstances, (non)compliance of the legislation with EU regulations and directives, as well as many other factors, one may not expect positive effects of analysed phenomena to GDP in a short period of time.The conducted panel analysis (Mahmoodi, M. and Mahmoodi E., 2016) indicates long-term connection economic growth and export and foreign direct investments. Their results have indicated a long-term two-way connection between foreign direct investments, export and economic growth. The results of research on the effect of foreign direct investments to economic growth of countries in transition (Nestorovic, 2015) based on regression analysis, show positive, but not statistically significant correlation between foreign direct investments and economic growth in the countries in transition.To support this statement, we also point out the fact that the correlation between, for example, foreign direct investments and economic growth in negative, since the dominant form of foreign direct investments in the Western Balkan countries was acquisition. Acquisitions cannot be considered as investments into real property, since the sale income can be used for expenditure and investments, and in that way foreign direct investments cannot reflect on economic growth (Mencinger, 2003).
2. APPLIED METHODOLOGY
Gross domestic product (dependent variable) has been analysed, and which is in function of foreign direct investments, import, export, growth rate, unemployment and inflation, as independent variables, in Bosnia and Herzegovina in the period (from 2005 to 2018). The statistical data have

ECONOMICS
93
been retrieves from the Eurostat database. The analysis and model comparison is carried out by using the programme IBM SPSS Statistics 23.
2.1 DEPENDENT VARIABLE
Gross domestic product. GDP – gross domestic product represents the total value of all the final goods and services produced in a specific time period on a specific territory. GDP is stated in monetary units, and includes only goods and services intended for further processing and production. GDP indicates the measure of production activities and it is a generally accepted indicator of the condition of a specific economy.
2.2 INDEPENDENT VARIABLES
Foreign direct investments (FDI). Foreign investments include: foreign direct investments, joint investments, portfolio investments, concessions and other forms, such as: greenfield and brownfield investments, merging, absorptions etc.GDP growth rate: Growth rate is the ratio between the GDP in the analysed year and the GDP in previous year, in current prices. Increase of GDP is mostly influenced by the growth of foreign trade balance, increase of export as opposed to import, and increase of consumption of the population.Unemployment rate. It represents the participation of the unemployed in the total work power. Total work power represents the sum of employed and unemployed people, who are actively seeking work (aged between 17 to 74 years).Export of goods and services. It includes transactions of goods and services from residents to non-residents. Export has positive effect on GDP growth, and it indicates the activity of domestic companies in the foreign market.Import of goods and services. It includes transactions of goods and services from non-residents to residents. Export has negative effect on creating GDP because it decreases the positive effects of export and increases the dependency of one country on products from other countries. Inflation. Inflation is measured using the index of consumer prices. The index of consumer prices measures the changes of average level of prices of products and services per main groups of products and services classified in accordance with their intention in consumption (personal consumption).
The selection of indicators has been carried out based on macroeconomic development indicators that are available on the website of the European Statistical Office1.
1 http://ec.europa.eu/eurostat.

ECONOMICS
94
3. APPLICATION OF MULTIPLE LINEAR REGRESSION MODEL: ANALYSIS OF BOSNIA AND HERZEGOVINA GDP
Data sources used for application of regression model The analysis starts with specification of regression model elements which includes the selection of exogenous variables and functional model forms.
Table 1. Macroeconimic indicators of Bosnia and Herzegovina economy
Nominal GDP
FDI Import Export Growth rate
Unemployment Inflation
2005 17.650,00 552,3 12611,18 5.910,82 5,1 509.224,00 3,82006 20.057,00 864,8 13183,18 6.010,82 5,4 519.224,00 6,12007 22.548,00 2.599,80 13.811,18 6.110,82 5,9 520.014,00 1,52008 25.519,00 1.337,50 16.058,45 6.851,45 5,4 477.609,00 7,42009 24.799,00 351,9 12.634,02 6.201,96 -3 510.534,00 -0,42010 25.365,00 599,7 13.730,68 7.532,26 0,9 522.989,00 2,12011 26.231,00 698,6 15.640,25 8.403,44 1 536.728,00 3,72012 26.222,70 601,1 15.577,04 8.483,19 -0,8 550.255,00 2,12013 26.778,80 700 15.297,22 9.035,97 2,4 553.481,00 -0,12014 27.358,70 811 16.523,27 9.296,53 1,1 547.134,00 -0,92015 28.589,10 636,9 16.319,44 9.969,31 3,1 537.568,00 -12016 29.904,50 564 16.832,09 10.659,83 3,1 512.496,00 -1,12017 31.376,20 777,7 19.160,91 12.574,50 3,2 478.191,00 1,22018 32.954,00 800 20.139,38 13.565,16 3,2 437.783,00 1,4
Results of applying the multiple linear regression model Analysis of multiple linear regression model is carried out with the IBM SPSS software package of the latest version Statistics 23. From the exit results we pay attention to the key tables.
Table 2 Correlations, indicates the values of the Pearson correlation coefficient between all the variables. Import is in the strongest correlation with Export (-0,944), following GDP with Export (0,915), as well as GDP with Import (-0,895); and the weakest correlation is FDI with Import (-0,067).
Table 2.
GDP FDI Import Export Growth rate
Unem-ployment
Inflation
Pearson Correlation
GDP 1,000 -,196 -, 895 ,915 -,257 -,332 -,501FDI -,196 1,000 -,067 -,254 ,575 -,104 ,223
Import ,-895 -,067 1,000 -, 944 ,072 -,494 -,240Export ,915 -,254 ,-944 1,000 -,064 -,403 -,454
Growth rate -,257 ,575 ,072 -,064 1,000 -,324 ,463Unemploy-
ment-,332 -,104 -,494 -,403 -,324 1,000 -,274
Inflation -,501 ,223 -,240 -,454 ,463 -,274 1,000

ECONOMICS
95
We used the Enter method, where the initial situation implies that all independent variables are included in the model, without any restrictions. Then one by one variable is excluded from the model according to a predefined criteria that is related to the value of the F to removal statistics. The following table (Table 3) indicates that, according to the defined statistical criteria, all independent variables were retained in the regression model.
Table 3. Variables Entered/Removeda
Model Variables Entered Variables Removed Method
1 Inflation, FDI, Import, Unemployment, Growth Rate, Exportb Enter
a. Dependent Variable: GDPb. All requested variables entered.
We now move to Table 4, Summary Model, which provides key information about the validity of the regression model. Table 4 presents two regression models: the first model containing an independent variable and the second one with two independent variables.
Table 4. Model Summaryb
Model R R Square Adjusted R Square
Std. Error of the
Estimate
Change Statistics Durbin-WatsonR
Square Change
F Change
df1 df2 Sig. F Change
1 ,966a ,932 ,874 1459,59007 ,932 16,097 6 7 ,001 1,942a. Predictors: (Constant), Inflation, FDI, Import, Unemployment, Growth rate, Exportb. Dependent Variable: GDP
Multiple correlation coefficient of the dependent variable (GDP) and independent variables (FDI, Import, Export, Growth rate, Unemployment, Inflation) is 0,966, meaning that their connection is very strong. Determination coefficient is 0,932, meaning that 93,2 % of the variability of the dependent variable (GDP) could be explained by the effect of the independent variables (FDI, Import, Export, Growth rate, Unemployment, Inflation). The value of the adjusted determination coefficient of 0,874 is close to the value of the regular determination coefficient (0,932), due to favourable ratio between the number of variables included in the model and the total number of observations. Based on retrieved regression coefficients, our multiple linear regression model can be presented as it follows:
where:dependent variable (in our example - GDP),independent variables (in our example – FDI, Import, Export, Growth rate, Unemployment, Inflation),Constant,= unknown parameter with the independent variables (FDI, Import, Export, Growth rate, Unemployment, Inflation),error which reflects all the influences on the dependent variable (GDP) that do not originate from the independent variables (FDI, Import, Export, Growth rate, Unemployment, Inflation)

ECONOMICS
96
Table 5 presents regular regression coefficients – under B and standardized regression coefficients under.
Table 5. Coefficientsa
Model
Unstandardized Coef-ficients
Stan-dardized Coeffi-cients t Sig.
95,0% Confidence Inter-val for B Correlations Collinearity
Statistics
B Std. Error Beta Lower Bound
Upper Bound
Zero-order
Partial Part Tol-er-
ance
VIF
1 (Constant)
7476,930 11385,199 ,657 ,532 -19444,788 34398,648
FDI ,639 1,282 ,085 ,499 ,633 -2,391 3,670 -,196 ,185 ,049 ,329 3,040
Import 1,333 ,940 ,733 1,418 ,199 -,889 3,556 ,895 ,472 ,139 ,036 27,662
Export ,228 1,017 ,135 ,224 ,829 -2,177 2,633 ,915 ,084 ,022 ,027 37,572
Growth rate
-468,346 242,380 -,290 -1,932 ,095 -1041,485 104,792 -,257 -,590 -,190 ,428 2,335
Unempl. -,006 ,017 -,045 -,337 ,746 -,046 ,034 -,332 -,126 -,033 ,546 1,831
Inflation -251,522 321,310 -,161 -,783 ,459 -1011,299 508,255 -,501 -,284 -,077 ,229 4,372
a. Dependent Variable: GDP
In our example, and based on retrieved regression coefficients, our regression model can be presented by the following equation:
Apart from the written model, it can be further concluded that out of all the analyzed independent variables, Import has major effect on GDP, followed by FDI and Export.
CONCLUSIONS
Economic theory and practice do not know any unique set of indicators that affect GDP. The very complexity of this phenomenon relativises any attempt to establish an unchanged list of indicators. Therefore, in selection of these indicators is based on subjectivity of the authors. The actual number of indicators remains to be seen in the specific analysis, taking into account their interdependence and the occurrence of duplicity, since these two facts directly influence the selection of the optimal number of indicators. With the purpose of quantification of relation between macroeconomic factors and GDP, we have used multiple linear regression model. The analysis showed that GDP with as much as 93.2% can be explained by the influence of independent variables: FDI, Import, Export, Growth rate, Unemployment, Inflation. Other factors negligibly (6.8%) explain the most important indicator of economic activities of a country.Out of all the analysed independent variables, Import has major effect on GDP, followed by FDI and Export.From the abovementioned we can confirm the set hypothesis of this paper that the selection of predictors defined in the multiple linear regression model is significant, in terms of Bosnia and Herzegovina GDP development over the observed period. The research results may be useful to developers of economic policies for bringing the right decisions in solving external shocks and crisis, in order to focus their activities more precisely in the direction of economic growth and overall progress of Bosnia and Herzegovina economy.

ECONOMICS
97
REFERENCES
[1] Buterin V., Škare, M., Buterin, D. (2017). Macroeconomic model of institutional reforms’ influence on economic growth of the new EU members and the Republic of Croatia. Economic Research-Ekonomska Istraživanja, 30:1, p. 1572-1593, DOI: 10.1080/1331677X.2017.1355260.[2] Estrin, S., Uvalic, M. (2013). Foreign direct investment into transition economies: Are the Balkans different? London School of Economics and political Science, England.[3] Etale, E. L., Etale, M., Lyndon, M. (2016). The Relationship between Exports, Foreign Direct Investment and Economic Growth in Malaysia, International Journal of Business Management and Economic Research (IJBMER), 7(2), p. 572–578. ISSN: 2229-6247.[4] Mahmoodi, M., Mahmoodi, E. (2016). Foreign direct investment, exports and economic growth: evidence from two panels of developing countries. Economic Research, 29:1, 938-949. DOI: 10.1080/1331677X.2016.1164922.[5] Mano-Bakalinov, V. (2016). Trade liberalisation and economic growth in Macedonia. South East European Journal of Economics and Business. Volume 11 (2), 48-60. DOI: 10.1515/jeb-2016-0010.[6] Mencinger, J. (2003). Does Foreing Investment Always Enhance Economic Growth? International Review for Social Sciences, 56(4):491–508; p. 534-547.[7] Nestorović, O. (2015). Da li strane direktne investicije doprinose privrednom rastu zemalja u tranziciji?, Ekonomske teme 53(2), 273–282.UDK 339.727.22:338.1.[8]Pere, E. (2015). The impact of good governance in the economic development of Western Balkan countries. European Journal of Government and Economics, Volume 4: 25-45, Retrieved from http://www.ejge.org/index.php/ejge/article/view/59/52.[9] World Bank, (2018). World Development Indicators (WDI).
Retrieved from:http://databank.worldbank.org/data/reports.aspx?source=worlddevelopment- indicators.

ECONOMICS
98

99
Volume 7, No.2 2019ISSN 2303-5005
FOREIGN TRADE LIBERALISATION AND ECONOMIC GROWTH: THE CASE OF THE REPUBLIC OF SRPSKA
Goran Popović1, Ognjen Erić1, Srđa Popović2
ABSTRACT
This paper assesses the impact of trade liberalisation on the economic growth of the Republic of Srpska (RS). The aim of the research is to prove the hypothesis that trade liberalisation and export orientation positively impact on GDP growth. RS has characteristically small and open economies. The degree and character of the connections between the observed variables was determined by means of regression analysis. Regression analysis indicates that there is a positive connection between the total trade and GDP growth. Further, there is a marked positive correlation between export and GDP, that is, export growth contributes to GDP growth. Foreign trade deficit stands in a negative correlation with GDP. Lastly, regression analysis points to the connection between the Republic of Srpska economic growth and openness of its economy. However, uncontrolled opening and exposure to foreign competitiveness can also bring about problems which in certain circumstances lead to long-term macroeconomic instability.
JEL: F10, F14, O40.
Original Article doi: 10.2478/eoik-2019-0020 UDK: 336.748.12:339.742(497.6RS)
date of sending to review: 27.11.2019.
1University of Banja Luka, Faculty of Economics, Bosnia and Herzegovina2 Faculty of Mediterranean Business Studies, Tivat, Montenegro
Keywords:Liberalisation, growth, trade, export, small economies, Republic of Srpska
date of paper receipt:25.11.2019.
date of review receipt:04.12.2019.

ECONOMICS
100
INTRODUCTION
The Republic of Srpska (RS) and the Federation of Bosnia and Herzegovina constitute the state union of Bosnia and Herzegovina (B&H). Like other countries of the Balkan Peninsula it is involved in the European integration process. For the path towards the European Union (EU) there is agreement of policies, public and citizens. Today (2018), B&H is a potential candidate for EU membership. It is undergoing the Stabilisation and Association Process (SAP) through the Stabilisation and Association Agreement (SAA). In the SAA and annexes thereto, a significant role is played by trade liberalisation and creation of free trade zone between B&H and the EU (Vukadinović and Vukadinović-Marković 2016: 398). A question arises: to what extent does trade liberalisation impact on small economies such as the RS and B&H? It is hard to find a general and internationally accepted definition of a small country (Lopandić 2010: 82), but there are certain criteria, standards and definitions of small countries. For the World Bank and International Monetary Fund, small countries are those that have less than 1,5 million inhabitants. Accordingly, B&H is not a small country, whereas the RS as an entity satisfies the criterion for a small country. In terms of the Balkan region, this criterion is also met by Montenegro. Likewise, the definition proposed by Simon Kuznets, to the effect that the criterion for a small country is population under 10 million, has been accepted (Kuznets 1960: 14). After the appearance of numerous countries in Europe and the world, the said limit of 10 million has become questionable as well. In this respect, in 2017 there were 144 small countries (World Meters, 2017). By this definition, most countries of the Western Balkans (WB) are actually small countries.
1. PREVIOUS RESEARCH
Trade growth and export orientation have a positive impact on production, economic growth and welfare. For example, during the times governed by GATT, the world trade growth was faster than production growth (Stiglitz and Charlton 2005: 59). This pertains to all the countries, regardless of their state of development and size. Foreign economic and economic balance are interdependent (Meade, 1955). The Balkan countries see their chance for faster economic growth and development in economic liberalisation and togetherness with the EU, finding the European Union to be safer economic and social “shelter” (Popović, 2016). The European economic integrations have a geopolitical dimension too, but they are directed economic changes nonetheless (Stanivuković and Đajić 2008: 398). In addition to benefits from intra-trade exchange, the future member states see the advantages of specialisation, effects of economies of scope, as well as an easier access to the global market for goods and financial services (Mardas and Nikas, 2008: 511–523), etc. Further, the European funds are attractive sources for favourable development financing (Berthomieu et al. 2016: 144–145). A good example is Slovenia, which liberalised trade, stabilised economy and attained the average level of EU development. This is an example/model for how small economies can exploit their potentials and export as the strongest economic weapon. The very process of European integrations implies changes of national legislations and harmonisation with acquis communautaire, the EU legal heritage (Vukadinović 2004: 55). Thus, the candidate member states quickly liberalise trade, deregulate markets and reduce the role of the state (segments of SAA). Also important in this respect is CEFTA, an agreement which many European states have been through. The economies of candidate states are facing radical liberalisation for the first time in this free trade zone. Owing to CEFTA, the Western Balkans Countries have accelerated growth of trade exchange (Petreski 2013: 26–44). Economic growth depends on a series of factors which in macroeconomics can mainly be classified as labour, capital and technological progress. World exchange and trade liberalisation have become the conditions for economic growth (Krugman & Obstfeld 2009). The majority of small countries have insignificantly higher growth rates in relation to developed

ECONOMICS
101
countries. However, they mainly have a weaker industrial base, deficient economies of scope and structural disproportions, and they adjust to the requirements of the global demand more slowly. What the small economies lack is openness toward the world markets of goods, services and money, a greater inflow of FDI, etc. (Mehic et al. 2013: 5–20). The problem is limited offer and an unequal distribution of income, as well as vulnerability to climate changes, diversification and sustainable development (Peretz et al. 2001: 607–608). The majority of these factors impact on the economic growth. However, there are examples showing that small economies develop using other development potentials: efficient institutions, good economic policy, quality natural and human resources, etc. (Buterin et al. 2017: 1572–1593), since growth depends on public institutions, democratisation and other factors as well (Pere, 2015: 25–45). Integration and liberalisation are prerequisites for the industrial growth and comparative advantage (Balassa, 1967). The integration levels in early phases are bound with free trade zone, customs union, common market and economic union. Then follow the monetary, fiscal and finally political union (Balassa, 1965). Crowley expands the integration scheme by Balassa (Crowley, 2002) and proves that growth rates in new, smaller EU members are faster than those in old members. New members also have a greater investment rate. Upon accession to the EU, their unemployment rates drop too. The integrations bring about greater social distortions as well, but these are secondary nonetheless (Popović, 2016: 80–81).Liberalisation of trade exchange has a big impact on every country’s economy, while export orientation has become the requirement for faster economic growth (Mahmoodi & Mahmoodi 2016: 938–949). Export-oriented companies give rise to stronger internal competition. Numerous researches have confirmed positive correlation between export (and trade exchange) as the independent variable and small country economy growth rates as the dependent variable (Siddiquia and Ahmedb 2013: 18–33). Еconomic liberalisation has its limitations too. Small countries have high costs of the public sector and higher average costs in the private sector. Likewise, access to the world financial markets is more difficult, etc. Governments of these countries often “resuscitate” economies, and start economic cycles thereby impacting on the investment activity. Small countries use mechanisms of adjustment to external shocks despite mostly lacking all the necessary instruments (Prasad et al. 2003: 8). And generally, there occur in the course of development of efficient monetary, fiscal and other policies certain restrictions, which is why governments of small countries often turn to liberalisation of trade, for all the risks of such policy. Taking all the facts into consideration, trade liberalisation and export orientation have become the bases for faster economic growth. Export is all the more frequently accompanied by “hidden” stimulations and other forms of support. By an optimal selection of products companies take their positions on the world markets. Liberalisation and export orientation form a strategy for achieving faster growth, macroeconomic stability and growth of economic welfare (Mano-Bakalinov 2016: 48–60).

ECONOMICS
102
2. RESEARCH METHODOLOGY
The subject of this paper is analysis of the impact of trade exchange and export on the Republic of Srpska’s economic growth. According to all the indicators, this B&H entity meets the criteria for a small economy (WB reports, IMF and other). The connection between trade liberalisation and GDP trends will be analysed by means of simple linear regression analysis. For this purpose, foreign trade exchange, export and foreign trade balance will be explanatory variables, whereas GDP will be the dependent variable, that is:
Y = f (Т, X) (1)
where: Y - GDP; Т - scope of foreign trade exchange; X - exportThe simple linear regression model has the following form1:
Yi = β0 + β1 · xi +εi (i = 1,..., n) (2)
where: Yi - i-dependent variable; xi - i-independent (explanatory) variable; β0, β1 - regression parameters to be estimated; εi - stochastic member (random error); n - size of the basic set. Use is made of estimated function of the simple linear regression on the basis of the sample: Ŷi = b0 + b1xi (3)
where: Ŷi - the value of the dependent variable on the best adjusted regression line; b0 and b1 - estimations of unknown regression parameters of the basic set.The results of the regression analysis show the degree of impact of trade liberalisation on GDP growth. Regression analysis is the standard statistical procedure (the Least Square Method/OLS)2. This method is simple and reliable (for example, it mutually excludes positive and negative errors). For the purpose of quantification of approximately linear connection the best direction for the presentation of the observed variables is constructed. The analysis also contains standard deviation, medium, maximum and minimum value, asymmetry of distribution and measure for the tendency of series distribution. Regression analysis provides the estimation of the statistical significance of the following variables: probability (p), t - statistics, standard estimation error and determination coefficient R2. The statistical base is made of the data of the RS Republic Institute of Statistics (the period from 2005 to 2018). This relatively short time span (13 years) in the regression model is a result of limited availability of data sources for the observed variables.
3. TRADE LIBERALISATION AND THE REPUBLIC OF SRPSKA ECONOMIC GROWTH: STATISTICAL ANALYSIS
3.1. ANALYSIS OF GDP TREND
As a consequence of the crisis in 2008, the Republic of Srpska has since recorded unequal and lower growth rates. Apart from the lower growth rates, the tendencies of the GDP structure are unfavourable too. In 2016, trade, industry, public administration, agriculture, forestry, etc. have the greatest share in GDP. Production and supply of electric energy have the greatest impact on growth, followed by agriculture, forestry, industry and civil engineering. Growth is slowed down by 1 Simple linear regression model has a deterministic and stochastic segment. The deterministic segment pertains to the average impact of the independent (x) on the dependent (y) variable; parameter β0 is the free member, and β1 slope coefficient.2 The best adjusted direction of linear connection as determined by the least square method gives the regression line.

ECONOMICS
103
information and communication technologies sectors, as well as public services (administration, auxiliary service activities, and other).
Graph 1. Real GDP growth rates trend for the Republic of Srpska (2006–2017)
Source: The Republic of Srpska Institute of Statistics
Until the 2008 crisis the Republic of Srpska records high growth (it drops from 6,3% in 2008 to -0,3% in 2009). The European Union records a fall by 4,4%, and the situation is the same in other countries with which the RS and B&H have the greatest cooperation: Germany - 5,6%, Italy -5,5%, Austria -3,8%, Croatia -7,4% and Serbia -3,1%. These negative trends slow down GDP growth and trade exchange, and it is only in 2015 and 2016 that there occurs recovery (2,8% and 3,5%), associated with a significant growth of export (9,8% in 2016).
3.2. ANALYSIS OF FOREIGN TRADE EXCHANGE
Liberalisation of foreign trade is important for open, smaller and weaker economies (Krugman & Obstfeld 2009). The share of foreign trade in the world GDP is increasing, because exchange grows faster than production3. The following table shows the share of export and import in the Republic of Srpska GDP.
Table 1. The share of import and export of goods in the Republic of Srpska GDP (GDP = 100)
Years 2007 2008 2009 2010 2011 2012 2013 2014 2015 2016 2017 2018Export of goods and services
29 26 20 22 23 28 30 30 28 30 35 35
Import of goods and
services
45 49 43 49 53 52 52 55 47 46 49 49
Source: Authors’ analysis (data obtained from RIS RS, CB B&H, AS B&H, FIS)Export of the Republic of Srpska goods makes 20-35% of GDP. And while this share oscillates, export values point to reserves and potential growth possibilities. There exist conditions for the
3 In EU, Slovenia, Austria and Germany (average: 65,1%, 50,5%, 41,3%) have the greatest share of export in GDP. In 2016, Slovenia had the share of export in GDP of an even 77,7%.

ECONOMICS
104
Republic of Srpska to strongly focus on export. This takes industries that are competitive both on the local and world market. On the other hand, excessive import endangers production which is insufficient, non-elastic or non-competitive even on the local market.Foreign trade exchange of the Republic of Srpska is shown in the following table.
Table 2. Foreign trade of goods in the Republic of Srpska, 2005-2018 (million BAM/ %4)
Years Export Import Volume Balance Export (%)
Import (%)
Volume (%)
Coverage (%)
2005. 1.131 2.953 4.084 -1.822 4,1 9,3 15,2 38,3%2006. 1.540 2.760 4.300 -1.220 36,2 -6,5 5,3 55,8%2007. 1.672 3.348 5.020 -1.676 8,5 21,3 16,7 49,9%2008. 1.922 4.147 6.068 -2.225 15 23,9 20,9 46,3%2009. 1.673 3.568 5.241 -1.894 -13 -14 -13,6 46,9%2010. 2.178 4.053 6.231 -1.875 30,2 13,6 18,9 53,7%2011. 2.561 4.578 7.138 -2.017 17,6 12,9 14,6 55,9%2012. 2.375 4.488 6.862 -2.113 -7,3 -2 -3,9 52,9%2013. 2.604 4.558 7.162 -1.954 9,7 1,6 4,4 57,1%2014. 2.692 4.946 7.638 -2.254 3,4 8,5 6,7 54,4%2015. 2.614 4.369 6.983 -1.755 -2,9 -11,7 -8,6 59,8%2016. 2.869 4.427 7.296 -1.558 9,8 1,3 4,5 64,8%2017. 3.476 4.900 8.376 -1.424 21,2 10,7 14,8 71%2018. 3.742 5.222 8.964 -1.480 7,6 6,6 7,02 71,7%
Source: The Republic of Srpska Institute of Statistics
The table shows growth of all the favourable indicators, except for the balance of exchange with the countries abroad, which oscillates during the period 2005-2018. The average growth of export of 7,6% in 2018 and import of 6,6% show continuity of positive trends. In the period from 2005 to 2018, export and import follow GDP trends. At the end of the period, that is in 2018, GDP growth of 3,9% is accompanied by growth of export of 7,7%. The coverage of import by export is 71,7%. It can be concluded from the data that the Republic of Srpska’s economy is open, because it is obvious that the scope and direction of trade exchange with the world impact on the level of GDP.
3.3. REGRESSION ANALYSIS OF FOREIGN TRADE EXCHANGE AND THE RS ECONOMIC GROWTH
In this part the connection between the foreign trade exchange as the explanatory variable and GDP growth as the dependent variable in the model is estimated. Table 3 shows that the determination coefficient is 0,80. Therefore, 80% of variations in GDP is explained by changes of foreign trade exchanges with the countries abroad. The results of F test and the probability lower than 1% provide arguments for the significance of predictor variable in explaining growth rates, yet under the other circumstances unchanged. It should be pointed out here that the impact of other factors on growth has been excluded from this analysis.
4 The official currency in B&H and RS is convertible mark (BAM). The value of convertible mark is fixed for Euro in the ratio of 1 EUR (€) = 1,9558 BAM.

ECONOMICS
105
Table 3. Results of simple regression analysis - foreign trade exchange and GDP
Variable Coefficient Std. Error t-Statistic Prob.b0 6641152 322036.8 20.62234 0.0000
Foreign trade exchange 0.224666 0.039010 5.759107 0.0004
R2 0.805671 Mean dependent variable 8479473.
Adjusted R2 0.781380 S.D. dependent varable 288333.8
S.E. of regression 134815.7Sum squared resid 1.45Е+11
Log likelihood -131.1903F-statistic 33.16731
Prob(F-statistic) 0.000425Source: Author’s data analysis
The simple regression equation: Y = 6.641.152 + 0,224666·(trade exchange) shows that a change of foreign trade exchange of 1 BAM leads to a GDP change of 0,225 BAM. Therefore, direct linear connection between the foreign trade exchange and GDP is observed, yet under the other conditions unchanged, as the other factors that can lead to change in Gross Domestic Product have not been included.In what follows (Table 4) the results of simple linear regression of export as the explanatory variable and GDP as the dependent variable have been presented. The determination coefficient amounts to 0,65, which means that 65% of GDP variations is determined by changes in export, yet without the inclusion of other factors that can impact on GDP changes. The results of F test (14,86) and the probability lower than 1% provide arguments for the significance of export in explaining GDP growth rates, though with the other conditions unchanged.
Table 4. The results of the simple regression analysis - export and GDP
Variable Coefficient Std. Error t-Statistic Prob.b0 6990155. 390590.3 17.89639 0.0000
export 0.441044 0.114421 3.854569 0.0048R2 0.650009 Mean dependent variable 8479473.
Adjusted R2 0.606260 S.D. dependent varable 288333.8S.E. of regression 180925.8
Sum squared resid 2.62Е+11F-statistic 14.85771
Prob(F-statistic) 0.004846Source: Author’s calculations
The regression equation in this case runs as follows: Y = 6.990.155.000 + 0,44·(Export)And shows that changes in export of 1 BAM lead to changes in GDP of 0,444 BAM. It can therefore be concluded that there exists a direct linear connection between export and GDP, that is, the growth of export impacts on the growth of GDP (other factors that could lead to changes in the dependent variable have not been included in the model).

ECONOMICS
106
Table 5 gives the results of the simple linear regression of foreign trade deficit as the predictor variable and GDP as the dependent variable. The determination coefficient shows that 52% of GDP variations is determined by changes of deficit, yet without the inclusion of other factors that can impact on GDP. The results of F test (8,55) and the probability lower than 5% provide arguments for the significance of the explanatory variable - foreign trade deficit - in explaining the economic growth rates (under the other conditions unchanged).
Таble 5. Results of simple regression analysis - foreign trade deficit and GDP
Variable Coefficient Std. Error t-Statistic Prob.b0 7323061. 401055.1 18.25949 0.0000
Trade deficit -0.809313 0.276706 -2.924810 0.0191R2 0.516748 Mean dependent
variable8479473
Adjusted R2 0.456342 S.D. dependent varable
288333.8
S.E. of regression 212597.7Sum squared resid 3.62Е+11
Log likelihood -135.7452F-statistic 8.554516
Prob(F-statistic) 0.019150Source: Authors’ calculations
From the regression equation that runs as follows: Y = 7.323.061.000 - 0,809313·(Trade deficit)It can be concluded that changes in the trade deficit of 1 BAM alter GDP for about 0,809 BAM. It should be pointed out that this connection is negative, that is, that changes in GDP are in correlation of an extremely strong intensity with the changes in the variable (Deficit), yet with reversed direction.

ECONOMICS
107
CONCLUSION
Numerous factors impact on the development of small countries. A globally competitive economic structure and export orientation are the basis for the development of the most dynamic economies. Apart from numerous factors sublimed as capital and technological progress, foreign trade exchange can be crucial for accelerating the economic growth as well. It is well known that a reduction of unit costs, growth of economies of scope effects, etc., can increase productivity and competitiveness. These are certainly prerequisites for faster GDP growth. Therefore, export, import and trade balance are crucial for GDP growth, regardless of the size of an economy and/or its structure.The Balkan countries are completing the transition process. Each country is going through a certain phase of the association process. Through the stabilisation and association process trade exchange with the Union is liberalised. Despite the fact that they are achieving slightly higher growth rates in relation to the developed countries, at this stage they are insufficient for overcoming inherited economic and social problems. Therefore, they are liberalising trade with the world, in which they see their chance for faster economic growth. These countries are liberalising trade relations with the European Union through SAA (and the relevant annexes). A certain degree of liberalisation is also present in the exchange between CEFTA countries. In the long term, the Republic of Srpska records negative exchange with the countries abroad. Not only does it have negative balance with the EU and CEFTA, but with the rest of the world too. However, despite this huge deficit in the exchange with the world (and the EU), the Republic of Srpska records continuous growth of export, which grows faster than import and is faster from GDP growth too. The question was raised: To what extent does foreign trade exchange impact on the Republic of Srpska GDP growth? Regression analysis points to a positive correlation between the total trade exchange and GDP growth. Furthermore, there is a marked positive correlation between export as the independent variable and GDP as the dependent variable, that is, growth of export contributes to GDP growth. Foreign trade deficit stands in negative (reverse) correlation with GDP; therefore, foreign trade deficit slows down GDP growth. Finally, regression analysis points to a connection between the Republic of Srpska economic growth and the openness of its economy. Liberalisation of trade, proximity to the European Union, trade with CEFTA, etc., can bring certain advantages, above all in terms of increasing trade and accelerating growth. However, immoderate opening and exposure to foreign competition can bring about some problems that in certain circumstances may lead to long-term macroeconomic instability as well.
REFERENCES
[1] Balassa, B. (1965). Trade Liberalization and Revealed Comparative Advantage. The Manchester School of Economic and Social Studies. Vol 33: 99-123.[2] Balassa, B. (1967). Trade liberalization among industrial countries. New York: Mc. Graw-Hill.[3] Berthomieu, C., Cingolani, M., & Ri, A. (2016). Investment for Growth and Development in the Western Balkans. STAREBEI Research Project, EIB Institute, University of Nice - Sophia Antipolis (France).[4] Buterin V.; Škare, M., Buterin, D. (2017). Macroeconomic model of institutional reforms’ influence on economic growth of the new EU members and the Republic of Croatia. Economic Research - Економска истраживања, 30, 1: 1572–1593.[5] Vukadinović, R. (2004). Kako usklađivati domaće propise sa pravom Evropske unije. Kragujevac: Pravni fakultet, Centar za pravo Evropske unije.[6] Vukadinović, R., Vukadinović Marković, J. (2016). Uvod u institucije i pravo Evropske unije. Kragujevac: Udruženje za evropsko pravo.

ECONOMICS
108
[7] Lopandić, D. (2010). Male i srednje zemlјe u međunarodnim odnosima i u Evropskoj uniji. Međunarodni problemi, 62(1):79–112. [8] Crowley, P. (2002). Before and Beyond EMU: Lessons and Future Prospects. London: Rautledge. [9] Kuznets, S.(1960). Economc growth of small nations, In: Robinson, E. A. G. (ed.). Economic Consequences of the Size of Nations. Proceedings of a Conference held by the International Economic Association. Publisher Palgrave Macmillan UK, 14-32. ISBN 978-1-349-15212-4, ISBN 978-1-349-15210-0(e-book). DOI: 10.1007/978-1-349-15210-0.[10] Mahmoodi, M., Mahmoodi, E. (2016). Foreign direct investment, exports and economic growth: evidence from two panels of developing countries. Economic Research - Ekonomska istraživanja, 29, 1: 938–949. [11] Mano-Bakalinov, V. (2016). Trade liberalisation and economic growth in Macedonia. South East European Journal of Economics and Business. 11, 2: 48–60.[12] Mardas, D., Nikas, Ch. (2008). Economic Integration and Intra-industry Trade Between the European Community and the Western Balkan Countries. Transition Studies Review, 15: 511–523. [13] Meade, J. (1955). The Theory of Customs Unions. Amsterdam: North-Holland.[14] Mehic, E.; Silajdzic, S. and Babic-Hodovic, V. (2013). The impact of FDI on economic growth: Some evidence from Southeast Europe. Emerging Markets Finance and Trade, 49, 5–20. [15] Obstfeld, M., Krugman, P. (2009). Međunarodna ekonomija – teorija i politika (Prevod: N. Stojanović i M. Gogić). Beograd: Datastatus.[16] Peretz, D.; Rumman F., Eliawony K. and Owen, A. (2001). Small states in the global economy. Washington: World Bank.[17] Pere, E. (2015). The impact of good governance in the economic development of Western Balkan countries. European Journal of Government and Economics, 4: 25–45.[18] Petreski, M. (2013). Southeastern European Trade Analysis: A Role for Endogenous CEFTA-2006? Emerging Markets Finance and Trade. 49: 26–44. [19] Popović, G. (2016). Ekonomija Evropske unije. Istočno Novo Sarajevo: Zavod za udžbenike i nastavna sredstva.[20] Siddiquia, D. A. and Ahmedb, Q. M. (2013). The effect of institutions on economic growth: A global analysis based on GMM dynamic panel estimation. Structural Change and Economic Dynamics, 24: 18–33.[21] Stanivuković, M., Đajić, S. (2008) Sporazum o stabilizaciji i pridruživanju i prelazni trgovinski sporazum Srbije i evropskih zajednica - pravno dejstvo i značaj. Novi Sad: Zbornik radova Pravnog fakulteta. 42, 1–2: 391-412.[22] Stiglitz, J. and Charlton, A. (2005). Pravedna trgovina za sve (Prevod: I. Grgurić). Zagreb: Masmedia.[23] Prasad, E., Rogoff, K., Wei, Sh.-J., and Kose, A. (2003). Effects of financial globalization on developing countries: some empirical evidence. IMF Occasional Paper no. 220. Retrieved: 10. 7. 2019. https://www.imf.org/external/np/apd/seminars/2003/newdelhi/prasad.pdf. [24] World Meters. (2017). Countries in the world by population (2017). Retrieved: 10. 7. 2019. www.worldometers.info/world-population/population-by-country.

109
Volume 7, No.2 2019ISSN 2303-5005
CAN CORPORATE SOCIAL STRATEGY CREATE SHARED VALUE TOWARD CREATIVE BUSINESS?
“VOLVO SOCIAL STRATEGY MODEL”
Ishak Kherchi1, Fellague Mohamed1, Haddou Samira Ahlem1
ABSTRACT
Purpose: This paper aims to provide corporate social strategies as an entrance to create shared value, in addition to that we aims to provide a theoretical and practical contributions that ground understanding the concept of creating shared value.Design/methodology/approach:The authors analyze a single case study of Volvo corporation. The objective is to evaluate whether the corporate social strategies can yields to a shared value creation.Findings:We found that corporate social strategies followed by Volvo Corporation yields to a shared value creation. Research limitations/implications:This single case study provides an entrance to create shared value; however, more research is needed to find other entrances.Practical implications:The paper has practical implications that relate to the design of shared value model. We provide practical well known strategies that could be apply by corporations to reach shared value creation. Originality/value:A unique view of corporate social strategy and creating shared value concept.
JEL: M14.
Review Article doi: 10.2478/eoik-2019-0016 UDK: 6587.8:339.138]:005.336.3
date of sending to review: 08.03.2019.
1University of Hassiba ben Bouali Chlief, Faculty of Economics, Commerce and Management Science, Algeria
Keywords: Creating shared value, corporate social strategy, social value, business value, business competitiveness, Volvo corporation
date of paper receipt:06.03.2019.
date of review receipt:20.03.2019.

ECONOMICS
110
INTRODUCTION
Our world faces urgent many global challenges, such as depletion of natural resources and uneven distribution of wealth, poor nutrition, not enough health care, pollution, access to water, climate change and deforestation.Despite the effort of social organizations, corporate social responsibility, social entrepreneurship; we still have so much trouble to deal with these social and environmental problems, because the complexity, size and scale of these challenges require a role for business.One of the best leading companies in creative business to solve and environmental problems is Volvo. For the Volvo Group, facing these problems and creating social and economic value involves efforts to move both business and society forward, enhancing Volvo competitiveness while simultaneously advancing environmental and social conditions of the societies in which Volvo operate. However creating shared value for Volvo require social strategies to follow on portfolio activities in order to provide products and service which create value for society and lead Volvo to a competitive business.The fundamental problem of this study is related to the way Volvo creates business value and social value, using corporate social strategy, so the question is:How implementing corporate social strategy creates shared value and lead Volvo to a competitive business?Objective of the study:Through this study we aims to provide corporate social strategies as an entrance to create shared value, in addition to that we aims to provide a theoretical and practical contributions that ground understanding the concept of creating shared value towards an innovative business. This study is based on qualitative research; an approach that seeks to describe, decode and translate phenomena in terms of meaning rather than frequency therefore we do not need to provide hypotheses.
1 LITERATURE REVIEW
1.1. SHARED VALUE DEFINITIONS:
According to Porter .M.E & Kramer.M ;Shared value can be defined as policies and operating practices that enhance the competitiveness of a company while simultaneously advancing the economic and social conditions in the communities in which it operates (Porter .M.E & Kramer.M 2011).Creating shared value is an investment in company sustainable competitiveness, achieving economic and social goals. It implies company striving to create shared value in both environments external and internal, and preferably along several dimensions (Porter .M.E & Kramer.M 2011).The CSV concept or ‘shared value’ is an alternative strategy that simultaneously creates both social and business values by reconceiving products/markets, redefining productivity in the value chain, and enabling local cluster development. It can help firms to better respond to societal, environmental, and market needs as well as business activities (Awale R, Rowlinson.S, 2015)We consider creating shared value as new concept in business that allows creating social value while simultaneously moving business forward and leading to a competitive business. does not necessarily lead to business success and facilitate future growth and development of the firm. CSV concept is a new way of thinking in management – an alternative strategy toachieve long-term competitiveness that focuses on integration of a social purpose into companies’ business operations (Awale R, Rowlinson.S, 2015).

ECONOMICS
111
1.2. STEPS TO CREATE SHARED VALUE
Shared value can be created by reconceiving products and services to meet societal demands, by redefining productivity in the value chain and by enabling local cluster development: ( Brønn.P.S, Romantis,Zerfass.A 2016)
1.2.1. RECONCEIVING PRODUCTS AND SERVICESProducts and services should be conceived and produced for meeting social needs and thus they should create social benefits. For instance, the food industry, rather than stimulating more consumption, should focus its interests and strengths on driving better nutrition and health issues. The potentialities of this approach to develop new services and products can be even more significant in poor and disadvantaged countries, where the needs are greater than those of developed countries. For companies this means that societal needs should be constantly monitored and incorporated in the managerial processes concerning R&D and production.
1.2.2. REDEFINING PRODUCTIVITY The value chain is affected by externalities, such as water use, working conditions and fair treatment, which can enhance the costs of production. Taking into account societal issues permits companies to redefine their concept of productivity from a shared value perspective. For instance rethinking logistics systems in the shared value perspective means improving energy utilization through technology investments, such as reducing shipping distances, recycling. All these practices help companies transform the value chain, cutting costs and reinforcing the mutual relationships with partners and stakeholders.
1.2.3. ENABLING LOCAL CLUSTER DEVELOPMENT Finally, shared value can be created by enabling local cluster development. Clusters are geographical concentrations of actors (suppliers, logistical infrastructures, institutions, universities, service providers, trade associations and so on), which support a company and its processes. Firms can create shared value and improve their productivity, by building local clusters and addressing their gaps in specific areas such as logistics, training or market organization. Managerial practices driven by transparency and openness principles create favourable conditions for building clusters, which enhance the benefits for companies and their competitiveness. We see that reconceiving products and markets allows to develop products regard to society’s needs and this what rise the demand on these products, in the same time redefining productivity in the value chain allows to save energy, water, cost and create value for both society and business, then, enabling local cluster development which help to provide infrastructure around creating shared value
1.3. LEVELS OF SHARED VALUEAs we mentioned above shared value created by reconceiving product and markets, redefining productivity in the value chain and enabling cluster development, however how every step of shared value creation contribute in business and social value creation.in order to analyse that we provide the three levels of shared value creation as we see in Table 1.

ECONOMICS
112
Table 1. Three levels of Shared Value CreationLEVELS OF SHARED VALUE BUSINESS RESULTS SOCIAL RESULTS
Reconceiving product and markets:How targeting unmet needs drives incremental revenue and profits
Increased revenueIncreased market shareIncreased market growthImproved profitability
Improved patient careReduced carbon footprintImproved nutritionImproved education
Redefining productivity in the value chain:How better management of internal operations increases productivity and reduces risks
Improved productivityReduced logistical and operating costsSecured supplyImproved qualityImproved profitability
Reduced energy useReduced water useReduced raw materialsImproved job skillsImproved employee incomes
Enabling cluster development:How changing societal conditions outside the company unleashes new growth and productivity gains
Reduced costsSecured supplyImproved distribution infrastructureImproved workforce accessImproved profitability
Improved educationIncreased job creationImproved healthImproved incomes
Source: Porter et al Measuring Shared Value How to Unlock Value by Linking Social and Business results, FSG USA, 2013, P3.
We see that each level of shared value contribute in the creation of business and social value targeting unmet needs drives incremental revenue and creat social value, a better management of internal operations increases productivity and reduces risks and save water and energy that the society need. In addition to that changing societal conditions outside the company unleashes new growth and productivity gains.
2.4. CORPORATE SOCIAL STRATEGY
There exists no generally accepted typology of corporate social strategies. Three different generic social strategies typically emerge from the literature: product differentiation, cost leadership, and strategic interaction between the firm and its regulators (either government or industry).These three generic strategies permit an integration of the economic and social objectives of the firm by using social action to create value for stockholders (HUSTED.B.W, ALLEN.David.A,2001). The purpose of social strategy is to create value for the firm, especially economic value.Social strategy normally involves the investment of capital, whether financial or human, in order to achieve social objectives (HUSTED.B.W, ALLEN.David.B 2001). Social strategy focuses on activities where the social dimension of corporate activity may be joined with the economic dimension in such a way as to enhance both economic and social value creation (HUSTED.B.W, ALLEN.David.B 2001). Generally speaking such strategy creates value for the firm via the creation of a firm reputation or some form of product differentiation (Fombrun, C. and C. Shanley,1990).Value can be also created through the development of new products or services that incorporate a social component or through the creation of entirely new markets (HUSTED.B.W, ALLEN.David.B 2001). Social strategy is focused on understanding the conditions under which project maximization and social performance are congruent (HUSTED.B.W, ALLEN.David.B 2001).Corporate Social strategy often involves the introduction of needed products and services to underserved and poorly understood markets as well as the development of new products and services with social attributes (Kanter , R. M. 1999).Social strategy shares with business strategy the pursuit of profit, but it is not simply a specific kind of business strategy.We see that corporate social strategy focus on addressing social needs and problems that generates profit for the firm and yields to a competitive business.
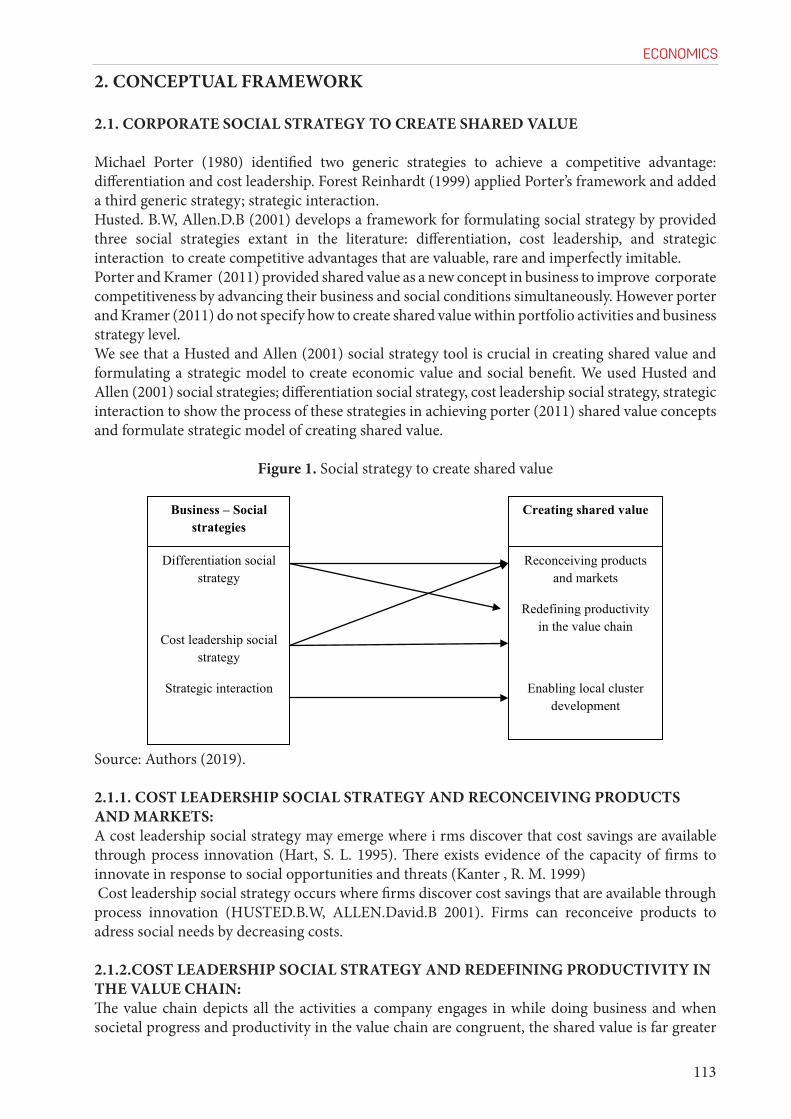
ECONOMICS
113
2. CONCEPTUAL FRAMEWORK
2.1. CORPORATE SOCIAL STRATEGY TO CREATE SHARED VALUE
Michael Porter (1980) identified two generic strategies to achieve a competitive advantage: differentiation and cost leadership. Forest Reinhardt (1999) applied Porter’s framework and added a third generic strategy; strategic interaction.Husted. B.W, Allen.D.B (2001) develops a framework for formulating social strategy by provided three social strategies extant in the literature: differentiation, cost leadership, and strategic interaction to create competitive advantages that are valuable, rare and imperfectly imitable.Porter and Kramer (2011) provided shared value as a new concept in business to improve corporate competitiveness by advancing their business and social conditions simultaneously. However porter and Kramer (2011) do not specify how to create shared value within portfolio activities and business strategy level.We see that a Husted and Allen (2001) social strategy tool is crucial in creating shared value and formulating a strategic model to create economic value and social benefit. We used Husted and Allen (2001) social strategies; differentiation social strategy, cost leadership social strategy, strategic interaction to show the process of these strategies in achieving porter (2011) shared value concepts and formulate strategic model of creating shared value.
Figure 1. Social strategy to create shared value
Source: Authors (2019).
2.1.1. COST LEADERSHIP SOCIAL STRATEGY AND RECONCEIVING PRODUCTS AND MARKETS:A cost leadership social strategy may emerge where i rms discover that cost savings are available through process innovation (Hart, S. L. 1995). There exists evidence of the capacity of firms to innovate in response to social opportunities and threats (Kanter , R. M. 1999) Cost leadership social strategy occurs where firms discover cost savings that are available through process innovation (HUSTED.B.W, ALLEN.David.B 2001). Firms can reconceive products to adress social needs by decreasing costs.
2.1.2.COST LEADERSHIP SOCIAL STRATEGY AND REDEFINING PRODUCTIVITY IN THE VALUE CHAIN:The value chain depicts all the activities a company engages in while doing business and when societal progress and productivity in the value chain are congruent, the shared value is far greater

ECONOMICS
114
than traditionally believed (Moon.H.G, parc.J, 2011).For Firm to develop collaborative, problem-solving relationships with a variety of stakeholders, supplier-buyer cooperation can facilitate innovation leading to cost leadership, but such cooperation can occur only if the firm has well developed resources for stakeholder integration as well as continuous innovation (HUSTED.B.W, ALLEN.David.B 2001). Cost savings may occur through the wise management of relationships with suppliers who are committed to similar social objectives (HUSTED.B.W, ALLEN.David.B 2001).Firms can redefine the productivity in the value chain for cost saving by reduced electricity reduced direct CO2 emissions, reduce the quantity of water waste, increase reuse material recycling and energy recovery.Cost saving may occur through Improving energy, water and resource efficiency across the value chain, Minimizing logistical intensity, Improving employee health and safety, Enhancing the productivity and wages of lower income employees, Recruiting that represents the diversity of customers and the communities where a company operates.Other main resources for cost saving to redefine the productivity in the value chain are; Economies of scale, production technique (Process innovation, Re-engineering of business processes), input costs (Location advantages, Ownership of low-cost inputs, Nonunion labor, Bargaining power) (GRANT.R.M. 2010).
2.1.3.DIFFERENTIATION SOCIAL STRATEGY AND RECONCEIVING PRODUCTS AND MARKETSIn the case of product differentiation, the social objectives of the firm differentiating existing products or developing new products and markets (HUSTED.B.W, ALLEN.David.B 2001).Differentiation social strategy allows firms to reconceiving products through process innovation and providing new products with regard to society’s needs.
2.1.4.DIFFERENTIATION SOCIAL STRATEGY AND REDEFINING PRODUCTIVITY IN THE VALUE CHAINIn order to apply the differentiation social strategy Firms need to redefine the productivity in the value chain by Constructing a value chain for the firm and the customer. Identify the drivers of uniqueness in each activity, Select the most promising differentiation variables for the firm, Locate linkages between the value chain of the firm and that of the buyer (GRANT.R.M, 2010).3.1.5.Strategic interaction and enabling local cluster:the strategic interaction social strategy specii cally incorporates nonmarket actions in creating rent-seeking opportunities through the use of regulation and/or industry standards. However, nonmarket actions may also include activities such as social network development,political contributions, and community service (Shaffer , B. , Quasney , T. J. , and Grimm , C. M. 2000).According to (Husted.B.W, Allen.D.B 2001) the strategic interaction social strategy involves the strategic use of regulation and/or self-regulation in order to create rent-seeking opportunities for the firm. Researchers have demonstrated that firms can use government and industry regulation as a means to obtain competitive advantage with respect to other firms that are less well positioned to comply with such standards.Firm use a strategic interaction social strategy to influence public policy so that the regulator imposes such standards on the entire industry. Such strategies often provide policy makers with information about new policy or build constituencies to support such initiatives (Hillman, A. J. & Hitt, M. A. 1999),this what enabling local cluster.

ECONOMICS
115
3. METHOLOGY
We used the qualitative research. The qualitative research can be defined as an approach that seeks to describe, decode and translate phenomena in terms of meaning rather than frequency .Qualitative research allows the researcher to gather information and do an in-depth exploration of issues, and therefore follows a less structured format with fewer respondents than quantitative methods (Bellenger, DN, Bernhardt, KL & Goldtucker, JL 1989). This qualitative research approach is appropriate for our study because this kind of study required a lot of information and high understanding for the situations, initiatives and social activitiesWithin the qualitative research, we use a case study approach to investigate the idea of shared value in Volvo company through social strategy initiatives . We aim to provide a theoretical and practical contribution to enhance the understanding of how corporate social strategy leads to shared value creation.We collect data and information based from Volvo reports, online meeting with Volvo founders, and observations; the authors analyze a single case study of volvo company. The objective is showing how shared value concept applied using corporate social strategy.
VOLVO SOCIAL STRATEGY MODEL
1. WHO IS VOLVO?
1.1. VOLVO GROUP
The Volvo Group is one of the world’s leading manufacturers of trucks, buses and construction equipment, drive systems for marine and industrial applications and aerospace components. The Group also provides complete solutions for financing and service. In 1927, the first series-produced Volvo car rolled off the production line at the Gothenburg plant and in 1928 the first truck was produced (Hoque.N,Uddin.M.H,Ibrahim.Md,Mamun.A 2014).The Volvo Group employs about 115,000 people, has 65 production facilities in 20 countries and sells its products in more than 190 markets. In 2011 annual sales of the Volvo Group amounted to about SEK 310 billion. The Group’s market share of sales are 39% in Europe, 19% in North America, 11% in South America, 24% in Asia, 7% in rest of the World (Hoque.N,Uddin.M.H,Ibrahim.Md,Mamun.A 2014).The Volvo Group was one of the first companies to become a signatory to the United Nations’ Global Compact when it was launched in 2001. The Group is committed to the principles of the initiative, and they are integrated into its Group policy and core governance document: the Volvo group code of conduct (The Volvo group annual and sustainability report 2011).The Volvo Group’s vision is to become the world leader in sustainable transport solutions by creating value for customers in selected segments, pioneering products and services for the transport and infrastructure industries, driving quality, safety and environmental care, and working with energy, passion and respect for the individual The Volvo group csr and sustainability report, 2011)
2. HOW VOLVO CREATED SHARED VALUE Volvo designed multi-pronged approaches to provide holistic solutions to social and business problems:Volvo Reconceive products and markets using differentiation social strategies, by doing that Volvo provided new UD Quester truck, Trucks offer 24-hour roadside assistance, new heavy-duty truck range,Volvo Construction Equipment’s (Volvo CE) excavators.As we see in figure 2, Volvo Redefined productivity in the value chain using cost leadership social
ECONOMICS
116
strategies, this allowed Volvo to Decrease energy consumption, reduced electricity reduced direct CO2 emissions, adding value and uniqueness in each activity, Construct a value chain for the firm and the custom, reduce the quantity of water waste, increase reuse material recycling and energy recovery.In addition to that Volvo Enable local cluster development through Strategic interaction with World Economic Forum, Japan Automobile Manufacturers Association (JAMA) ,American Trucking Associations, American Public Transportation Association, National Marine Manufacturers Association, European Association of Internal Combustion Engine Manufacturers (Euromot), Truck and Engine Manufacturers Association (EMA) in the US.
Figure 2. VOLVO Business – Social strategies To Create shared value
Business – Social strategies
Differentiation- social strategies
Cost leadership- social strategies
Strategic interaction
Creating shared value
Reconceiving products and markets
Redefining productivity in the
value chain
Enabling local cluster development
Volvo new UD Quester truck, Trucks offer 24-hour roadside assistance, new heavy-duty truck range,Volvo Construction Equipment’s
(Volvo CE) excavators
World Economic Forum, Japan Automobile Manufacturers Association
(JAMA) ,American Trucking Associations,American Public
Transportation Association, National Marine Manufacturers Association, European
Association of Internal Combustion Engine Manufacturers (Euromot), Truck and Engine
Manufacturers Association (EMA) in the US.
Decreasing energy consumption, reduced electricity reduced direct CO2 emissions,
adding value and uniqueness in each activity,Construct a value chain for the firm
and the custom, reduce the quantity of water waste, increase reuse material recycling and
energy recovery.
Source: Authors (2019).
2.1. DIFFERENTIATION SOCIAL STRATEGY AND RECONCEIVING PRODUCTS AND MARKETS
The Group offers a wide range of products and services customized for different markets and needs. For example, Volvo new UD Quester truck range has been designed to meet specific needs of customers in growth markets in Asia and beyond. In Europe, Volvo Trucks and Renault Trucks offer 24-hour roadside assistance to keep customers moving. Volvo remanufacturing centers enable us to reduce the cost of spare parts for customers worldwide (Supporting productivity, www.volvo.com, 11/10/2017).

ECONOMICS
117
In 2013, Volvo made great strides towards goals with the launch of Quester the Group’s new heavy-duty truck range designed, priced and equipped especially for growth markets and businesses. The first target markets are Thailand, Indonesia, Malaysia and China, with India and several other growth markets across the world to follow (Sustainability report, 2013).In August 2013, the Volvo Group launched into the Chinese market two new types of teeth for the buckets of two models of Volvo Construction Equipment’s (Volvo CE) excavators. They are part of a new range of components that includes economically priced ground-engaging tools, such as side cutters, side shrouds, segments and bolt-on edges. Volvo CE’s new products for medium- to light-duty applications generally offer lower initial purchase costs and adapted wear-resistant specifications (Sustainability report, 2013).We see that Volvo reconceiving products regarding to society’s needs and focus on meeting specific buying needs and behaviors in Emerging markets by providing economically priced ground engaging tools, useful truck which could solve some social needs and problems.
2.2. REDEFINING PRODUCTIVITY IN THE VALUE CHAIN The Volvo Group takes a whole value chain approach to developing long-term, sustainable competitiveness. Volvo takes responsibility for the operations within its direct control and strives to create mutually beneficial partnerships with Volvo business partners.Redefining productivity in the value chain require a set of steps like Product development, purchasing, production, distribution and service, products in use, re-use.in addition to that Volvo treat other aspects.2-3-Differentiation social strategy and redefining productivity in the value chain:Volvo redefined the productivity in the value chain Using Differentiation social strategy in areas of product development, purchasing, production, distribution and service as follows: Product development is based on the needs of customers, legislation, changes in society and new technology.Volvo strives to have long-term relationships with suppliers of technologically advanced components.Around 95% of the Volvo Group spending on automotive products comes from suppliers certified in accordance with ISO 14001 or its equivalent.All the Volvo Group’s wholly-owned production facilities have third-party audited quality certificate and 98% have environmental certificates. All Volvo Group-owned dealers are covered by the Group’s environmental requirements and 90% of Volvo distribution centers are certified according to ISO 14001. 2-4-Cost leadership social strategy and redefining productivity in the value chain:Volvo redefined the productivity in the value chain Using Cost leadership social strategy in areas of Energy efficiency, Carbon emissions from production, Waste and water.
2.4.1. ENERGY EFFICIENCYThe Group’s 2015 total energy consumption amounted to 2,106 GWh, a reduction of 70 GWh compared to 2014. The main activity behind the reduction was increased energy efficiency. By reducing energy, Volvo both reduce costs and lower emissions. Between 2005 and 2015, the Volvo Group decreased energy consumption in Volvo own production processes by roughly 20% in absolute terms. This means that the energy cost for 2015 has decreased with more than SEK 500 M thanks to energy efficiency activities (The Volvo group annual and sustainability report, 2015). The accumulated saving is significantly larger. For example, Volvo Construction Equipment has reduced electricity consumption by focusing on idle time, by changing behavior, electricity consumption during idle time at the six largest plants has been reduced by 19% in 2015 and by 39% overall since 2012. This is equivalent to heating 343 houses in Sweden for a full year (The Volvo group annual and sustainability report, 2015).. Volvo energy efficiency index, which compares

ECONOMICS
118
energy consumption with net sales, was 6.9 MWh/SEK M in 2015, compared with 7.9 MWh/SEK M in 2014. The 2015 energy efficiency index has thereby improved 13% since 2014 (Improving our energy efficiency, www.volvo.com, 12/10/2017).We see that Cost leadership social strategy decreased energy consumption, electricity consumption and this what increasing energy efficiency index and allowed Volvo to redefine the productivity in the value chain and lead to focus more on source of productivity improvement and Reduce production costs.
2.4.2. CARBON EMISSIONS FROM PRODUCTIONIn 2015, direct CO2 emissions from the Volvo Group’s production facilities decreased from 231,000 tons to 221,000 tons. About 40% of Volvo total energy consumption came from low-carbon renewable sources, including hydropower electricity and biomass heating (McMullen.C 2016). The Volvo Group has carbon-neutral facilities in Ghent, Belgium, as well as Vara, Tuve and Braås in Sweden. Additionally we have facilities buying 100% of their electricity produced from landfill gas instead of fossil fuels (The Volvo group annual and sustainability report, 2015).Volvo redefine the productivity in the value chain by focusing on main aspect that provide value for the society and save cost for the group such as decreasing energy consumption, reduced electricity reduced direct CO2 emissions, reduce the quantity of water waste, increase reuse material recycling and energy recovery.
2.5. STRATEGIC INTERACTION ENABLING LOCAL CLUSTER THROUGH PARTNERSHIP
Volvo believe it is more efficient to work in partnership with key stakeholders, and that Volvo social impact will be increased by working together with partners sharing mutual goals. Over the years, Volvo has developed partnerships with customers, government officials, non-governmental organizations, local decision makers, educational and community groups (Sustainability report 2014). Knowledge of legislation, trends and best practice, both in Volvo industry and the wider world, is essential to the Volvo Group’s ability to actively meet needs and identify new business opportunities.The Group is a signatory of the UN Global Compact, a member of the World Wide Fund for Nature (WWF) Climate Savers Program and participates in many trade and industry forums including: (Moving our business forward, www.volvo.com, 14/10/2017).European Automobile Manufacturers’ Association (ACEA)Committee for European Construction Equipment (CECE)Truck and Engine Manufacturers Association (EMA) in the USJapan Automobile Manufacturers Association (JAMA) Association of Equipment Manufacturers in the USAmerican Trucking AssociationsAmerican Public Transportation AssociationEach year, the Volvo Research and Educational Foundations (VREF) make major investments in dedicated research projects supporting the development of sustainable transport systems in large urban areas worldwide. Volvo also devotes extensive resources to traffic safety research, partnering with key industry players, universities and governments for greater efficiency (Sustainable transport solutions research www.volvo.com, 14/10/2017)..Volvo also make an Academic Partner Program (APP), the basic principle behind this program is long-term strategic collaboration with leading universities in areas.This collaboration with universities is key for the Volvo Group to keep driving innovation in the area of transport solutions of mutual interest. The Volvo Group is currently working on a joint initiative within the Academic Partner Program (APP) together with Chalmers University of Technology and Mälardalen University in Sweden, Penn State University in the United

ECONOMICS
119
States, as well as the waste recycling company Renova. The initiative aims to develop a robot that interacts with the refuse truck and its driver to accomplish the work Volvo continues the successful cooperation with the academic world www.volvo.com, 14/10/2017).Volvo strategically interacts and developed partnerships with deferent parts including; customers, government officials, non-governmental organizations, local decision makers, educational and community groups and this what enabled local cluster. Following business social strategies; Cost leadership social strategy, Differentiation social strategy and strategic interaction, Volvo reconceiving product and markets, redefining productivity in the value chain and building clusters through partnership and lead to shared value creation.
3. VOLVO SOCIAL STRATEGIES CREATED SHARED VALUE
3.1. OTHER ASPECTS OF VOLVO SOCIAL STRATEGIES TO CREATE SOCIAL VALUEVolvo engages in activities related to core business and operating context where Volvo can use unique expertise, knowledge and skills to address social and environmental challenges. All activity is guided by Volvo corporate core values of quality, safety and environmental care and aims to support Volvo vision. The Volvo Group is most active in the areas of skills development, traffic safety, education, environmental protection and disaster relief.
3.1.1. DEVELOPING SKILLSThe Volvo Group conducts a variety of professional training programs in emerging and established markets worldwide that facilitate employment opportunities within the local community and secure the long term development of Volvo business, Volvo encouraged 100,000 employees to get involved in promoting safety awareness sessions for children in their immediate environment (Educating and developing skills, www.volvo.com, 15/10/2017).
3.1.1.1. TRAINING SCHOOLS IN AFRICAThe Volvo Group is planning to invest a total SEK 30 M to introduce vocational training schools in 10 African countries, in partnership with the Swedish International Development Cooperation Agency (Sida) and the US Agency for International Development (USAID) (Hedouin.S .2015).The Volvo Group has an ambition to grow revenue in Africa by 25 percent between 2013 and 2015. The schools will be set up in countries that are both business-critical for the Volvo Group and eligible for development grants from both Sida and USAID.
3.1.1.2. WORLD FOOD PROGRAMThe United Nations World Food Program (WFP) works to combat hunger by guaranteeing access to food in the poorest parts of the world Reliable trucks are vital to the WFP’s logistics and Renault Trucks are a key partner for carrying supplies in extreme conditions. Renault Trucks initiated a five-month volunteer program to train WFP mechanics in six East African countries, concluding March 2013. Volvo provided a mobile training unit and a team of expert technicians to give WFP mechanics onsite training in the most advanced maintenance techniques (Training of World Food Program technicians in East Africa, www.volvo.com, 16/10/2017).
3.1.1.3. THE VOLVO STEPThe Volvo Step is a one-year, paid vocational training program in industrial production created specifically for unemployed young people aged 18 to 22. The Volvo Step takes place at 13 sites across Sweden and provides both theoretical and practical learning experience 15% of all food in Europe is delivered by a truck from the Volvo Group (Ripa.M. 2014).

ECONOMICS
120
3.1.2. IMPROVING TRAFFIC SAFETYThrough educational programs and sponsorship, the Volvo Group participates in different initiatives to increase safety and reduce the number of traffic accidents.
3.1.2.1. INCREASING SAFETY THROUGH AWARENESS AND TRAININGVolvo run traffic and site safety programs for drivers and operators all over the world, including: (Increasing safety through awareness and training www.volvo.com, 24/10/2017).• The Transform program in Brazil has been running since 1998 and has been replicated in Peru.• Driver training programs run jointly in India have trained more than 159,000 drivers.• Operator training run by Volvo Construction Equipment in India trained close to 2,000 operators in 2015 and the total trained since the start 2007 is above 10,200.• Volvo Driver Academy is a demo training project initiated in China for drivers to drive more safely and efficiently.
3.1.2.2. PROFESSIONAL DRIVER PROGRAMS IN SOUTH AMERICAThe Volvo Group’s transform program has trained over 900 professional drivers in vehicle safety technology and safe driving behavior skills since its launch in Brazil (2008) and Peru (2010).The program offers a five-day intensive training on appropriate vehicle handling and better use of its safety elements onsite or at Volvo Group facilities or dealerships. It also motivates drivers to consider the emotional impacts of traffic accidents on their families (Improving traffic safety, www.volvo.com, 24/10/2017).In India, Volvo have trained over 110,000 drivers in total. Volvo train at least two drivers for every Volvo truck and bus sold around 35,000 to date and we collaborate with Volvo joint venture partner, Eicher, and government agencies on award-winning truck and bus driving and safety programs (Improving traffic safety, www.volvo.com, 24/10/2017).
3.1.3. RESPONDING TO DISASTERVolvo responds to disasters in various ways, depending on the situation and the most appropriate use of Volvo expertise, skills and resources. While Volvo cannot contribute to all cases, Volvo do try to assist several each year. During 2013, Volvo offered disaster relief assistance following: (Responding to disasters, www.volvo.com, 24/10/2017).• Typhoon Haiyan in the Philippines • The Ya’an earthquake in China• Flash floods in Uttarakhand, northern India.
3.1.3.1. DISASTER RELIEF SUPPORT2013 included donations of money, clothing and equipment to assist organizations dealing with the Ya’an earthquake, Uttarakhand floods and Typhoon Haiyan (Corporate social responsibility, 2013)
3.1.4. CARING FOR THE ENVIRONMENTEnvironmental care is one of Volvo corporate core values and aim to establish programs that encourage society to take a greater interest in the environment globally and locally: (Sustainability report, 2013)
3.1.4.1. VOLVO ENVIRONMENT PRIZEThe Volvo Environment Prize foundation was established in 1988 and has become one of the world’s most prestigious environmental prizes. It is awarded annually to people who have made outstanding scientific discoveries within the area of the environment and sustainable development The prize consists of a diploma, sculpture and a cash sum of SEK 1.5 M and is presented at a ceremony in Stockholm, Sweden.

ECONOMICS
121
3.1.4.2. VOLVO ENVIRONMENTAL CENTERVolvo Environmental Center in Brazil lies amid remnants of ancient rainforest that is home to 1,500 botanical species, over 250 bird and hundreds of other animal species
3.1.4.3. UP-CYCLING DESIGN ARTS CAMPAIGNWith the support of the China Resource Recycling Association, Volvo Construction Equipment unveiled ‘City Garden’ – the first conceptual piece of art designed from scrap machinery parts – to launch a new campaign in Shanghai during 2013. The campaign encourages people to transform scrap machinery parts into urban artwork and explore new approaches to environmental protection and city enhancement.
3.2. CORPORATE SOCIAL STRATEGIES LEAD VOLVO TO A COMPETITIVE BUSINESS
Volvo Social strategies made a high impact on business value in terms of; net sales, cash flow, gross income, Return on Equity, Return on shareholders’ equity and other value indicators: (The Volvo group annual and sustainability report, 2014). Net sales Net sales increased by SEK 312,515 billion compared with prior year 2014 out of which approximately SEK 282,948 billion and sek 272,622 billion in 2013.. Operating incomeOperating income increased by SEK 23,318billion compared with prior year out of 2014 which approximately SEK 5,824 billion and sek 7,138 billion in 2013.. Operating cash flow, Industrial Operations Operating cash fl ow, Industrial Operations increased by SEK 18.3 billion compared with prior year out of 2014 which approximately SEK 6.4 billion and sek 1.5 billion in 2013.. Gross incomeGross income increased by SEK 71,862 billion compared with prior year out of 2014 which approximately SEK 62,937 billion and sek 60,118billion in 2013.. Income for the periodIncome for the periodincreased by SEK 15,099 billion compared with prior year out of which approximately SEK 2,235billion.. Cash flow from operating activitiesCash flow from operating activities increased by SEK 25,858 billion compared with prior year out of which approximately SEK8,737 billion.. Operating incomeOperating income increased by SEK 17.5 billion (300%) compared with prior year out of which approximately SEK 8.9 billion. Return on shareholders’ equity%:Return on shareholders’ equity%, increased by SEK 18.4 billion compared with prior year out of which approximately SEK 2.8 billion.. Gross margin, %: Gross margin, % increased by SEK 22.2 billion compared with prior year out of 2014 which approximately SEK 21.3 billion and sek 21.1 in 2013.. Return on Equity, % Return on Equity, % increased by SEK 13.4 billion compared with prior year out of 2014 which approximately SEK 12.5 billion and sek 12, 1 in 2013.We see that most business performance indicators have improved and bring value for the group, in addition to that, there are others business indicators that rise the value of the group, we provide some these indicators as follows: (The Volvo group annual and sustainability report, 2014)Volvo Buses has sold more than 2,300 hybrid buses in over 20 countries In 2015, Volvo delivered

ECONOMICS
122
207,475 trucks from Volvo wholly-owned truck operations and 8,825 buses, 44,718 units of construction equipment, 17,413 marine engines and 15,295 industrial engines from Volvo Group operations.As part of “The Best Commercial Vehicles 2015”, in Stuttgart, Germany, Volvo Trucks received five awards for the Volvo FH/ FH16 and Volvo FM. Volvo FH won the Truck of the Year title in Poland as well as in the Czech Republic and Slovakia.In November, Volvo Penta’s revolutionary Forward Drive (FWD) was honored at the Berlin Boat Show with the Best of Boats Special Award. Earlier in the year Boating Industry, a US boating business magazine, selected FWD as one of the top products of the year. FWD also won the Innovation Award at Miami International Boat Show.The Electricity partnership, where Volvo is one of the main participants, was recognized by the European Association for Renewable Energy, Eurosolar, for being the best example for 2015 of sustainable public transport using renewable energy.In 2015, a total of 207,475 trucks where delivered from the Group’s wholly-owned operations, an increase of 2% compared with 203,124 trucks in 2014. Deliveries increased in Europe and North America while they were flat in Asia and declined in South America and Other markets.In 2015, net sales in the truck operations increased by 12% to SEK 213,978 M (190,904). Adjusted for changes in exchange rates, net sales increased by 2%.Volvo is number 2 in heavy-duty diesel engines.Volvo is number 1 in marine diesel engines.Volvo is number 2 in heavy-duty trucksVolvo is number 2 in buses for target segments.Volvo is number 4 in construction equipment.The previous Volvo social programs and efforts moved society forward and improve most business performance indicators (moved Volvo group business forward), Volvo become number 1 in marine diesel engines and number 2 in heavy-duty trucks and buses for target segments.
CONCLUSION AND RECOMMENDATIONS
Both social strategy and shared value aims to provide economic and social value, we can create shared value by implementing corporate social strategies; cost leadership strategy, differentiation strategy and strategic interaction.Volvo have developed a model to reach shared value using social strategies such as, differentiation strategy to reconceiving products and markets, cost leadership strategy to Redefining Productivity in the Value Chain and strategic interaction for enabling local cluster development.In addition to that; Volvo used other aspects of social strategy that helped to create shared value; Developing skills, Training schools in Africa, World Food Program, Improving traffic safety Increasing safety through awareness and training Professional driver programs In South America, Increasing safety through awareness and training School safety programs, Raising awareness, rewarding best practice, Responding to disaster and Caring for the environment programs. All of these social strategies lead Volvo to a competitive business and improve all performance indicators which rise the value of the group. We hope this article serves to illustrate the scale of that opportunity, and triggers discussion and innovation around ways to capitalize on it.
ECONOMICS
123
REFERENCES
[1] Porter .M.E & Kramer.M (2011): Creating Shared Value, Harvard Business Review ,P66.[2] Lentjushenkovaa.O, Lapinab( 2015): Intellectual Capital Investments: Company’s Additional Expenditures or Creating Shared Value? 15th International Conference at Brno University of Technology, Faculty of Business and Management, May 28-29, Brno, Czech Republic Perspectives of Business and Entrepreunership Development,p6.[3] Awale R, Rowlinson.S(2015): An Exploratory Study of a CSV Concert for Achieving Firm Competiiveness in Hong Kong Construction Firms, Thirty-First Annual Conference, Lincoln,Volume 2.[4] Awale.R , Rowlinson.S (2015): A CSV Concept to Adress Health and Safety Issues and Achieve Firm Competitivenes in the Hong Kong Construction Industry, Proceedings of CIB W099 Benefitting Workers and Society through Inherently Safe(r) Construction Belfast, Northern Ireland, p245.[5] Brønn.P.S, Romantis,Zerfass.A (2016): Book Series: Advances in Public Relations and Communication management, Emerald Group Publishing Limited, p 189.[6] HUSTED.B.W, ALLEN.David.A (2001): Toward a Model of Corporate Social Strategy Formulation, Paper presented at the Social Issues in Management Division, Academy of Management,p10.[7] HUSTED.B.W, ALLEN.David.B (2001): Corporate Social Strategy: Stakeholder Engagement and Competitive Advantage, cambridge universit y press, p14. [8] Fombrun, C. and C. Shanley: 1990, ‘What’s in a Name? Reputation Building and Corporate Strategy’, Academy of Management Review 33(2), 233–258. [9] Kanter , R. M. 1999 . From spare change to real change . Harvard Business Review , 77 (3): 122 –132[10] Hart , S. L. 1995 . A natural-resource based view of the i rm . Academy of Management Review , 20 (4): 986 –1014.[11] Kanter , R. M. 1999 . From spare change to real change . Harvard Business Review , 77 (3): 122 –132.[12] Moon.H.G, parc.J (2011): Journal of International and Area Studies, Volume 18, Number 2, pp.49-64 [13] GRANT.R.M (2010 ): Contemporary Strategy Analysis, John Wiley & Sons Ltd, Seventh Edition, p231.[14] Shaffer , B. , Quasney , T. J. , and Grimm , C. M. 2000 . Firm level performance implications of nonmarket actions . Business and Society ,39 (2): 6 –143. [15] Hillman, A. J. & Hitt, M. A. 1999. Corporate political strategy formulation: A model of approach, participation, and strategy decisions. Academy of Management Review, 24 (4): 825-842.[16] Bellenger, DN, Bernhardt, KL & Goldtucker, JL 1989, ‘Qualitative research techniques: Focus group interviews’, in Focus group interviews: A reader, eds TJ Hayes & CB Tatham, American Marketing Association, Chicago.[17] Hoque.N,Uddin.M.H,Ibrahim.Md,Mamun.A (2014): Corporate Social Responsibilities (CSR) as a Means of Materializing Corporate Vision: A Volvo Group Approach, Asian Social Science; Vol. 10, No. 11,p260,DOI: 10.5539/ass.v10n11.[18] The Volvo group annual and sustainability report (2011): Global Compact A decade as a signatory to the Global Compact, p99.[19] The Volvo group csr and sustainability report (2011):Towards sustainable transport solutions Shaping the future of transport,p4[20] Supporting productivity http://www3.volvo.com /investors/finrep/sr13/en/creatingvalue/movingsocietyforwar/supportingproductiv/supporting-producti.html, 11/10/2017.[21] Sustainability report (2013), op, cit, p42.[22] Improving our energy efficiency, http://www3.volvo.com/investors/finrep/sr14/en/responsiblebehavior/valuechainsustainab/environmentalimpact/energy/improving-our-energ.html, 12/10/2017.

ECONOMICS
124
[23] McMullen.C (2016): Key Takeaways from Volvo Group’s New Sustainability Report,http://waste360.com/waste-reduction/key-takeaways-volvo-group-s-new-sustainability-report.[24] Sustainability report (2014): Creating shared value, p13.[25] Moving our business forward, www3.volvo.com/investors/finrep/sr13/en/creatingvalue/movingourbusinessfo/moving-our-business.html, 14/10/2017.[26] Sustainable transport solutions research, www3.volvo.com/investors/finrep/sr14/en/sustainabletranspor/futuretransportsolu/research/sustainable-transpo.html,15/10/2017.[27] Volvo continues the successful cooperation with the academic world , http://news.volvogroup.com/2017/10/14/volvo-continues-the-successful-collaboration-with-the-academic-world/#sthash.Y9r2833t.dpufnews.volvogroup.com/2016/10/14/volvo-continues-the-successful-collaboration-with-the-academic-world/,16/10/2017.[28] Educating and developing skills,www3.volvo.com/investors/finrep/sr14/en/creatingsharedvalue/societalengagement/educationandskillsd/educating-and-devel.html,22/10/2017.[29] Hedouin.S (2015): Public Transport Sustainability: BRT & Electro Mobility, brought to you by Volvo,p72[30] Training of World Food Program technicians in East Africa (2012), www3.volvo.com/investors/finrep/sr12/en/societyengagement/professionaltrainin/trainingofworldfood/training-of-world-f.html[31] Ripa.M (2014): We can make a difference in Africa,news.volvogroup.com;we-can-make-a-difference-in-africa,23/10/2017.[32] Increasing safety through awareness and training (2012), www3.volvo.com/investors/finrep/sr14/en/sustainabletranspor/safersolutions/trafficanddriversaf/increasing-safety-t.html,24/10/2017.[33] Improving traffic safety (2013),www3.volvo.com/investors/finrep/sr13/en/creatingvalue/movingsocietyforwar/engagingwithsociety/improvingtrafficsaf/improving-traffic-s.html[34] Improving traffic safety (2013), www3.volvo.com/investors/finrep/sr13/en/creatingvalue/movingsocietyforwar/engagingwithsociety/improvingtrafficsaf/improving-traffic-s.html.[35] Responding to disasters (2013): www3.volvo.com/investors/finrep/sr13/en/creatingvalue/movingsocietyforwar/engagingwithsociety/respondingtodisaste/responding-to-disas.html.[36] Corporate social responsibility (2013), p29.

125
Volume 7, No.2 2019ISSN 2303-5005
ABSTRACT
The regional reality of the Republic of Serbia is characterized by strong regional disparities and adverse demographic trends. This situation is the result not only of inadequate actions of makers of macroeconomic policy and implementation of inefficient models of regional development in modern conditions, but of a long-term process of inheritance and deepening of regional disparities. The consequences of uneven regional development are numerous, and despite the economic ones, it is very important to emphasize the importance of non-economic consequences of uneven regional development. This primarily refers to the unfavorable demographic flows caused by the bipolarization of the state to the developed north and undeveloped south. Migratory trends in the Republic of Serbia can be observed in three different, however, interrelated processes. The first relates to migration from villages to cities, the second to migration from south to north and the third to migration directed beyond the borders of our country. These processes led to the extinction of the Serbian village and to the demographic emptying of the periphery of the Republic of Serbia. This is best supported by the fact that every fourth village is in the process of demographic disappearance, while every fourth agricultural resident of the Republic of Serbia is at risk of poverty. However, in the Zajecar district, the municipality of Sokobanja, one can notice the digital transformation of Vrmdža village, similar to the digital transformation of villages in developed countries. This transformation has attracted a large number of young families from this village doing business activities through the internet and modern digital technologies. The aim of this paper is to investigate the digital transformation of the village of Vrmdža by presenting a specific model of village transformation that can significantly contribute to the relativization of regional disparities in the Republic of Serbia.
DIGITAL VILLAGE TRANSFORMATION: A MODEL FOR RELATIVIZ-ING REGIONAL DISPARITIES IN THE REPUBLIC OF SERBIA
Aleksandar Manasijević1, Marko Milojković1, Dejan Mastilo2
date of paper receipt:05.11.2019.
JEL: R10, R11.
Review Article doi: 10.2478/eoik-2019-0013 UDK: 004.738.5:658.8(497.11)
date of sending to review: 07.11.2019.
date of review receipt:15.11.2019.
1 Faculty of Economics, University of Niš, Serbia2 Faculty of Business Economics, Bijeljina, Bosnia and Herzegovina
Keywords:Regional development, regional disparities, village transformation, digital technologies, new model of regional development.

ECONOMICS
126
INTRODUCTION
The contemporary economic reality in the Republic of Serbia, among other things, is characterized by pronounced regional differences at all levels. However, the problems of uneven regional development have a multiplied negative effect on almost all segments of society, both economic and non-economic. One of the most intense impacts is reflected in the negative impact of pronounced regional differences on demographic flows.Given the polarization of the Republic of Serbia into the more developed north and the undeveloped south, “... the labor force by nature migrates to places with higher average incomes, that is, to those places where they will have better living conditions.” (Manasijević, 2018, p. 5 ). This, on the one hand, leads to the emptying of some parts of our country, while, on the other hand, such demographic flows are a barrier to the implementation of regional policy measures and instruments, since these areas are left without their basic development resource - people.In modern conditions, when it is obvious that most villages in the hilly and mountainous regions, most often South and Southeastern Serbia, become almost completely demographically empty, it is of utmost importance to create and implement regional policy measures and instruments in order to stop and then reverse this process. However, measures and instruments of regional policy cannot be applied spontaneously, but must be envisaged by the long-term strategy of regional development of the Republic of Serbia, which does not exist in modern conditions.This situation in the Republic of Serbia is not a product of exclusively contemporary conditions, but has its roots in a relatively distant historical period. With that in mind, a chronological analysis of regional development in the Republic of Serbia, followed by an analysis of regional reality, needs to be done for a more accurate and relevant analysis. These analyzes need to be conducted in order to create a specific theoretical framework that is needed to create measures and instruments to overcome the aforementioned situation.In addition to classical, or rather traditional methods, today, it is possible to use certain modern methods, with the help of digital technologies, to reduce regional differences. An example of this can be found in the Republic of Serbia. Namely, the village of Vrmdža, the municipality of Sokobanja implemented modern digital technologies and created a so-called rural hub from which modern freelance jobs can be performed. They called this approach “rurban” which, as the name implies, is a combination of rural and urban development. Such a decision proved to be extremely good, because a large number of young married couples, mostly millennials, decided to settle in the territory of this village and from there they did their jobs.In this sense, after analyzing the situation in the territory of Vrmdža village, the aim of this paper is to create an approach that can be applied in other villages in the Republic of Serbia, which can have far-reaching positive effects on regional development and demographic trends in our country.
1. CHRONOLOGICAL ANALYSIS OF REGIONAL DEVELOPMENT OF THE REPUBLIC OF SERBIA
Before starting the chronological analysis, it is necessary to briefly define the phenomenon of regional development. If we start from the general theory of the system, society can be seen as one big system, but also the economy, which is one of the most complex subsystems of society, can be seen as a large economic system. (Cobeljic, 1974). In this sense, and given the complexity of the economy as a system, the process of economic development can be characterized as one of the most complex processes.However, the process of economic development is not a process which, colloquially speaking, is floating, but is taking place in a certain space. In this sense, regional development in the broad sense can be defined as observing the process of economic development through the so-called regional prism. In the narrow sense, regional development can be defined as a process in which a large

ECONOMICS
127
number of actors, at different hierarchical levels, in a given territory (national economy, region, district, even local government), influenced by a large number of internal, external, subjective and objective factors achieving optimally balanced economic development. (Manasijevic, 2018). It should be borne in mind that evenly balanced development cannot be achieved in practice, and even if possible it would adversely affect economic development. (Aranđelović and Gligorijević, 2010). Considering the above, while certain regional differences can be stimulating to achieve the goals of economic development, it must be taken into account that they move within the socially acceptable boundary, because if regional differences become socially unacceptable, then this constitutes a problem that impedes the course of the economic life of a country. However, in the literature, however, there is no exact and unique definition that defines this boundary.In line with changes in the global environment, social, political, and on that basis, economic systems, the role, way of observing and understanding of regional development in economic theory is changing. Today, almost fifty years since the so-called “golden age” of regional development, the problems of uneven regional development are more acute than ever in almost all countries of the world, regardless of their level of development.In addition, the problem of uneven regional development, not only exists as such but, on the contrary, has its multiplied negative effect in all pores of socio-economic reality, precisely in proportion to the increase in regional disparities. In order to apply regional policy measures and instruments in the right way today, producing positive results, it is necessary to view the phenomenon of regional development from a long-term, strategic perspective.However, when designing an adequate, long-term, regional development strategy, it is necessary to first consider the historical course of the theory and policy of regional development of the Republic of Serbia.Throughout history, the Republic of Serbia has repeatedly changed its borders, state systems and rulers, was occupied, territorially classified into several empires, divided into sandzaks, sections, districts, baninas and regions. The roots of many of the problems of regional development that the Republic of Serbia is facing today lie in a relatively long period of time. In that sense, a chronological analysis of the phenomenon of regional development should be carried out in order to provide a more detailed analysis needed to create a strategic basis for regional development of the industry of the Republic of Serbia. With this in mind, the aim of this part of the paper is to review the historical course of the theory and policy of regional development of the Republic of Serbia.
1.1. REGIONAL DEVELOPMENT OF SERBIA UNTIL THE FIRST WORLD WAR
Regionalization in Serbia was, to a certain extent, represented in the Sretensky Constitution of 1835, with the envisaged districts, districts and municipalities. (Aranđelović, Gligorijević, 2010)During this period, the districts, for the first time, receive a certain amount of autonomy in the decision-making process crucial for the smooth life of the people who exist in particular regions. The acquisition of a certain, limited, autonomy, as well as the gradual disconnection with the former, feudal, system opens the space for the development of certain regions in the Principality of Serbia of that time.In the period of the Kingdom of Serbia, after the previous enlargement of the territory, the introduction of dinars and the establishment of the Privileged National Bank, the conditions for the rapid development of the capitalist economy were created. Since domestic accumulation was insufficient, with the great help of foreign loans, mines and industrial enterprises were opened, roads and railways were built, as well as other infrastructure networks and more. However, despite the initiated, accelerated, industrial development, the Kingdom of Serbia was, in this period, a predominantly agricultural, underdeveloped, European country.

ECONOMICS
128
Viewed from the aspect of regional development, the initiation of the process of industrialization, on the one hand, resulted in the development of certain regions, while on the other, it created regional disparities in relation to other, predominantly agricultural oriented regions. After all, this situation was also largely characteristic of the economy of the Kingdom of Serbs Croats and Slovenes, later the Kingdom of Yugoslavia.However, regional disparities that emerged in the initial period of development of the economy of the Kingdom of Serbia have become more pronounced over time as a result of the absence of adequate regional policy. The development of the economy of the Kingdom of Serbia interrupted the appearance of the First World War (1914-1918), until then the most devastating war in human history.
1.2. REGIONAL DEVELOPMENT OF SERBIA BETWEEN THE TWO WORLD WARS
After the First World War, the Kingdom of Serbia, as well as other European countries, faced a demographic disaster, devastated economic and transport infrastructure, as well as part of the territories that needed to be included in certain countries. Then, as a realization of the long-standing aspirations of the descendants of the Southern Slavs, a new, great state was formed - the Kingdom of Yugoslavia.From an economic point of view, the Kingdom of Yugoslavia was a highly heterogeneous country. Namely, on the one hand, one can notice a relatively developed capitalist economic system in Croatia, Slovenia and Vojvodina, while on the other hand, in other republics economic life takes place in an almost natural form of economy. (Manasijevic, 2018)If we analyze the economic development of the Kingdom of Yugoslavia, we come to the following conclusions:(1) According to European criteria, the Kingdom of Yugoslavia was one of the underdeveloped, predominantly rural, even agrarian overpopulated countries, with a low level of industrial production development;(2) the structural and economic-systemic imbalances between the countries that made up the Kingdom have made it very difficult to achieve long-term, sustainable, economic development and(3) uneven spatial distribution of investments, high presence of foreign capital, most often in more developed regions, but also lack of interest and inadequate, delayed, economic policymakers’ actions lead to an increase in regional disparities which, even then, triggered population migration and capital migration from underdeveloped regions and underdeveloped regions into more developed regions of the Kingdom of Yugoslavia.Thus, in the early 1940s, the Kingdom of Yugoslavia was still in the process of overcoming both the effects of the First World War and the internal, economic and non-economic problems that had arisen in the previous period. However, this process, as well as the process of further economic development of the Kingdom of Yugoslavia, is interrupted by an even more devastating World War II.During the Second World War, the Kingdom of Yugoslavia experienced a new demographic disaster without recovering from the previous one. Economic facilities and transport infrastructure are again destroyed, state wealth dislocated from the country, and the Kingdom of Yugoslavia territorially divided. This situation, after the end of the Second World War, represented a great barrier to achieving the goals of economic development.
1.3. REGIONAL DEVELOPMENT OF SERBIA AFTER THE SECOND WORLD WAR
After the end of World War II, Yugoslavia was faced with an undefined system of government, demographic catastrophe and other consequences of the war. German and other military, occupying, forces withdrew large amounts of state wealth during the withdrawal, destroying much of the remaining economic and transport infrastructure.

ECONOMICS
129
This situation brought the former Yugoslavia to the brink of socio-economic, as well as demographic, political and, ultimately, social failure, which required immediate implementation of the radical, corrective measures and instruments needed for the country’s recovery.It is just such radical changes that have been implemented. Namely, in the elections held after the war, the former state system was replaced by a new, socialist one, which meant changes in almost all fields of the socio-economic system.Accordingly, the Kingdom of Yugoslavia changes its name and borders, and then a new state emerges - the Socialist Federal Republic of Yugoslavia. In economic terms, the postulates of socialist or, rather, Marxist economic theory were applied in the economy of the new state.The high level of devastation of the country, the pronounced regional mismatches and the low standard of living required the immediate reaction of the state as the only actor that could have overcome this situation. This, in the beginning, meant a very centralist approach (similar to the Soviet Union) in the development of economic life.All decisions regarding the organization and functioning of the economic system were made from one center while it was up to the business entities to execute the plans of the central commission. Large regional differences, inherited from the previous period, have emerged as the central problem of the economy of the SFRY, so they have to be overcome as soon as possible.This is not only because the pronounced regional differences adversely affected all segments of socio-economic reality, but also due to the fact that the regional, as well as any other, distinct differences were contrary to the socio-political dogmas on which the foundations rested Socialist Federal Republic of Yugoslavia.However, the problem of uneven regional development of the Socialist Federal Republic of Yugoslavia was a very complex problem, whose roots were in a relatively long historical period. However, it should be borne in mind that the overall level of economic development and standard of living of the whole country was very low.In this sense, the economic policy-makers of the Socialist Federal Republic of Yugoslavia were forced to apply only regional policy during that period. The policy concerned the simultaneous, parallel development of all regions and accelerated economic development of the whole country. In doing so, regions that were less developed had to develop significantly faster to reach more developed regions.Such regional policy was only possible in such a socialist state system, where each development process was planned in a detailed and centralized way, for all republics, at the state level. Regarding regional development methods, the same method was adopted for all (both developed and underdeveloped) regions, which was industrialization. (Aranđelović and Gligorijević, 2010)If we analyze and observe in more detail the overall regional development policy of the Socialist Federal Republic of Yugoslavia, we conclude that its essence is precisely in the principle of uniformity, while its basic tool, that is, the method of industrialization.Namely, the conception of regional development policy, on the principle of equality, was the only and possible solution, given the essence of mitigating regional differences and also the conditions that existed in the SFRY at the beginning of its development. (Rosic and Gligorijevic, 2001)Why industrialization? First of all, it is important to mention that the regionalization of the Socialist Federal Republic of Yugoslavia was carried out according to the political-territorial principle, that is, viewed from the state level, into six republics and two autonomous provinces. Thus, the regionalization of the SFRY was not conducted on the basis of purely economic but also political and national-ethnic principles. Developmental mismatches between republics and autonomous provinces were very pronounced. However, the views of the policy makers of the SFRY were that, although it is to be balanced, it must not be done on the principle of general leveling between developed and underdeveloped republics. In this sense, the industrialization of the SFRY has become the most acceptable method of regional policy.

ECONOMICS
130
This is because, on the one hand, industrialization allows economically more developed republics to continue their development, while, on the other hand, less developed republics in the so-called “revolutionary leaps” can reach them. In doing so, it has to be noted that agricultural degradation in relation to industry during this period is remarkable, which will later show its negative effects. The application of industrialization methods results in accelerated economic and generally social development, and regional differences, both between individual regions and between republics and autonomous provinces, are mitigated. This peroid is characterized by very high rates of economic growth, renovation and modernization of old and construction of new industrial plants, renovation and construction of transport infrastructure, growth of exports, as well as positive movement of all economic parameters. Economic development was then planned and implemented through the so-called five-year social development plans, in which the concept of regional development equilibrium had a central place.The 1971 Constitutional Amendments and the new 1974 Constitution, republics and autonomous provinces give greater autonomy in different fields, one of which is to define and achieve the goals of economic development within its borders. Such a decision was presented as the integration of the SFRY into the framework of the global trends of the time, and the organization of the state in the same way as the countries of the West. However, very quickly, it turned out that such constitutional changes had negative consequences on the socio-political as well as on the economic, or economic, system of the Socialist Federal Republic of Yugoslavia.Namely, from the economic point of view, the unevenness of economic development is becoming more pronounced, and therefore, regional differences at all levels are increasing. The more developed republics, Slovenia and Croatia, are less and less sharing their accumulation without paying attention to the less developed republics and provinces.At the beginning of the last decade of the 20th century, all the socio-economic and political circumstances in the SFRY signaled the unsustainability of Yugoslavia’s survival and its ultimate disintegration. During this period, regional disparities between the regions and between the Yugoslav republics were on a constant and extremely rapid increase.The final breakup of the Socialist Federal Republic of Yugoslavia began with the separation of Slovenia from Yugoslavia on 25 June. 1991. In the period 1991-1995, a civil war was taking place in the area, now formerly SFRY, during which the destruction of economic and transport infrastructure and a new demographic catastrophe occurred again.
1.4. REGIONAL DEVELOPMENT OF SERBIA AFTER THE BREAKUP OF THE SFRY
After the breakup of the Socialist Federal Republic of Yugoslavia, the two remaining socialist republics (Serbia and Montenegro) formed a state union called the Federal Republic of Yugoslavia.Since its inception, the FRY has been confronted with numerous socio-political problems and pressures such as war conflicts in Bosnia and Herzegovina and Croatia, sanctions imposed by the international community, NATO aggression in 1999 and so on. With this in mind, decision-makers at the state level could not fully address the economic problems and thus the problems of regional development.Seen from a regional development perspective, many issues in the FRY needed to be rethought. One of those was the division of the country into macroeconomic regions. Guided by specific socio-economic criteria, makers of FRY macroeconomic policies divide into four macroeconomic regions: Central Serbia, Vojvodina, Montenegro and Kosovo and Metohija. Also, it should be borne in mind that the Federal Republic of Yugoslavia was facing an impaired economic structure, which needed to be reorganized urgently to meet the needs of the new state. Regional differences in this period were very pronounced, however, with the inadequate actions of economic policy makers of the period, they were not mitigated.
ECONOMICS
131
After 2000, the relative reintegration of the FRY into international flows occurs, which, on the one hand, allows for accelerated economic development, while on the other hand, it begins intensively with the process of structural transformation, privatization and, ultimately, violent deindustrialization. which, in the future, proved to be disastrous for the economy of the Republic of Serbia.On February 4, 2003, the Federal Republic of Yugoslavia changed its name to Serbia and Montenegro. These changes were not only about the name of the state, but with the change of the entire political system, the basis for complete independence of the two countries was created, which happened by the separation of Montenegro in a referendum on May 21, 2006.By separating Montenegro from Serbia, the independent Republic of Serbia is restored, to the extent that it is still current. The Republic of Serbia is again confronted with a broken economic structure, as well as with destabilization in Kosovo and Metohija, culminating in the unilateral declaration of Kosovo’s independence on February 17, 2008. Since then, although it has not recognized Kosovo’s independence, the Republic of Serbia does not have complete control over the socio-political and therefore economic life in the territory of the Kosovo and Metohija regions.All these problems have further intensified the already existing economic problems, and thus the problems of uneven regional development, which are current and in the present conditions.
2. REGIONAL DEVELOPMENT OF THE REPUBLIC OF SERBIA IN MODERN CONDITIONS
Today, almost twenty years after the start of the process of structural transformation and privatization, none of these processes has been completed, the structure of the economy of the Republic of Serbia is distorted and almost completely left to spontaneous formation, while the problems of regional development and demographic flows are greater than ever.It can be noted that the Republic of Serbia has not recorded a sufficiently long period of stability, strategic planning and management of regional development, necessary to overcome the decades-old regional differences. On the contrary, the formulation and implementation of economic policy in the Republic of Serbia depends to a large extent on political processes, and thus, with every change of government, there is a change in the economic and thus regional policy of our country.All of the above contributed to the current situation in the economy of the Republic of Serbia, characterized by one of the most pronounced regional differences in Europe, extremely unfavorable demographic flows, devastated domestic economy and so on.The Republic of Serbia has an area of 88 499 km2, it is divided into five statistical regions, the largest of which is Sumadija and Western Serbia with an area of 26 493 km2, and the smallest Belgrade region with an area of 3 234 km2.However, although territorially the smallest, the Belgrade Region has the highest investment rate and a constant inflow of population, making it the most developed region in the administrative, political and economic center, while, paradoxically, with the decrease in the level of development of the region, investments in the region are also declining.The population of the Republic of Serbia after the First World War has been steadily increasing, while all population structures have been developing, however, in recent years there have been tectonic changes in the number and structure of the population, whose analysis has led to worrying data.The Republic of Serbia has a population of 6,982,604 (-5.5% compared to last year). 1 Comparing this with the 2002 population of 7,498,001, we can conclude that the Republic of Serbia has lost about 515,397 inhabitants in seventeen years.Numerous factors have contributed to the dramatic decline in population, but the two most influential factors are:
1 Estimation of the Statistical Office of the Republic of Serbia for 2018

ECONOMICS
132
(1). negative natural increase (-37,700) 2 i(2). the phenomenon of emigration of a large population, most commonly the highly educated known as the “brain drain”.In the contemporary conditions in the Republic of Serbia, the phenomenon of migratory movements in the south - north direction, accompanied by the apparent emptying of the southern and southeastern parts of our country, is one of the basic developmental and existential problems, the consequences of which most citizens of the Republic of Serbia suffer, whose multiplication will be negative. effect to suffer future generations.Negative migratory movements in the Republic of Serbia can be broken through two separate, but at the same time driven processes. The first, as mentioned above, refers to intra-country migration in the south-north relation, while the second refers to externally oriented migratory movements, most often to developed countries.Unfavorable demographic trends do not represent the cause but the consequence resulting from the pronounced regional differences in the Republic of Serbia. The regional differences in our country are one of the biggest in Europe. The ratio between the most developed and underdeveloped administrative district is 7: 1, and the ratio between the most developed and underdeveloped municipality is even 15: 1. (Regional Development Strategy of the Republic of Serbia for the period 2007-2012).The Belgrade region, as the most developed one, participates in the creation of national gross domestic product with 40.4%, while the region of South and Southeast Serbia participates with 13.8%3. Analyzing the participation of the regions in the creation of national GDP in the period from 2009 to 2019, it can be noticed that the Belgrade region has an increasing participation rate, while other regions in the Republic of Serbia are falling.These data just confirm the paradoxical thesis that the most developed regions in the Republic of Serbia are becoming more developed, while the underdeveloped are left to the spontaneous operation of the market and become even more underdeveloped.In the future, such trends could seriously endanger the survival of the people in the interior of our country, and their gradual emigration and the territorial integrity of the Republic of Serbia.However, if we look at the structure of the economy, we can notice numerous mismatches and regional-economic anomalies resulting from, almost completely, the absence of a strategic aspect in planning economic and, consequently, regional development.Analyzing personal consumption data by region, we see that food and housing expenditure is dominant in all regions. However, we can observe that expenditure on health, education, recreation and culture and clothing and footwear are declining in proportion to the development of the region. On the other hand, we can see a markedly higher percentage of income allocated to alcoholic beverages and tobacco in underdeveloped regions.It should be borne in mind that in the first quarter of 2019 the average monthly income per household amounted to RSD 65,872, while the expenditures for personal consumption amounted to RSD 66,064. 4The status of regional development in the Republic of Serbia is as follows. Out of 174 local self-government units, 41 municipalities have a level of development of 60% to 80% of the national average, while 46 municipalities belong to devastated areas with a level of development below 50% of the national average. Most undeveloped municipalities are located in the regions of southern and southeastern Serbia. (Manasijevic, 2018)According to the Statistical Office of the Republic of Serbia, such trends are present in other areas, so if we look at the number of households that own a computer, we will again notice significant differences between the Belgrade region, where 80% of families own a computer, while, for example,
2 Statistical Office of the Republic of Serbia - Statistical Yearbook 2018. 3 Statistical Office of the Republic of Serbia - Regional Gross Domestic Product from 2009 to 2019.4 Statistical Office of the Republic of Serbia - Household Income and Consumption in the Republic of Serbia, second quarter of 2019.

ECONOMICS
133
this percentage in the region of South and Southeast Serbia 63.3%.5Similarly, if we look at the value of construction works in the Republic of Serbia by region, we can see that the Belgrade region and Vojvodina account for 79.8%, while the region of South and Southeast Serbia accounts for only 17.3%. On the other hand, the number of persons connected to the water supply system is the smallest in the region of South and Southeastern Serbia - 48.3%, while in the Vojvodina region this percentage is 97.3%.6If we look at the totals of most of these indicators for the entire territory of the Republic of Serbia, we can see that they are constantly increasing. However, when we look at the values of the same indicators from the perspective of statistical regions, we can conclude that regional differences are also constantly increasing.These data represent a very relevant indicator of the development of certain regions, but also of the standard of living of the people who exist in those regions. Although this data is getting worse from year to year and regional differences are increasing, there is no indication that the aforementioned trend will stop and change for the better in the coming period.When it comes to the causes that have led to an increase in regional disparities, it is clear that the primary place must be given to the volume and structure of investments. “Insufficient investments and their unilateral structure could not have led to changes in the economic structure of the production of underdeveloped regions” (Rosić, 1977).If we look at investments in fixed assets by regions in the Republic of Serbia, we will come to a paradoxical conclusion. The more developed regions in the Republic of Serbia have the highest rate of investment, while with the decline in the development of the regions, the investments in the same decrease. However, dominant investments in fixed assets can be observed in the Belgrade region.Conducting such a regional development policy will lead to an increase in regional disparities in the Republic of Serbia, which will further deepen demographic, social and other social problems, all of which will result in the complete demographic and economic emptying of these territories in the future.
3. THE IMPORTANCE OF THE VILLAGES FOR THE REGIONAL DEVELOPMENT OF THE REPUBLIC OF SERBIA
The importance of a village in the economic life of a country is indisputable. During the historical development of a country, the basis for industrialization was almost always made up of a strong agriculture sector (food production needed for the workforce) and a strong village.Currently, the position of villages in the Republic of Serbia is in jeopardy. However, despite the importance that agricultural production definitely has for the entire economy, there has been a trend of rural depopulation in the Republic of Serbia for many years. Every fourth village in the Republic of Serbia is in the process of disappearing demographic population and has fewer than 100 inhabitants. (Manasijevic, 2018, p. 5). If we look at the villages by regions in the Republic of Serbia, we can conclude that the most endangered ones are located mainly in the mountainous areas in the south and southeast of our country.The analysis of the situation shows that if this trend continues, in the next ten years, most of these villages will be completely empty. Considering the high unemployment rate in the overall labor market, as well as our villages abound in natural resources that represent a comparative advantage of the Republic of Serbia, we are in a paradoxical situation.Exports of goods and services have been retaining the upward trend for years, which stood at 10.8% for the period from January to August 2019, based on the growth of exports of services, products of the manufacturing industry and agriculture. Rural landscapes provide the basis for all
5 Statistical Office of the Republic of Serbia - Regions in the Republic of Serbia in 2018. 6 Statistical Office of the Republic of Serbia - Regions in the Republic of Serbia in 2018.

ECONOMICS
134
three segments of this growth trend. Services in the field of agriculture can be based on the entire range of rural areas, primarily rural tourism, hospitality and other services offered by agricultural producers. A key segment for export is the tourism supply of these areas.Manufacturing is based on the processing of produced and exploited raw materials. Most of these raw materials are produced on agricultural holdings and in agricultural enterprises, which are the dominant form of organizing production activities in rural areas.The importance of agriculture’s participation in the balance of payments is evidenced by the fact that the value of agricultural exports in 2018 amounted to $ 3,364.2 million and that the surplus in the trade balance of payments amounted to $ 1,338.1 million. Considering that most of the exports are raw products whose value could be multiplied by processing, investments in this industry are imperative.Considering the fact that we live in a time when knowledge is a key resource, education and respect for best practice countries is key to further progress and achieve prosperity in agriculture, especially organic. However, there are many problems that are slowing down and hampering agricultural reform.One of the additional problems that hinders the development of agriculture is the fragmentation of farm holdings. Smallholder farmers are generally incapable of expanding estates and often of cultivating existing ones, which creates a risk of poverty for that part of the rural population. In order to provide modern machinery, lease or purchase agricultural land and cultivate land, large-scale basic capital is required, which, generally, cannot be provided by individual producers. Without subsidizing, unifying and favorable lending to farmers, as well as favorable macroeconomic conditions, their survival is uncertain.The village as a predominant food producer has a direct impact on the quality of life and nutrition of the population. Therefore, it is imperative to influence the development of organic production and to create a sustainable concept of village development. The area particularly suitable for the development of organic production is represented by mountainous regions.Mountainous regions cover about 20% of our country’s territory, 40% of which is suitable for arable land. Agricultural production is generally extensive with low application of mechanization and artificial fertilizers, chemical means of protection and without the influence of intensive (conventional) agriculture. The plots are generally small and have a variety of rows. (Kovacevic, Oljača, 2005). The land in these parts is generally of inferior quality and has a large share of arable land, which represents an excellent, accessible potential for organic production and agriculture.As 30% of the working age population lives in these parts, producers will have no problem with labor shortages. Therefore, we conclude that there is exceptional potential for organic production, that there is a surplus of vacant land and the necessary manpower. Rural tourism is of particular importance as the second segment. Rural tourism is a form of tourism where tourists reside in rural areas and where they are offered other services besides accommodation and food. Service providers are most often represented by agricultural producers who, in addition to their primary occupation, provide tourist services as a secondary activity.By making better use of excess housing and allowing access to rural amenities, producers can reap additional economic benefits. Through the realization of these positive effects, the well-being of the rural population is directly increased and unemployment is reduced. This can also have a positive effect on the negative migratory movements from village to town due to adverse economic conditions and lack of jobs.The sale of agri-food products and the provision of tourism services on their own property is generally a significant motive for owners of farms to engage in this activity. By shortening the buy-sell process, by meeting the buyer and seller without a middleman and by realizing the product or service at the point of sale, consumers are sold fresh products and customized service with significantly lower transaction costs. Often farms engaged in providing tourist services cannot provide all the necessary resources for an adequate offer to tourists, which gives other farmers from

ECONOMICS
135
the surrounding area a chance to market their products.Rural tourism also solves the problem of employment, especially of the female working age population in the countryside, which has fewer job opportunities in labor intensive physical jobs. The female population is usually in demand for the jobs of receiving, housing and catering for tourists.The development of rural tourism has the effect of revitalizing estates and strengthening the material basis of rural households, increasing the standard of living and influencing the development of the entire rural community. Tourism, as a secondary activity in rural areas, gives farmers the opportunity to earn more. This improves living conditions, raises the level of culture and education in underdeveloped areas. All these have positive implications for reducing the economic and social disparities between rural and urban communities.Based on all the above, it can be concluded that the role of villages in the process of achieving the goals of more balanced regional development is extremely important. However, if the aforementioned trend of demographic discharging of villages continues, it will be too late to implement regional policy measures and instruments - the villages will be completely empty. Namely, these trends introduce the economy of the Republic of Serbia into a kind of vicious circle, where as a consequence of uneven regional development unfavorable demographic flows occur, which later represent a barrier to the implementation of measures and instruments of regional policy. However, it should be borne in mind that if villages in the periphery of the Republic of Serbia become demographically empty, this opens up space for the settlement of people from the surrounding countries, which can ultimately endanger the territorial integrity of our country.However, in modern conditions, with the use of new, digital technologies, the space for revitalization of a number of villages in the Republic of Serbia opens. Namely, the current trend in the countries of the West is the exact opposite of our country. Given the increasing number of jobs that can be done through digital technology, many jobs are no longer strictly site-specific. This allows people from mostly polluted cities to move their business activities to villages where they naturally need working conditions (digital technologies). This is exactly where the so-called rustic approach that was implemented in the Republic of Serbia in the village of Vrmdža comes to the fore.
4. VRMDZA RURBAN ACCESS MODEL FOR VILLAGE REVITALIZATION
Vrmdža is located in the Republic of Serbia in the Zajecar Administrative District, on the territory of Sokobanja Municipality. According to the latest census (2011), this place has 497 inhabitants. Considering the positive tendencies present in this village, it was taken as a representative example to conduct research and identify the implications of positive trends.The village itself has a lot of tourist potential. As one of the oldest settlements in this region, Vrmdža is full of historical sites. It is first mentioned in written documents in the 3rd century n. e. In the center of the village is Latin - a town, a Roman fort whose purpose, during that period, was to defend the imperial road that bound the Middle and Middle East. In the 6th century, the city was rebuilt to protect Byzantium from invasion by Slovenian tribes. Later the city was mentioned in the 14th century as a fortified habitat for wealthy landlords who, at that time, traded with merchants from Dubrovnik.Although there is a trend of depopulation in this place, with more than 1,500 inhabitants living in the post-World War II period, there have been positive trends over the last ten years that have slowed this trend and are threatening to change its course in the future. This is supported by the fact that in the last ten years over 35 houses and plots have been purchased in this place. According to the 2011 census report, the village of Vrmdža had 497 inhabitants. Today, it is estimated that the village lives Vrmdža is located in the Republic of Serbia in the Zajecak Administrative District, on the territory of Sokobanja Municipality. According to the latest census (2011), this place has 497 inhabitants.

Considering the positive tendencies present in this village, it was taken as a representative example to conduct research and identify the implications of positive trends.Although there is a trend of depopulation in this place, with more than 1,500 inhabitants living in the post-World War II period, there have been positive trends over the last ten years that have slowed this trend and are threatening to change its course in the future. This is supported by the fact that in the last ten years over 35 houses and plots have been purchased in this place. According to the 2011 census report, the village of Vrmdža had 497 inhabitants. Today, it is estimated that the village lives about 580 inhabitants.
Source: Statistical Office of the Republic of Serbia - Statistical Yearbook and Author’s calcutation Based on Field Surveys.
Opportunities to engage in a variety of activities and the support provided by the Rural Hub attract new residents to this place. The new residents are mostly young couples who come from cities in Serbia, but also from countries abroad. Considering the age structure of the people who move to Vrmdža village, it is expected that the process of demographic growth will continue in the coming period.The settlement of the new population is influenced by the existence of numerous natural beauties, agricultural and tourist potentials, as well as the establishment of the Rural CUB. The Rural Hub is a hub for social local entrepreneurship with the idea to develop a socially responsible idea and has been in existence since 2010.The Hub’s business alone is based on three pillars of work: (1) Rural development and village revival, (2) Eco village, and (3) Domestic handicraft.Rural Hub works to encourage and support the local community by using its products and services to preserve nature, traditions and family farms. The Hub is a coworking space accessible to individuals and organizations for learning, project implementation, teaming, and meeting. In addition, the Rural Hub is also concerned with the development of the local community through the development of products and services and the networking of locals, all with the aim of encouraging small family businesses and preventing migration from the countryside, especially when it comes to the young population.The Center for Socially Responsible Entrepreneurship - CDOP was established as an organization that will bring positive effects to rural development. The vision of this center is to be an incubator for creating and developing socially responsible ideas that enhance the quality of life. In cooperation with the CDOP and the Vrmdža local community, a manual called “Eco Village - Model for Village Revitalization” was created, covering organic food production, eco-construction, energy supply systems, good economy with social entrepreneurship, eco-tourism, women’s entrepreneurship and other.One of the prominent projects that the Hub has implemented is the creation of an interactive map “Through Vrmdzha and Centuries”, which is a digital assistant to visit and get acquainted with this

ECONOMICS
137
village, its sights and history. The project was realized with the cooperation of locals, students and experts. The interactive map is also available as a mobile app and can be found on the Google Play Store. It is also available for offline use. As such, it makes access to the village easier and plays the role of a kind of digital travel guide.Vrmdža village is famous for eco tourism. It is close to numerous tourist destinations. The village itself has a view of the Rtanj mountain at the base of which. Also nearby is Vrmdzhan Lake, Sokobanja is 15 km from the village, Bovan Lake is 22 km away. This provides tourists with content that can complement a multi-day tourist stay in the village.Within the parish home of the village is a permanent exhibition of the museum, which displays old folk costumes, tools, utensils made of wood and pottery and a number of old objects of this area. The remains of the old church of Sv. Three, and there are several old buildings dating from the late eighteenth and early nineteenth centuries.The accommodation offer is highlighted on the website www.soko-banja-smestaj.com, which includes the accommodation of the entire municipality. The site offers offers in 7 different languages, which neutralizes language barriers to inform and plan your stay in the area.During the year, there are more cultural and tourist events in Vrmdza that bring together a large number of tourists. And in more detail, interested visitors can access the website on the village’s website www.vrmdza.org.rs.In the village itself, the so-called “Rurban” approach is promoted and implemented, which represents the fusion of new technology with the traditional one. With this approach, locals and newcomers in their lifestyles and businesses strike a balance between technology and tradition. By combining urban and rural heritage and knowledge, traditional and contemporary knowledge and technology, younger and older generations, those from the countryside and those from the cities, positive results are achieved in promoting rural tuzism, empowering the rural population for employment and more.
CONCLUSION
Problems of uneven regional development and demographic trends present in the Republic of Serbia for decades. Their study has been addressed by a large number of researchers, organizations, and institutions. However, over time, problems of regional development and adverse demographic trends are becoming more pressing, which opens the door for new research. Bearing in mind the data analyzed above, we can conclude that in order to achieve the goals of more balanced regional development of the Republic of Serbia, it is necessary to create a long-term regional development strategy, limited in time, with clearly defined goals, measures and instruments of regional policy necessary to achieve them.In order for the long-term goals of regional development to be achieved, it is necessary for the situation in the economy of the Republic of Serbia to be stable, with the continued achievement of a relatively high rate of economic growth. The basic goals of regional development of the Republic of Serbia are: accelerated economic development of all areas, with an emphasis on underdeveloped regions, long-term sustainable development, increase of regional competitiveness, reduction of regional inequalities and poverty, halting of unfavorable demographic flows and continuation of the process of decentralization.The achieved level of development in the Republic of Serbia, as well as contemporary turbulent conditions, require detailed analysis and then radical planned changes in the vertical (branch) and horizontal (regional) economic structure. It is necessary to start the analysis of the situation in the economy of the Republic of Serbia from individual municipalities, through districts, regions, to the economy of our country as a whole. Based on the potential of certain municipalities, districts and regions, it is necessary to determine the activity and branch structure that will best exist in a particular area (region), and stimulate it in a planned manner. It is during this analysis that
ECONOMICS
138
the potentials of villages in which it is possible to apply a model of digital village transformation modeled on the village of Vrmdža need to be specifically analyzed. Thus, with the use of modern digital technologies, the village of Vrmdža managed to stop the depopulation process and then reverse negative demographic flows (beginning of new population migration) in the conditions when most villages of the similar type in the Republic of Serbia disappear. The purpose of this descriptive analysis is to point out measures and instruments that can be applied in other villages in the Republic of Serbia, for the same purpose.After the analysis, it is necessary to strategically formulate the measures and instruments of regional policy that are needed for the adequate implementation of the process of digital transformation of villages in the Republic of Serbia. However, the process of digital transformation of villages cannot be implemented without the strong role of the state, both in the formulation of measures and instruments and in the process of implementation. Although in modern conditions of a market economy guided by neo-liberal doctrine, the influence of the state on economic life is minimized, in our conditions timely, targeted and adequate state intervention is necessary to achieve the goals of long-term regional development of the Republic of Serbia.The role of the state is especially important in the process of long-term planning of economic development. Long-term planning of economic and, therefore, regional development in modern conditions is imperative. Bearing this in mind, we can conclude that in the shortest period the creation of a long-term strategy of economic and regional development must be started, which will take into account the potentials available to the economy of the Republic of Serbia, and then define ways for their optimal utilization.
REFERENCES
[1]Manasijević, A. (2018): Demografski tokovi u Republici Srbiji kao posledica regionalnih dispariteta. Zbornik studentskih radova i projekata 1, strana 5-10., Niš: Ekonomski fakultet.[2] Čobeljić, N. (1974): Privreda Jugoslavije, knjiga druga, Beograd: Savremena administracija.[3]Manasijević, A. (2018): Perspektive regionalnog razvoja republike Srbije. Izazovi i perspektive savremene ekonomije i menadžmenta, Kragujevac: Ekonomski fakultet.[4]Aranđelović, Z., Gligorijević, Ž., (2010): Regionalna ekonomija, Niš: SVEN.[5] Rosić, I., Gligorijević, Ž., (2001): Regionalni razvoj Jugoslavije, Niš: Ekonomski fakultet.Strategija regionalnog razvoja Republike Srbije za period od 2007. do 2012. godine, Beograd: Republički zavod za razvoj.[6] Procena broja stanovnika za 2019. godinu. Beograd: Republički zavod za statistiku Srbije.[7]Statistički godišnjak 2018. godine. Beograd: Republički zavod za statistiku Srbije.[8]Regionalni bruto domaći proizvod od 2009. do 2019. godine. Beograd: Republički zavod za statistiku Srbije.[9]Prihodi i potrošnja domaćinstava u Republici Srbiji drugi kvartal 2019. godine. Beograd: Republički zavod za statistiku Srbije.[10]Regioni u Republici Srbiji 2018. godine. Beograd: Republički zavod za statistiku Srbije.[11]Regioni u Republici Srbiji 2017. godine. Beograd: Republički zavod za statistiku Srbije.[12]Rosić, I. (1979): Regionalna ekonomika Jugoslavije. Beograd: Naučna Knjiga.[13]Kovačević D., Oljača S. (2005): Organska poljoprivredna proizvodnja, strana 261-301, Zemun: Poljoprivredni fakultet.[14]Gligorijević, Ž. (2018): Ogledi o regionalnom razvoju.Niš: Ekonomski fakultet.[15]Milojković, M. (2019): Inovacije u poljoprivredi i regionalni razvoj Republike Srbije. Regionalni razvoj i demografski tokovi zbornik studentskih radova. Niš: Ekonomski fakultet.[16]http://cdop.rs/[17]https://ruralhub.rs/ [18]https://www.nbs.rs/internet/latinica/18/18_3/prezentacija_invest.pdf

139
Volume 7, No.2 2019ISSN 2303-5005
THE DIGITAL TRANSFORMATION OF MARKETING:IMPACT ON MARKETING PRACTICE & MARKETS
Tom Gillpatrick1
ABSTRACT
Digital technology technologies and business practices are expected to radically transform the competitive landscape and society. Central to changing business practices is how digital technologies are transforming the practice of marketing which in turn is transforming the nature of markets globally. This paper, guided by the literature concerning the wave of digital disruption brought about by new technology, changes in consumer demand and new forms of business competition discusses industry level and macroeconomic impact of the digital transformation of marketing. The drivers of the digital transformation in marketing, the critical role of understanding the consumer value chain relative to marketing practice and the impact of changing business practices on the larger economy. A new model developed by (Teixeira, 2019) to assess consumer demand is described as a marketing practice innovation that can be used to gain new insights for innovation and marketing. These innovations in gaining market insights and in marketing strategies are discussed regarding implications for industry and macroeconomic policy. The authors call for calls for further research using this methodology to better understand how digital disruption is likely to impact firm competitiveness and the nature of larger global economy.
JEL: N30; M31, O10, E20
Review Article doi: 10.2478/eoik-2019-0023 UDK: 004.738.5:658.8
date of sending to review: 12.12.2019.
1Portland State University, School of Business, USA
Keywords:Industry 4.0, Digital Disruption, Digital Marketing, Trends in Consumer Behavior, Macroeconomics .
date of paper receipt:09.12.2019.
date of review receipt:19.12.2019.

ECONOMICS
140
INTRODUCTION
Peter Drucker famously stated, that, “There is only one valid definition of business purpose: to create a customer… and Because the purpose of business is to create a customer, the business enterprise has two— and only two basic functions: marketing and innovation. Marketing and innovation produce results; all the rest are costs.” (Drucker and Maciariello, 2008, p. 30). An innovation has been defined as fresh idea that creates customer value, a fresh idea, that is widely accepted by the marketplace (Vaitheeswaran, Vijay, 2007). Economists generally believe that innovation is a primary driver for economic growth. Innovation can come from new ideas or technologies that leads to new products and/or business processes. While often studied separately marketing and innovation are a key factor for both business and policy makers in driving economic growth.Researchers have reported (Teixeira, 2019) that new ways to study consumer buying processes given the digital revolution are critically important to achieving innovation success. At the heart of any business strategy is a plan to create, deliver and capture customer value. Marketing role within this process is to create customer value through the assessment of target customer needs, configuration of product/service offerings that are motivating to target customers, delivering those product/ service offerings using distribution and promotional channels and finding a way to capture customer value through innovative pricing strategies. An example, of an innovative pricing strategy was Bill Gates decision to license PC Operating System SW to individual users rather than to charge the computer manufacturer (IBM) a set price for its development and inclusion in its PC offering. (The Digital Marketing Institute, 2019) reports, “When it comes to marketing, going digital has had massive consequences. Now properties of digital media such as more accurate metrics, combined with interactivity, have created whole new marketing opportunities. The exchange that can happen on social media, and even directly on ads, changes everything. With live ads, like live streams, consumers can be on social media and watch an influencer discuss a product. Now, instead of just watching a social influencer, viewers can interact by making comments, giving suggestions, and even getting responses back during that live stream. There is a level of engagement and interaction in 2019 that simply wasn’t possible before digital transformation, and it changes the scope and nature of how marketers can approach their targets.”Increasingly a key component to both innovation and marketing is the digital transformation of our economy. The digital transformation of business is having a profound effect on marketing practices with far reaching impact on both micro and macro-economic levels. At the microeconomic level the digital transformation of marketing affects all aspects of the domain of marketing including product/service configuration; pricing; distribution and promotion activities. It involves nothing less than a complete reinvention of how firms innovate and create value in their “Go-to-market” strategies. At the macroeconomic level the digital transformation in marketing and the resultant marketing strategies impact national competitiveness, labor markets, innovation, antitrust, taxation among other factors. The objective of this paper is to review the literature on trends in the digital economy, marketing and marketing practices and discuss the effects of a transformed practice of marketing on the competitive landscape.
1. [GROWTH OF THE DIGITAL ECONOMY
The definition of what constitutes the digital economy has evolved over time, this research uses a definition proposed in a recent OECD report by (Bukht and Heeks, 2017, p17) “That part of economic output derived solely or primarily from digital technologies with a business model based on digital goods or services.” To this definition it has been suggested, that inclusion of broader trends, such as platformization, digital data and e-commerce, is needed for making policy evaluations. Exhibit 1

ECONOMICS
141
below depicts a broad definition of the scope of the digital economy that is reported in the (OECD, 2017) report. (Foote, 2019) reports that, “ the digital economy grew 9.9 percent annually over this 20-year period—4.3 times faster than the overall economy—and represented 6.9 percent of U.S. GDP as of 2017.” How broad the measures used to estimate the size digital economy is important, when using broad measures, (UNCTAD 2019) the digital economy has been estimated to be up to 15.5% of U.S. GDP.
EXHIBIT ONE: SCOPE OF THE DIGITAL ECONOMY (UNCTAD, 2017)That same reports notes that in 1992 internet data flows were about 100 Gigabytes per day, where it is forecasted these flows will be about 150,700 Gigabytes per second in 2022. Much of the growth of the digital economy is being fueled by new technologies such blockchain, artificial intelligence (AI) and data analytics, 3D printing, internet of things (IoT), 5G mobile, cloud computing, automation & robotics, among others. The value of global e-commerce has been estimated to be approximately 36% of global GDP in 2017, which is a 13% increase over the prior year (UNCTAD, 2017). The rapid growth globally of smart mobile phones and interconnectivity is also accelerating the growth and impact of the digital economy. (Rifkin, 2015) notes that in 2007 there 10 million sensors connected to the web, by 2013 that number had grown to 3.5 billion and it is estimated by 2030 the number of web enabled sensors will exceed 100 trillion. However, growth in investment into the digital economy is heavily concentrated in the USA and China which together comprise over 90% of the market valuation of the top 70 platform companies globally. The EU is third with about a 4% share of these top companies.(Straub, 2019) notes that, “According to a 2019 World Economic Forum report, excitement over digitally enabled ecosystems is on the rise. While most of the focus has been on macroeconomic implications (for example, McKinsey research speculates that by 2025 over 30% of global economic activity could be mediated by digital platforms).” Additionally, he reports a McKinsey study that sees traditional industry clusters and value chain collapsing into a much smaller set of trillion dollar platform ecosystems that will impact all levels of the global economy.Over time economic value has migrated away from physical products towards services as measured by sector impact on GDP. This is particularly true for more the developed economies, services’ value added accounted for 74 percent of GDP in high-income countries in 2015, up from 69 percent in 1997. The growth rate of the service sector was even higher in less developed countries raising to 57 percent from 47 percent in that same time period. In the USA approximately 79 percent of economic value measured by GDP was linked to the service sector in 2017. Within the services

ECONOMICS
142
sector, the digital economy has grown an even faster rate. Additionally, some experts suggest the size of the digital economy may be significantly underestimated using standard economic measures (OECD, 2019). For physical products there has been a trend away from value coming from a physical product component to a greater percent of the perceived value of products coming from bundled services and intangible digital aspects. Some have referred to this process as the “dematerialization of value.” (UN News, 2017) finds “that intangible capital accounted, on average, for 30.4 percent of the total value of manufactured goods sold throughout 2000-2014. Overall, income from intangibles increased by 75 per cent from 2000 to 2014 in real terms, amounting to $5.9 trillion in 2014.” This digital transformation of marketing is central to the growth and development of world economies. Digital technologies are also an important element in supporting the “servitization” of manufacturing processes, where manufacturing and services increasingly overlap (UNCTAD, 2019, p.42). The ability of many digital services to easily scale given low marginal costs is also an important factor in the growth of dynamics of digital businesses.
1.1. INNOVATION AND DRIVERS OF CHANGE IN MARKETING
This new wave of digital disruption has been described as the third wave of digital disruption to impact our economy and many believe the effects will be much more significant than what industry has experienced to-date (Teixeira 2019). (Moeller et al., 2018) argue that, “Although many practices, products, and services have evolved…few enterprises have had their core businesses disrupted. But this is about to change.” The coming wave of digital disruption brought about by this third wave is expected to have a much more fundamental impact because of the degree of interconnectivity it will bring among new technologies. The third wave of disruption is happening today and is transforming firms marketing and go-to-market strategies with wide range of economic effects. (Kagermann, 2015) states that, “Digitization—the continuing convergence of the real and the virtual worlds will be the main driver of innovation and change in all sectors of our economy.” See Exhibit Two, for a description of these three waves of digital disruption affecting industry (Teixeira, 2019).
1. “Unbundling, the first wave of digital disruption, began in about 1995. Newspapers, once a source for articles, classifieds, and restaurant reviews, saw readers slowly drift away to Google, Craigslist, and Yelp. “Start-ups at the time decided to unbundle the newspaper,” Teixeira said. “The product was unbundled, and the start-ups were offering their customers one part of the product.”The second wave, disintermediation, began in the early 2000s and affected products that were a combination of digital and physical. Instead of going to a travel agent to book hotels, flights, and tour activities, consumers took the process into their own hands. “You, the consumer of travel services, started going directly to the providers,” he said.Ten years later, is seems the third wave of disruption arrived. Decoupling is big, Teixeira explained, because it affects each step of the consumer’s purchasing process: evaluating, choosing, purchasing, and consuming.”
EXHIBIT TWO: WAVES OF DIGITAL DISRUPTION (TEIXEIRA 2019)In looking at common threads across these waves of change, there are three key factors or drivers of change that have emerged. First, is the influence of new technology for communication, transportation & industry infrastructure stemming from the digitalization of business processes. (Deloitte, 2017) in its Global Powers of Retailing report also found these factors as the key drivers of change in global marketing & retailing. These new technologies have been characterized by increasing productivity of production and distribution and increased interconnections between

ECONOMICS
143
technologies leading to lower costs and increased consumer convenience.The second driver of innovation has been the development of new forms of competition that have evolved to offer consumers better value. These new forms of retail enterprises include a growing myriad of online options with a growing role of Omni-channel distribution. For example, (Rigby, 2011) describes Omni-channel in the December issue of the Harvard Business Review, entitled, “The Future of Shopping,” which described Omni-channel distribution as a system where, “retailers will be able to interact with customers through countless channels, such as websites, physical stores, kiosks, direct mail, catalogs, call centers, social media, mobile devices, gaming consoles, televisions, networked appliances, home services, and more.” Omni-channel relies on an integration on new technologies deployed in a manner to give consumer’s 24/7 access to products, information and communication. Online shopping which is currently about 10% of retail has been estimated to be about 40% by 2027, (World Economic Forum, 2017). Therefore, business capability is tightly linked to technological capabilities and the development of business models that have a new customer centric focus as opposed to a product centric focus. The third driver is manifested by changing consumer preferences. Consumer demand is conditioned by new technology, new competitive forms along with societal changes is evolving at a rapid pace. Here changing demographics and consumer values are key drivers of changing consumer preferences. Arguably, changes in consumer demand are the most important of these drivers of disruption. Teixeira (2019) notes that it’s not new technology or startups that causes market disruption, but that the real cause of disruption is changes in consumer demand. Technological inventions or new business models must be accepted by the market to become successful innovations. Thus, key to successful innovation is understanding the nature of demand and the preferences of consumers. The (World Economic Forum, 2017) conducted research on the future of retailing and concluded:“Consumers will be central to shaping the future direction of the industry. As their expectations around cost, choice, convenience, control and experience continue to climb, they will challenge the industry to keep up. For example, as AI is increasing deployed to enhance the customer service experience such AI assisted smart-speakers (Amazon Alexa and Google Home) or automated AI assisted customer service centers- it will be customer adoption of these technologies that will make or break the market success of each. At the same time, new and disruptive technologies will fundamentally impact the end-to-end industry value chain, benefitting both the industry and consumers.”The confluence of technology evolution leading to developments of AI/Data analytics, blockchain, three-dimensional printing (3D printing), the Internet of things (IoT), mobile technology, automation and robotics is fundamentally changing marketing practices regarding value creation, value delivery and value capture leading to the development of new business models and changes in consumer and broader macro-economic impact. Examples of how these technologies are having an impact in marketing practices include: co-creation of value between consumers and producers, the dematerialization of value in many products (the value-added component of digital content in cars, phones, etc.), omnichannel distribution and promotion strategies in delivering customer value and new value capture strategies that capture value by monetizing data and information obtained from social media, shopping behavior, etc. IBM provides an example of the IoT can be used to gather data to be used in marketing efforts in Exhibit Three below.

ECONOMICS
144
EXHIBIT THREE: RETAIL CHANGES COMING FROM THE IOT HTTPS://WWW.IBM.COM/BLOGS/INTERNET-OF-THINGS/IOT-TRANSFORMING-RETAIL-INDUSTRY/As shown in Exhibit Three above there are a plethora of new technologies that are expected to impact retailers and consumers. Among those technologies (Accenture and the World Economic Forum 2017) estimate that four will have the greatest impact on retailers:“Internet of Things will drive a high business value as it secures proprietary consumer data to create personalized experiences and delivers cost efficiencies in inventory-management. It will revolutionize the in-store experience for both consumers and organizations, providing unparalleled insights based on the data collected. Autonomous vehicles/drones will bring cost savings from automated long-haul trucking of goods and last-mile delivery. These developments will also increase utilization, make deliveries faster and improve road safety. Artificial Intelligence/machine learning can increase revenues through a deeper understanding of consumer behavior, while saving costs associated with supply chain optimization. In-store pricing and assortments will be optimized and, when combined with predictive recommendations, will clearly benefit consumers and the organization itself. Robotics will drive cost savings through operational efficiencies, primarily in warehousing and distribution. Software bots can also work faster to complete simple and repetitive tasks. Robotics will enable higher utilization, greater flexibility, improved accuracy and faster transaction times.”
1.2. INNOVATION IN MARKETING: ANALYZING CONSUMER DEMAND For new innovations in products, processes and business practices there must be consumer acceptance. The behavior of consumers and industrial buyers is critical for the success of an innovation. This necessitates a deep understanding of how buyers initiate, search, evaluate, select and experience market offerings and methods of marketing. One key innovation in marketing practice is how analysis is used to study the nature of demand. (Ungerman et al., 2018) define “marketing innovation as doing something fundamentally new with ideas, products, services, or technologies based on market-based ideas that stem from a variety of customer desires.” Thus, key to successful innovation leading to firm success and economic growth is an understanding of the nature of changing consumer demands.(Court et al., 2009) introduced a new conceptual model to study consumer decision making. They labeled this new model, “The consumer decision journey (CDJ).” Their conceptualization was in

ECONOMICS
145
response to a growing recognition that previous models) increasingly failed to capture what they described as, “all the touch points and key buying factors resulting from the explosion of product choices and digital channels, coupled with the emergence of an increasingly discerning, well-informed consumer.” See Exhibit Four: The Consumer Decision Journey. In the decade since it was introduced this model has been widely accepted both in academia and in industry. (Hamilton & Price, 2019); (Lemon & Verhoef, 2016). (Finneman & Elzinga, 2017) report that Mckinsey has developed a database of over 125,000 consumer decision journeys’ for over 350 products in over 30 different industries. They found the CDC model reflects a more complex reality of shifting choices, decision criteria, digital touchpoints important to consumers and key triggers. Its critical for brands to be in a consumers’ initial consideration set, provide digital touchpoints and information at the right moments and provide trust/quality experience with a product or service.Innovation in marketing also plays an increasingly important role in value creation in the economy. Value has migrated from physical assets to intangible assets among many corporate enterprises today. Marketing assets such as brand are growing as a percentage of company market value, reflecting the role that marketing has in a world that is becoming more customer centric as opposed to product centric. Indeed, when looking at the personal wealth of the world’s most successful business-people such as Bill Gates and Jeff Bezos it appears the source of their success lies not in technical innovation but innovation in marketing. (Ungerman et al., 2018) studied the impact of marketing innovation and report that, “Business considers the greatest impact of innovative marketing in the context of Industry 4.0 to be the increase in enterprise competitiveness.” Key to marketing innovation is an understanding of how customers perceived value and how products and services are adopted into their lives. These perceptions of value and lifestyle represent a moving target for marketers, and we need better processes to understand the needs of the market.The stages of the CDJ (Awareness, evaluation, choosing, purchasing and consuming/experiencing) provide a rich framework which to study consumer processes throughout their journey experience. Increasingly firms develop detailed maps of the CDJ for different target customers and look to match marketing efforts (touch points) to guide and reinforce consumer associations of a positive experience with a brand. Insights from a better understanding of CDJ processes can be used to enhance the ability of a marketer to strengthen its business model to create, deliver and capture customer value.
EXHIBIT FOUR: THE CONSUMER DECISION JOURNEY (CDJ) (MCKINSEY, 2009)

ECONOMICS
146
Recently, (Teixeira, 2019) has created an analytic process that builds on the framework of the CDJ that represents a marketing innovation by mapping the “consumer value chain (CVC).” Where the value chain model developed by (Porter, 1985) primarily targets a set of value creating activities of firms. This approach is focused on understanding the value chain of consumers. Today, insights gained from this approach provides insights that can be used to decouple the CVC and give marketers opportunities to create and capture customer value utilizing these tools of disruption. It is critical for firms today to understand where opportunities to decouple and recouple consumer value exist:“Unbundling, the first wave of digital disruption, began in about 1995. Newspapers, once a source for articles, classifieds, and restaurant reviews, saw readers slowly drift away to Google, Craigslist, and Yelp. “Start-ups at the time decided to unbundle the newspaper,” Teixeira said. “The product was unbundled, and the start-ups were offering their customers one part of the product.”The second wave, disintermediation, began in the early 2000s and affected products that were a combination of digital and physical. Instead of going to a travel agent to book hotels, flights, and tour activities, consumers took the process into their own hands. “You, the consumer of travel services, started going directly to the providers,” he said.Ten years later, is seems the third wave of disruption arrived. Decoupling is big, Teixeira explained, because it affects each step of the consumer’s purchasing process: evaluating, choosing, purchasing, and consuming” (Teixeira, 2019).Teixeira’s model maps all the activities a consumer engages in during the consumption process of the CDJ and assesses if those activities can be decoupled from each other. It is this decoupling of a consumer’s value chain that has provided firms utilizing new technology and business models the insights to disrupt incumbent firms and entire industries. An overview of this can be seen in Exhibit Five: A typical consumer’s value chain (CVC). Digital technologies have enabled new entrants in a market by unbundling, or decoupling and recoupling activities that create, delivery or capture consumer value in novel ways. Marketing value propositions that have previously bundled activities across the CDJ process, now face new competitors whose business models have decoupled two or more of those customer value chain activities and re-coupled those activities into their own new innovative business models. An example of this is shown in Exhibit Five, is where online retailers which target consumers who visit traditional bricks and mortar retailers (Best Buy), and use those stores as a showroom examining products, collecting information & sales advice, and then finally purchasing products online from the disruptor retailer such as Amazon. Showrooming has become a major competitive threat for many traditional retailers given the increasing consumer willingness to adapt their shopping behavior using digital tools that decouple the consumer value chain. Another example might be Uber business model, where it has decoupled the consumer’s value chain (CVC) focusing on making it easy for consumers to purchase and then utilize its ridesharing service. Amazon provides another example; research shows that in the U.S.A. today more than 50% of consumer product searches begin on Amazon. Retailers would be well served to study consumer value chains for opportunities to create, deliver and capture customer value thus remaining relevant for consumers.

ECONOMICS
147
EXHIBIT FIVE: A TYPICAL CONSUMERS VALUE CHAIN (CVC): Digital Disruption enables firms to Decouple Customer Value Delivery, (Teixeira, 2019)Retail examples of decoupling include, a woman walking the aisles of a Costco store holding her smartphone to scan the products on the shelf while she narrates prices and opportunities to buy to thousands of online shoppers in China. She is providing a shopping service that has decoupled Costco’s value proposition and recoupled it in a manner to provide value for consumers in China. How much value, this one woman has a million dollar per month business! Another example, is a retail company, also founded in Portland, Oregon called Hoopla Global which utilizes JD.com’s shopping platform. Hoopla Global represents American manufacturers of CPG products wanting to sell in China, it maintains an online retail store on JD.com and actively promotes these products in China using a digital influencer strategy and ships using a “virtual free trade zone” model which in China features no tariffs, no special labeling, and direct delivery to Chinese customers from this virtual free trade zone. Additionally, Hoopla Global has created a backend digital supply chain using block chain technology that allows its vendors to easily prepare and ship their products to this virtual free trade zone in China. It provides both demand-side and supply-side value to its customers. It has effectively decoupled CVC activities and recoupled them in a manner that provides greater customer value and greater operational efficiency. These are examples of how digital technology is transforming marketing and changing supply and demand dynamics around the world. This methodology has identified three types of decoupling:
Value-creating activity: hearing a song you like on the radio.Value-eroding activity: hearing a song you don’t like.Value-capturing activity: A promoted song or ad that the listener pays the station
The digital disruption largely comes from consumers adopting new technologies and new shopping behaviors from novel business models offered by both new market entrants and existing retailers with the foresight to reconfigure their business models in a customer centric manner. (Yohn, 2018) reports that a recent study among chief marketing officers (CMO’s) found that only 14% believe that their companies are acting in a customer centric manner and even fewer of their customers (11%) would describe them as customer centric. She argues that company culture is critical to achieving a customer centric business and describes a process for building a customer centric culture. To understand and unlock the customer value chain a customer centric as opposed to a product centric or a sales centric orientation is critically important. Amazon is often used as an example of a customer centric business whose organization structure and culture is designed around providing customer value. Managing with a customer-centric perspective, customers are viewed as a valuable firm asset and seeks to manage to maximize lifetime customer value.Technology has become an important tool in driving CVC decoupling and allowing firms to recouple value producing activities in novel ways. There are literally thousands of novel new

ECONOMICS
148
technologies that are vying to create value for marketers and their customers. These technology stretch across both the retailers and the customers value chains. Examples include robotics deployed both in the supply chain and consumer facing in stores and online, data analytic models that use big data and maching learning, smart sensors and displays throught the supply chain, AI deployed as management and customer interfacing tool. Key to whether these technologies can contribute value to consumer by ultimately lowering their costs or by improving the shopping experience. The Gartner group has developed a model that overviews new technologies and there stage of market acceptance, Exhibit Six, overviews technology adoption in retail.(Teixeira, 2019) identified five steps that disruptors take to decouple the consumer journey:Identify the consumption chain. Look at their customers to see what they’re doing to get these products.Look at the weak link. Where are customers satisfied with the activities? Identify the type of the adjacent activities. Are these value-creating, capturing, or eroding activities?Increase the force of specialization. Reducing the monetary the effort or the time cost for the customer.Anticipate the competitor response.”New entrants often enter the market and build share by lowering customer costs and providing customer convenience. New competitors like Bonobos and Warby Parker have offer customers value by providing convenience of in-home shopping, reducing shopper search costs and acquisition costs in the process. Disruptors often enter at the extremes of customer value perceptions by providing superior experiences or lower costs driving some traditional retailers to become, “stuck-in-the middle” as (Porter, 1985) would describe where their value propositions are diminished by passionate shoppers searching for lower costs or better service experience or both. These “stuck-in-the-middle” firms are disappearing from the competitive landscape at an increasing rate. An example is the struggles of the once might department stores such as Sears, Macy’s and JC Penny. In all cases the customer’s role in driving retail innovation through changing shopping behavior is critical. Following consumer trends has never been so important than it is today’s rapidly changing world of consumer preferences
EXHIBIT SIX: GARTNER GROUP HYPER CYCLE FOR NEW RETAIL TECHNOLOGIES (2014)https://www.gartner.com/en/documents/3883976Keeping up with consumer, technology and business model trends is a daunting task for marketers

ECONOMICS
149
today. (Teixeira, 2019) proposes a novel way to monitor changes in the consumer value chain. While there are hundreds of industry market classifications detailed in census data, he observes only seven of these account for most of the consumer consumption. Additionally, because of the size and prominence of these leading industry categories they impact most other industries as well. He believes that following current trends in these seven can provide an accurate barometer of how to prepare for future trends in consumer preferences and shopping behavior.What are these key consumer industries? He identifies them in terms of categories that that reflect the choices we make on how we live or lives. These include choices about where we live (housing and home goods), mobility (transportation), eating (food, drinks and preparation), what to wear (fashion, cosmetics and personal care), learning (education), entertainment (media, sports, electronics) and healthcare. In total, these seven categories make up 97% of consumption in America. He then uses U.S. Bureau of Labor Statistics data which has been collecting consumer data on how we consumer our time to determine an estimate of the amount of effort consumers expend each week in the seven consumption categories.
EXHIBIT SEVEN: BELOW, DESCRIBES HOW CONSUMERS SPEND THEIR DISCRETIONARY TIME AFTER SLEEPING AND WORKING. The biggest allocation of times goes into entertainment about 39% of discretionary time allocation. However, effort spent to acquire this time for entertainment is relatively small as seen in the Figure below. Where there is a relatively high amount of effort required relative to the time spent in a category may be an indicator of potential for disruption according to Teixeira. For example, there is a large amount of effort required for moving about (transportation) he argues that business models that reduce consumer efforts (consumer costs) here may offer high potential for disruption.
Note: % Effort spent sums to 100 percent and % total time sums to 100 percent. Source: Adapted from U.S. Bureau of Labor Statistics, darker bars represent
total time, lighter represent effort.
EXHIBIT SEVEN : RELATIVE AMOUNT OF TIME AND EFFORT SPENT IN MAJOR CONSUMER CONSUMPTION CATEGORIES (TEIXEIRA, 2019, P. 266).

ECONOMICS
150
2 MACRO ECONOMIC EFFECTS OF INNOVATIONS IN MARKETING The digital transformation of marketing not only effects the practices of individual companies and industries it has profound effects on the global macro-economic environment as well. The digital marketing strategies of using platform networks to reach target markets, reconfiguring value creating components of the product/service offering and innovative pricing has changed market dynamic not only within individual industries but across global markets as well. These macro- economic effects have been widely discussed in the literature and will be summarized in this section (UNCTAD, 2019). Potential impacts include; the number and type of jobs available, distribution of income and wealth leading to greater income inequality, increased concentration within industries across a wide range of markets leading to potential monopoly effects, slower economic growth from income redistribution and types of investments due to digital economy, impact on taxation and government revenues.In the previous section examples of the digital transformation of marketing were described in the context of basic marketing activities of value creation, value delivery and value capture as well as on competition with industries. But larger macro-economic effects exist that have far reaching implications for public policy. For example, in the previous section there were several examples of how retailers are adapting marketing practices given new digital technologies and business models. In America retailers are estimated to account for nearly 25% of employment and retailing accounts for nearly 31% of global GDP. Digital technologies are having a major impact today and will have a greater impact going forward on the level of employment and skills necessary in retailing. Today automation and robotics are routinely used in warehouses to enhance performance and reduce labor costs; increasingly stores around the world are reducing labor content in store as well, through automated checkouts, customer service, replenishment, etc. Back office operations in purchasing, marketing analytics and sales are also being automated or using extensive AI assist which lowers labor deployed in these operations. New retail forms like Amazon Go and others utilize far fewer workers in a store than is traditionally used. Indeed, Amazon currently uses far fewer people to generate sales revenue than traditional retail operations. In addition to the number of workers the adaptation of digital marketing will change the skills needed to perform effectively. Currently this is a problem and even more so among less developed countries.(UNCTAD, 2019, p. 96) reports that, “There are growing concerns that the increased use of various digital technologies will lead to job losses as human work is replaced by automation and AI.” While employment effects have been frequently studied most have focused on job losses and not job creation. Other global industries which have seen employment reductions due to digital transformation of marketing activities that include travel, transportation, advertising, customer service and broker/sales networks. The report further states, “Digitalization is increasingly affecting routine tasks that are performed not just by less skilled workers, but also by middle-skilled workers, leading to a hollowing out of the middle class. Moreover, the increasing concentration of digital platforms may weaken the bargaining power of workers.” This may be a factor which exacerbates growing income inequality which has both important political, social as well as economic impacts. (Stiglitz, 2016) and others have argued that growing income inequality is a threat to both economic growth and social wellbeing. Research from the (UNCTAD, 2019) found that growing digital markets may depress wages resulting in a lowering of consumer incomes across economies. Exhibit Eight below shows research an estimate of possible wealth redistribution due to digitization.

ECONOMICS
151
EXHIBIT EIGHT: GLOBAL WEALTH REDISTRIBUTION DUE TO DIGITIZATION (PETERSON, 2019)The use of digital platforms aligned as networks that connect supplier, producers, intermediaries and customers also has potential impacts on competition and the competitiveness of nations. Because of the “Network Effect” marketing strategies and business model platforms become more valuable and perhaps more efficient given a larger network of users. These platform networks rely on vast amounts of data to develop and become efficient. Indeed, the digital landscape is dominated by a relative low number of business platforms, such as Google, Facebook, Amazon, Alibaba, etc. These digital platforms help to comprise economic ecosystems that are becoming increasing concentrated. These platform ecosystems are often characterized by relatively high fixed cost structures and very low marginal cost structures which offers huge scale benefits to firms with large networks. Those firms can leverage their fixed cost in algorithms, s/w ,etc. to enter new markets (Dawson et al., 2016). The market value of the world’s top 70 platform companies is estimated in be over 90% concentrated in just two countries, China and the USA. In contrast, only about 4% of value of platform companies reside in the E.U. There are concerns that these concentrated digital platforms may constitute monopolies that potentially could restrict innovation, increase network pricing power, create barriers to entry, disadvantage developing nations and smaller countries and lead to concentrations of political power of the networks. Multi-sided digital platforms may give firms the ability to cross subsidize products/services in new markets using infrastructure developed for other markets with little to new marginal costs. This shared cost structure allows pricing that can substantially undercut rivals. Thus, the go-to-market strategies of these firms have impact at the macro-economic level as well as the level of competition between firms. Understanding consumer benefits and costs can help to predict the macro impact of these platform networks. Thus, increasing concentration of large platform networks may have adverse effects on global competitiveness. Exhibit Nine below presents a model of how supply and demand networks by be affected by the digital economy.

ECONOMICS
152
EXHIBIT NINE: DIGITIZATION IMPACTS GLOBAL SUPPLY AND DEMAND ACROSS INDUSTRIES. (DAWSON ET AL., 2016)
3. DISCUSSION
In reviewing the literature in marketing there is a consensus that marketing is entering an era of profound change where existing business models and consumer habits are being disrupted by new technology and new marketers using innovative marketing strategies. For example, (The World Economic Forum 2017) estimates that over the next decade that adaption of digital technologies could unlock nearly three trillion dollars in value to retailers over that decade due to increased consumer benefits and business cost savings. Of that total amount it estimates that the impact on consumers will comprise about 68% of the total benefits with the other 32% going to industry. The total amount of benefits is estimated to exceed two trillion dollar benefit to consumers over the next decade.However, these consumer benefits are likely to be unevenly shared. Digital transformation of markets has been linked to greater income inequality. Research shows that wage income may be depressed with digitization and benefits shared more narrowly among highly skilled workers and investors. A greater percentage of global income and wealth is increasing concentrated in the top rungs of the pyramid. Some research suggests that increasing income inequality has attenuated rates of economic growth (Stigletz, 2016).Marketing and business strategies leading to the creation of integrated “platform networks,” may also create winners and losers leading to increasing concentration and power held my a few very large organizations. For example, in China the two leading platform networks control most of the nation’s digital economic activity with networks that provide a wide range of digital services. Consumers have chosen to concentrate their use for convenience and the benefits of interconnected offerings. The larger these platform networks grow the powerful they become by offering users more connections, extracting useful information from vast troves of data and by offering lots of connections they increase the switching costs for users. These powerful digital platform ecosystems may foster monopoly effects of decreased innovation, reduced choice and bargaining power for buyers. “Companies like Apple, Tencent, and Google are blurring traditional industry definitions by spanning product categories and customer segments. Owners of such hyperscale platforms enjoy massive operating leverage from process automation, algorithms, and network effects created

ECONOMICS
153
by the interactions of hundreds of millions, billions, or more users, customers, and devices… .Hyperscale platforms also create new barriers to entry, such as the information barrier created by GE Healthcare’s platform, Centricity 360, which allows patients and third parties to collaborate in the cloud.”(Chui et al., 2015). “In 2017, companies spent around $21.3 billion through AI-related mergers and investments – 26 times more than in 2015. All the largest platforms have major infrastructural footprints which represent another high barrier to entry for competitors” (UNCTAD, 2019, p. 87) Along with new technology the marketing and entrepreneurial world is bubbling with new transformative business models that deploy new process and new technology to offer consumers greater value in their lives as well as to reduce retail costs. The merging of online and offline retail models with integration of technology using Omni-channel and another innovative business models will have profound impacts on which businesses thrive and which vanish from the competitive landscape. Increasingly firms are looking to decouple the consumer value chains by using shopping apps and digital technology that disrupt the business models of retail incumbents and provide value enhancements for shoppers. For example, Swiss watchmakers have been revamping distribution networks as consumers increasingly search for and buy products online.” Other examples of the digital evolution business were given the World Economic Forum report (2017) to impact three areas of retail most significantly. The customer experience, technology like AI/AR will enable a greater degree of personalization and there will be an increased focus instore on customer experience and as a showroom. A second trend will be a new era of consumer facing employees and technologies including the use of AI and greatly increased use of robots. One auto dealer we have worked with has moved its customer service operations to automated AI phone support and has received a much more positive customer response than with a human customer call center for customer service. Large platform digital businesses also can create some tax problems for governments. For example, because of the intangible nature of service and the vagueness of market boundaries most income earned by these providers is reported by subsidiaries in low tax locales. Taxes are not always paid in the localities and from the people that generated revenue. Developing economies are particularly hard hit, with an estimated $100 billion lost annually due to tax avoidance schemes by MNEs (UNCTAD, 2019, p95).Exhibit Ten below overviews examples of government policies areas that should be reviewed in a world transformed by digital marketing and changing supply and demand economics. These trends of new digital technologies and business models are pervasive and indeed game-changing both for businesses and for public policy makers.
EXHIBIT: SUGGESTIONS FOR POLICY IN RESPONSE TO DIGITAL TRANSFORMATION OF ECONOMY - UNCTAD, 2019

ECONOMICS
154
CONCLUSIONS
This paper reviews the literature on digital disruption, marketing and innovation and has identified that buyer behavior is the most critical factor driving the evolution of economic demand today and into the future. Innovations in marketing practice are changing how firms assess demand and deploy new marketing strategies that have far reaching effects on competitiveness, consumer welfare and public policy decision-making. For marketing, digital disruption has had game changing impacts. Today, the nature of digital media such as more accurate metrics, combined with interactivity, have created whole new marketing opportunities. A critical challenge for marketers, technology providers and investors as well as government policy makers is how to predict the evolving preferences and desires of consumers. The stakes are big. The landscape is littered with companies that failed to adapt to changing conditions brought about by new technology, business models and changing in demand. The rapid transformation of marketing with digital tools, product and strategies will hasten the adoption of digitization globally with impacts on labor markets, consumer welfare, and the competitiveness of both companies and nations. The digitization transformation of marketing is expected to create uneven benefits and costs for consumers, businesses and nations. Traditional marketing methods used to understand consumer behavior have proven to be less useful in a world transformed by digital markets. Consumer shopping and purchase behavior is rapidly evolving with increased preferences for shared consumption over ownership, use of mobile technology, consumer co-creation of value, online shopping and an increased preference for experiences over material things among the many changes in preferences. This has led to the development of new models such as the Consumer Decision Journal and Consumer Value Chain models to better assess the nature of consumer demand. Moeller et al. (2018) state, “The constraint for your company will not be the technology. It will be your ability to bring the three drivers to bear: to lower costs, engage customers, and make better use of assets. If you can employ digital technology to do that effectively, you will be among the winners of the age of digital disruption.” This research also calls for the development of new ways to understand consumer preferences and the evolution of those preferences. Initiatives such as MITs “Open Voice Network,” which seeks to better understand technology, policy and consumer preferences for the use of voice technology (i.e. Alexa; Google Home) and engages both universities and industry should be encouraged. Organizations and policy makers need to address how the digital transformation of marketing will affect economic competitiveness and consumer welfare. Both companies and public policy makers need to “follow the consumer” to gain insights on how to best adapt business strategies and governmental policies to best operate in this new digital economy.

ECONOMICS
155
REFERENCES
[1] Baldwin, Richard (2016) The Great Convergence: Information Technology and the New Globalization, Belknap Harvard.[2] Berkshire Hathaway Businesswire 2016.[3] Bettiol, Marco; Mauro Capestro and Eleonora Di Maria (2017) Industry 4.0: The Strategic Role of Marketing, working paper, Dipartimento di Scienze Economiche e Aziendali “Marco Fanno” [4] Buckley, Patricia and Rumki Majundar (2018) “The services powerhouse: Increasingly vital to world economic growth,” Delloitte Insights (July). https://www2.deloitte.com/us/en/insights/economy/issues-by-the-numbers/trade-in-services-economy-growth.html[5] Castro-Leon, Enrique and Robert Harmon (2016) Cloud as a Service: Understanding the Service Innovation Ecosystem, Apress.[6] Chui, Michael and James Manyika, “Competition at the digital edge: ‘Hyperscale’ businesses,” McKinsey Quarterly, March 2015, mckinsey.com.[7] Cui, A.S. and F. Fu (2016) Utilizing customer knowledge in innovation: antecedents and impact of customer involvement on new product performance, Journal of the Academy of Marketing Science, V.44, N.4.[8] Dawson, Angus, Martin Hirt, and Jay Scanlan (2016) The Economic Essentials of Digital Strategy, McKinsey Quarterly (March)[9] Digital Marketing Institute (2019) How Is Digital Transformation Changing Marketing?[10] Drucker, Peter F. and J.A. Maciariello (2008). Management: Revised Edition, New York: Harper Collins.[11] Erkişi, Kemal ve Semra Boğa (2019)”High-Technology Products Export and Economic Growth: a Panel Data Analysis for EU-15 Countries,” Bingöl Üniversitesi Sosyal Bilimler Enstitüsü Dergisi, Volume: 9, N.18 (Autumn) 669-683.[12] Foote, Caleb (2019) Fact of the Week: The Digital Economy Grew 4.3 Times Faster than the U.S. Economy Overall from 1997 to 2017, Information Technology & Innovation Foundation, (April, 15).https://itif.org/publications/2019/04/15/fact-week-digital-economy-grew-43-times-faster-us-economy-overall-1997-2017https://digitalmarketinginstitute.com/blog/how-is-digital-transformation-changing-marketinghttps://www.ineteconomics.org/uploads/papers/Paper-Turner-Capitalism-in-the-Age-of-Robots.pdf[13] Kagermann, Henning (2015) “Change Through Digitization—Value Creation in the Age of Industry 4.0,” in Management of Permanent Change, DOI: 10.1007/978-3-658-05014-6_2[14] Kahn, Barbara (2018) The Shopping Revolution, Wharton Digital Press.[15] Katz, Raul l. (2017) Social and Economic Impact of Digital Transformation on the Economy, ITU/ BDT Regulatory and Market Environment Division.https://www.itu.int/en/ITU-D/Conferences/GSR/Documents/GSR2017/Soc_Eco_impact_Digital_transformation_finalGSR.pdf[16] Kenney, Martin; Petri Rouvinen and John Zysman (2015) Digital Disruption and its Societal Impacts, Journal of Industry, Competition and Trade, March 2015, Volume 15, Issue 1, pp 1–4.[17] Lorenzo Ardito, Antonio Messeni Petruzzelli, Umberto Panniello, Achille Claudio Garavelli, (2019) “Towards Industry 4.0: Mapping digital technologies for supply chain management-marketing integration”, Business Process Management Journal, Vol. 25 Issue: 2, pp.323-346.[18] Martin Hirt and Paul Willmott (2014) Strategic principles for competing in the digital age, McKinsey Quarterly (May).[19] Mićić, Ljubiša (2017) Digital Transformation and its Influence on GDP, Economics, Vol. 5, N.2. 135-147.[20] Moeller, Leslie, Nick Hodson and Martina Sangin (2018),The Coming Wave of Digital Disruption, Strategy and Business (90).

ECONOMICS
156
[21] OECD Report (2018) Implications of the Digital Transformation for the Business Sector, Conference held in London UK, 8-9 November. http://www.oecd.org/sti/ind/digital-transformation-business-sector-summary.pdf[22]Petersen, Thieß (2019) Digital Economy: How is digitalization changing global competitiveness and economic prosperity? Blog: https://ged-project.de/blogpostsen/digital-economy-how-is-digitalization-changing-global-competitiveness-and-economic-prosperity/[23] Rifkin, Jeremy (2015) The Zero Marginal Cost Society, St. Martin’s Griffin, New York.[24] Stiglitz, Joseph (2016), adapted from Rethinking Capitalism: Economics and Policy for Sustainable and Inclusive Growth, Wiley-Blackwell. https://evonomics.com/joseph-stiglitz-inequality-unearned-income/[25] Straub, Richard (2019) World Economic Forum report; , McKinsey research; http://www.marketingjournal.org/the-power-of-ecosystems-an-interview-with-richard-straub/[26] Teixeira, Thales (2019) Unlocking the Customer Value Chain, Currencybooks.com, New York.[27] Turner, Adair (2018) Capitalism in the age of robots: work, income and wealth in the 21st-century, Lecture at School of Advanced International Studies, Johns Hopkins University (April)https://www.ineteconomics.org/uploads/papers/Paper-Turner-Capitalism-in-the-Age-of-Robots.pdf [28] UN News (2017) Branding and other intangibles account for 30 per cent of product value – UN report (November), https://news.un.org/en/story/2017/11/636712-branding-and-other-intangibles-account-30-cent-product-value-un-report[29]Vaitheeswaran, Vijay (2007) “Something new under the sun: A Special report on innovation,” The Economist, quoting Richard Lyons, October 13th, pg. 4.[30]World Economic Forum (2017) Shaping the Future of Retail for Consumer Industries, https://www.weforum.org/reports/shaping-the-future-of-retail-for-consumer-industries

157
Volume 7, No.2 2019ISSN 2303-5005
APPLICATION OF THE T-TEST IN HEALTH INSURANCE COST ANALYSIS: LARGE DATA SETS
Bojan Kresojević1, Milica Gajić1
ABSTRACT
In this paper will be analyzed the application of the t-test against the nonparametric Mann - Whitney test in the analysis of health insurance benefit costs in the Republic of Srpska on large samples. This research aims to examine which method produces better results when testing statistical hypotheses. The adequacy of the statistical tests will be tested on primary health insurance cost data for 1,044,690 insureds in 2017. For two samples of size 4,000, the sampling distribution of the difference in two means has a skewness coefficient of 0.05 and a kurtosis coefficient of 3.09. Jarque - Bera test does not reject the hypothesis of normality of distribution with a p-value of 0.135. On the other hand, in the Mann - Whitney test, the real risk of the first species, when there is a difference in skewness between the samples, may be less than 0.001 compared to the nominal risk level of 0.05. Based on the results obtained, it is suggested to use the t-test instead of the Mann - Whitney test if the sample is large enough, which should be verified by the bootstrap method.
JEL: C12, I13, G22
Review Article doi: 10.2478/eoik-2019-0024 UDK: 336.767:330.3(497.6RS)
date of sending to review: 12.12.2019.
1University of Banja Luka, Faculty of Economics, Bosnia and Herzegovina
Keywords:t-test, Mann -Whitney test, health insurance costs, large samples, distribution normality, skewness, kurtosis.
date of paper receipt:09.12.2019.
date of review receipt:19.12.2019.

ECONOMICS
158
INTRODUCTION
It is well known in the theory and practice of insurance that the cost of health insurance benefits has a distribution that, most often, deviates significantly from the normal. On the other hand, in a lot of situations, there is a need to analyze the association between the categorical variable and the cost of health insurance. If an independent variable has two categories, testing the relation is reduced to testing the statistical hypotheses with two independent samples. The most commonly used statistical tests with two samples are t-test and Mann - Whitney test. Many authors suggesting that the condition for applying the t-test is the normality of distribution. The Mann - Whitney test is usually recommended as an alternative to the t-test when the assumption of normality of distribution is not fulfilled.In this paper will be analyzed the application of the t-test against the nonparametric Mann - Whitney test in the analysis of health insurance benefit costs in the Republic of Srpska on large samples. The analysis will be conducted on the health insurance cost data for all insured persons in 2017 that are covered by compulsory health insurance. This study aims to test whether the t-test or the Mann - Whitney test is a better choice when we are analyzing health insurance costs in the Republic of Srpska on large samples. In other words, the key research question is which statistical test has a smaller deviation of the actual risk of the first kind relative to the nominal level of risk. This question also arises in many other areas where the data in the sample follow a distribution that is statistically significantly different from normal.The paper is divided into four parts. Firstly, the literature review part will be presented opinions of key authors that suggest or disclaim usage of t-test on non-normal data. Secondly, the methodology part will be described in the data and methods. Then, the results will be presented in the third part. Finally, the results of the paper will be compared with the results of other authors in the discussion part.
1. LITERATURE REVIEW
Statistical methods can be divided into parametric and non-parametric methods. Parametric methods are those methods that imply application to data that have an approximately normal distribution (Pandey, 2015). When it comes to comparing one, two or more means, t-test or ANOVA (analysis of variance) is applied. Non-parametric methods are applied when the normality of distribution can’t be ensured and then methods such as Mann – Whitney and Kruskal - Wallis tests, are used.Fay &Proschan (2010) concluded that the Wilcoxon - Mann - Whitney rank-based test produces significantly better results than the t-test when it comes to data with pronounced skewness. However, a nonparametric rank-based test does not directly test the mean. According to the creators of this test (Mann & Whitney, 1947), this test examines the equality of distributions, which means that differences in other statistical moments (standard deviation, skewness, and kurtosis) can lead to rejection of the null hypothesis even when there is no difference in means. The Wilcoxon - Mann - Whitney test is often used to compare means and medians, predominantly in data with a distribution that deviates from normal. However, Fagerland&Sandvik (2009a) have shown by simulation that small deviations in skewness can lead to large deviations of type I error relative to the nominal level. This shows that the lack of robustness of this test to skewness is much more serious than previously thought.According to the Central Limit Theorem, the distribution that deviates from normal becomes normal when the sample increases (Cundill& De Alexander, 2015). More specifically, the sample distribution of the mean becomes normal when the sample is enlarged enough. The rule of thumb in the literature is that samples larger than 30 are large samples and that their distribution is approximately normal (see Lovric, Komic&Stevic, 2017). The problem is that each distribution

ECONOMICS
159
does not deviate equally from the normal one, thus no universal limit can be set when it comes to approaching the normal distribution. Chang, Wu, Ho & Chen (2008) found by simulation that a sample size of 150 is required for with a gamma distribution (with beta and gamma coefficients of 1, and a variable alpha coefficient of 1 to 60) had an approximately normally distributed sample distribution. Central Limit Theoremhas found application in both life and non-life insurance to determine the aggregate amount of damage (Blanchet & Lam, 2013; Restrepo-Morales & MedinaHurtado, 2012).
2. RESEARCH METHODOLOGY
2.1. DATA
The paper uses primary data on health insurance costs in the Republic of Srpska in 2017. Data refer to the costs of the Republic of Srpska Health Insurance Fund for financing health services covered by compulsory health insurance. For the analysis, all health insurance costs (family medicine, outpatient treatment, hospital treatment, prescription treatment, etc.) that are available at the Health Insurance Fund information system are collected at the ID number level. Data were collected at the individual service level, accounting for 80% of total health insurance costs. About 30,000,000 individual services were processed and thus 80% of total health insurance costs were allocated to insured. The remaining 20% is due to the unavailability of data in proportion to the previous 80%.
2.2. COMPARISON OF STATISTICAL TESTS
Considering the formula for the t-test assuming that the sample variance is not the same from equation (1), we can conclude that the t-test statistic is a ratio of the difference between the means and the standard error of the difference between the mean. In other words, the test statistic represents the ratio between the mean and the standard deviation of the sample distribution for the difference between the means. It follows that the distribution of t-test statistics depends on the shape of the distribution of the sample distribution for the difference between the means.
(1)
Therefore, the t-test is adequate if and only if the sample distribution of the difference between the means has a distribution that approximates the t distribution, that is, the normal distribution on large samples. Therefore, the sample size for which the sample distribution will have a distribution close to the normal should be examinedTo determine the sample size at which the distribution of health insurance costs becomes closer to normal, it is necessary to determine the sample distribution of health insurance costs for a given sample size. A convenient method for determining the distribution is to simulate with the help of randomly generated numbers of so-called Monte Carlo simulation if random values are generated based on theoretical distribution. Otherwise, when empirical distribution data is available (based

ECONOMICS
160
on a large sample) sampling based on random number generation is called bootstrap sampling, which by its nature, is a simulation. With the help of a random number generator, one number from 1 to n is taken (the number of available values to the sample that reflects the distribution), and the value of the cost is read for the given ordinal number. One sample unit was thus simulated. Other values of the sample are then simulated in the same way (for example, for a sample distribution of a sample of size 30, it is necessary to simulate a value for 30 units). For one simulated sample, the mean is calculated. This simulation procedure should be performed as many times as possible to increase the reliability of the simulation. For this work, the simulation will be performed for 10,000 samples.To show the effect of the Central Limit Theorem, or to examine the approximation of the sample distribution to the normal distribution, as the sample increases, more bootstrap simulations will be performed in this paper. The bootstrap simulation will be shown for the sample distribution of one mean for a sample of sizes 30, 500, and 4,000, as well as for the sample distribution of the difference between the means for a sample size of 4,000.Based on the sampling distribution, the actual level of risk of the first species will be determined and then a comparison with a nominal level of 0.05 will be made. For the Mann - Whitney test, 10 repetitions of the test will be performed for two samples with the same mean and different second, third and fourth distribution points. Since the starting point is the null hypothesis that the means are equal, it will be tested whether the Mann - Whitney test allows for adequate testing of differences in means.
3. RESULTS
When it comes to health insurance costs, costs are insured asymmetrically - more than 25% of the insured have a cost of 0, while the maximum cost exceeds 300,000 KM.
Figure 1. Distribution of health insurance costs
Source: Authors
The mean for health insurance costs is 523.96KM, the standard deviation is 2.144. The skewness coefficient is 20.52, and the kurtosis coefficient is 1.249. The foregoing indicates that the distribution is remarkably different from the normal, which can also be inferred from Figure 1 values greater than 5,000 replaced with a value of 5,000 to give a better histogram of the distribution of health insurance costs over the interval 0-5,000.

ECONOMICS
161
Figure 2. Q-Q diagram of health insurance cost distribution vs normal distribution
Source: Authors
From Figure 2 it is clear that the distribution deviates from the normal one, as indicated by the Kolmogorov - Smirnov test with a p-value of less than 0.001.The sample distribution with samples of size 30 is described by mean of 521.30 which approximates the standard deviation of the original distribution, the standard error of 377.39, the skewness coefficient is 2.72, and the skewness coefficient is 14.65.
Figure 3. Sample distribution of health insurance costs for sample size 30 (n = 30)
Source: Authors
Based on Figure 3, as well as the statistics, it can be concluded that a sample of size 30 is not sufficient to achieve the action of the law of large numbers, that is, to make the sample distribution approximately normal. Such an outcome could be expected as a consequence of the distribution of health insurance costs in Figure 1, which shows exceptional skewness, which means that the sample needs to be increased significantly more to bring the distribution closer to normal. Jarque - Bera and Kolmogorov - Smirnov test normality tests hypothesize the normality of this distribution at risk of 0.0001.Figure 3 one can see the approximation of this distribution to the normal distribution. Figure 4 also shows the approximation of the sample distribution to the normal distribution, but the deviation is clearly still present.

ECONOMICS
162
Figure 4. Q-Q diagram of the sample distribution on a sample of size 30 relative to the normal distribution
Source: Authors
To determine the adequate sample size for the application of parametric techniques, the simulation was also performed for a sample of size 500, this implies that for 10,000 simulations it is necessary to simulate 5,000,000 values
Figure 5. Sample distribution of health insurance costs for sample size 500 (n = 500)
Source: Authors
The mean of this distribution is 522.69; the standard deviation / standard error is 95.78; the skewness coefficient is 0.96, and the kurtosis coefficient is 5.99. Due to the still-present positive skewness, 2.5% of the value is less than the standard deviation z = -1.57, instead of -1.96; while 2.5% of the value is greater than the standard deviation of 2.24; instead of 1.96. Figure 5 confirms that the skewness is significantly reduced compared to the sample size 30.Figure 6 shows that there is still a discrepancy between the quantiles of the sample distribution for samples of size 500 and the normal distribution. These results are also confirmed by normality tests, which say that with a risk of less than 0.0001 it is possible to reject the hypothesis that this sample distribution is equal to normal.For a standardized deviation value of -1.57, it is really 2.5% of the smaller values, while a normal distribution would suggest that it is 5.78% smaller. The standard deviation value of 2.24 is larger,

ECONOMICS
163
according to the sample distribution, 2.5%, and a normal distribution would suggest that 1.23% are larger. Based on the previous one, we can conclude that the error in p-value at positive deviation is relatively small, but nevertheless, it is significant at negative deviation.
Figure 6. Q-Q diagram of the sample distribution on a sample of size 500 relative to the normal distribution
Source: Authors
Figure 7 shows that the distribution of 4,000 achieves a smoothness of distribution with still slight skewness to the right. This distribution is characterized by a mean of 523,96; standard deviation / standard error 33.92; the skewness coefficient is reduced to 0.34; and the kurtosis coefficient at 3.17. The skewness and kurtosis coefficients are now very close to the values 0 and 3, respectively, which characterize the normal distribution. However, both normality tests (Jarque - Bera and Kolmogorov - Smirnov) reject the hypothesis of distribution normality. However, it should be borne in mind that the number of simulations/replicates is relatively large - 10,000 and that-tests applied to such large samples have high power and they are able to identify small deviations from the normal distribution, and those small deviations do not have to have a major impact on statistical inference.
Figure 7. Sample distribution of health insurance costs for sample size 4,000 (n = 4,000)
Source: Authors

ECONOMICS
164
Analyzing the tails of the distribution, we find that 2.5% of the value is less than the standard deviation of 1.80 (by a normal distribution of 3.6%) and that 2.5% of the value is larger than the standard deviation of 2.15 (by the normal distribution of 1.5 %). The above points out that, with a negative deviation, the p-value would be overestimated - for a real standardized deviation of 1.8 and p-value of 0.05 (double value of 0.025 due to two-sided inference), the estimated p-value based on the normal distribution would be overestimated at the level of 0.07 (double value of 0.035). Here, we observe that the error in the p-value is relatively reduced, and taking a lower level of p-value would ensure that the risk of the first type error is not too large (resulting in a decrease in the power of the statistical test, that is, an increase in the error of the second type).Figure 8 shows that the quantile degree of empirical distribution and normal distribution is very high.
Figure 8. Q-Q diagram of the sample distribution on a sample of 4.000 in relation to the normal distribution
Source: Authors
However, when applying the two-sample t-test, the sample distribution of only one sample is not relevant, but rather the relevant sample distribution is the difference in means for the two samples. In order to derive the sample distribution of the differences of 10,000 means of the samples in Figure 7 are divided into two groups of 5,000, between these two groups the differences of means are calculated, and the distribution of 5,000 differences in means is obtained.
Figure 9. Sample distribution of differences between two groups of samples, where in both groups the samples are 4,000 (n = 4,000)
Source: Authors

ECONOMICS
165
Mean of distribution from Figure 4.10. is 0.28 which is approximately 0 given that the samples are independently generated, so the limes of the mean when the sample size tends to infinity is 0. The standard deviation / standard error is 47.51. The skewness coefficient is only 0.05; and the kurtosis coefficient is 3.09. It has previously indicated that this distribution has a distribution that is very close to the normal distribution.Of the standard deviation value -1.92, 2.5% is smaller (2.6% according to the normal distribution), while 2.5% is larger than the standard deviation 2.01 (2.2% normal distribution). Which indicates that the true p value at negative deviations of 0.05 would be estimated at 0.052 with the help of the t-test. With positive deviations, the rating would be 0.044.According to both tests of normality, the distribution of Figure 4.10 does not deviate from normal. Jarque - Bera shows a p value of 0.1513, and Kolmogorov - Smirnov 0.134.
Figure 10. Q-Q diagram of the sample distribution of differences of means, on samples of size 4,000 relative to the normal distribution
Source: Authors
Figure 10 shows a high degree of agreement between the quantiles of empirical and normal distribution.Considering the statistical moments, deviation in p values, normality tests, and quantile agreement, we can conclude that the assumption of normality of distribution on the sample distribution of differences in means - is fulfilled.If the population is divided into groups (based on sex, age, etc.), heterogeneous groups can be obtained (in terms of statistical moments), but on large samples (4,000 and more) this variability should not significantly compromise the quality of conclusions based on t-test, which will be analyzed below.To evaluate the effect of skewness and kurtosis on arithmetic inference using the Wilcoxon - Mann - Whitney test, health insurance cost data analyzed the difference in average costs between men and women of all ages, on a sample size of 4,000. The average value of health insurance costs for men in 2017 was 536.03KM and for women was 536.37KM. Given that the standard deviation in males is 2.357 and in females 1.988 even with samples of 481.253 and 535.934, respectively, the standard error of both samples is greater than 2.5 (while the difference in means is 0.31) we can with high certainty conclude that this difference is not statistically significant. The cost skewness in men is 19.18 and in women 21.49. The prevalence in males is 1,125 and in females 1,309. From the previous statistical moments, we can conclude that the means are equal in gender (which is confirmed by the bootstrap method) and that the other moments are different between the sexes. Generation of 4,000 samples for both sexes and the calculation of the Wilcoxon - Mann - Whitney test were applied on such data. This procedure was repeated 10 times. In all ten replicates, the Wilcoxon - Mann - Whitney test rejected the null hypothesis at a risk less than 0.000000001 in all

ECONOMICS
166
cases, ie with a t statistic greater than 8 at absolute value. From the above, we can see that Wilcoxon - Mann - Whitney rejects the hypothesis of equality of distributions for both sexes, although the difference in means is not statistically significant. Thus, we can estimate that Wilcoxon - Mann - Whitney is not suitable for indirectly inferring the difference in means for two samples, in case of pronounced difference in skewness and kurtosis.
4. DISCUSSION
There is a widespread belief that the t-test and linear regression apply only in the case of variables with a normal distribution, however, according to the Central Limit Theorem, they can be applied to large samples of variables with data deviating from the normal distribution. As evidenced by the simulation of health cost data (Lumley, Diehr, Emerson & Chen, 2002). Fagerland&Sandvik (2009b) found that when the sample size is sufficiently increased, beyond 200, the t-test becomes robust even for pronounced asymmetric distributions.The median sample size of empirical research published in The Lancet and BMJ journals increased from 33 and 37 from 1972 to 2007, respectively, to 3116 and 3104. Meanwhile, the incidence of Wilcoxon - Mann - Whitney testing increased from 11 to 27%, at the expense of the t-test whose use decreased from 44 to 26%, which is a paradox. One reason is that journals such as NEJM in the instructions to the authors suggest that non-parametric tests be applied to data with a distribution that deviates from normal. However, such guidance directs large-sample research authors to apply nonparametric tests unnecessarily (Fagerland, 2012).
CONCLUSION
As same to the normal distribution and parametric tests that were popular at the beginning of the 20th century, nowadays, there is increased usage of non-parametric tests and avoiding of parametric tests. For the distribution of the t-statistic, more relevant is the sampling distribution, rather than the distribution of sample data. More precisely, there is a relevant sampling distribution of two means difference. The normality of sampling distribution is a condition for t-test applications. Therefore, the normality of distribution may be overrated. The paper was presented in the case of health insurance cost data. Health insurance costs have a right-skewed distribution with high peakedness. Following the Central Limit Theorem, as sample size increases, sampling distribution approaches to normal. For a sample size of 4,000, the sampling distribution of health insurance cost data is close to the normal distribution. But, the Jarque-Bera test of normality finds enough evidence to reject the null hypothesis of normality. As we have already said, we have to look at the sampling distribution for two means difference. For the size of 4,000, the sampling distribution for two means difference is almost normal. The Jarque-Bera test didn’t find enough evidence to reject the null hypothesis. Therefore, we can conclude that the t-test is applicable for analysis in this case. This doesn’t mean that a t-test is always applicable to health insurance cost data, or skewed distributions in general. Firstly, it is necessary to check if the sample size is enough that sampling distribution for two means different approaches to the normal distribution. On the other hand, there has been showed that the Mann-Whitney test could be sensitive to skewness differences between samples. It leads to a gap between the actual risk level of the first kind and nominal one.The results of this paper claim that the t-test has better performance than the Mann-Whitney test, in an analysis of the difference between two groups of health insurance cost data if samples are large enough. This conclusion is still applicable to any other field where skewed distribution could be found. Further research could be oriented to techniques for checking if the sample size is enough large for the t-test application.

ECONOMICS
167
AKNOWLEDGEMENTS
The authors express their gratitude to the Health Insurance Fund of Republic of Srpska for giving data for the analysis.
REFERENCES
[1] Blanchet, J., & Lam, H. (2013). A heavy traffic approach to modeling large life insurance portfolios. Insurance: Mathematics and Economics, 53(1), 237-251. https://doi.org/10.1016/j.insmatheco.2013.04.011 [2] Chang, H. J., Wu, C. H.; Ho. J. F., Chen P. Y. (2008). On sample size for using Central limit theory in various distributions, International Journal of Information and Management Sciences, 19 (1).[3] Cundill, B., & Alexander, N. D. (2015). Sample size calculations for skewed distributions. BMC medical research methodology, 15(1), 28. https://doi.org/10.1186/s12874-015-0023-0[4] Fagerland, M. W. (2012). t-tests, non-parametric tests, and large studies—a paradox of statistical practice?. BMC Medical Research Methodology, 12(1), 78.https://doi.org/10.1186/1471-2288-12-78[5] Fagerland, M. W., & Sandvik, L. (2009). Performance of five two-sample location tests for skewed distributions with unequal variances. Contemporary clinical trials, 30(5), 490-496. https://doi.org/10.1016/j.cct.2009.06.007[6] Fagerland, M. W., & Sandvik, L. (2009). The wilcoxon–mann–whitney test under scrutiny. Statistics in medicine, 28(10), 1487-1497. https://doi.org/10.1002/sim.3561[7] Fay, M. P., & Proschan, M. A. (2010). Wilcoxon-Mann-Whitney or t-test? On assumptions for hypothesis tests and multiple interpretations of decision rules. Statistics surveys, 4, 1. https://doi.org/10.1214/09-ss051[8] Ловрић, М.,Комић, Ј., & Стевић, С. (2006). Статистичкаанализа: методи и примјена. Економски факултет Бања Лука, Бања Лука,(330-357).[9] Lumley, T., Diehr, P., Emerson, S., & Chen, L. (2002). The importance of the normality assumption in large public health data sets. Annual review of public health, 23(1), 151-169. https://doi.org/10.1146/annurev.publhealth.23.100901.140546[10] Mann, H. B., & Whitney, D. R. (1947). On a test of whether one of two random variables is stochastically larger than the other. The annals of mathematical statistics, 50-60. https://doi.org/10.1214/aoms/1177730491[11] Pandey, R. M. (2015). Commonly used t-tests in medical research. Journal of the Practice of Cardiovascular Sciences, 1(2), 185. https://doi.org/10.4103/2395-5414.166321[12] Restrepo-Morales, J. A., & Medina Hurtado, S. (2012). Estimation of operative risk for fraud in the car insurance industry. Global Journal of Business Research, 6(3), 73-83. https://doi.org/10.1002/9781118387047.ch6

ECONOMICS
168
ČASOPIS ZA INOVACIJSKA I EKONOMSKA ISTRAŽIVANJA INNOVATIVE AND ECONOMICS RESEARCH JOURNAL
Neznanih junaka 9-11, 76 300 Bijeljina, Tel./fax: 055/423-183 Account No.: 555-000-00049162-69; E-mail: [email protected]; www.economicsrs.com;
ISSN: 2303-5005; E-ISSN: 2303-5013
AUTHOR GUIDELINES
Submit to the journal
Submit your manuscripts to the journal via decidated online platform: http://economicsrs.com/index.php/economicus login and/or [email protected]
Review process
Each paper is reviewed by the editor and, if it is judged suitable for this publication, it is then sent to two reviewers for double blind peer review. The authors’ names are anonymous to the reviewers. Based on their recommendations, the editor then decides whether the paper should be accepted as is, revised or rejected. The Editorial Board retains the right to methodologically adjust the article to the journal propositions and standards of the English language, as well as not to consider articles which do not meet the requirements of these guidelines.
Copyright
Articles submitted to the journal are not to have been published before in their current or substantially similar form, or be under consideration for publication with another journal. Use this in conjunction with the points below about references, before submission i.e. always attribute clearly using either indented text or quote marks as well as making use of the preferred Harvard style of formatting. Authors submitting articles for publications warrant that the work is not an infringement of any existing copyright and will indemnify the publisher against any breach of such warranty. The author is responsible for ensuring the authenticity of data, facts, quotations and other information. The Editorial Boards may publish articles for discussion, without necessarily sharing the author’s views.

Manuscript requirements Please prepare your manuscript before submission, using the following guidelines:
Format and Article Length
Times New Roman should be the primary used font. Paper title should be capitalized and written in bold, 14pt; Headings should be written in the same font 12pt, bold, capitalised; whereas the main text should be written in Times New Roman font, 11pt;
Article Language
Articles are to be submitted in the acceptable scholarly English language.
Style and Spacing Articles should be between 7000 and 10000 words, typed. Pictures, graphics and other attachments should be marked and sent in text and must not exceed the journal format with margins. Lengthier articles may be considered at the discretion of the Editorial Board. Margins shall be set as one-inch (2.54cm) with double-spaced text. Indentation of the first line is 1 cm. Do not use boldface except for section headings and subheadings. The sections headings should have spacing of 18 points before and of 6 points after. Section subheadings should be given in the first line of the paragraph. Article structure – The structure of article should comprise: Article Title Page – An Article Title Page should be submitted alongside each individual article. This should include: Article Title - A title of not more than eight words should be provided. Longer titles may be approved by the editorial board. Author Details – Full name of each author, Affiliation of each author, country and email address of the corresponding author(s). Article Classification – That article are classified in the following categories: Original scientific paper, Review scientific paper, Preliminary communication, Scientific criticism, Informative annex and Book review. Abstract – The abstract must include sufficient information for readers to judge the nature and significance of the topic, the adequacy of the investigative strategy, the nature of the results and the conclusions. The abstract is not an introduction, it summarizes the substantive results of the work, not merely listing the topics that are discussed in the paper. The abstract should imply, suggest the main idea of the paper, the subject and the goal of the research, methods used, hypotheses, research results and a brief conclusion. It must have 250 to 300 words. Key words – Immediately after the abstract, provide a maximum of 10 keywords. JEL classification – Please provide up to 6 standard JEL codes. The available codes may be accessed at JEL: http://www.aeaweb.org/journal/jel_class_system.html It is followed by the main body of the paper divided into sections. The section headings are as follows:

a. Introduction – defines the problem and the subject matter of the research referring to recent bibliography and findings. However, these can more specifically be dealt with in the second section Literature review. The last part of the introduction is reserved for setting the hypothesis of the research that will be later on analyzed at the beginning of the conclusions. Finally, Introduction ends up by giving clues of the organization of the text. b. Literature review – precedes a research section providing readers with a cutting-edge context of the referential literature dealing with crucial points of current knowledge based on the relevant results of the current research. Literature review should be a synthesis of previous research, justifying the theoretical and empirical contributions of the respective paper, a not a simple listing of previous scientific contributions. c. Methodology/method/model/conception of analysis – usually in the third section of the paper, methodology/method/model/conception of the analysis should be transparently presented and pointed out in case of the research results being subjected to re-testing by interested researchers (it is one of the fundamental principles of the scientific methodology). d. Empirical data and analysis – contain documentation background and the results of the empirical analysis. The data sample shall be elaborated and the obtained results shall be explained based on statistical and econometric features, and their economic meaning. e. Results and discussion – explain the results, especially their economic significance and messages. In this section, the author(s) need to elaborate how their results and conclusions contribute to the scientific field and provide practical implications and recommendations. f. Conclusions – is not supposed to be a summary! Conclusions are the author’s original thoughts and evaluation of the obtained results including the items as follows: • Explanation of the working hypothesis – proved or not proved. • Assessment of the results of research/analysis with the focus on what can be classified as a new contribution to economic science. • Attention drawn to research limitations and problems. • Guidelines to future research.
Numbering Divide your article into clearly defined and numbered sections (1, 2, 3…). Subsections should be numbered 1.1 (then 1.1.1, 1.1.2, …), 1.2, etc. (the abstract and conclusion are not included in section numbering).
Technical presentation Subtitles must be short, clearly defined and numbered, except for Introduction and Conclusion. All tables and figures need to support your research findings. They should be clearly referred to and numbered consecutively in Arabic numerals. Tables. Tables should be placed in the main text and be centred unless they occupy the full width of the page (within margins). The table headings should be preceded by the table number (in bold), have sentence capitalization, be centred. Columns should be titled, with the titles centred, typed in bold. All the unites in tables should be given in

square brackets [meV]. If square brackets are not available, use curly brackets {meV} or round brackets (meV). All of the tables should be numbered and have headings. In the text, they should be referred to as Table 1, Table 2, etc. Do not break tables. Avoid complex formatting. Do not hyphenate words. The font size of the text in tables should be of 10-12 points; all of the data should be easy to read.
Figures
Figures should be placed in the main text (no wrapping) separated from it by a spacing of 12 points. Utmost care must be taken to insert the figures in correct alignment with the text. Individual figures should be centred. If a figure has parts, they should be clearly labeled as (a), (b), (c), etc. in the figure.
Figure 1. The caption which describes the figure in general: a) Description of what is contained in the first part; b) Description of what is contained in the
second part. a b
source
The caption should be self-contained and placed above the figure, typed in the sentence capitalization and centred. It should be preceded by the figure number (in bold), contain a brief description of the figure and a key to interpreting various lines and symbols in the figure (if needed). The captions can be typed at a font size of 10 -11 points. Source should be noted below the figure, underneath the caption details. All of the figures should be numbered and have captions. They should be referred to in the text as Fig. 1, Fig. 2, etc. Try to place figures after and as close as possible to the point where they are first mentioned in the text. Do not break figures. Format the figures as given in the template. Keep figures within margins. Do not hyphenate words in figures. Generally, only original drawings or photographic reproductions are acceptable. Should authors use figures from other Publications, they must ask the corresponding publishers to grant them the right to publish this material in their paper. The photocopies are acceptable if they are of a very high quality. Half-tone pictures should be in the form of glossy prints. If possible, include your figures as graphic images in the electronic version. For best quality the pictures should have the resolution of 300 dpi (dots per inch).
Charts Charts should be placed within the main text and be centred (within margins). Charts should be preceded by the chart number (in bold), have sentence capitalization, be centred. All of the charts should be numbered and have headings. Chart heading should be specified underneath. In the text, they should be referred to as Chart 1, Chart 2, etc. Do not hyphenate words.
Equations

There shoud be one line of space above the equation and one line of space below it before the text continues. Try to fit the whole equation into one line.
pp
pdxxff
/1
)( ,
and c2 = a2 + b2 , (1)
1111 )(:inf)(22 nnLnLn xTTffE
. (2) All the equations should be punctuated as if they were an ordinary part of the text. Punctuation appears after the equation but before the equation number. The order number should be put in round brackets at the right-hand edge of the text in line with the equation. Equations should remain editable and not appear in a picture format. Type the mathematical equations in the simplest way possible. Make sure that your Equation Editor or MathType fonts, including sizes, are set up to match the text of your document. Equations that are referred to in the text should be numbered sequentially throughout the text (i.e., (1), (2), (3)) or numbered by section (i.e., (1.1), (1.2), (2.1)) depending on author’s preference. Equations may be referred to in the text as Eq.(1). The use of Word’s built-in Equation editor or the full MathType product is allowed.
Comments Comments that may supplement the original information are allowed to be added within a dedicated footnote, following the respective reference number, e.g. [3]
References and Citation Please ensure that every reference cited in the text is also present in the reference list (and vice versa). All manuscripts should be formatted using the APA (American Psychological Association) references which are widely used in the social sciences, education, engineering and business. a) Citing references in text
Placement References are cited in the text by the author's surname, the publication date of the work cited, and a page number if necessary. Full details are given in the reference list. Place them at the appropriate point in the text. Repeat mentions in the same paragraph If name and year are in parentheses, include the year insubsequent citations. With a quotation This is the text, and Markovic (2018) says "quoted text" (p.1), which supports my argument. This is the text, and this is supported by "quoted text" (Markovic, 2018, p. 1). This is a displayed quotation. (Markovic, 2018, p. 1) Page number (Markovic, 2018, p. 6) One author Markovic (2018) or (Markovic, 2018) Two authors Markovic and Jaksic (2018) or (Markovic & Jaksic, 2018) Three to five authors

At first mention: Markovic, Jaksic, Krstic, Pivac, and Cerketa (2018) or (Markovic, Jaksic, Krstic, Pivac, & Cerketa, 2018) At subsequent mentions: Markovic et al. (2018) or (Markovic et al., 2018) In cases where two or more references would shorten to the same form, retain all three names. Six or more authors Markovic et al. (2018) (Markovic et al., 2018) Authors with same surname G. Markovic (2018) and F. Markovic (2018) G. Markovic (2018) and F. Markovic (2018) No author Cite first few words of title (in quotation marks or italics depending on journal style for that type of work), plus the year: (“Study Finds,” 2017) If anonymous, put (Anonymous, 2018). Groups of authors that would shorten to the same form Cite the surnames of the first author and as many others as necessary to distinguish the two references, followed by comma and et al. Organization as author The name of an organization can be spelled out each time it appears in the text or you can spell it out only the firsttime and abbreviate it after that. The guiding rule is that the reader should be able to find it in the reference list easily. Th Author with two works in the same year Put a, b, c after the year (Cerketa, 2011a, 2011b, in press-a) Secondary source When it is not possible to see an original document, cite the source of your information on it; do not cite the original assuming that the secondary source is correct. Markovic's economic vocabulary (as cited in Krstic, 2018) Classical work References to classical works such as the Bible and the Qur’an are cited only in the text. Reference list entry is not required. Cite year of translation (Karadžić, trans. 1848). Personal communication References to personal communications are cited only in the text. Unknown date (Author, n.d.) Two dates (Author, 2009–2019) Author (2009/2019) e

b) Reference list Order Alphabetical letter by letter, by surname of first author followed by initials. References by the same single author are ordered by date, from oldest to most recent. References by more than one author with the same first author are ordered after all references by the first author alone, by surname of second author, or if they are the same, the third author, and so on. References by the same author with the same date are arranged alphabetically by title excluding 'A' or 'The', unless they are parts of a series, in which case order them by part number. Put a lower-case letter after the year: Simic, J. (2019a). Simic, J. (2019b). For organizations or groups, alphabetize by the first significant word of their name. If there is no author, put the title in the author position and alphabetize by the first significant word. Form of author name Use the authors' surnames and initials unless you have two authors with the same surname and initial, in which case the full name can be given: Simic, J. [Jovan]. (2019). Simic, J. [Juraj]. (2019). Book One author Author, A. A. (2019). This is a book title: And subtitle. Bijeljina: Economics. Two authors Author, A. A., & Author, B. B. (2019). This is a book title: And subtitle. Bijeljina: Economics. Three authors Author, A. A., Author, B. B., & Author, C. C. (2019). This is a book title: And subtitle. Bijeljina: Economics. More authors Include all names up to seven. If there are more than seven authors, list the first six with an ellipsis before the last. Author, M., Author, B., Author, E., Author, G., Author, D., Author, R., … Author, P. (2015). Organization as author Oikos instutut. (2016). Book title: And subtitle. Bijeljina: Economics. Journal One author Author, A. A. (2019). Title of article. Title of Journal, 22, 123–231. doi:xx.xxxxxxxxxx Provide the issue number ONLY if each issue of the journal begins on page 1. In such cases it goes in parentheses: Journal, 8(1), pp–pp. Page numbers should always be provided. If there is no DOI and the reference was retrieved from an online database, give the database name and accession number or the database URL (no retrieval date is needed):

Author, A. A. (2011). Title of article. Title of Journal, 22, 123–231. Retrieved from http://www.xxxxx If there is no DOI and the reference was retrieved from a journal homepage, give the full URL or site’s homepage URL: Author, A. A. (2011). Title of article. Title of Journal, 22, 123–231. Retrieved from http://www.xxxxx Two authors Author, A. A., & Author, B. B. (2004). Title of article. Title of Journal, 22, 123–231. doi:xx.xxxxxxxxxx Three authors Author, A. A., Author, B. B., & Author, C. C. (1987). Title of article. Title of Journal, 22, 123–231. doi:xx.xxxxxxxxxx More authors Include all names up to seven. If there are more than seven authors, list the first six with an ellipsis before the last. Author, M., Author, B., Author, E., Author, G., Author, D., Author, R., … Author, P. (2001). Organization as author American Psychological Association. (2003). Title of article: And subtitle. Title of Journal, 2, 12–23. doi:xx.xxxxxxxxxx No author Editorial: Title of editorial. [Editorial]. (2012). Journal Title, 14, 1−2. Not in English If the original version is used as the source, cite the original version. Use diacritical marks and capital letters for the original language if needed. If the English translation is used as the source, cite the English translation. Give the English title without brackets. Titles not in English must be translated into English and put in square brackets. Author, M. (2016). Title in German: Subtitle of Article [Title in English: Subtitle of article]. Journal in German, 21, 208–217. doi:xx.xxxxxxxxxx Author, P. (2016). Title in French [Title in English: Subtitle of article]. Journal in French, 21, 208–217. doi:xx.xxxxxxxxxx Peer-reviewed article published online ahead of the issue Author, A. A., & Author, B. B. (2012). Article title. Title of Journal. Advance online publication. doi:xx.xxxxxxxxxx If you can update the reference before publication, do so. Supplemental material

If you are citing supplemental material which is only available online, include a description of the contents in brackets following the title. [Audio podcast] [Letter to the editor] Other article types Editorial: Title of editorial. [Editorial]. (2018). Title of Journal, 14, 1−2. Author, A. A. (2019). Title of review. [Review of the book Title of book, by B. Book Author]. Title of Journal, 22, 123–231. doi:xx.xxxxxxxxxx Article in journal supplement Author, A. A. (2004). Article title. Title of Journal, 42(Suppl. 2), xx–xx. doi:xx.xxxxxxxxxx Conference Proceedings To cite published proceedings from a book, use book format or chapter format. To cite regularly published proceedings, use journal format. Paper Presenter, A. A. (2012, February). Title of paper. Paper presented at the meeting of Organization Name, Location. Poster Presenter, A. A. (2012, February). Title of poster. Poster session presented at the meeting of Organization Name, Location. Internet Website When citing an entire website, it is sufficient just to give the address of the site in the text. The Economics (http://www.economicsrs.com/). Web page If the format is out of the ordinary (e.g. lecture notes), add a description in brackets. Author, A. (2019). Title of document [Format description]. Retrieved from http://URL
COPYRIGHT REGULATIONS AND OPEN-ACCESS LICENSING
All authors submitting articles for publication at “ECONOMICS” Innovative and ECONOMICS Research Journal are expected to provide the statement that their contribution does not infringe any of the already existing copyright so that to indemnify the publisher of the journal against any breach of warranties.