Innovations in U.S. Infrastructure Financing: An Evaluation
23
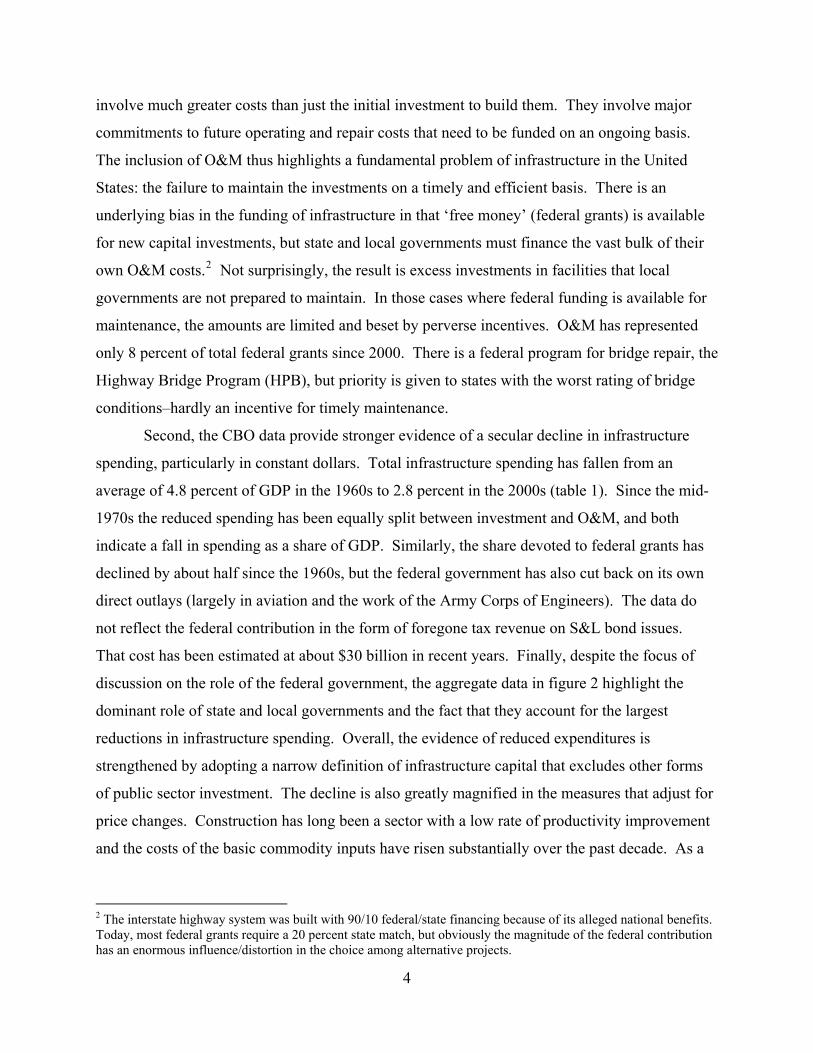
November 28, 2011 Innovations in U.S. Infrastructure Financing: An Evaluation Barry Bosworth and Sveta Milusheva The Brookings Institution The condition of America’s infrastructure has become a subject of increased public discussion in recent years. This is the result of several factors. First, there is a perception that the existing infrastructure has become badly deteriorated due to inadequate outlays for maintenance and repair and the underfunding of new investment needs. Second, the stagnate condition of the U.S. economy in the aftermath of the financial crisis has stimulated a new search for effective means of stimulus, and public works projects attract considerable attention because those expenditures generate large Keynesian multiplier effects on the aggregate economy. Third, state and local governments, the traditional sponsors of much of the infrastructure, are faced with severe funding constraints that have stimulated a search for new means of paying for future projects. Finally, the growing interest in “green growth”–the promotion of policies to tackle environmental degradation and climate change within a framework of sustainable growth–will result in increased demand for new infrastructure investments, ranging from the retrofitting of buildings, expansion of the rail network, and development of ‘smart grids’ to improving the efficiency of electricity generation. The focus of this paper is an evaluation of some of the new approaches to the financing of infrastructure projects. They include extension of the Build America bond program that was introduced in 2009-10, proposals for an infrastructure bank, and public-private partnerships. However, a central theme of this report is that U.S. infrastructure investments are not limited by financial market constraints. State and local governments, in particular, can currently obtain long-term financing at very low rates of interest that are further subsidized through a federal income tax exemption. Instead, the more basic problem is the distorted nature of the decision- making process and difficulties of generating future revenue streams sufficient to pay for the initial capital investment, maintenance and operating costs. The decision-making process is perverted by an excessive focus on efforts to obtain free federal funding of infrastructure projects whose benefits are largely local, and the emphasis on new construction results in inadequate funding of operating costs and timely maintenance. Citizens and their representatives often favor 1
Transcript of Innovations in U.S. Infrastructure Financing: An Evaluation
November 28, 2011
Innovations in U.S. Infrastructure Financing: An Evaluation
Barry Bosworth and Sveta Milusheva The Brookings Institution
The condition of America’s infrastructure has become a subject of increased public
discussion in recent years. This is the result of several factors. First, there is a perception that
the existing infrastructure has become badly deteriorated due to inadequate outlays for
maintenance and repair and the underfunding of new investment needs. Second, the stagnate
condition of the U.S. economy in the aftermath of the financial crisis has stimulated a new search
for effective means of stimulus, and public works projects attract considerable attention because
those expenditures generate large Keynesian multiplier effects on the aggregate economy. Third,
state and local governments, the traditional sponsors of much of the infrastructure, are faced with
severe funding constraints that have stimulated a search for new means of paying for future
projects. Finally, the growing interest in “green growth”–the promotion of policies to tackle
environmental degradation and climate change within a framework of sustainable growth–will
result in increased demand for new infrastructure investments, ranging from the retrofitting of
buildings, expansion of the rail network, and development of ‘smart grids’ to improving the
efficiency of electricity generation.
The focus of this paper is an evaluation of some of the new approaches to the financing
of infrastructure projects. They include extension of the Build America bond program that was
introduced in 2009-10, proposals for an infrastructure bank, and public-private partnerships.
However, a central theme of this report is that U.S. infrastructure investments are not limited by
financial market constraints. State and local governments, in particular, can currently obtain
long-term financing at very low rates of interest that are further subsidized through a federal
income tax exemption. Instead, the more basic problem is the distorted nature of the decision-
making process and difficulties of generating future revenue streams sufficient to pay for the
initial capital investment, maintenance and operating costs. The decision-making process is
perverted by an excessive focus on efforts to obtain free federal funding of infrastructure projects
whose benefits are largely local, and the emphasis on new construction results in inadequate
funding of operating costs and timely maintenance. Citizens and their representatives often favor
1

expansion of the infrastructure, but they resist paying for their use of it and fail to undertake the
required maintenance in a timely fashion. As a result, the primary need is to develop a stronger
linkage between the costs of infrastructure projects and the benefits that flow from them. That
means increased reliance on user fees, congestion taxes, and special tax zones as means of
promoting the more efficient utilization of the infrastructure and providing adequate funding.
The paper begins by examining some evidence on basic trends in infrastructure spending
and the adequacy and condition of the stock of U.S. infrastructure. We supplement that with a
consideration of investments in the green economy and the experience of incorporating such
spending within the 2009 federal economic stimulus program. With that assessment of needs as a
background, the primary focus of the paper is on the evaluation of three new financing options
for public infrastructure: Build America bonds, an infrastructure bank, and public-private
partnerships.
Trends in Infrastructure Spending
Much has been made of a large shortfall in the nation’s investment in infrastructure and
perceptions of a serious deterioration in the quality of the existing stock. Yet, the available
evidence seems quite mixed. The most basic source of information is provided by the estimates
of investment and the capital stock that are put together within the national accounts. The
accounts identify federal nondefense investments and those of state and local governments, and
they provide estimates of the stock of publically-owned capital after subtracting an allowance for
depreciation and capital obsolescence. The category of public capital is a bit broader than some
definitions of infrastructure because it includes investments in buildings–such as those for
education, hospitals, and public housing– but it excludes the costs of operating and maintaining
public facilities. At the same time, a focus on public investment ignores the dominant role of the
private sector in areas such as telecommunications, electrical generation and transmission and
other utilities.
Trends in the ratios of public nondefense investment and the capital stock to GDP, all in
prices of 2005, are shown in figure 1 for the period of 1960 to 2010. First, it is noteworthy that
state and local governments are responsible for an overwhelming proportion (85 percent) of
public infrastructure investment, though the federal government does make a financial
contribution through its capital grants to the states. Adjusted for inflation, investment spending
2

peaked as a share of GDP in the 1960s and fell sharply during the 1970s (panel A). The decline
was largely the result of the completion of the interstate highway system and a cycle in the
construction of educational buildings to meet the needs of the baby- boom generation. Since
1980, the rate of public investment has been relatively stable, averaging about 2.5 percent of
GDP. It contrasts with an average of 3.5 percent of GDP during the 1960s. It is also important to
note that investment is measured in constant prices because the cost of construction rose much
faster than that of GDP as a whole during the 2000s. International comparisons are difficult
because of variations in the proportion of infrastructure-type investments that are within the
public sector; however, the share of GDP devoted to infrastructure investments in the United
States is close to the average for the OECD economies (OECD 2011).
The public capital stock reflects the cumulative contribution of past investments, takes
account of depreciation, and provides a better measure of the flow of services. There is more
evidence of a secular fall in the public-sector capital-output ratio (panel B) from the mid-1970s
up to 2000, but the ratio has been quite stable over the last decade. The ratio of infrastructure
capital to GDP has also been constant within the private sector (panel C), where a reduced rate of
capital accumulation in the utilities sector has been offset by the accelerating growth of
telecommunications capital.
Importantly, the above measures of capital investment do not include the costs of
operating and maintaining the infrastructure. The Congressional Budget Office (CBO) has used
data from the Census of Governments to construct their own estimates of infrastructure
investment and the costs of operation and maintenance (O&M) for the period of 1960 to 2007. 1
Their data are limited to public sector investments in transportation and water infrastructure, and
do not include estimates of the stock of capital. The share of total public capital investments
covered by the CBO data has fallen from about 45 percent in 1960 to 30 percent in 2007. The
most important forms of excluded public capital are equipment, buildings, and power; but the
CBO definition is closer to the definition of infrastructure used in most research studies.
The CBO analysis illustrates two important aspects of infrastructure expenditures. First
O&M represents more than half of the total spending on infrastructure, and in some areas, such
as mass transit and aviation, the proportion is two-thirds or greater. Infrastructure systems
1 The latest report was released in November, 2010 and was accompanied by estimates of infrastructure spending covering the period of 1956 through 2007.
3
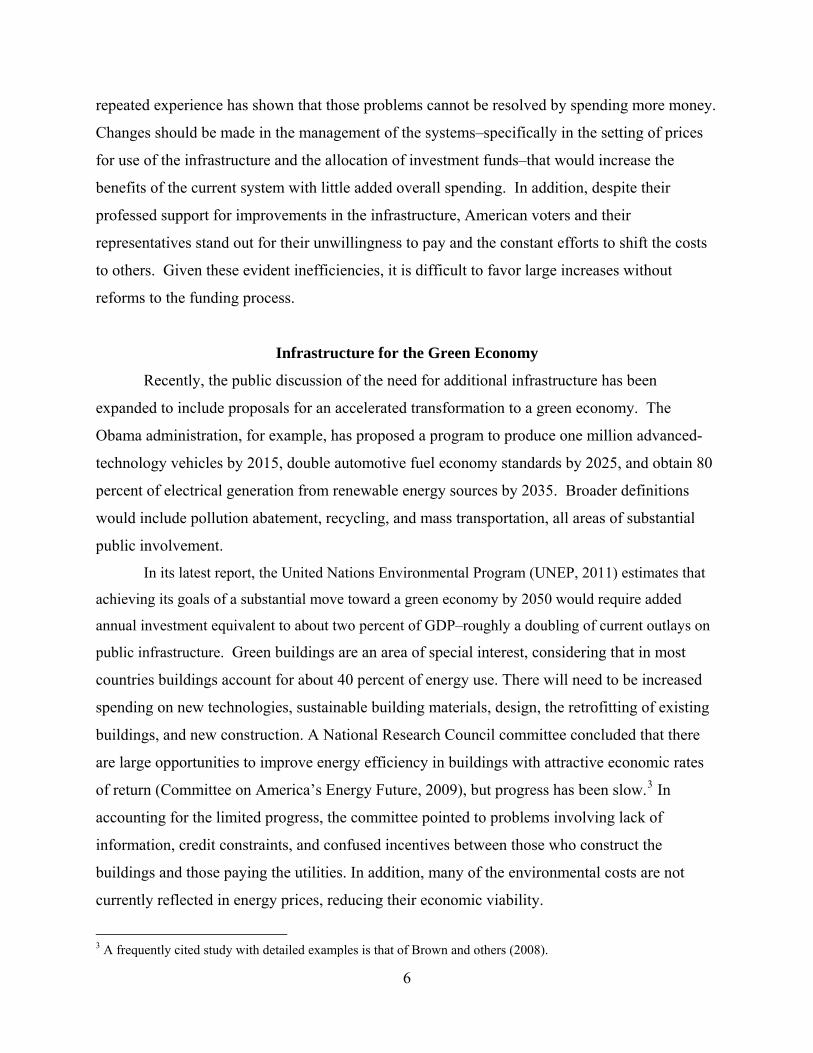
involve much greater costs than just the initial investment to build them. They involve major
commitments to future operating and repair costs that need to be funded on an ongoing basis.
The inclusion of O&M thus highlights a fundamental problem of infrastructure in the United
States: the failure to maintain the investments on a timely and efficient basis. There is an
underlying bias in the funding of infrastructure in that ‘free money’ (federal grants) is available
for new capital investments, but state and local governments must finance the vast bulk of their
own O&M costs.2 Not surprisingly, the result is excess investments in facilities that local
governments are not prepared to maintain. In those cases where federal funding is available for
maintenance, the amounts are limited and beset by perverse incentives. O&M has represented
only 8 percent of total federal grants since 2000. There is a federal program for bridge repair, the
Highway Bridge Program (HPB), but priority is given to states with the worst rating of bridge
conditions–hardly an incentive for timely maintenance.
Second, the CBO data provide stronger evidence of a secular decline in infrastructure
spending, particularly in constant dollars. Total infrastructure spending has fallen from an
average of 4.8 percent of GDP in the 1960s to 2.8 percent in the 2000s (table 1). Since the mid-
1970s the reduced spending has been equally split between investment and O&M, and both
indicate a fall in spending as a share of GDP. Similarly, the share devoted to federal grants has
declined by about half since the 1960s, but the federal government has also cut back on its own
direct outlays (largely in aviation and the work of the Army Corps of Engineers). The data do
not reflect the federal contribution in the form of foregone tax revenue on S&L bond issues.
That cost has been estimated at about $30 billion in recent years. Finally, despite the focus of
discussion on the role of the federal government, the aggregate data in figure 2 highlight the
dominant role of state and local governments and the fact that they account for the largest
reductions in infrastructure spending. Overall, the evidence of reduced expenditures is
strengthened by adopting a narrow definition of infrastructure capital that excludes other forms
of public sector investment. The decline is also greatly magnified in the measures that adjust for
price changes. Construction has long been a sector with a low rate of productivity improvement
and the costs of the basic commodity inputs have risen substantially over the past decade. As a
2 The interstate highway system was built with 90/10 federal/state financing because of its alleged national benefits. Today, most federal grants require a 20 percent state match, but obviously the magnitude of the federal contribution has an enormous influence/distortion in the choice among alternative projects.
4

result, the rate of price increase for infrastructure expenditures has been nearly twice the average
for total GDP.
Other organizations have sought to estimate the magnitude of unmet needs or additional
infrastructure projects that might be justified on the basis of various criteria. For example, the
American Society of Civil Engineers periodically produces a report card in which it draws on a
large number of other studies that assess investment needs across 12 categories of investment
needs. Its 2009 report, summarized in table 2, estimated a shortfall in infrastructure relative to
needs as large as actual investment, suggesting a need to double current rates of investment. It is
not evident, however, how some of the estimates of investment needs are constructed. In
particular, it is not clear that the proposed levels of investment were based on standard cost-
benefit analysis. A narrower study by CBO (2008, p. 8), limited to transportation infrastructure,
suggested that spending should be increased by 20 percent to maintain current levels of service,
and a standard of economically-justifiable would support an expenditure increase of 75 percent.
The CBO study, however, noted that the estimates of justifiable expenditures did not incorporate
the effect of efforts to increase the efficiency of transportation expenditures through increased
reliance on user fees and congestion pricing.
There is widespread agreement that investments in the public infrastructure offer
substantial benefits to the economy as a whole. However, due to their diffuse nature and the
substantial role of externalities, the measurement of the precise value of those benefits has
generated major controversy. The research results vary widely in the implied rate of return,
depending upon the specific source of data and the time period. The most recent overview
studies conclude that rates of return are equivalent or better than those for private investments
(Fernald, 1999; Gramlich, 1994).
On balance, there is significant evidence of inadequate levels of infrastructure in the
United States, but the studies have also demonstrated that much of the problem lies with the
process by which the United States makes decisions on funding and system management: its
failures to use cost-benefit analysis to assign funds to those projects with the highest returns, a
bias against funding of maintenance for existing systems, a political process that spreads the
expenditures across jurisdictions regardless of needs, and an unwillingness to charge users in line
with the benefits that they receive (Winston, 2010). The condition of the transportation system
has deteriorated somewhat, but the most costly aspects are linked with increased congestion; and
5
repeated experience has shown that those problems cannot be resolved by spending more money.
Changes should be made in the management of the systems–specifically in the setting of prices
for use of the infrastructure and the allocation of investment funds–that would increase the
benefits of the current system with little added overall spending. In addition, despite their
professed support for improvements in the infrastructure, American voters and their
representatives stand out for their unwillingness to pay and the constant efforts to shift the costs
to others. Given these evident inefficiencies, it is difficult to favor large increases without
reforms to the funding process.
Infrastructure for the Green Economy
Recently, the public discussion of the need for additional infrastructure has been
expanded to include proposals for an accelerated transformation to a green economy. The
Obama administration, for example, has proposed a program to produce one million advanced-
technology vehicles by 2015, double automotive fuel economy standards by 2025, and obtain 80
percent of electrical generation from renewable energy sources by 2035. Broader definitions
would include pollution abatement, recycling, and mass transportation, all areas of substantial
public involvement.
In its latest report, the United Nations Environmental Program (UNEP, 2011) estimates that
achieving its goals of a substantial move toward a green economy by 2050 would require added
annual investment equivalent to about two percent of GDP–roughly a doubling of current outlays on
public infrastructure. Green buildings are an area of special interest, considering that in most
countries buildings account for about 40 percent of energy use. There will need to be increased
spending on new technologies, sustainable building materials, design, the retrofitting of existing
buildings, and new construction. A National Research Council committee concluded that there
are large opportunities to improve energy efficiency in buildings with attractive economic rates
of return (Committee on America’s Energy Future, 2009), but progress has been slow.3 In
accounting for the limited progress, the committee pointed to problems involving lack of
information, credit constraints, and confused incentives between those who construct the
buildings and those paying the utilities. In addition, many of the environmental costs are not
currently reflected in energy prices, reducing their economic viability.
3 A frequently cited study with detailed examples is that of Brown and others (2008).
6
Efforts to promote a green economy movement have also generated interest in high-speed
rail networks because of their energy saving. For example, on a per passenger mile basis, the
Shinkansen trains in Japan are estimated to use one quarter the energy of airplanes and one sixth
the energy of private automobiles. A University of Pennsylvania study argued that a new high-
speed line in the Northeast Corridor would divert nearly 30 million riders from cars and planes,
attract 6 million new riders, and still reduce car emission of carbon monoxide by more than 3
million tons annually, even if powered by electricity from the current energy mix (Todorovich et
al., 2011). The study also conducted a cost-benefit analysis of the project, finding a 1.7 benefit-
cost ratio. However, most of the benefits are in the form of reduced congestion and other
externalities, rather than direct receipts, and the system cannot be built without substantial
subsidy.
The transition to a greener economy is likely to require substantial amounts of added
public outlays either because the basic investments fall within the public domain or because of
substantial public subsidy to make them economically viable. The most efficient approach
would involve substantial increases in the price of carbon as the primary inducement to promote
the use of the new technologies, but that encounters substantial public opposition, and the
government seems committed to a heavy reliance on fossil fuel subsidies and tax preferences.
Infrastructure and Fiscal Stimulus
Some observers argue that current high levels of unemployment and economic slack
provide a low-cost opportunity to invest in infrastructure projects. Normally, fiscal stimulus
measures need to be timely, targeted, and temporary, but given the anticipated duration of the
economic downturn, the temporary aspect seems somewhat less controlling. These circumstances
provide an opportunity for increased investment in public infrastructure, and specifically green
economy projects, which tend to be implemented at a slower rate, but provide a bigger multiplier
effect.
The broad outlines of the ARRA stimulus program are shown in table 3, together with
estimates of spending through the first quarter of 2011. About 40 percent of the funds were
allocated to tax cuts and transfers to individuals, and an equal amount was appropriated for a
broad range of public investment programs. The remainder was directed to fiscal relief for the
states. Both tax cuts and transfer payments to persons can be quickly implemented, but they are
7

believed to have relatively smaller multiplier effects than direct spending programs since a
substantial amount of the money is likely to be used to pay down existing debts or saved against
future contingencies. In its evaluation of the program, the Council of Economic Advisors used
an expenditure multiplier of 1.4 at the end of the first year and 1.6 by the end of the second year
for direct outlays (CEA, 2010). The corresponding GDP multipliers for taxes and transfers were
0.7 and 1.0.
As part of the stimulus package, the ARRA allocated $90 billion in funds to green
infrastructure investments in the form of grants, loan guarantees, and tax credits—largely for
renewable energy and energy efficiency (CEA, 2nd Quarterly Report). Programs to retrofit
existing public and private buildings for greater energy efficiency (which create jobs quickly but
can be phased out as the economy recovers), do meet the criteria of timely, targeted and
temporary; but other projects, such as research and development, will need to be carried out over
a longer-term horizon.
As expected, the tax and transfer portions of the program funds were distributed quite
rapidly and they were largely spent by the end of 2010 (figure 3). The state fiscal relief was also
largely paid out within the first two years. However, the expenditure of funds for public
investments ($315 billion) has gone more slowly. Only 15 percent of the funds were spent in
2009, and the total was still below 50 percent at the end of 2010. The program reported a total of
about $62 billion in appropriations in the departments of Energy and Transportation that were
classified as green.4 Only 25 percent of those funds had been dispersed by the end of 2010 and
one-third was spent by March of 2011.5 The low spend-out is dominated by the inclusion of a
R&D program for energy and high speed rail corridors within transportation, but other large
programs in energy efficiency and mass transit also have encountered significant lags. In
summary, only a narrow category of green infrastructure projects are likely to be compatible
with countercyclical fiscal policies. Perhaps building retrofits can be mobilized more rapidly in
the future, having had the benefit of the ARRA program, but much of the spending for a green
economy would still have to be classified as long-term outlays for R&D. Therefore, it is
important to consider other means, aside from stimulus, through which to finance and fund
public infrastructure and especially green projects.
4 We excluded $26 billion in highway infrastructure for which only a small portion was considered green. 5 The spend-out percentage was 42 percent in late September, 2011.
8

Financial Innovations
Driven by the belief that the U.S. infrastructure is inadequate, many organizations have
become advocates of increased spending. But in a period of strong opposition to tax increases,
they have sought means of accomplishing that goal outside of the standard budget processes. In
particular, there has been increased interest in three proposals for changing the mechanisms for
financing infrastructure projects: (1) changes in the structure of bond financing, (2) creation of a
national infrastructure bank, and (3) public-private partnerships for the construction and
management of future infrastructure projects.
Build America Bonds
The federal government has long exempted interest income earned on state and local
bonds from income taxation. The exemption is estimated to cost the federal government as much
as $30 billion annually; and within a progressive tax system those costs exceed the interest
saving of the issuing governments.6 The exemption has helped promote a large and active
market in municipal bonds, but the excessive cost to the federal government has long been
recognized; it has led to suggestions that it would be more efficient to replace the tax exemption
with a direct subsidy payment to issuing sub-governments. However, those governments have
consistently opposed replacement of the tax exemption with a direct subsidy payment because of
concerns that budget pressures would ultimately result in a reduction or elimination of future
payments.
The cost of the tax exemption to the federal government has been a topic of considerable
research. The standard assumption was that holders of tax-exempt bonds would shift to table
bonds if the tax preference were eliminated. Thus, the interest differential between tax-exempt
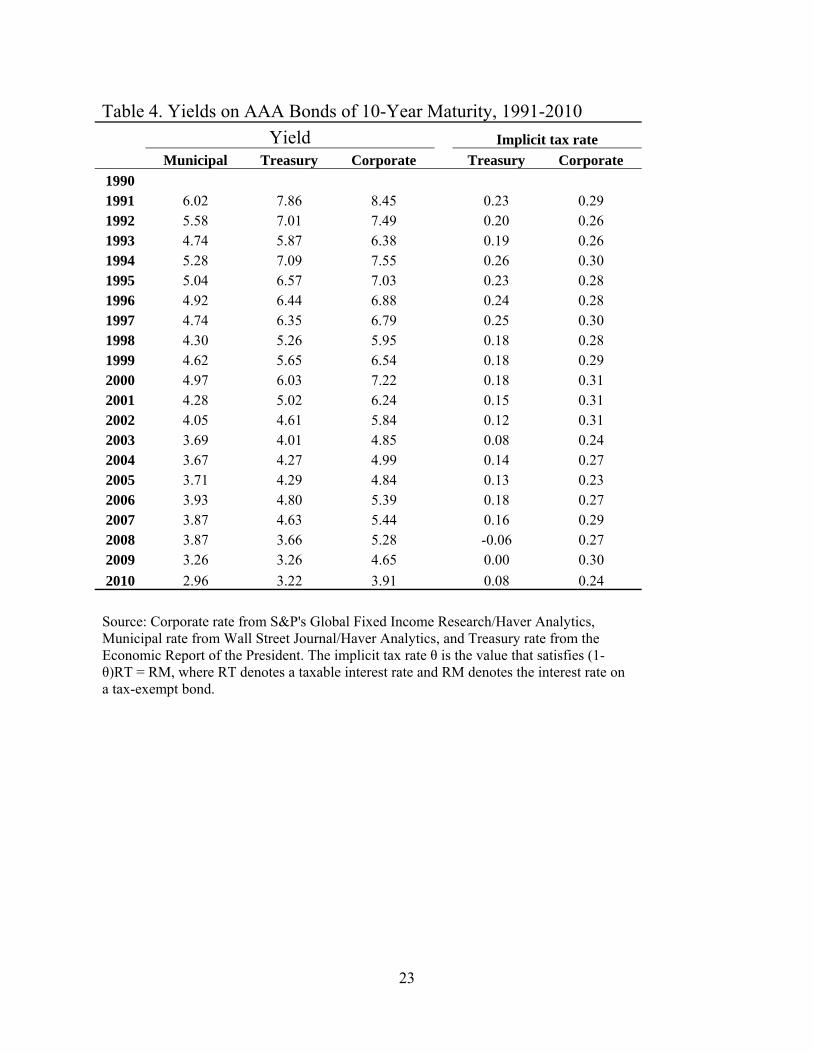
and taxable bonds would be determined by the tax rate of the marginal investor.7 Table 4 shows
annual average yields on AAA municipal, U.S. Treasury, and AAA corporate bonds with ten-
year maturities. An implicit estimate of the tax rate of the marginal investor is given by the
average yield differential between taxable bonds and tax exempt. The implicit rate between
6 The $30 billion estimate is from the tax expenditures published annually in the Analytical Perspectives: Budget of the U.S. Government (OMB, 2011). The exemption is inefficient because investors in tax brackets above that of the marginal investor obtain tax savings in excess to the lower interest costs to the issuing governments. 7An implicit measure of the effective tax rate θ is the value that satisfies (1-θ)·RT = RM, where RT denotes a taxable interest rate and RM the interest rate on a tax-exempt bond of comparable risk.
9
municipals and the treasury rate (column 3) is quite variable, presumably because of varying
perceptions of the risk premium: the differential actually turned negative in 2008 and 2009. In
contrast, the differential relative to the corporate rate (column 4), which is more equivalent in its
risk characteristics, is more stable and consistent with a tax rate of about 28 percent, but there is
significant short-run variation around the long-run average.
Researchers have pointed out, however, that investors have many other choices with tax
preferences nearly as large as those of taxable bonds. Hence, the standard analysis may overstate
the cost to the federal government and the savings of S&L government issuers. Poterba and
Verdugo (2008) reexamine the issues within a broad context of other tax-favored investments
and provide a survey of previous research. They conclude that the cost is about ½ to ⅔ of the
estimate based on a simple substitution with taxable bonds. They argue that some of the
volatility that they observe in the rate may be due to a narrowing of the market for tax-exempt
bonds or changes in investor perception of their relative riskiness.
The 2008-09 financial crisis severely disrupted the traditional market for tax-exempt
bonds, and it led to the creation of a new program by which the federal government provided a
direct subsidy payment to the bond issuer equal to 35 percent of the interest cost.8 Because these
Build America Bonds (BABs) were fully taxable, they appealed to a much broader investor
market of private pension funds and investors with lower effective tax rates. Over the two years
in which the program was in effect, S&L governments issued $180 billion in new bonds. A
Treasury study found that the broadening of the market resulted in interest savings to the issuers
beyond the value of the subsidy (U.S. Treasury, 2011). It concluded that the present value of the
net savings to issuers equaled $20 billion. That is much greater than the net cost (subsidy
payments minus tax saving) to the federal government.
The Obama administration has proposed to extend the BABs program in future years, but
with a smaller interest subsidy of 28 percent, which would be relatively budget-neutral.9 No
effort is made to eliminate the alternative of tax-exempt issues, but the initial program suggested
that issuing sub-governments were attracted by the broader market for taxable bonds and the
direct receipt of the interest subsidy. Their response to a future program with a smaller direct
8 The program also provided for payment to the bond holder in the form of a tax credit, but the provision was seldom utilized. 9 The Joint Tax Committee’s analysis concluded that the subsidy payments would exceed the tax saving to the federal government by about 10 percent.
10

payment, however, is unknown. On balance, the bond program appears to be a more efficient
means conveying a subsidy to state and local governments, and the proposal for a permanent
program has generally received favorable evaluations.
National Infrastructure Bank
One major aspect of the Administration’s proposed American Jobs Act is the creation of
a national infrastructure bank (NIB). The idea also has considerable support in the Congress
with bipartisan bills in both the Senate and House of Representatives.10 The Administration
version proposes a large-scale restructuring of the federal support for infrastructure spending,
with the bank taking over many of the responsibilities for allocating federal grants and loan
guarantees. The Congressional proposals have more modest objectives: the bank would have
limited access to budgetary funds beyond an initial capitalization and it would operate largely
through the extension of various forms of government guarantees.
Given that S&L governments already have access to low-cost tax-favored borrowing, an
infrastructure bank is not really an attractive financial innovation in the U.S. context. Because of
the size and liquidity of its municipal bond market, the U.S. situation is different from that of
other countries that have used infrastructure banks as a means of providing sub-governments
with access to financial markets. It is difficult to see how the NIB could function as a lender
except by offering subsidies in excess of those implied by tax-exempt bonds. Yet, it will face a
cost of funds that normally exceeds the tax-exempt rate. Thus, it is hard to visualize the NIB
operating as a bank making loans to S&L governments, unless it envisions limiting S&L access
to the market for tax-exempt municipals. It might be able to compete with private lending
sources because, even if it renounced the notion of an explicit federal guarantee, investors will
attach an implicit guarantee to its activities–as occurred with the government-sponsored agencies
in the mortgage market. Yet, past experience suggests that implicit guarantees have a substantial
probability of becoming real costs.
Instead, the proposed infrastructure bank should be viewed as an alternative mechanism
for managing the federal government’s own infrastructure investments and distributing federal
subsidies to the various sub-governments. Thus, the NIB is often part of proposals whose real
significance lies in changes in the formulae for distributing the federal dollars. Insulated from
10 The Senate proposal is sponsored by Senators Kerry, Hutchinson, NS Warner, and the House proposal is entitled “the National Infrastructure Development Bank Act.”
11
congressional influence, an independent bank might be able to allocate funds on merit or a
criteria-based system. In addition, it might be possible to increase total expenditures on
infrastructure by reducing the percentage magnitude of the federal cost share so as to spread the
funds over a larger number of projects. However, the proposal would be effective in increasing
total outlays only if it induces sub-governments to expand the magnitude of their contributions.
Sub-governments may allocate their funds more efficiently when they have to pay a larger share
of project costs–reducing the implicit treatment of the federal contribution as free money. The
NIB could be a vehicle of introducing more effective management of the federal contribution to
infrastructure spending, but most of the reforms could be implemented independently of the
bank.
Public-Private Partnerships (PPPs)
Advocates of public-private partnerships for infrastructure projects view them as
relieving some of the financial pressures on state and local governments, but the primary
objective is to improve the management of the projects by combining initial investment decisions
with responsibility for future costs of operation and maintenance. PPPs can vary substantially
from relatively simple long-term supply contracts to turning over to a private entity the
responsibility to build, operate and maintain a facility. Most commonly, the private entity
recoups its costs through user fees. The bundling of investment and O&M is expected to
increase efficiency by incorporating operational concerns in the initial design, and the necessity
of recovering costs imposes a strong fiscal discipline. A private contract to operate a facility
may also offer a degree of separation of politicians from a decision to raise tolls or user fees. An
extensive discussion of public–private partnerships in transportation can be found in a
Department of Transportation study (USDOT, 2004)
PPPs are extensively used to build and manage infrastructure projects in Europe, but they
have been less popular in the United States. In part, that reflects the favorable financial position
of U.S. sub-governments who can make use of tax-exempt bond financing, an option not
generally available in Europe. In addition, many state governments prefer to delay projects until
they can obtain access to federal subsidies (grants). While it is not impossible for PPPs to
qualify for both tax-exempt financing and federal grants, both features limit their appeal.11
11 Tax-exempt Private Activity Bonds, sponsored by the Department of Transportation, can be issued by public entities to finance private projects that are deemed to be in the public interest.
12
Private sector managers also must pay federal taxes and provide for a significant equity return.
Moreover, there is a public suspicion of such arrangements because in the past they have been
proposed as a means of auctioning off future project revenues in exchange for a large onetime
payment to the benefit of current political incumbents.
Certain private-sector efficiencies of PPPs might offset their higher cost of capital. The
integration of the initial investment and O&M does lead to some design efficiencies, and private-
sector managers are more successful in managing the revenue side of the operation, overcoming
political objections to increases in user fees and congestion charges. PPPs in transportation,
however, have generally not achieved significant operating efficiencies. Fundamentally, a PPP
is simply the payment of a lump-sum to the public entity in exchange for the stream of future
revenues. Since a public entity engages in the same exchange through the issuance of bonds, it is
not obvious that PPPs increase the total availability of funds for infrastructure investments. They
are attractive in situations where the public entity is constrained in its ability to issue new debt,
but that is not common for projects that differ only in their financing options. A more significant
advantage is likely to be the removal of political considerations from the day-to-day management
of the facility.
The negotiation of PPP contracts that balance public and private concerns in a transparent
fashion can be quite complex. Many infrastructure projects are very long-lived and estimates of
future revenues can be quite uncertain. Mistakes are bound to be made, and provisions must be
made for revisions that are fair to both sides. Most projects will be quasi-monopolies where
market competition can offer limited guidance. Engel, Fischer, and Galetovic (2011) discuss a
large number of these concerns and outline a number of broad principles that they believe should
guide those decisions. Still PPPs have only a limited appeal in the U.S. context, and their record
has been quite mixed to date (CBO, 2008; and US GAO, 2008)).
Overview
The United States has experienced a slowing of infrastructure spending in recent decades,
and there is a strong public perception that the quality of the infrastructure has deteriorated.
Those concerns have been joined recently by the advocacy of increased spending to speed the
convergence to a more energy-efficient green economy, a prospect that would have strong
parallels with the provision of public infrastructure. As a result, spending on infrastructure and
13
the green economy has emerged as a potential target for additional fiscal stimulus as the United
States struggles to recover from a depressed economic situation. The discussion has also given
rise to considerations of several new financial innovations aimed at the expansion of
infrastructure spending on a longer-term basis.
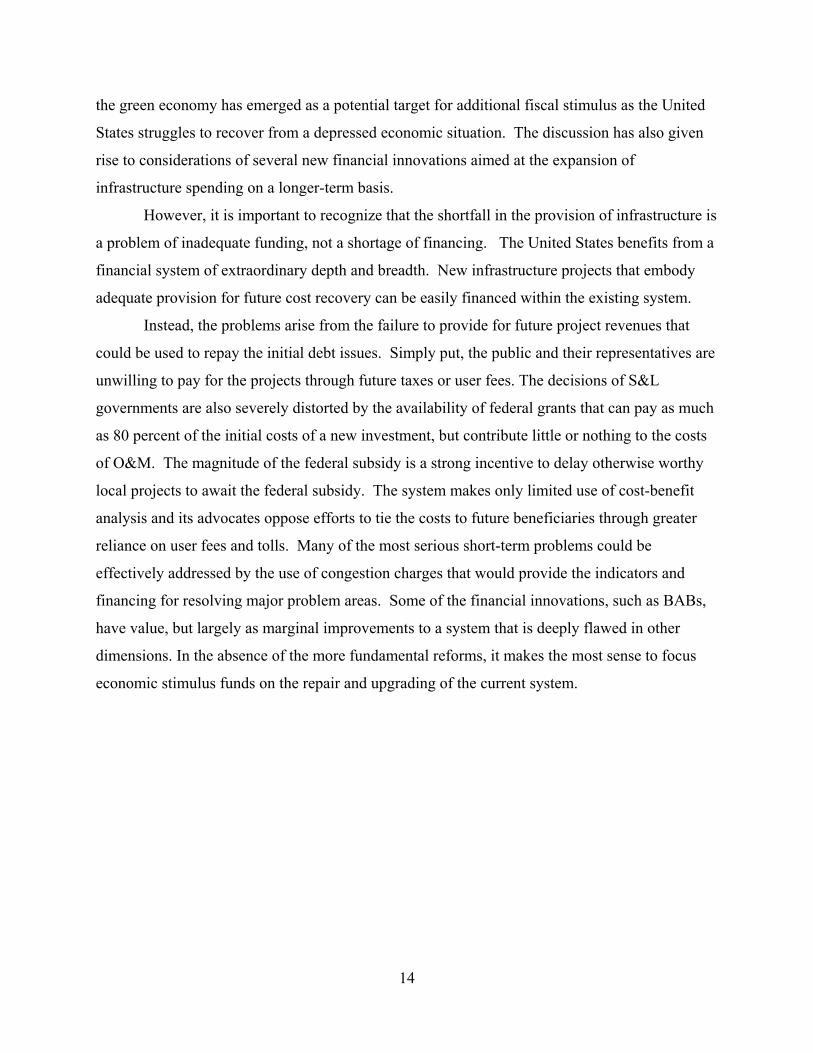
However, it is important to recognize that the shortfall in the provision of infrastructure is
a problem of inadequate funding, not a shortage of financing. The United States benefits from a
financial system of extraordinary depth and breadth. New infrastructure projects that embody
adequate provision for future cost recovery can be easily financed within the existing system.
Instead, the problems arise from the failure to provide for future project revenues that
could be used to repay the initial debt issues. Simply put, the public and their representatives are
unwilling to pay for the projects through future taxes or user fees. The decisions of S&L
governments are also severely distorted by the availability of federal grants that can pay as much
as 80 percent of the initial costs of a new investment, but contribute little or nothing to the costs
of O&M. The magnitude of the federal subsidy is a strong incentive to delay otherwise worthy
local projects to await the federal subsidy. The system makes only limited use of cost-benefit
analysis and its advocates oppose efforts to tie the costs to future beneficiaries through greater
reliance on user fees and tolls. Many of the most serious short-term problems could be
effectively addressed by the use of congestion charges that would provide the indicators and
financing for resolving major problem areas. Some of the financial innovations, such as BABs,
have value, but largely as marginal improvements to a system that is deeply flawed in other
dimensions. In the absence of the more fundamental reforms, it makes the most sense to focus
economic stimulus funds on the repair and upgrading of the current system.
14
References
American Society of Civil Engineers. 2009. 2009 Report Card for America’s Infrastructure (March). Available at: www.asce.org/reportcard.
Brown, Rich, S. Borgeson, J. Koomey, and P. Bremayer. 2008. “U.S. Building-Sector Energy Efficiency Potential,” Berkeley, Calif.: Lawrence Berkeley National Laboratory.
Committee on America's Energy Future; National Academy of Sciences; National Academy of Engineering; National Research Council. 2009. America's Energy Future: Technology and Transformation’
Congressional Budget Office. 2008. Issues and Options in Infrastructure Investment (May).
Congressional Budget Office. 2010. Public Spending on Transportation and Water Infrastructure (November).
Council of Economic Advisors, 2009. “Estimates of Job Creation from the American Recovery and Reinvestment Act of 2009,” (May). Available at: http://www.whitehouse.gov/administration/eop/cea/Estimate-of-Job-Creation
Engel, Eduardo, Ronald Fischer, and Alexander Galetovic. 2011. “Public-Private Partnerships to Revamp U.S. Infrastructure. Discussion Paper No. 2011-02 (February), the Hamilton Project at the Brookings Institution.
Fernald, John. 1999. “Roads to Prosperity? Assessing the Link Between Public Capital and Productivity,” American Economic Review, vol.89,no. 3: 619-38.
Gramlich, Edward. 1994. “Infrastructure Investment: A Review Essay,” Journal of Economic Literature, vol. 32 (September):1176-96.
OECD. 2011. Economic Policy Reforms 2011: Going for Growth, OECD Publishing. http://dx.doi.org/10.1787/growth-2011-en
Office of Management and the Budget. 2011. Analytical Perspectives: Budget of the U.S. Government, Fiscal Year 2012. Available at: http://www.whitehouse.gov/sites/default/files/omb/budget/fy2012/assets/spec.pdf
Poterba, James, and Arturo Ramirez Verdugo. 2011. “Portfolio Substitution and the Revenue Cost of the Federal Income Tax Exemption for State and Local Government Bonds,” National Tax Journal, vol. 64, 2, part 2 (June): 591-614.
Todorovich, Petra, Daniel Schned, and Robert Lane. 2011. “High-Speed Rail: International Lessons for U.S. Policy Makers,” Lincoln Institute of Land Policy Focus Report. http://www.lincolninst.edu/pubs/1948_High-Speed-Rail
United Nations Environment Program. 2011. “Towards a Green Economy: Pathways to Sustainable Development and Poverty Eradication - A Synthesis for Policy Makers.” www.unep.org/greeneconomy
United States Department of Transportation, Report to Congress on Public–Private Partnerships (December 2004), available at: www.fhwa.dot.gov/reports/pppdec2004/index.htm.
15

United States Government Accountability Office, Highway Public–Private Partnerships: More Rigorous Up-front Analysis Could Better Secure Potential Benefits and Protect the Public Interest, GAO-08-44 (February 2008).
United States Treasury. 2011. “Treasury Analysis of Build America Bonds Issuance and Savings,” (May 16). Available at: http://www.treasury.gov/initiatives/recovery/Documents/BABs%20Report.pdf
University of Pennsylvania. 2010. Making high-speed rail work in the northeast megaregion: High-speed rail studio final report. Philadelphia: University of Pennsylvania School of Design, Department of City and Regional Planning. http://studio.design.upenn.edu/hsr/node/81
Winston, Clifford. 2010. Last Exit: Privatization and Deregulation of the U.S. Transportation System. Washington D.C.: the Brookings Institution Press.
16
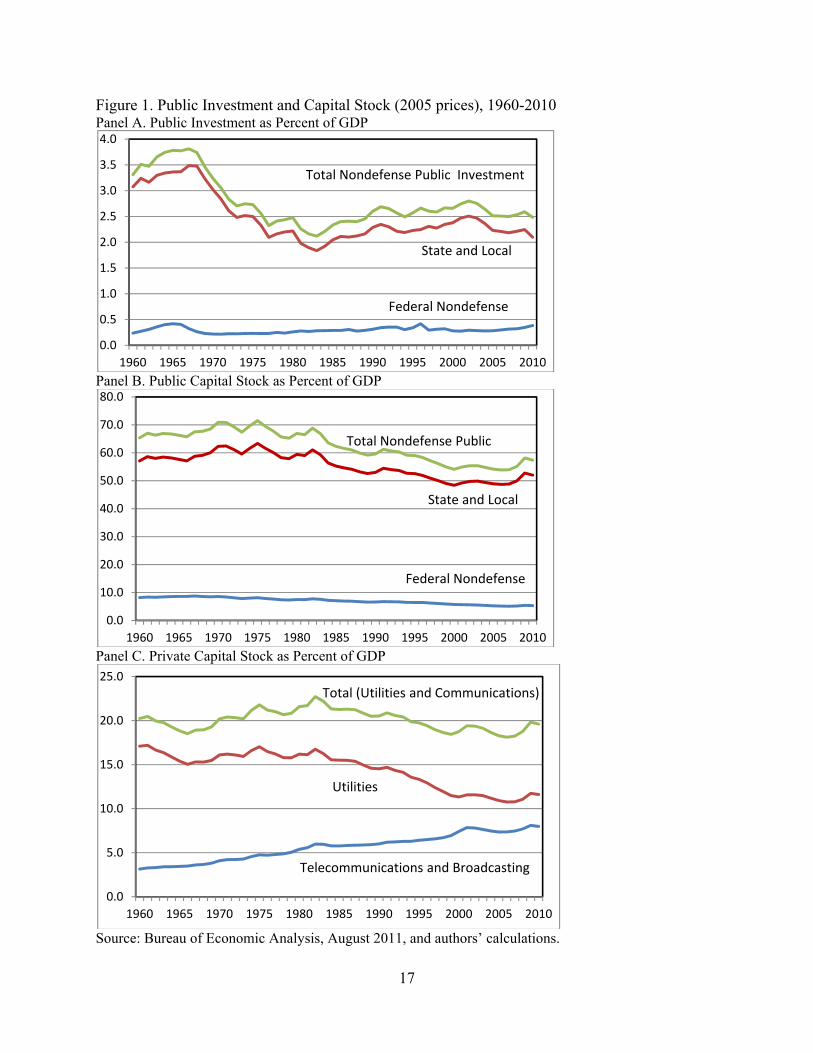
Figure 1. Public Investment and Capital Stock (2005 prices), 1960-2010 Panel A. Public Investment as Percent of GDP
Panel B. Public Capital Stock as Percent of GDP
0.0
0.5
1.0
1.5
2.0
2.5
3.0
3.5
4.0
1960 1965 1970 1975 1980 1985 1990 1995 2000 2005 2010
Total Nondefense Public Investment
State and Local
Federal Nondefense
Panel C. Private Capital Stock as Percent of GDP
0.0
10.0
20.0
30.0
40.0
50.0
60.0
70.0
80.0
1960 1965 1970 1975 1980 1985 1990 1995 2000 2005 2010
Total Nondefense Public
State and Local
Federal Nondefense
Source: Bureau of Economic Analysis, August 2011, and authors’ calculations.
0.0
5.0
10.0
15.0
20.0
25.0
1960 1965 1970 1975 1980 1985 1990 1995 2000 2005 2010
Telecommunications and Broadcasting
Utilities
Total (Utilities and Communications)
17
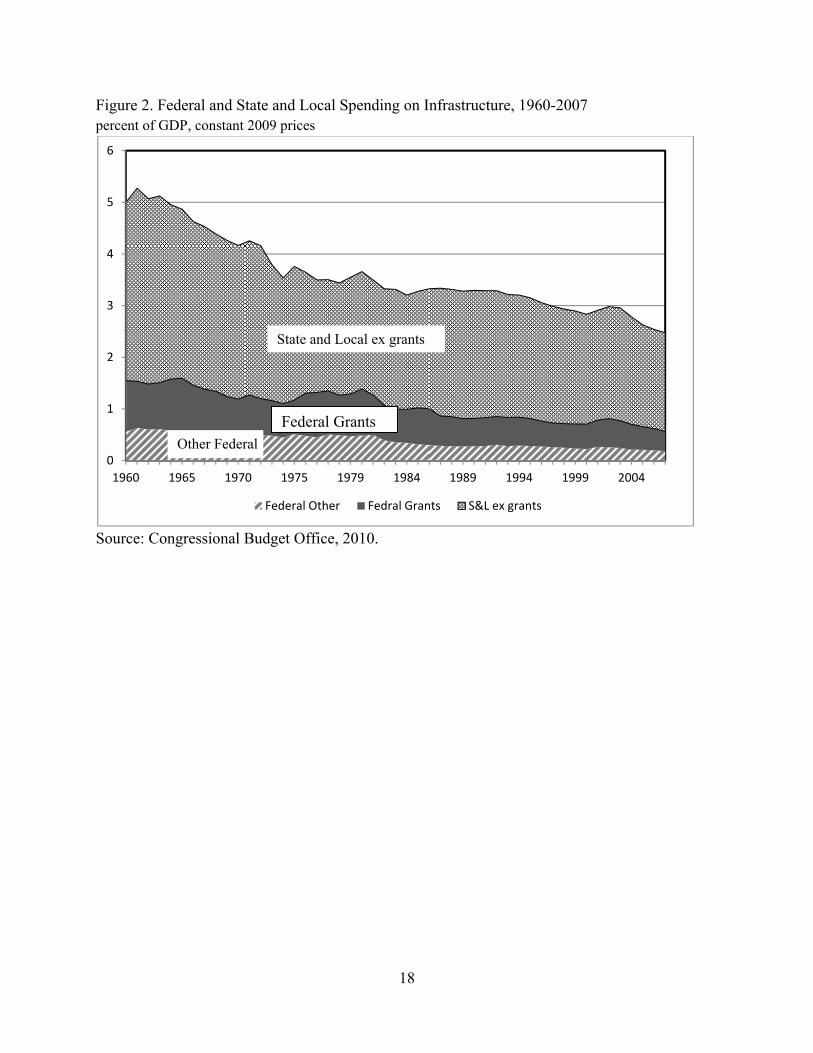
Figure 2. Federal and State and Local Spending on Infrastructure, 1960-2007 percent of GDP, constant 2009 prices
0
1
2
3
4
5
6
1960 1965 1970 1975 1979 1984 1989 1994 1999 2004
Federal Other Fedral Grants S&L ex grants
Other Federal
State and Local ex grants
Federal Grants
Source: Congressional Budget Office, 2010.
18

Table 1. Infrastructure Investment by Federal, State and Local government, 1960-2007 Percent of GDP, constant prices
All categories 1960-69 1970-79 1980-89 1990-99 2000-07
Percent Change between 1960s
and 2000s Total 4.8 3.7 3.3 3.1 2.8 -42.2 Investment 2.9 2.0 1.6 1.5 1.3 -54.5 O&M 1.9 1.8 1.8 1.6 1.4 -22.9
Federal Total 1.5 1.2 1.0 0.8 0.7 -52.0 Investment 1.2 0.9 0.7 0.6 0.5 -56.2 O&M 0.3 0.3 0.3 0.2 0.2 -33.0
Fedral Grants Total 0.9 0.8 0.7 0.5 0.5 -47.5 Investment 0.9 0.7 0.6 0.5 0.4 -50.7 O&M 0.0 0.0 0.0 0.0 0.0 286.9
Federal Other Total 0.5 0.5 0.3 0.3 0.2 -59.5 Investment 0.3 0.2 0.1 0.1 0.1 -72.8 O&M 0.3 0.3 0.2 0.2 0.1 -43.9
State and Local Total 4.2 3.3 3.0 2.8 2.5 -40.0 Investment 2.6 1.8 1.4 1.4 1.2 -52.5 O&M 1.6 1.5 1.6 1.4 1.3 -19.6
State and Local (ex grants) Total 3.3 2.5 2.3 2.3 2.1 -37.9 Investment 1.7 1.1 0.8 0.9 0.8 -53.4 O&M 1.6 1.5 1.5 1.4 1.3 -21.3 Source: Congressional Budget Office, 2010.
19

Table 2. Estimated 5-Year Investment Needs in Billions of Dollars
Category 5-Year Need
(billions)
Estimated Actual
Spending*
American Recovery and
Reinvestment Act (P.L. III-005)
5-Year Investment Shortfall
Aviation 87 45 1.3 -40.7 Dams 12.5 5 0.05 -7.45 Drinking Water and Wastewater 255 140 6.4 -108.6 Energy 75 34.5 11 -29.5 Hazardous Waste and Solid Waste 77 32.5 1.1 -43.4 Inland Waterways 50 25 4.475 -20.5 Levees 50 1.13 0 -1.13 Public Parks and Recreation 85 36 0.835 -48.17 Rail 63 42 9.3 -11.7 Roads and Bridges 930 351.5 27.5 -549.5 Discretionary grants for surface transportation 1.5 Schools 160 125 0.** -35 Transit 265 66.5 8.4 -190.1 Total 2.122 trillion *** 903 billion 71.76 billion -1.176 trillion Source: 2009 Report Card for America's Infrastructure from the American Society of Civil Engineers. * 5 year spending estimate based on the most recent available spending at all levels of government and not indexed for inflation ** The ARRA included $53.6 billion for a State Fiscal Stabilization Fund for education, but when the report card was released it was not known how much would be spent on education infrastructure. ***Not adjusted for inflation
20

Table 3. Appropriations and Outlays of the American Recovery and Reinvestment Act, 2009-2011 Appropriations Outlays Through the end of
Category Cost (billions) 2009:Q4
(December) 2010:Q4
(December) 2011:Q1 (March)
Individual and Business Tax Cuts 248.4 102.4 259.2 288.8 State Fiscal Relief 140.7 59.3 121.7 126.1 Aid to Individuals 84.6 55.2 86.0 89.5 Public Investment Outlays 315.0 41.6 141.6 161.9 Green Investment Outlays 61.8 3.4 16.3 19.7 Other Public Investment Outlays 253.2 38.2 125.3 142.2 Total 788.6 258.5 608.5 666.3
Source: Outlays come from the Council of Economic Advisors' Economic Impact of the ARRA Seventh Quarterly Report. Appropriations come from the breakdown of spending as listed in the New York Times based on estimates by House and Senate committees and the CBO. Green estimates come from the Economic Policy Institute's Rebuilding Green Report and Department of Energy and Department of Transportation Weekly Financial and Activity Reports.
21
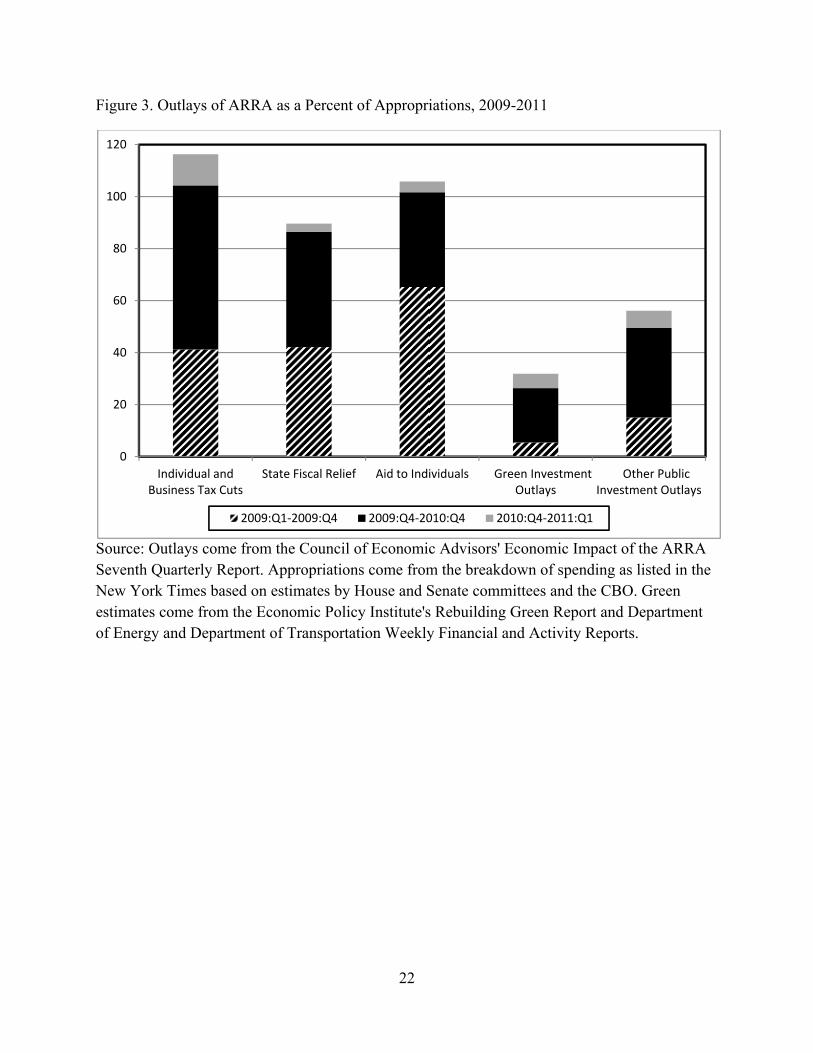
Figure 3. Outlays of ARRA as a Percent of Appropriations, 2009-2011
Source: Outlays come from the Council of Economic Advisors' Economic Impact of the ARRA Seventh Quarterly Report. Appropriations come from the breakdown of spending as listed in the New York Times based on estimates by House and Senate committees and the CBO. Green estimates come from the Economic Policy Institute's Rebuilding Green Report and Department of Energy and Department of Transportation Weekly Financial and Activity Reports.
0
20
40
60
80
100
120
Individual and Business Tax Cuts
State Fiscal Relief Aid to Individuals Green Investment Outlays
Other Public Investment Outlays
2009:Q1‐2009:Q4 2009:Q4‐2010:Q4 2010:Q4‐2011:Q1
22
23
Table 4. Yields on AAA Bonds of 10-Year Maturity, 1991-2010 Yield Implicit tax rate
Municipal Treasury Corporate Treasury Corporate 1990 1991 6.02 7.86 8.45 0.23 0.29 1992 5.58 7.01 7.49 0.20 0.26 1993 4.74 5.87 6.38 0.19 0.26 1994 5.28 7.09 7.55 0.26 0.30 1995 5.04 6.57 7.03 0.23 0.28 1996 4.92 6.44 6.88 0.24 0.28 1997 4.74 6.35 6.79 0.25 0.30 1998 4.30 5.26 5.95 0.18 0.28 1999 4.62 5.65 6.54 0.18 0.29 2000 4.97 6.03 7.22 0.18 0.31 2001 4.28 5.02 6.24 0.15 0.31 2002 4.05 4.61 5.84 0.12 0.31 2003 3.69 4.01 4.85 0.08 0.24 2004 3.67 4.27 4.99 0.14 0.27 2005 3.71 4.29 4.84 0.13 0.23 2006 3.93 4.80 5.39 0.18 0.27 2007 3.87 4.63 5.44 0.16 0.29 2008 3.87 3.66 5.28 -0.06 0.27 2009 3.26 3.26 4.65 0.00 0.30 2010 2.96 3.22 3.91 0.08 0.24
Source: Corporate rate from S&P's Global Fixed Income Research/Haver Analytics, Municipal rate from Wall Street Journal/Haver Analytics, and Treasury rate from the Economic Report of the President. The implicit tax rate θ is the value that satisfies (1-θ)RT = RM, where RT denotes a taxable interest rate and RM denotes the interest rate on a tax-exempt bond.