
Innovation, Science and Economic Development Canada · Minister of Small Business and Tourism and...
61
Innovation, Science and Economic Development Canada 2016–17 Departmental Results Report The Honourable Navdeep Bains, P.C., M.P. Minister of Innovation, Science and Economic Development ________________________________________________ The Honourable Kirsty Duncan, P.C., M.P. Minister of Science ________________________________________________ The Honourable Bardish Chagger, P.C., M.P. Minister of Small Business and Tourism and Leader of the Government in the House of Commons
Transcript of Innovation, Science and Economic Development Canada · Minister of Small Business and Tourism and...

Innovation, Science and Economic Development Canada
2016–17
Departmental Results Report
The Honourable Navdeep Bains, P.C., M.P. Minister of Innovation, Science and Economic Development
________________________________________________ The Honourable Kirsty Duncan, P.C., M.P. Minister of Science
________________________________________________ The Honourable Bardish Chagger, P.C., M.P. Minister of Small Business and Tourism and Leader of the Government in the House of Commons

This publication is available online at http://www.ic.gc.ca/eic/site/017.nsf/eng/h_07604.html.
To obtain a copy of this publication, or to receive it in an alternate format (Braille, large print, etc.), please fill out the Publication Request Form or contact:
Web Services Centre Innovation, Science and Economic Development Canada C.D. Howe Building 235 Queen Street Ottawa, ON K1A 0H5 Canada Telephone (toll-free in Canada): 1‑800‑328‑6189 Telephone (international): 613‑954‑5031 TTY (for hearing impaired): 1‑866‑694‑8389 Business hours: 8:30 a.m. to 5:00 p.m. (Eastern Time) Email: [email protected]
Permission to Reproduce
Except as otherwise specifically noted, the information in this publication may be reproduced, in part or in whole and by any means, without charge or further permission from the Department of Industry, provided that due diligence is exercised in ensuring the accuracy of the information reproduced; that the Department of Industry is identified as the source institution; and that the reproduction is not represented as an official version of the information reproduced, or as having been made in affiliation with, or with the endorsement of, the Department of Industry.
For permission to reproduce the information in this publication for commercial purposes, please fill out the Application for Crown Copyright Clearance or contact the Web Services Centre mentioned above.
© Her Majesty the Queen in Right of Canada, as represented by the Minister of Industry, 2017
Cat. No. Iu1-23E-PDF ISSN 2561-164X
Aussi offert en français sous le titre Rapport sur les résultats ministériels 2016-2017.

Table of contents Ministers’ message ................................................................................ 1
Results at a glance ................................................................................ 3
Raison d’être, mandate and role: who we are and what we do .................... 5
Raison d’être .................................................................................... 5
Mandate and role .............................................................................. 5
Operating context and key risks .............................................................. 7
Operating context .............................................................................. 7
Key risks .......................................................................................... 9
Results: what we achieved ................................................................... 11
Marketplace Frameworks and Regulation ........................................ 11
Marketplace Competition and Investments ...................................... 14
Spectrum, Telecommunications and the Digital Economy .................. 18
Science, Technology and Innovation Capacity .................................. 21
Industrial Research and Development Financing .............................. 24
Small Business Research, Financing and Services ............................ 27
Industrial Competitiveness and Capacity ......................................... 29
Community Economic Development ............................................... 32
Internal Services ............................................................................. 36
Analysis of trends in spending and human resources .............................. 39
Actual expenditures ......................................................................... 39
Actual human resources ................................................................... 40
Expenditures by vote ....................................................................... 43
Alignment of spending with the whole-of-government framework .......... 44
Financial statements and financial statements highlights ..................... 45
Financial statements .................................................................... 45
Financial statements highlights ...................................................... 45
Supplementary information .................................................................. 49
Corporate information ...................................................................... 49
Organizational profile ................................................................... 49

Reporting framework .................................................................... 50
Supporting information on lower-level programs ................................. 51
Supplementary information tables ..................................................... 52
Federal tax expenditures .................................................................. 52
Organizational contact information .................................................... 52
Appendix: definitions ........................................................................... 53
Endnotes ........................................................................................... 57
2016–17 Departmental Results Report
Innovation, Science and Economic Development Canada 1
Ministers’ message We are pleased to report progress made on making Canada a world-leading centre for innovation and science, helping create good, well-paying jobs, and strengthening and growing the middle class.
The work of the Innovation, Science and Economic Development Portfolio includes promoting innovation and science; supporting the commercialization of more research and ideas; providing more Canadians with the skills to participate in a global and digital economy; helping small businesses grow through innovation, access to capital and trade; promoting increased tourism in Canada; and supporting scientific research and the integration of scientific considerations in our investment and policy choices.
This year, the Portfolio organizations continued their work to deliver on the Government’s Budget 2017 commitment to develop an Innovation and Skills Plan. The plan’s focus on people and addressing the changing nature of the economy is a focus for the Portfolio’s programs.
As part of that process, in 2016–17, Innovation, Science and Economic Development Canada led an extensive engagement process with Canadians across the country to ensure the Innovation and Skills Plan meets their needs and expectations. The Department is also implementing Budget 2017 initiatives, including creating Innovation Canada, which supports entrepreneurs and companies through programs such as the Innovation Superclusters Initiative and the Strategic Innovation Fund, as well as Innovative Solutions Canada and the Venture Capital Catalyst Initiative.
As well, the Department continued expanding and enhancing broadband access for Canadians in rural and remote communities; supported the negotiations for the new Canada Free Trade Agreement; developed Canada’s New Tourism Vision; supported a review of federal support for fundamental science; led the delivery of the Accelerated Growth Service; signed a trilateral Memorandum of Understanding with the United States and Mexico to promote women’s entrepreneurship and women-owned enterprises in North America; helped deliver the Canada 150 Community Infrastructure Program; and delivered refurbished computers to Syrian refugees, schools and non-profit organizations.
It is our pleasure to present the 2016–17 Departmental Results Report for Innovation, Science and Economic Development Canada.

2016–17 Departmental Results Report
2 Ministers’ message
The Honourable Navdeep Bains The Honourable Kirsty Duncan The Honourable Bardish Chagger Minister of Innovation, Science and Economic Development
Minister of Science Minister of Small Business and Tourism and Leader of the Government in the House of Commons

2016–17 Departmental Results Report
Innovation, Science and Economic Development Canada 3
Results at a glance What funds were used? (2016–17 Actual Spending)
Who was involved? (2016–17 Actual Full-Time Equivalents)
$2,086,913,784 4,801
• Innovation, Science and Economic Development Canada (ISED) led an intensive engagement process across the country in support of the development of an Innovation Agenda. Building on the input from these consultations, Budget 2017 announced Canada’s Innovation and Skills Plan, an ambitious effort to make Canada a world-leading centre for innovation, to help create good, well-paying jobs, and help strengthen and grow the middle class. To support these efforts, ISED launched Innovation Canada, a new platform to coordinate and simplify innovation support to Canadian firms. Innovation Canada will deliver the Innovation Superclusters Initiative, a new opportunity to strengthen Canada's most promising clusters and accelerate economic growth in highly innovative industries. It will also deliver the $1.26-billion, five-year Strategic Innovation Fund (SIF), which consolidates and simplifies existing business innovation programming, while also expanding support to other dynamic and emerging sectors, such as clean technology and agri-food.
• ISED supported negotiations between the federal government and the provinces and territories on a new Canadian Free Trade Agreement, which entered into force on July 1, 2017, and replaced the Agreement on Internal Trade. The Department also supported negotiations for a number of international trade agreements, including the Canada-India Comprehensive Economic Partnership Agreement and the Canada-Japan Economic Partnership Agreement, and worked to implement the Canada-European Union Comprehensive Economic and Trade Agreement.
• ISED worked with partners to develop and launch Canada’s New Tourism Vision, a clear plan to continue growing the tourism sector and create jobs. The Vision identifies 20 targeted action items to help support the competitiveness of the tourism sector in Canada. As well, at a meeting of the Canadian Council of Tourism Ministers, federal, provincial and territorial ministers agreed to the Nunavut Declaration, committing to the FPT Tourism Strategy in order to support continued collaboration on tourism and contribute to the growth and competitiveness of the tourism sector in Canada.
• ISED supported a comprehensive review of federal support for fundamental science to ensure that the Government of Canada provides strategic, effective support that meets the needs of researchers. The report, produced by an expert panel, was submitted on April 10, 2017, and its recommendations will help strengthen Canada's international standing in fundamental science and ensure that researchers and scientists have the tools, training and support needed to excel globally. The Department also launched a national campaign to
2016–17 Departmental Results Report
4 Results at a glance
encourage young women to enter science, technology, engineering and mathematics (STEM) fields. The campaign provides material that parents, teachers and mentors can use to support women who see a future for themselves in research. In addition, through its contributions to the Canada Foundation for Innovation and by delivering the Post-Secondary Institutions Strategic Investment Fund, ISED provided support for universities and colleges to attract and retain the best and brightest researchers from around the world by giving them access to cutting-edge research tools and innovation infrastructure.
• ISED received more than 300 applications for the Connecting Canadians program, from which 87 projects were approved. By 2019, the program will provide approximately 300,000 households with extended and enhanced broadband service at a minimum target speed of 5 megabits per second. The Department also launched the Connect to Innovate program, which will invest up to $500 million by 2021 to extend and enhance broadband service in rural and remote communities across Canada.
For more information on the department’s plans, priorities and results achieved, see the “Results: what we achieved” section of this report.
2016–17 Departmental Results Report
Innovation, Science and Economic Development Canada 5
Raison d’être, mandate and role: who we are and what we do
Raison d’être ISED works with Canadians in all areas of the economy and in all parts of the country to improve conditions for investment, enhance Canada's innovation performance, increase Canada's share of global trade and build a fair, efficient and competitive marketplace.
ISED is a federal institution that leads the Innovation, Science and Economic Development portfolio.
Mandate and role ISED helps Canadian businesses grow, innovate and expand so they can create good-quality jobs and wealth for Canadians. It also supports science research and the integration of scientific considerations into investment and policy choices. The Department helps small businesses grow through trade and innovation and promotes increased tourism in Canada. The Department also works to position Canada as a global centre for innovation where growth is clean and inclusive, the middle class prospers through more opportunities for all Canadians, and our companies become global leaders.
ISED's efforts focus on improving conditions for investment, supporting science, helping grow small- and medium-sized enterprises, building capacity for clean and sustainable technologies and processes, increasing Canada's share of global trade, promoting tourism and building an efficient and competitive marketplace.
For more general information about the department, see the “Supplementary information” section of this report. For more information on the department’s organizational mandate letter commitments, see the Ministers’ mandate letters.i

2016–17 Departmental Results Report
6 Raison d’être, mandate and role

2016–17 Departmental Results Report
Innovation, Science and Economic Development Canada 7
Operating context and key risks
Operating context Canada is in a global innovation race. We are competing with countries around the world for the most talented people, the newest technologies and the fastest growing companies. Canada's success lies in our ability to innovate for improved economic, social and environmental outcomes. As a nation, innovating is fundamental to promoting clean and inclusive growth, generating high-quality jobs and raising Canadians' living standards. To this end, ISED is advancing Canada's Innovation and Skills Plan, a whole-of-government approach designed to pursue the goal of making Canada a global centre of innovation. Developed in consultation with Canadians, the Innovation and Skills Plan focuses on four interconnected and mutually reinforcing themes to spark innovation through partnerships and targeted actions:
• Skills: Equipping Canadians with the tools, skills and experience they need to succeed in the marketplace, and attracting global talent.
• Research, technology and commercialization: Encouraging greater business investments in research and capitalizing on Canadian inventions through shared risk-taking and partnerships.
• Program simplification: Offering a timely, client-centric and single window in the delivery of business innovation programs.
• Investment and scale-up: Attracting investment and supporting the growth of leading Canadian companies and start-ups.
Four major challenges define Canada's future as our country becomes more open and interconnected within the global community. The flip sides of these challenges are opportunities that will make innovation necessary to create and secure good-quality jobs for Canadians.
Slow growth: The global economy is growing slowly. In the past, Canada relied on increased trade and high commodity prices to boost its economy. We also relied on more people to join the workforce. Over the past decade, Canada and other advanced economies have taken steps, such as lower interest rates and tax rates, in a prolonged effort to stimulate growth. But more needs to be done to ensure the strength of the middle class. As well, Canada will continue to have fewer working-age people as our population ages, resulting in lower growth potential.
Technology: The world has entered a new industrial age. Technology is digitizing and automating every aspect of our lives—and it's happening much faster than anyone ever imagined. Technology is challenging every industry and every worker. New jobs and companies that never existed before are being created as others are being phased out. As the Internet and other technologies make communications instant, constant and affordable to people in every corner of the globe, they are reducing the competitive advantages of Canadians and citizens of other advanced economies. At the same time, they are empowering people in emerging

2016–17 Departmental Results Report
8 Operating context and key risks
economies. To respond to the pace of technological change, Canadians need to stay as open and flexible as possible. We will need to adopt new technologies and learn the skills necessary to prepare for the jobs of the future.
Globalization: The competitive pressures of the global innovation economy are more intense than ever. Developed and developing economies alike are putting in place aggressive strategies to position their economies for competitive advantage in the development of the next great technologies, products and services.
Climate change: This defining issue of our generation is reshaping how countries around the world meet their energy needs and how they think about growth. Climate change will influence how Canada and other countries manage natural resources in a world of both rising energy consumption and rising climatic risk. Those focused on clean growth are already driving the next great wave of innovation. Many countries are transitioning to a low-carbon economy based on "clean technologies" that promote energy efficiency, reduce pollution and produce cleaner air and water. This shift to clean growth has the potential to create jobs as well as new markets.

2016–17 Departmental Results Report
Innovation, Science and Economic Development Canada 9
Key risks Key risks
Risk Mitigating strategy and effectiveness
Link to the Department’s programs
Link to mandate letter commitments or to government-wide and departmental priorities
There is a risk of not meeting the expectations of Canadians and stakeholders, should a broad and inclusive innovation agenda fail to yield tangible results.
In Budget 2017, the Government of Canada launched the Innovation and Skills Plan, which focuses on four interconnected and mutually reinforcing themes to spark innovation through partnerships and targeted actions: skills; research, technology and commercialization; program simplification; and investment and scale-up. The plan sets clear targets that will grow Canada’s goods and services exports; increase the clean technology sector’s contribution to Canada’s GDP; and double the number of high-growth companies in Canada. Ongoing monitoring of progress towards these targets will allow ISED to identify opportunities for course correction.ii
Science, Technology and Innovation Capacity Industrial Research and Development Financing Industrial Competitiveness and Capacity
Develop an Innovation Agenda
ISED’s 2016–17 Corporate Plan includes the Department’s Corporate Risk Profile. It is part of a tailored, integrated approach to addressing ISED’s key risks. This approach allows the Department to manage risk proactively. It guides employees in implementing a comprehensive integrated risk management regime to ensure key risks pertaining to the Department’s policy, regulatory, program, investment and management activities are identified, assessed, mitigated and communicated.
The risk identified above is taken from ISED’s Corporate Plan, which includes the risks identified by the Department that could impact its ability to achieve its mandate and priorities, and fall outside the Department’s risk tolerance. To ensure the effectiveness of its risk responses,
2016–17 Departmental Results Report
10 Operating context and key risks
ISED updates its Corporate Plan three times each year, and senior management and the Departmental Audit Committee review the performance of corporate risk mitigation.
Implementing Canada’s Innovation and Skills Plan is a key deliverable for the Department and involves groups from across the Department and the Government of Canada working together to deliver an ambitious strategy. Given the high-profile nature of the commitment (and its inclusion in the Minister of Innovation, Science and Economic Development’s Mandate Letter), public expectations are also elevated, leading to a significant reputational risk for ISED. To help mitigate the risk, the Department led extensive consultations with Canadians from across the country in 2016–17 to help inform the development of an ambitious response. Many of the central initiatives of the Innovation and Skills Plan, such as the Innovation Superclusters initiative and the Economic Strategy Tables, offer important engagement opportunities between public and private sector stakeholders.
The Innovation and Skills Plan represents the government’s commitment to inclusiveness, clean growth, and sustainable progress across our country, helping Canadians realize new discoveries, grow our companies, and find ways to improve our living standard.
It provides more targeted, coordinated, and accessible support to innovators, and motivates partnerships across entrepreneurs, businesses, academia, and government to work together on ideas and solutions that will produce transformative outcomes.

2016–17 Departmental Results Report
Innovation, Science and Economic Development Canada 11
Results: what we achieved
Programs Program name Marketplace Frameworks and Regulations
Description This program regulates and provides oversight over a number of aspects of the Canadian marketplace, including trade measurement, insolvency, corporate governance including federal incorporation, intellectual property, market access and consumer affairs. The program develops and administers framework statutes, regulations, policies and procedures; develops, sets and assures compliance with related regulatory reforms and standards; and consults with a variety of stakeholders and portfolio organizations. Overall, the program benefits Canadian businesses and consumers by ensuring the integrity of the marketplace and providing a competitive environment that contributes to Canada's innovation performance.
Results In 2016–17, ISED continued to focus on improving the accessibility of the Canadian marketplace and ensuring that Canadian businesses were well placed to compete both domestically and in the international market.
To support this objective, the Department concluded negotiations between the federal government and the provinces and territories on a new Canadian Free Trade Agreement (CFTA), to replace the Agreement on Internal Trade (AIT). The CFTA entered into force on July 1, 2017. The agreement commits all governments to reducing the patchwork of rules and regulations that can stifle growth. Opportunities will increase for businesses of all sizes to innovate and expand at home so that they are better equipped to compete globally. By improving the flow of goods, services and investments across provincial and territorial borders, the CFTA will also give consumers more choice and lower prices.
ISED also supported negotiations for a number of international trade agreements, including the Canada-India Comprehensive Economic Partnership Agreement and the Canada-Japan Economic Partnership Agreement. The Department provided support to the Minister of Innovation, Science and Economic Development and worked with Global Affairs Canada and other government departments on the implementation of the Canada-European Union Comprehensive Economic and Trade Agreement (CETA). CETA provisionally entered into force on September 21, 2017, covering more than 95 percent of the agreement.
In support of trade measurement accuracy, the three-year implementation period for the introduction of mandatory inspection frequencies for gas pumps, retail and commercial scales and other measuring devices in the retail petroleum, retail food, dairy, fishing, mining, forestry,
2016–17 Departmental Results Report
12 Results: what we achieved
grain and field crops and downstream petroleum sectors continued with more than 173,000 inspections performed in 2016–17.iii These increased inspections provide improved consumer protection against loss due to inaccurate measurement. As the implementation period ended on July 31, 2017, a graduated enforcement approach is being employed to resolve device owner non-compliance with new mandatory inspection requirements (including site visits, calls and letters to the business owner). Work also continued on modifications to existing enforcement and compliance policies to integrate procedures and requirements for the issuance of administrative monetary penalties introduced as part of the amendments to the Weights and Measures Act and the Electricity and Gas Inspection Act.
On April 1, 2016, the Office of the Superintendent of Bankruptcy’s (OSB) Trustee Designation and Advertising directive came into force. The directive requires Licensed Insolvency Trustees (LITs) to use this new professional designation in official representations and all consumer advertising in order to facilitate their identification and recognition by the public. The OSB also made all aggregated insolvency data available on the Open Data Portal and continued to modernize its compliance program. As well, in December 2016, the OSB Licence Administration Application (OLAA) was made available online to candidates applying to become LITs, improving the administration of applications, including the payment of fees and scheduling of Oral Board Exams. The next phase of OLAA implementation will occur in 2017–18.
The updated Nuans system—the corporate name search tool that is used by the federal government and several provinces and territories when granting a company name—was launched in June 2016. The new system is more user-friendly, improves French-language searches and allows faster service at a lower maintenance cost. As a result, the prices of Nuans products were reduced for the business community.
In 2016–17, the Department continued to invest in improved tools for Canadian consumers. ISED launched two updated online products: the Complaint Roadmap, a step-by-step guide built to help consumers report complaints about products or services more effectively, and The Consumer Checklist for Moving, which provides consumers with detailed information and advice to help them at every stage of the moving process.
At the OECD 2016 Ministerial on the Digital Economy, the Department organized a panel on Consumer Trust and Market Growth, which addressed issues related to the revised OECD Guidelines for Consumer Protection in the Context of Electronic Commerce. The panel also addressed important consumer protection issues arising from new business models that allow peer-to-peer transactions facilitated by Internet platforms (e.g., Uber, Airbnb).

2016–17 Departmental Results Report
Innovation, Science and Economic Development Canada 13
In 2016–17, the Canadian Intellectual Property Office (CIPO) continued to advance the implementation of five international intellectual property (IP) treaties, which are expected to be implemented by early 2019. These treaties will support the harmonization of Canada’s IP system with other jurisdictions and provide Canadian companies with a faster, simpler and more cost-effective way to acquire IP protection in multiple countries.
Joining the international treaties involves changes to CIPO’s existing user fee structure and IP regulations. In 2016–17, CIPO launched formal consultations and completed the Parliamentary process to adjust the Trademark and Patent fee structures. CIPO also conducted a technical consultation of Canada’s Trade-marks Regulations with key stakeholders. Further public consultations on Trade-marks, Patents and Industrial Design Regulations will be held in 2017–18.
CIPO also implemented new IP education and awareness activities and established new partnerships to improve Canadian business’s understanding and strategic use of IP. The office also developed a comprehensive Service Strategy, enhanced its online presence, and improved searching capabilities of the Canadian Patents Database and the Trademarks Opposition Board decisions as part of its multi-year IT modernization plan.
The Total Authorities Available for Use for this program in 2016–17 includes $176 million in unused authorities accumulated by CIPO since its creation in 1994. CIPO is an organization within the Department that is funded entirely from the revenues it generates, drawing from its unused authorities as required. The variance between Planned and Actual Spending is primarily due to a delay in the upgrades to CIPO’s information technology infrastructure and to lower than planned salaries and benefits expenses.
Results achieved
Expected results
Performance indicators
Target Date to achieve target
2016–17 Actual results
2015–16 Actual results
2014–15 Actual results
Service standards are met
Average percentage of service standards met
91.5% March 31, 2017
94% 95% 96%

2016–17 Departmental Results Report
14 Results: what we achieved
Budgetary financial resources (dollars)
2016–17 Main Estimates
2016–17 Planned spending
2016–17 Total authorities available for use
2016–17 Actual spending (authorities used)
2016–17 Difference (actual minus planned)
66,943,246 66,943,246 222,976,003 50,124,282 (16,818,964)
Human resources (full-time equivalents)
2016–17 Planned
2016–17 Actual
2016–17 Difference (actual minus planned)
1,778 1,743 (35)
Program name Marketplace Competition and Investments
Description This program administers federal laws relating to the investigation of anti-competitive behaviour and the general regulation of trade and commerce in respect of business practices, including the review of mergers and significant foreign investments. It protects, promotes and advocates for efficient markets in a manner that encourages ongoing economic growth and innovation, providing consumers and businesses with competitive prices and increased product choices.
Results In 2016–17, ISED, through the Competition Bureau, used its outreach, enforcement, and advocacy tools to help ensure that Canadian businesses and consumers prospered in a competitive and innovative marketplace.
The Bureau achieved direct results for consumers when Bell Canada agreed to pay $11.82 million to customers for unwanted “premium text messaging” charges on their wireless phone bills and donated approximately $800,000 to public interest advocacy groups. In another case, Avis and Budget, two car rental companies, agreed to stop advertising prices that were not attainable and pay a $3 million administrative monetary penalty.
The Bureau collaborated closely with the U.S. Department of Justice’s Antitrust Division on a bid-rigging conspiracy involving Japanese automotive parts manufacturer Nishikawa Rubber, which led to a US$130 million fine addressing the harm their illegal activities caused in both Canada and the U.S.

2016–17 Departmental Results Report
Innovation, Science and Economic Development Canada 15
As part of the Bureau’s ongoing focus to combat cartels and bid-rigging activities, Showa Corporation, a Japanese manufacturer and supplier of automobile components, pleaded guilty for bid-rigging and was fined $13 million. In Quebec, five companies and one individual pleaded guilty for their participation in a sewer services bid-rigging scheme. The Bureau also laid 45 criminal charges for bid-rigging in water services contracts to municipalities in the province.
The Bureau continued to protect consumers from higher gas prices by challenging Parkland Fuel Corporation’s proposed acquisition of gas stations owned by Pioneer Energy. As a result, Parkland agreed to sell gas interests in six markets and surrender its ability to increase any margin that it earns on the sale of gas in two markets in Manitoba, where it is a wholesale supplier. In eastern Canada, the Bureau approved convenience store operator Couche-Tard’s acquisition of gasoline sites in Quebec and Ontario after the company agreed to sell some of its retail gas stations to preserve competition in those markets.
To enhance predictability for marketplace participants in the digital economy, the Bureau conducted an extensive review of allegations that Google contravened the Competition Act’s abuse of dominance provisions. The Bureau found that Google intended to exclude competitors by using anti-competitive clauses in search advertising contracts. These concerns were resolved when Google agreed to change its contracts to give advertisers more flexibility to use competing advertising platforms.
The Bureau has made it a priority to help businesses understand how it deals with competition IP issues such as patent settlements. Following extensive public consultations, the Bureau released an updated version of the Intellectual Property Enforcement Guidelines to incorporate the latest Canadian case law, as well as recent enforcement experience in Canada and abroad.iv
The Bureau also promoted the adoption of credible and effective compliance programs to businesses across Canada. In 2016–17, the Bureau delivered 35 compliance and 31 bid-rigging presentations to Canadian stakeholders, many of which were focused on small and medium-sized businesses and the public procurement community.
The Bureau provided advice to regulators, industry and government partners on the need for public policy and regulations to be shaped by the best available evidence in a way that allows competition and innovation to thrive. The Bureau launched a market study into technology-led innovation in the financial services sector, a growing sector of Canada’s economy. The study examines the extent to which there is a need for regulatory reform to promote greater competition, while maintaining consumer confidence in the sector. To inform the study, the Bureau interviewed industry stakeholders, including financial technology start-ups, and held a one-day workshop.

2016–17 Departmental Results Report
16 Results: what we achieved
The Bureau also strengthened its network of international partners by signing a memorandum of understanding with Hong Kong, its first international cooperation instrument in the area of competition following the full implementation of its legislation. The Bureau also signed a second generation cooperation arrangement with the New Zealand Commerce Commission, enhancing collaboration in terms of information sharing and the provision of investigative assistance.
The Department also continued to analyze foreign investments and their consequences for the Canadian marketplace. In 2016–17, ISED received and certified 715 notifications filed by foreign investors.
ISED provided the Minister with the information required to help him determine the likely net benefit to Canada of various proposed investments. In 2016–17, the Minister of Innovation, Science and Economic Development approved 22 applications for review.
The variances between targets and actual results for the consumer savings indicators are due to the difficulty in anticipating whether and how quickly complex investigations will conclude. The variance between the target and the actual result for the percentage of mergers reviewed within service standards is due to a greater number of highly complex cases than anticipated by the Bureau in 2016–17.
The variance between Planned and Actual Spending is mainly due to lower than planned salaries and benefits expenses and to a change in requirements for reporting of corporate services functions. Previously, if those functions were reported exclusively in the delivery of one program, they were reported as part of that program. New requirements mean all corporate service functions are reported under Internal Services. The variance between Planned and Actual FTEs is mainly due to the change in Internal Services reporting.
Results achieved
Expected results
Performance indicators
Target Date to achieve target
2016–17 Actual results
2015–16 Actual results
2014–15 Actual results
Consumers benefit from a competitive marketplace
Dollar value estimate of annual consumer savings from Bureau actions that stop anti-competitive activity
$2.37 billion March 31, 2017
$2.7 billion $2.9 billion $950,169,365
2016–17 Departmental Results Report
Innovation, Science and Economic Development Canada 17
Expected results
Performance indicators
Target Date to achieve target
2016–17 Actual results
2015–16 Actual results
2014–15 Actual results
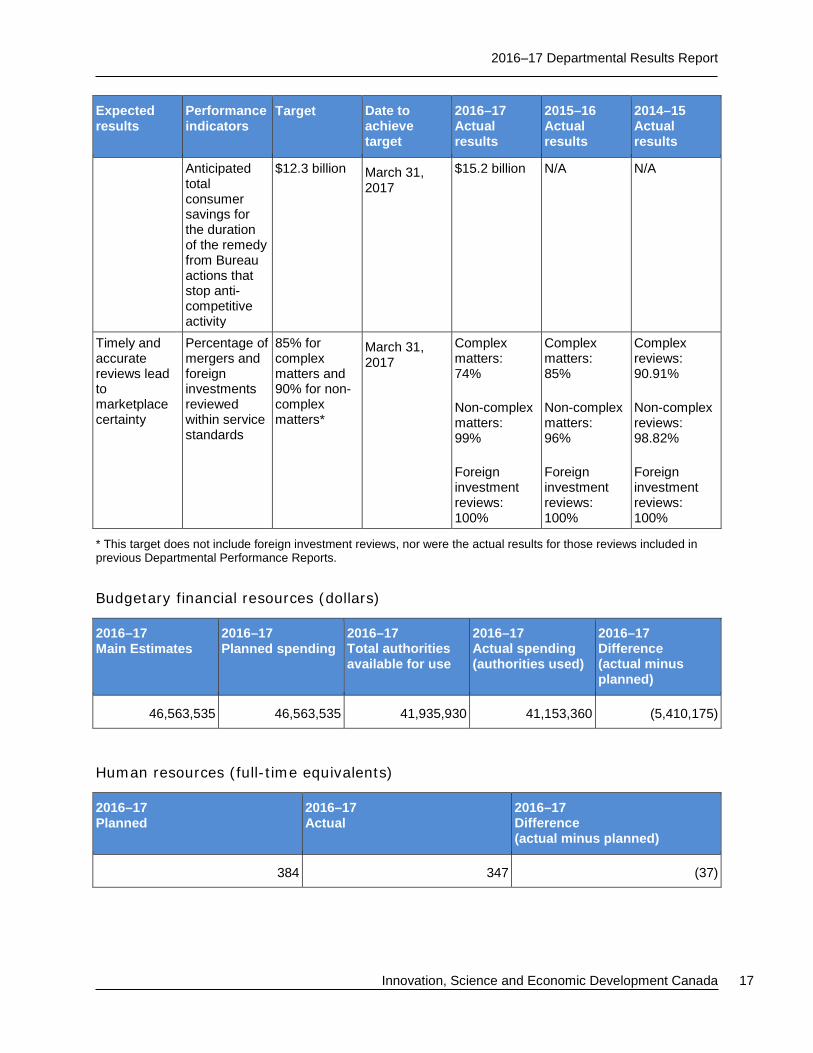
Anticipated total consumer savings for the duration of the remedy from Bureau actions that stop anti-competitive activity
$12.3 billion March 31, 2017
$15.2 billion N/A N/A
Timely and accurate reviews lead to marketplace certainty
Percentage of mergers and foreign investments reviewed within service standards
85% for complex matters and 90% for non-complex matters*
March 31, 2017
Complex matters: 74%
Non-complex matters: 99%
Foreign investment reviews: 100%
Complex matters: 85%
Non-complex matters: 96%
Foreign investment reviews: 100%
Complex reviews: 90.91%
Non-complex reviews: 98.82%
Foreign investment reviews: 100%
* This target does not include foreign investment reviews, nor were the actual results for those reviews included in previous Departmental Performance Reports.
Budgetary financial resources (dollars)
2016–17 Main Estimates
2016–17 Planned spending
2016–17 Total authorities available for use
2016–17 Actual spending (authorities used)
2016–17 Difference (actual minus planned)
46,563,535 46,563,535 41,935,930 41,153,360 (5,410,175)
Human resources (full-time equivalents)
2016–17 Planned
2016–17 Actual
2016–17 Difference (actual minus planned)
384 347 (37)
2016–17 Departmental Results Report
18 Results: what we achieved
Program name Spectrum, Telecommunications and the Digital Economy
Description This program enables Canadians to benefit from a globally competitive digital economy that drives innovation, productivity and future prosperity. This includes developing and administering domestic regulations, procedures and standards that govern Canada's radiocommunication and telecommunications industries. The program sets legislative and policy frameworks to encourage competition, innovation, private sector investment in digital infrastructure, confidence in the online marketplace, and greater adoption of information and communications technologies by business. The program maximizes the public benefits of spectrum by managing it efficiently and effectively, through spectrum and radio licensing including auctions, compliance and enforcement. The program protects Canadian interests in the radiocommunications and telecommunications industry globally and facilitates international online trade and commerce by negotiating international treaties and agreements. This program also performs research in advanced telecommunication and information technologies to promote innovation and assist in the development of policies, regulations and program delivery.
Results In 2016–17, ISED continued to ensure Canadians benefitted from the digital economy, in part through the administration of policies and regulations governing the radiocommunication and telecommunications industries. The Department also continued to manage spectrum and radio licensing to the benefit of all Canadians and conduct research on advanced communications systems and technologies to inform public policy and further innovation.
ISED completed stakeholder consultations on the design of data breach reporting regulations in October 2016 with the publication of a summary of responses.v Draft regulations, entitled Breach of Security Safeguards Regulations, were published for broad consultation in summer 2017.
ISED participated in the Helsinki, Hyderabad and Copenhagen meetings of the Internet Corporation for Assigned Names and Numbers’ (ICANN) Governmental Advisory Committee (GAC), where the Department advanced Canadian priorities: that the multi-stakeholder model, in which governments are advisory, is the best means of keeping the Internet an open platform for innovation, and ensuring that the GAC continues to develop advice via consensus. As one of five government members appointed by the GAC, ISED also participated in meetings of the ICANN Working Group on Post-transition accountability issues to support private sector leadership, multi-stakeholder processes, and reinforce accountability work pre-US stewardship transition.

2016–17 Departmental Results Report
Innovation, Science and Economic Development Canada 19
Preparatory meetings for the 2016 World Telecommunication Standardization Assembly (WTSA-16) hosted by the Inter-American Telecommunications Agency (CITEL) resulted in 33 Inter-American Proposals (IAPs) that reflected the region’s views. Of those, seven were originated by Canada, six of which were adopted at WTSA-16. These adopted proposals were aimed at ensuring efficient operations of International Telecommunication Union Telecommunication Standardization Sector and regulating international caller identification to reduce spoofing and the risk of fraud to Canadians. Canada also supported policies to protect and maintain an open Internet. As a result, Canadians will benefit from standards that support secure and reliable communication while protecting personal data and privacy, policies that promote Canadian companies operating internationally, lower costs for testing of telecommunications equipment and more cost-effective standardization processes.
The U.S. Incentive Auction, designed to repurpose spectrum in the 600 MHz band for new uses, was completed in March 2017 and the joint allotment plan and transition plan for existing users of the 600 MHz band, as well as the Canadian consultation on a licensing framework for commercial mobile spectrum, was published on August 4, 2017.
The Communications Research Centre’s (CRC) research and development (R&D) continued to focus on wireless spectrum to support spectrum management policy, program and regulatory development. The Grand Challenges projects are focused on areas that can have the greatest impact on sustainable spectrum management, including understanding how spectrum is being used, whether it can be used more effectively, and if more spectrum can be made available for the country’s growing wireless needs.
For example, in 2016–17, the CRC developed and demonstrated a world-leading prototype system to proactively monitor, collect and analyze large volumes of spectrum data, as well as import and fuse complementary data from other sources to enhance its capabilities. The CRC also demonstrated new antenna and radio frequency technology to enable mobile broadband communications and help pave the road to 5G—the next generation of wireless technology. This research makes use of small cell technology and engineered surfaces that reflect radio signals to show that frequencies previously thought unusable for wireless needs can be a low-cost, viable alternative to what is currently available.
The construction of the CRC’s Big Data Analytics Centre was completed in 2016–17. This state-of-the-art facility has leading edge visualization capabilities enabling CRC researchers to pursue progressive ideas like big data analytics and artificial intelligence in a cloud environment, supporting sustainable spectrum management that can ultimately lead to innovation and prosperity for Canadians. It includes spaces for collaboration, demonstrations and interactive learning and is being used for these purposes with industry, academia and other government departments. The Centre is also available to other government science-based departments for their own research purposes.

2016–17 Departmental Results Report
20 Results: what we achieved
The variance between the target and actual results for the investment by telecommunications providers is related to where individual telecommunications service providers stand on the technology deployment cycle, their business strategies and other factors. The actual results also include expenditures made to acquire spectrum. In 2015–16, spectrum auctions in the 2500 MHz and AWS-3 bands helped raise wireless investment well above the target.
The variances between Planned and Actual Spending and between Planned and Actual FTEs are mainly due to lower than planned salaries and benefits expenses, internal realignment, and a change in requirements for reporting of corporate services functions. Previously, if those functions were reported exclusively in the delivery of one program, they were reported as part of that program. New requirements mean all corporate service functions are reported under Internal Services.
Results achieved
Expected results
Performance indicators
Target Date to achieve target
2016–17 Actual results
2015–16 Actual results
2014–15 Actual results
Canada has a growing digital economy
Investment in dollars by telecomm-unications providers
$8 billion March 31, 2017
$13.3 billion (2015)
$14.7 billion (2014)
$9.2 billion (2013)
Percentage of population with broadband subscriptions
80% March 31, 2017
82% (2015) 80% (2014) 77% (2013)
Budgetary financial resources (dollars)
2016–17 Main Estimates
2016–17 Planned spending
2016–17 Total authorities available for use
2016–17 Actual spending (authorities used)
2016–17 Difference (actual minus planned)
106,285,898 106,285,898 106,179,081 98,326,709 (7,959,189)
2016–17 Departmental Results Report
Innovation, Science and Economic Development Canada 21
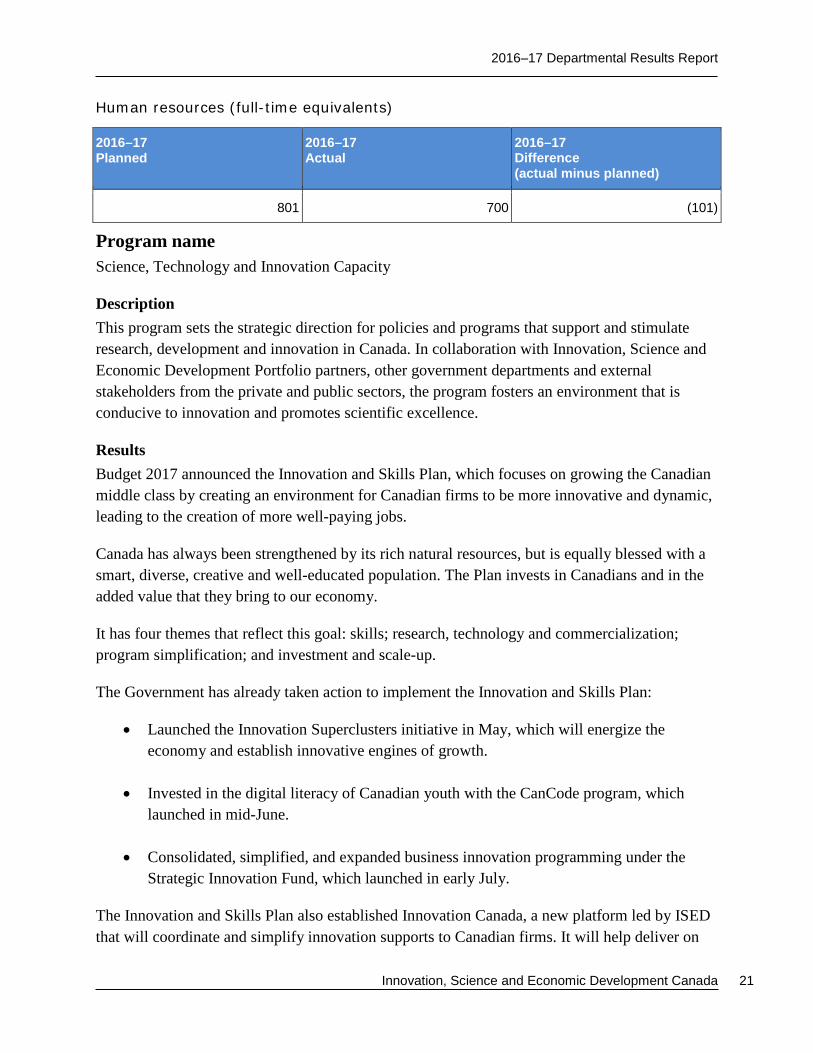
Human resources (full-time equivalents)
2016–17 Planned
2016–17 Actual
2016–17 Difference (actual minus planned)
801 700 (101)
Program name Science, Technology and Innovation Capacity
Description This program sets the strategic direction for policies and programs that support and stimulate research, development and innovation in Canada. In collaboration with Innovation, Science and Economic Development Portfolio partners, other government departments and external stakeholders from the private and public sectors, the program fosters an environment that is conducive to innovation and promotes scientific excellence.
Results Budget 2017 announced the Innovation and Skills Plan, which focuses on growing the Canadian middle class by creating an environment for Canadian firms to be more innovative and dynamic, leading to the creation of more well-paying jobs.
Canada has always been strengthened by its rich natural resources, but is equally blessed with a smart, diverse, creative and well-educated population. The Plan invests in Canadians and in the added value that they bring to our economy.
It has four themes that reflect this goal: skills; research, technology and commercialization; program simplification; and investment and scale-up.
The Government has already taken action to implement the Innovation and Skills Plan:
• Launched the Innovation Superclusters initiative in May, which will energize the economy and establish innovative engines of growth.
• Invested in the digital literacy of Canadian youth with the CanCode program, which launched in mid-June.
• Consolidated, simplified, and expanded business innovation programming under the Strategic Innovation Fund, which launched in early July.
The Innovation and Skills Plan also established Innovation Canada, a new platform led by ISED that will coordinate and simplify innovation supports to Canadian firms. It will help deliver on

2016–17 Departmental Results Report
22 Results: what we achieved
the Plan’s commitment to delivering simpler, more efficient, and coordinated support to Canadian entrepreneurs, global companies looking to set up in Canada, and global investors considering partnerships with innovative Canadian firms. It will bolster areas of economic strength and better equip Canada’s innovative firms to compete globally.
In June 2016, the Minister of Science launched a comprehensive review of federal support for fundamental science to ensure that the Government of Canada provides strategic, effective support that meets the needs of researchers. This includes achieving the right balance between funding for talent, research, and research infrastructure. The review is intended to provide advice on how to maintain and strengthen Canada's international standing in fundamental science and ensure that researchers and scientists have the tools, training and support needed to excel globally.
ISED launched a national campaign to encourage young women to enter science, technology, engineering and mathematics (STEM) fields. The campaign provides material—such as easy, home-based experiments and citizen science projects—that parents, teachers and mentors can use to support women who see a future for themselves in research.
In April 2016, the Minister of Innovation, Science and Economic Development launched the Post-Secondary Institutions Strategic Investment Fund (PSI-SIF), which will provide $2 billion over three years, starting in 2016–17, to enhance and modernize research and innovation infrastructure at universities and colleges across Canada.
The new Canada Excellence Research Chairs competition was launched in October 2016. Of the 11 Chairs available in this competition, two Chairs are to be awarded in fields related to clean and sustainable technologies. The results of the second inaugural Canada First Research Excellence Fund competition were announced in September 2016. Thirteen awards with a value of $900 million were announced, bringing the total program funding commitment to $1.25 billion for 18 projects.
The Department supported the Minister of Science in engaging domestic and international stakeholders on the design and mandate of the position of Chief Science Advisor. The input provided was crucial in facilitating the development of a proposal to the Prime Minister for a Chief Science Advisor, in line with international best practices. The Department worked with the Privy Council Office to launch a merit-based selection process, which will result in an appointment decision by the fall of 2017.
As part of the departmental commitment to examine the use of direct support to encourage clusters, networks and innovation by business, ISED contributed to the identification of Canada’s

2016–17 Departmental Results Report
Innovation, Science and Economic Development Canada 23
scientific strengths. Through an analysis of co-publications among higher-education institutions, the Department identified the associated academic research networks and their locations.
Through participation in international and multilateral meetings and events (e.g., OECD, G7, G20), the Department pursued policy dialogues to advance collaboration and partnerships, and to share best practices for developing effective innovation policies. ISED continued its extensive engagement with stakeholders and conducted research and analysis to enhance understanding of Canada's national and provincial/territorial, as well as international, systems of science, technology and innovation.
Through its contribution agreement with the Canada Foundation for Innovation (CFI), the Department continued its support for world-class research infrastructure, including awards through the $400 million Major Science Initiatives Fund competition and undertaking the merit-review process for an Innovation Fund competition with a budget of $425 million.
The Department also continued to work with the federal granting councils and science-based departments and agencies to maximize access to federally-funded scientific research. In partnership with Environment and Climate Change Canada, the Department co-led on the development of an Open Science commitment in the new Open Government Action Plan, launched in July 2016. The Department also co-led on Canada’s participation in a G7 Open Science Working Group.
The variance between Planned and Actual Spending is primarily due to new funding received in Budget 2016 for the Post-Secondary Institutions Strategic Investment Fund, Mitacs Inc. and the Stem Cell Network, as well as the transfer of responsibilities for Sustainable Development Technology Canada to ISED. The variance between Planned and Actual FTEs is mainly due to an increase in resources for the Post-Secondary Institutions Strategic Investment Fund and internal reallocations to align with departmental priorities.
Results achieved
Expected results
Performance indicators
Target Date to achieve target
2016–17 Actual results
2015–16 Actual results
2014–15 Actual results
Canada's scientific research excellence is maintained
Canada's Average Relative Citation index
1.31 March 31, 2017
1.40 (2015 data)
1.37 (2014 data)
1.39 (2013 data)

2016–17 Departmental Results Report
24 Results: what we achieved
Expected results
Performance indicators
Target Date to achieve target
2016–17 Actual results
2015–16 Actual results
2014–15 Actual results
Researchers are attracted to Canada, and retained
Total full-time equivalent researchers in Canada per thousand total employment
8.8 March 31, 2017
9.3 (2014 data)
8.8 (2013 data)
8.8 (2012 data)
Budgetary financial resources (dollars)
2016–17 Main Estimates
2016–17 Planned spending
2016–17 Total authorities available for use
2016–17 Actual spending (authorities used)
2016–17 Difference (actual minus planned)
342,834,370 342,834,370 1,198,477,652 1,197,358,867 854,524,497
Human resources (full-time equivalents)
2016–17 Planned
2016–17 Actual
2016–17 Difference (actual minus planned)
65 101 36
Program name Industrial Research and Development Financing
Description This program helps Canadian businesses increase research and development (R&D) activities by investing in innovative projects and collaborations through repayable and non-repayable contributions. Projects supported under this program are expected to produce benefits to Canada, including generating strategic R&D investment, developing new technologies and enhancing Canadian innovation capacity and expertise.
Results In 2016–17, ISED continued investing in research and development activities to encourage the development of new technologies in targeted industries and to enhance innovative Canadian products and processes.

2016–17 Departmental Results Report
Innovation, Science and Economic Development Canada 25
The Department launched a third call for proposals to support large-scale demonstration projects in areas that have significant potential for broad-based and long-term economic benefits under the Technology Demonstration Program (TDP). Following an evaluation period for the submitted proposals, a decision on the third round is expected in 2017–18.
In 2016–17, two new projects were approved under the Strategic Aerospace and Defence Initiative (SADI) and, by the end of the year, 37 SADI projects resulted in the creation of collaborations with post-secondary institutions for the R&D phase of the project. These collaborations include working with students and professors at universities, as well as supporting research chairs and laboratories. As well, some students are hired on a full-time basis upon completion of the R&D phase.
SADI also continued to enhance the competitiveness of Canadian aerospace and defence, space, and security firms in 2016–17. At the end of the fiscal year, 35 projects had resulted in the development of new products, services and/or processes, while 26 projects had resulted in the commercialization of new products, services and/or processes. By March 31, 2017, SADI had collected $222 million in repayments from recipients.
ISED continues to manage and collect repayments from Technology Partnerships Canada (TPC) projects approved prior to December 2006. For the R&D investments made under TPC, $2.33 has been leveraged for each dollar the program disbursed. By March 31, 2017, $1.5 billion in repayments have been collected from TPC projects. These repayments are expected to continue until 2035.
The Automotive Innovation Fund (AIF) investments contribute to economic activity and employment in the assembly and supplier ecosystem, and the broader economy; the development and commercialization of new products including advanced materials and emissions technologies; and, advanced/expanded flexible manufacturing processes and facilities. All of these activities help position Canada as a leader in the development of advanced technologies and a natural home for designing and building the cars of the future. In 2016–17, the AIF continued to implement the recommendations from the evaluation undertaken in 2012 by establishing service standards and monitoring on an ongoing basis the international automotive investment landscape to ensure that the AIF program objectives continue to support a strong and competitive Canadian automotive industry.
The Automotive Supplier Innovation Program (ASIP) is a five-year, $100 million program that provides non-repayable contributions to support technology demonstration and prototyping activities of Canadian-based suppliers developing innovative products and processes in the automotive sector. It complements existing initiatives supporting the automotive sector, such as the AIF, by strengthening Canada's parts supply base and creating a favourable environment for automotive research and development, while providing firms with new opportunities to enter global supply chains. In 2016–17, ASIP funded 12 projects, bringing the total up to 21 projects.

2016–17 Departmental Results Report
26 Results: what we achieved
Budget 2017 announced the creation of a $1.26-billion, five-year Strategic Innovation Fund (SIF), a key deliverable under the Innovation and Skills Plan. This new fund consolidates and simplifies existing business innovation programming, particularly SADI, TDP, AIF and ASIP, while also expanding to other dynamic and emerging sectors, such as clean technology and agri-food.
The variance between the target and actual result for the dollar value of disbursement under ASIP is due to delays in spending that occurred in certain projects. For TDP, the variance is due to longer than expected finalization of contribution agreements. The variance between the actual results for the amount of investment leveraged by SADI is because fewer projects than anticipated were contracted in 2016–17.
The variance between Planned and Actual Spending is mainly due to funding for the AIF that was reprofiled from 2016–17 to 2017–18 to align program resources with anticipated project needs. The variance between Planned and Actual FTEs is primarily due to a change in requirements for reporting of corporate services functions. Previously, if those functions were reported exclusively in the delivery of one program, they were reported as part of that program. New requirements mean all corporate service functions are reported under Internal Services.
Results achieved
Expected results
Performance indicators
Target* Date to achieve target
2016–17 Actual results
2015–16 Actual results
2014–15 Actual results
Investment in leading-edge R&D in targeted Canadian industries
Dollar value to date of disburse-ments to firms for R&D activities
AIF (2008): $363 million
ASIP (2015): $24.1 million
SADI (2007): $1.23 billion
TDP (2013): $67.4 million
TPC (1996): $3.16 billion
March 31, 2017
AIF: $367.25 million
ASIP: $18.5 million
SADI: $1.23B
TDP: $46M
TPC: $3.16B
AIF: $342 million
ASIP: $4.03 million
SADI: $1 billion
TDP: $15 million
TPC: $3.16 billion
$4.27 billion (not broken down by recipient)

2016–17 Departmental Results Report
Innovation, Science and Economic Development Canada 27
Expected results
Performance indicators
Target* Date to achieve target
2016–17 Actual results
2015–16 Actual results
2014–15 Actual results
Dollars to date of investment leveraged per dollar of Innovation, Science and Economic Development Canada disburse-ments in R&D projects
AIF (2008): $7.25
ASIP (2015): $1.00
SADI (2007): $1.74
TDP (2013): $1.00
TPC (1996): $2.33
March 31, 2017
AIF: $7.21
ASIP: $1.07
SADI: $1.79
TDP: $1.00
TPC: $2.33
AIF: $7.08
ASIP: $1.00
SADI: $1.82
TDP: Nil
TPC: $2.33
AIF: $7.04
SADI: $1.87
TPC: $2.33
* Program start dates in parentheses.
Budgetary financial resources (dollars)
2016–17 Main Estimates
2016–17 Planned spending
2016–17 Total authorities available for use
2016–17 Actual spending (authorities used)
2016–17 Difference (actual minus planned)
326,898,851 326,898,851 332,439,783 280,593,734 (46,305,117)
Human resources (full-time equivalents)
2016–17 Planned
2016–17 Actual
2016–17 Difference (actual minus planned)
77 48 (29)
Program name Small Business Research, Financing and Services
Description This program enhances the growth and competitiveness of small business and encourages entrepreneurial activity across Canada. It raises awareness across government of the challenges facing small businesses and provides knowledge and expertise on small and medium-sized enterprises (SMEs) in a number of areas, including entrepreneurship, financing, innovation, and growth firms. It also addresses obstacles to growth such as paperwork burden and delivers programs that help support SMEs.

2016–17 Departmental Results Report
28 Results: what we achieved
Results In 2016–17, ISED continued to support SMEs across the country to help them grow and become more internationally competitive. The Minister of Small Business and Tourism launched Canada’s New Tourism Vision, which aims to support growth in the Canadian tourism sector, which includes tourism SMEs.
ISED continued to encourage businesses to use the Canada Small Business Financing Program’s (CSBFP) online loan registration application and direct deposit payment initiative to increase the efficiency of the process and help reduce paper and administrative burden. As of March 31, 2017, 85 percent of the loans and registration fees and 100 percent of the total number of claims and refund payments were being processed electronically.
The BizPaL service, led by ISED, is a unique collaboration between all levels of government that helps entrepreneurs know which permits and licences they require to start and grow their businesses. As part of ongoing efforts to explore the ways in which BizPaL can contribute to streamlining businesses’ interactions with governments and reducing red tape, the Restaurant Bundle was announced on March 17, 2017. This is a pilot project with British Columbia to make starting a business in the restaurant sector more user-friendly. It allows business owners to monitor their required permits, inspections, and licences and keeps an up-to-date tally of wait times and potential costs that help users plan and budget efficiently.
As a lead for services for business, ISED supported the Treasury Board Secretariat in the development of the new Government of Canada Service Strategy, whose goal is to continuously improve the quality of service to Canadians by putting clients’ needs first and ensuring services are connected to each other to offer an easy, “tell us once” client experience. ISED has developed a departmental multi-year Service Management Strategy that aligns with the government-wide strategy. Its aim is to improve service for business by instituting a department-wide culture of service excellence and by delivering innovative, integrated, client-centric services for business.
In collaboration with the Canada Revenue Agency (CRA), the Department continued its outreach and engagement activities to promote the use of the Business Number as the common identifier for businesses across government and conducted a successful pilot with early adopters of the CRA’s new online web service that allows participating departments to validate the identity information of businesses interacting with the Government of Canada.
The variance between Planned and Actual Spending is primarily a result of a drop in claims received for the CSBFP and payments made for defaulted loans. This is partially offset by an increase in funding for the Service for Business sub-program and internal reallocations to align funding with program requirements. The variance between FTEs is mainly related to new resources for Improving Support for Entrepreneurs and Small Business Growth, internal
2016–17 Departmental Results Report
Innovation, Science and Economic Development Canada 29
reallocations to meet departmental priorities and a change in requirements for reporting of corporate services functions. Previously, if those functions were reported exclusively in the delivery of one program, they were reported as part of that program. New requirements mean all corporate service functions are reported under Internal Services.
Results achieved
Expected results
Performance indicators
Target Date to achieve target
2016–17 Actual results
2015–16 Actual results
2014–15 Actual results
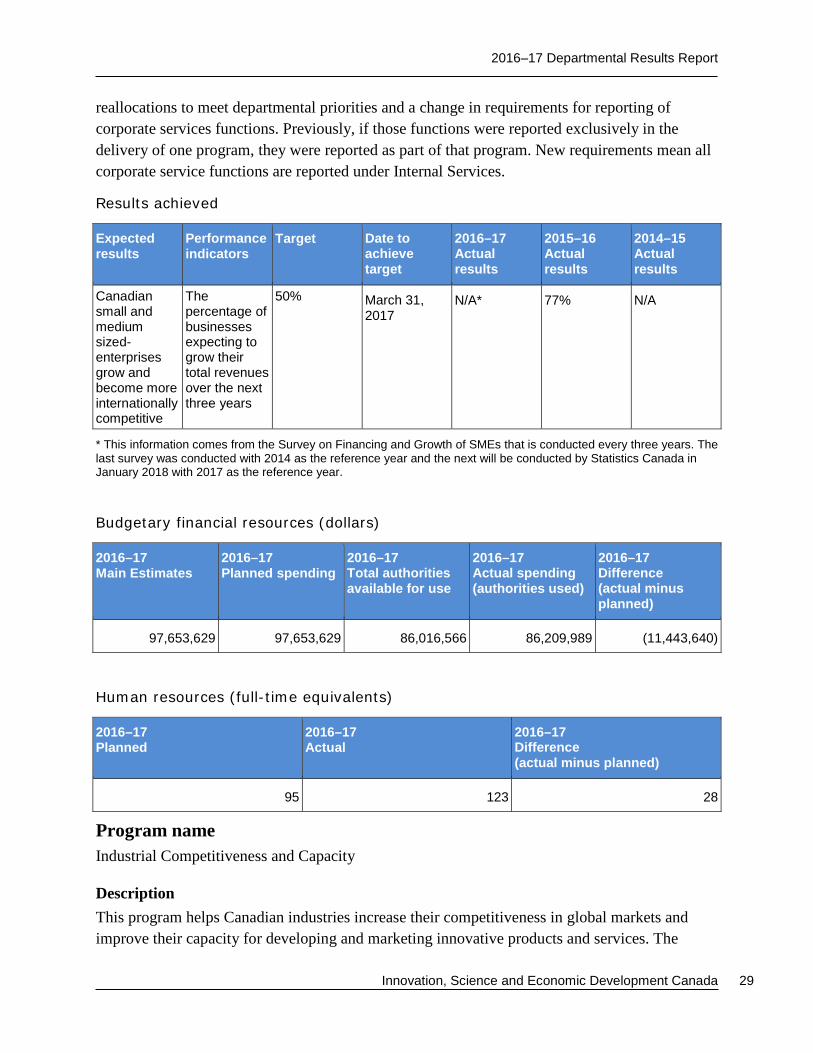
Canadian small and medium sized-enterprises grow and become more internationally competitive
The percentage of businesses expecting to grow their total revenues over the next three years
50% March 31, 2017
N/A* 77% N/A
* This information comes from the Survey on Financing and Growth of SMEs that is conducted every three years. The last survey was conducted with 2014 as the reference year and the next will be conducted by Statistics Canada in January 2018 with 2017 as the reference year.
Budgetary financial resources (dollars)
2016–17 Main Estimates
2016–17 Planned spending
2016–17 Total authorities available for use
2016–17 Actual spending (authorities used)
2016–17 Difference (actual minus planned)
97,653,629 97,653,629 86,016,566 86,209,989 (11,443,640)
Human resources (full-time equivalents)
2016–17 Planned
2016–17 Actual
2016–17 Difference (actual minus planned)
95 123 28
Program name Industrial Competitiveness and Capacity
Description This program helps Canadian industries increase their competitiveness in global markets and improve their capacity for developing and marketing innovative products and services. The

2016–17 Departmental Results Report
30 Results: what we achieved
program develops expertise on Canadian firms and sectors through research and analysis and engagement with associations, governments and leading firms. It applies this expertise to develop and contribute to policy, legislation and regulations aimed at strengthening the contribution of industry to Canada’s innovation performance and economic well-being. This program collaborates with the private sector on industry development; attracts investment and promotes Canadian expertise; and advances initiatives for increasing productivity and supporting growth.
Results In 2016–17, ISED continued to strengthen the manufacturing sector to foster globally competitive industries, while creating jobs and economic growth. This was supported through research, policy analysis and outreach programs designed to better understand and support Canadian manufacturers in a number of fields, including life sciences, resource processing and manufacturing, hydrogen and fuel cells, food and beverage processing, artificial intelligence and synthetic biology.
The Department advanced Canada’s position in industrial policy and technology development through national and international engagement, including the Minister of Innovation, Science and Economic Development’s participation in the 2017 World Economic Forum, the Federal/Provincial/Territorial (FPT) Working Group on Clusters and Leading Edge Technologies, the CEO Roundtable on Advanced Robotics and Intelligent Automation, various Organisation for Economic Co-operation and Development (OECD) working groups and committees (biotechnology, nanotechnology and steel), the G20 Global Forum on Steel Excess Capacity and the G20 Conference on Digitizing Manufacturing.
ISED successfully negotiated the National Shipbuilding Strategy (NSS) Value Proposition Terms and Conditions for the design contract on the Navy’s Joint Support Ships. The Department also assessed and approved all NSS Value Proposition Investments related to the Arctic Offshore Patrol Ships. The Industrial and Regional Benefits Policy requires contractors to undertake business activities in Canada equal to the value of the contract they have won. This includes commitments for direct work as well as minimum mandatory work commitments involving small and medium-sized enterprises. The NSS Value Proposition contributes to the development and sustainability of the Canadian marine industry as it obligates the selected NSS large vessel shipyards to invest a value equal to 0.5 percent of the resultant contract price in the three priority areas of human resources development, technology investment, and industrial development.
ISED worked with the Department of Public Services and Procurement and the Department of National Defence to contract eight procurements, valued at more than $3 billion, subject to the Industrial and Technological Benefit (ITB) Policy. The Industrial and Regional Benefits (IRB) Policy was applied to the Joint Support Ship Design and Production Engineering contract worth

2016–17 Departmental Results Report
Innovation, Science and Economic Development Canada 31
$158 million. The Department also continued to monitor defence procurements with IRB Commitments. These procurements generated $2.8 billion in economic benefits across Canada in 2016–17.
Efforts to grow partnerships between Canadian and Indian business incubators and accelerators continued in 2016–17, including the announcement of a new program at Ryerson University’s facility at the Bombay Stock Exchange that supports firms looking to expand into India. In November 2016, the Minister of Innovation, Science and Economic Development visited India in support of Canadian business interests. As well, a business mission led by the Information Technology Association of Canada (ITAC) convened a group of Canadian SMEs seeking business opportunities in India.
The Minister of Small Business and Tourism participated in a meeting of the Canadian Council of Tourism Ministers (CCTM) in Iqaluit, Nunavut on November 24, 2016. At the meeting, federal, provincial and territorial ministers agreed to the Nunavut Declaration, committing to the FPT Tourism Strategy in order to support continued collaboration on tourism and contribute to the growth and competitiveness of the tourism sector in Canada. The FPT Tourism Strategy contains three priority areas: competitiveness (which includes action items such as marketing), product development (which includes action items such as Indigenous tourism, sharing economy and parks tourism), and research and statistics. The Department also worked with partners to develop Canada’s New Tourism Vision through ongoing engagement with stakeholders and other government departments and agencies. The Vision, which was launched by the Minister of Small Business and Tourism in May 2017, identifies 20 targeted action items, including stabilized funding for Destination Canada and growing culinary tourism, to help support the competitiveness of the tourism sector in Canada.
Results achieved
Expected results
Performance indicators
Target Date to achieve target
2016–17 Actual results
2015–16 Actual results
2014–15 Actual results
Canadian industries have the capacity to prepare for and respond to risks and opportunities in domestic and global markets
Canada's ranking among G7 countries for "value chain breadth"vi
6th March 31, 2017
7th 7th 7th
Canada's ranking among G7 countries for "firm-level technology absorption"vi
6th March 31, 2017
5th 6th 6th

2016–17 Departmental Results Report
32 Results: what we achieved
Budgetary financial resources (dollars)
2016–17 Main Estimates
2016–17 Planned spending
2016–17 Total authorities available for use
2016–17 Actual spending (authorities used)
2016–17 Difference (actual minus planned)
34,316,964 34,316,964 34,708,383 32,364,461 (1,952,503)
Human resources (full-time equivalents)
2016–17 Planned
2016–17 Actual
2016–17 Difference (actual minus planned)
225 220 (5)
Program name Community Economic Development
Description This program advances the economic development of Northern Ontario communities in the same manner that regional development agencies support similar activities in other regions of Canada. Its main goal is to strengthen the Northern Ontario economy by providing financial support through contribution agreements for economic and community development projects led by the private, not-for-profit and public sectors, including support for official language minority communities. This program also contributes to improving the availability of broadband Internet access across Canada and provides computers for schools and not-for-profit organizations.
Results In 2016–17, ISED continued to implement the Connecting Canadians program, which received and reviewed more than 300 applications, from which 87 projects were approved. Once completed, by 2019, the selected projects will provide approximately 300,000 households with extended and enhanced broadband service at a minimum target speed of 5 megabits per second.
To build on the ongoing progress of Connecting Canadians, the Government of Canada launched the Connect to Innovate (CTI) program to extend and enhance broadband service in rural and remote communities. This initiative will invest $500 million across Canada, with a focus on supporting new backbone infrastructure projects that connect public institutions such as schools, hospitals and First Nation band offices. Throughout the spring and summer of 2016, ISED consulted with more than 300 stakeholders, including Internet service providers and network

2016–17 Departmental Results Report
Innovation, Science and Economic Development Canada 33
operators across Canada, as well as federal and provincial/territorial/municipal partners, to develop a comprehensive picture of broadband connectivity in Canada.
The Regional Development Agency (RDA) Secretariat, a new group within ISED, facilitated broader RDA integration and alignment with the ISED portfolio, helping to align policy priorities with the Innovation and Skills Plan and clean growth. For example, ISED worked with the RDAs to establish a national framework to support regional innovation and economic development.
The Department also supported the Atlantic Canada Opportunities Agency’s launch of the Atlantic Growth Strategy, which aims to strengthen the Atlantic economy and increase job opportunities for Atlantic Canadians. ISED also engaged RDAs as key partners to deliver the Accelerated Growth Service as part of the Innovation and Skills Plan, supporting high growth firms and innovators in the regions through commercialization stages to success.
ISED, through FedNor, delivered significant results for people, communities and small and medium-sized businesses of Northern Ontario. By working in collaboration with partners from across the region, and all levels of government, FedNor supported a broad range of projects to promote growth and prosperity in the region.
Of particular importance, FedNor, encouraged innovation that helped build and nurture an innovation ecosystem that aligned with ISED’s new priorities, and demonstrated the potential to accelerate the growth of local businesses and economies. For example, FedNor supported clean energy options for remote Indigenous communities; Regional Innovation Centres that help develop private sector firms; biomedical research infrastructure, supporting cluster development in the health sector; and, access to venture capital.
In response to a recommendation from the 2016 Northern Ontario Development Program (NODP) evaluation to support the Government of Canada’s Innovation Agenda, FedNor convened several consultations with various stakeholder groups to promote the departmental Innovation Agenda and strengthen regional collaboration of proponents, and maximized FedNor investments by leveraging other federal and provincial contributions related to innovation. FedNor also refocused the NODP to align with Government of Canada priorities, resulting in funding application approvals focussed on strong results for Northern Ontario.
In 2017, FedNor also developed a framework for the Prosperity and Growth Strategy for Northern Ontario that aligns with Canada’s Innovation and Skills Plan, to highlight the economic growth opportunities as well as the efforts required to diversify the economic base of Northern Ontario communities. The framework focuses on four areas of potential growth and diversification including: building a diverse, skilled and educated workforce; promoting the adoption of advanced technologies, including clean technology; encouraging business to start up and scale up to compete globally; and, helping municipalities and Indigenous communities better respond to opportunities and challenges. The framework will set the stage for discussion with

2016–17 Departmental Results Report
34 Results: what we achieved
Northern Ontario stakeholders and government partners at all levels in the development of the final strategy.
Through the Computers for Schools program, the Department continued to improve access to computer equipment for Canadians. As part of the program, ISED contributed to the #WelcomeRefugees initiative by delivering 7,567 computers to Syrian refugees and resettlement organizations. In total, the Computers for Schools program provided 74,896 refurbished computers to schools and non-profit organizations, including those that support low-income Canadians, seniors, Indigenous communities, and new Canadians.
Results achieved
Expected results
Performance indicators
Target Date to achieve target
2016–17 Actual results
2015–16 Actual results
2014–15 Actual results
Targeted businesses and organizations in Northern Ontario create economic growth
Number of Northern Ontario businesses created, expanded or maintained with FedNor assistance
1,700 March 31, 2017
1,776 2,313 2,100
Budgetary financial resources (dollars)
2016–17 Main Estimates
2016–17 Planned spending
2016–17 Total authorities available for use
2016–17 Actual spending (authorities used)
2016–17 Difference (actual minus planned)
142,379,294 142,379,294 162,988,503 146,688,613 4,309,319
Human resources (full-time equivalents)
2016–17 Planned
2016–17 Actual
2016–17 Difference (actual minus planned)
114 109 (4)
2016–17 Departmental Results Report
Innovation, Science and Economic Development Canada 35
Supporting information on results, financial and human resources relating to ISED’s lower-level programs is available on TBS InfoBase.vii

2016–17 Departmental Results Report
36 Results: what we achieved
Internal Services Description Internal Services are those groups of related activities and resources that the federal government considers to be services in support of programs and/or required to meet corporate obligations of an organization. Internal Services refers to the activities and resources of the 10 distinct service categories that support Program delivery in the organization, regardless of the Internal Services delivery model in a department. The 10 service categories are: Management and Oversight Services; Communications Services; Legal Services; Human Resources Management Services; Financial Management Services; Information Management Services; Information Technology Services; Real Property Services; Materiel Services; and Acquisition Services.
Results In 2016–17, ISED’s ongoing provision of internal services and the initiatives noted below were grounded in sound financial management practices and designed to improve the efficient and effective delivery of programs and operations.
Innovation 2020
ISED continued to implement its Innovation 2020 agenda, which is the Department’s approach to public service renewal and is inspired by the Blueprint 2020 vision.viii The agenda includes activities in three areas: creating an agile workforce, ensuring sound stewardship and instilling a culture of openness and transparency by adopting an ‘operating as one’ work style.
Agile Workforce
To support learning and growth among employees, ISED implemented a Short-term Experience Program, which had 12 participants in 2016–17, continued its development program for policy analysts and increased its emphasis on enterprise-wide approaches to employee recruitment and development, as well as more strategic entry-level hiring, including hiring 297 students. The Department also hosted Career Advisory Panels, where 40 participants met with senior executives and managers to discuss their professional development.
Sound Stewardship
A key element of sound stewardship is ensuring a healthy workforce. ISED has increased its efforts to support the mental health of its employees. To build on the federal mental health strategy, ISED is developing a departmental Mental Health Strategy and has provided a series of seminars and events on mental health for all employees and appointed a departmental Mental Health Champion.

2016–17 Departmental Results Report
Innovation, Science and Economic Development Canada 37
ISED reviewed and revised its project investment prioritization framework in 2016–17 in order to incorporate lessons learned and to align with the new Government of Canada IT Project prioritization framework.
A key element of the department’s Human Resources (HR) Business Transformation Strategy has been increasing the efficiency of HR processes and services. Lean process reviews are underway to simplify and streamline hiring and staffing processes.
Operating as One
ISED began the operational deployment of GCDOCS information management system in 2016–17, with approximately 20 percent of shared drive-hosted files migrated by March 31, 2017.
The Department worked with Portfolio organizations to collaborate and provide guidance and advice on strategic direction on planning and reporting documents, joint initiatives and events.
The variance between Planned and Actual Spending is primarily due to additional funding received during the year, including the operating budget carry forward, Internal Services reallocations and Program Alignment Architecture realignment. The variance between Planned and Actual FTEs is mainly due to a change in requirements for reporting of corporate services functions. Previously, if those functions were reported exclusively in the delivery of one program, they were reported as part of that program. New requirements mean all corporate service functions are reported under Internal Services.
Budgetary financial resources (dollars)
2016–17 Main Estimates
2016–17 Planned spending
2016–17 Total authorities available for use
2016–17 Actual spending (authorities used)
2016–17 Difference (actual minus planned)
133,198,881 133,198,881 172,036,346 154,093,770 20,894,889
Human resources (full-time equivalents)
2016–17 Planned
2016–17 Actual
2016–17 Difference (actual minus planned)
1,172 1,410 238

2016–17 Departmental Results Report
38 Results: what we achieved

2016–17 Departmental Results Report
Innovation, Science and Economic Development Canada 39
Analysis of trends in spending and human resources
Actual expenditures Departmental spending trend graph
The increase in spending starting in 2016–17 is mostly explained by new funding for the Post-Secondary Institution Strategic Investment Fund (Budget 2016 provided $2 billion over three years, starting in 2016–17. Funding for this initiative sunsets in 2019–20).
Figures also reflect the transfer of financial responsibility of Sustainable Development Technology Canada’s Sustainable Development Technology Fund to ISED as of 2016–17.

2016–17 Departmental Results Report
40 Analysis of trends in spending and human resources
Budgetary performance summary for Programs and Internal Services (dollars)
Programs and Internal Services
2016–17 Main Estimates
2016–17 Planned spending
2017–18 Planned spending
2018–19 Planned spending
2016–17 Total authorities available for use
2016–17 Actual spending (authorities used)
2015–16 Actual spending (authorities used)
2014–15 Actual spending (authorities used)
Marketplace Frameworks and Regulations (1)
66,943,246 66,943,246 73,447,129 63,161,186 222,976,003 50,124,282 42,207,493 50,785,898
Marketplace Competition and Investments (2)
46,563,535 46,563,535 41,903,401 41,903,401 41,935,930 41,153,360 46,107,684 48,628,660
Spectrum, Telecommunications, and the Digital Economy (3)
106,285,898 106,285,898 98,327,554 92,940,422 106,179,081 98,326,709 117,906,335 123,580,591
Science, Technology and Innovation Capacity (4)
342,834,370 342,834,370 1,531,761,184 826,994,964 1,198,477,652 1,197,358,867 311,415,582 313,406,524
Industrial Research and Development Financing (5)
326,898,851 326,898,851 359,430,758 465,079,093 332,439,783 280,593,734 244,450,613 220,998,346
Small Business Research, Financing and Services (6)
97,653,629 97,653,629 84,501,977 85,927,003 86,016,566 86,209,989 85,392,842 91,428,836
Industrial Competitiveness and Capacity
34,316,964 34,316,964 35,618,706 33,118,707 34,708,383 32,364,461 33,947,200 31,303,195
Community Economic Development (7) 142,379,294 142,379,294 213,105,186 316,782,514 162,988,503 146,688,613 156,421,933 83,737,928
Subtotal 1,163,875,789 1,163,875,789 2,438,125,895 1,925,907,290 2,185,721,901 1,932,820,014 1,037,849,681 963,869,978
Internal Services (8) 133,198,881 133,198,881 152,780,251 152,337,683 172,036,346 154,093,770 131,984,816 133,544,518
Total 1,297,074,670 1,297,074,670 2,590,906,146 2,078,244,973 2,357,758,247 2,086,913,784 1,169,834,497 1,097,414,496
Note: Variance explanations for 2016–17 financial information are provided below. For past and future years, consult previous ISED Parliamentary reports.ix

2016–17 Departmental Results Report
Innovation, Science and Economic Development Canada 41
Budgetary performance summary explanation
1. The Total Authorities Available for Use for this program in 2016–17 includes $176 million in unused authorities accumulated by CIPO since its creation in 1994. CIPO is an organization within the Department that is funded entirely from the revenues it generates, drawing from its unused authorities as required. The variance between Planned and Actual Spending is primarily due to a delay in the upgrades to CIPO’s information technology infrastructure and to lower than planned salaries and benefits expenses.
2. The variance between Planned and Actual Spending is mainly due to lower than planned salaries and benefits expenses and to a change in requirements for reporting of corporate services functions.*
3. The variance between Planned and Actual Spending is mainly due to lower than planned salaries and benefits expenses, internal realignment, and a change in requirements for reporting of corporate services functions.*
4. The variance between Planned and Actual Spending is primarily due to new funding received for the Post-Secondary Institutions Strategic Investment Fund, Mitacs Inc. and the Stem Cell Network, as well as the transfer of responsibilities for Sustainable Development Technology Canada to ISED.
5. The variance between Planned and Actual Spending is mainly due to funding for the AIF that was reprofiled from 2016–17 to 2017–18 to align program resources with anticipated project needs.
6. The variance between Planned and Actual Spending is primarily a result of a drop in claims received for the CSBFP and payments made for defaulted loans. This is partially offset by an increase in funding for the Service for Business sub-program and internal reallocations to align funding with program requirements.
7. The variances in Planned Spending between 2016–17 and future years are primarily due to new funding received for the Connect to Innovate program.
8. The variance between Planned and Actual Spending is primarily due to additional funding received during the year, including the operating budget carry forward and Internal Services reallocations.
* Previously, if corporate services functions were reported exclusively in the delivery of one program, they were reported as part of that program. New requirements mean all corporate service functions are reported under Internal Services.

2016–17 Departmental Results Report
42 Analysis of trends in spending and human resources
Actual human resources Human resources summary for Programs and Internal Services (full-time equivalents)
Programs and Internal Services
2014–15 Actual
2015–16 Actual
2016–17 Planned
2016–17 Actual
2017–18 Planned
2018–19 Planned
Marketplace Frameworks and Regulations
1,699 1,729 1,778 1,743 1,801 1,807
Marketplace Competition and Investments (1)
384 379 384 347 351 351
Spectrum, Telecommunications, and the Digital Economy (2)
800 806 801 700 715 711
Science, Technology and Innovation Capacity (3)
70 68 65 101 98 95
Industrial Research and Development Financing (4)
72 73 77 48 50 51
Small Business Research, Financing and Services (5)
103 100 95 123 119 119
Industrial Competitiveness and Capacity
222 235 225 220 210 212
Community Economic Development 117 119 114 109 114 112
Subtotal 3,467 3,509 3,538 3,391 3,458 3,458
Internal Services (6) 1,201 1,202 1,172 1,410 1,417 1,417
Total 4,668 4,711 4,710 4,801 4,875 4,875
Note: Variance explanations for 2016–17 human resources information are provided below. For past and future years, consult previous ISED Parliamentary reports.x

2016–17 Departmental Results Report
Innovation, Science and Economic Development Canada 43
Human resources summary explanation
1. The variances between Planned and Actual FTEs are mainly due to a change in requirements for reporting of corporate services functions.*
2. The variances between Planned and Actual FTEs are mainly due to lower than planned salaries and benefits expenses, internal realignment, and a change in requirements for reporting of corporate services functions.*
3. The variance between Planned and Actual FTEs is mainly due to an increase in resources for SIF and internal reallocations to align with departmental priorities.
4. The variance between Planned and Actual FTEs is mainly due to a change in requirements for reporting of corporate services functions.*
5. The variance between Planned and Actual FTEs is mainly related to new resources for Improving Support for Entrepreneurs and Small Business Growth, internal reallocations to meet departmental priorities and a change in requirements for reporting of corporate services functions.*
6. The variance between Planned and Actual FTEs is mainly due to a change in requirements for reporting of corporate services functions.*
* Previously, if corporate services functions were reported exclusively in the delivery of one program, they were reported as part of that program. New requirements mean all corporate service functions are reported under Internal Services.
Expenditures by vote For information on ISED’s organizational voted and statutory expenditures, consult the Public Accounts of Canada 2017.xi

2016–17 Departmental Results Report
44 Alignment of spending with the whole-of-government framework
Alignment of spending with the whole-of-government framework Alignment of 2016−17 actual spending with the whole-of-government frameworkxii (dollars)
Program Spending area Government of Canada activity
2016–17 Actual spending
Marketplace Frameworks and Regulations
Economic Affairs A fair and secure marketplace 50,124,282
Marketplace Competition and Investments
Economic Affairs A fair and secure marketplace 41,153,360
Spectrum, Telecommunications, and the Digital Economy
Economic Affairs A fair and secure marketplace 98,326,709
Science, Technology and Innovation Capacity
Economic Affairs An innovative and knowledge-based economy
1,197,358,867
Industrial Research and Development Financing
Economic Affairs An innovative and knowledge-based economy
280,593,734
Small Business Research, Financing and Services
Economic Affairs Strong economic growth 86,209,989
Industrial Competitiveness and Capacity
Economic Affairs Strong economic growth 32,364,461
Community Economic Development
Economic Affairs Strong economic growth 146,688,613
Total spending by spending area (dollars)
Spending area Total planned spending Total actual spending
Economic affairs 1,163,875,789 1,932,820,014
Social affairs 0 0
International affairs 0 0
Government affairs 0 0

2016–17 Departmental Results Report
Innovation, Science and Economic Development Canada 45
Financial statements and financial statements highlights Financial statements The financial highlights presented in this document are intended to serve as a general overview of ISED’s financial position and operations and should be read in conjunction with the 2016–17 Departmental Financial Statements. ISED’s financial statements (unaudited) for the year ended March 31, 2017, are available on the departmental website.xiii
Financial statements highlights The financial results are shaped by the Department’s programs and internal services that aim to help make Canada a world-leading centre for innovation, to help create better jobs, to strengthen and grow the middle class and to provide better opportunities for all Canadians.
Condensed Statement of Operations (unaudited) for the year ended March 31, 2017 (dollars)xiv
Financial information 2016–17 Planned results*
2016–17 Actual
2015–16 Actual
Difference (2016–17 actual minus 2016–17 planned)
Difference (2016–17 actual minus 2015–16 actual)
Total expenses 1,426,894,680 2,236,821,778 1,122,047,584 809,927,098 1,114,774,194
Total revenues 253,807,000 229,530,814 233,698,794 (24,276,186) (4,167,980)
Net cost of operations before government funding and transfers
1,173,087,680 2,007,290,964 888,348,790 834,203,284 1,118,942,174
* As per the 2016–17 Future-Oriented Statement of Operations.
Planned Results
The $809.9 million variance between the 2016–17 Planned Results and the 2016–17 Actual expenses is mainly due to new transfer payment funding, announced in Budget 2016, for the Post-Secondary Institutions Strategic Investment Fund (PSI-SIF) and the future payments owed and recorded for the Canadian Institute for Advanced Research (CIFAR). The variance also includes program spending for the Sustainable Development Technology Canada (SDTC) Fund, whose financial responsibility transferred to ISED in 2016–17. Operating expenses were lower than planned in 2016–17, particularly in salaries and employee benefits, which are mainly based on the 2016–17 Main Estimates, as well as professional and special services, where planned spending estimates were based on historical averages.
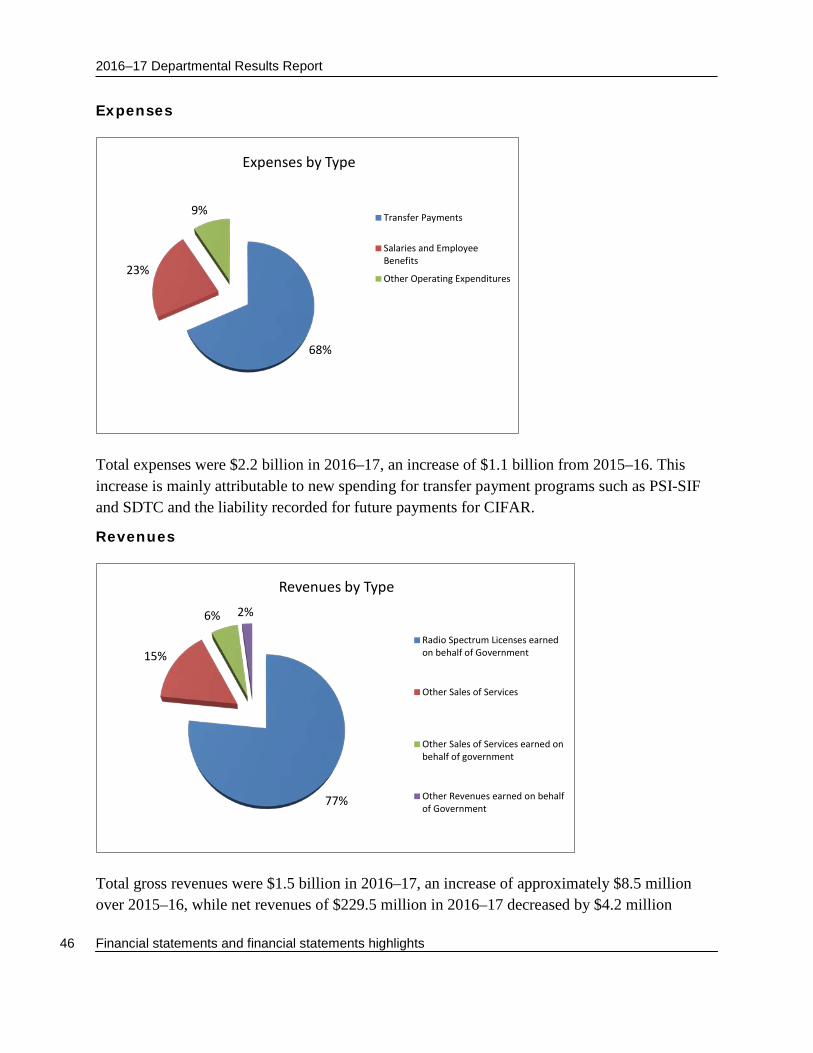
2016–17 Departmental Results Report
46 Financial statements and financial statements highlights
Expenses
Total expenses were $2.2 billion in 2016–17, an increase of $1.1 billion from 2015–16. This increase is mainly attributable to new spending for transfer payment programs such as PSI-SIF and SDTC and the liability recorded for future payments for CIFAR.
Revenues
Total gross revenues were $1.5 billion in 2016–17, an increase of approximately $8.5 million over 2015–16, while net revenues of $229.5 million in 2016–17 decreased by $4.2 million
68%
23%
9%
Expenses by Type
Transfer Payments
Salaries and EmployeeBenefits
Other Operating Expenditures
77%
15%
6% 2%
Revenues by Type
Radio Spectrum Licenses earnedon behalf of Government
Other Sales of Services
Other Sales of Services earned onbehalf of government
Other Revenues earned on behalfof Government

2016–17 Departmental Results Report
Innovation, Science and Economic Development Canada 47
compared to the previous fiscal year. Spectrum licences and revenue from fines account for the majority of the increase in gross revenue since 2015–16. Revenues from spectrum licences represent the majority of gross reported revenue in the Departmental Financial Statements. It is reported as revenue earned on behalf of Government as it cannot be accessed by the Department. Other sales of services represent legislative fees and registrations collected by organizations such as the Canadian Intellectual Property Office, the Office of the Superintendent of Bankruptcy and the Canada Small Business Financing Program. A portion of these revenues is non-respendable and are reported as revenue earned on behalf of Government.
Condensed Statement of Financial Position (unaudited) as at March 31, 2017 (dollars)
Financial Information 2016–17 2015–16 Difference (2016–17 minus 2015–16)
Total net liabilities 946,520,309 811,611,627 134,908,682
Total net financial assets 420,220,966 317,060,244 103,160,722
Departmental net debt 526,299,343 494,551,383 31,747,960
Total non-financial assets 128,945,894 123,911,393 5,034,501
Departmental net financial position
(397,353,449) (370,639,990) (26,713,459)
Liabilities
89%
6% 3% 1% 1%
Liabilities by Type
Deferred Revenue Held on Behalf ofGovernment
Accounts Payable and AccruedLiabilities
Allowance for loan guarantees
Deferred Revenue
Other Liabilities

2016–17 Departmental Results Report
48 Financial statements and financial statements highlights
Total gross liabilities were $9.1 billion for 2016–17, a decrease of $650.5 million year-over-year, while net liabilities were $946.5 million, an increase of $134.9 million compared to 2015–16. The decrease in gross liabilities is mainly attributable to deferred revenues. There were no new spectrum auctions in 2016–17 and, as a result, the recognition of revenue from previous year auctions resulted in a decrease of the liabilities. The majority (99 percent) of the deferred revenue cannot be accessed by ISED and is therefore reported as a liability held on behalf of Government.
Assets
Total gross financial assets were $2 billion for 2016–17, a decrease of $265.2 million from 2015–16, while net financial assets were $420.2 million, an increase of $103.2 million year-over-year. The decrease in gross financial assets is primarily attributable to the repayment of an enterprise development loan and continued payments of unconditionally repayable contributions.
18%
1%2%
73%
6%
Assets by Type
Due from CRF
Accounts Receivable
Accounts Receivable heldon behalf of Government
Loans Receivable held onbehalf of government
Tangible Capital Assets

2016–17 Departmental Results Report
Innovation, Science and Economic Development Canada 49
Supplementary information
Corporate information Organizational profile Minister of Innovation, Science and Economic Development:
The Honourable Navdeep Bains, P.C., M.P.
Minister of Science:
The Honourable Kirsty Duncan, P.C., M.P.
Minister of Small Business and Tourism and Leader of the Government in the House of Commons:
The Honourable Bardish Chagger, P.C., M.P.
Deputy Head:
John Knubley
Ministerial portfolio:
Innovation, Science and Economic Development Enabling instrument:
Department of Industry Act, S.C. 1995, c.1.xv
Year of incorporation:
1892

2016–17 Departmental Results Report
50 Supplementary information
Reporting framework ISED’s Strategic Outcomes and Program Alignment Architecture of record for 2016–17 are shown below.
Strategic Outcome: The Canadian marketplace is efficient and competitive Program: Marketplace Frameworks and Regulation
Sub-Program: Trade Measurement Sub-Program: Insolvency Sub-Program: Federal Incorporation Sub-Program: Intellectual Property Sub-Program: Market Access Sub-Program: Consumer Affairs
Program: Marketplace Competition and Investments Sub-program: Competition Law Enforcement Sub-program: Investment Review Program: Spectrum, Telecommunications and the Digital Economy Sub-program: Spectrum and Telecommunications Policy and Legislation
Sub-program: Spectrum Management and Regulation Sub-program: Communications Technologies Research and Innovation
Strategic Outcome: Advancements in science and technology, knowledge, and innovation strengthen the Canadian economy Program: Science, Technology and Innovation Capacity
Sub-Program: Science and Technology Policy and Analysis Sub-Program: Science and Technology Partnerships
Program: Industrial Research and Development Financing Sub-program: Automotive Innovation Sub-program: Aerospace and Defence Innovation

2016–17 Departmental Results Report
Innovation, Science and Economic Development Canada 51
Strategic Outcome: Canadian businesses and communities are competitive Program: Small Business Research, Financing and Services
Sub-Program: Small Business Financing and Growth Sub-Program: Service for Business
Program: Industrial Competitiveness and Capacity Sub-program: Industry-Specific Policy and Analysis Sub-program: Economic Outcomes from Procurement Program: Community Economic Development Sub-program: Northern Ontario Economic Development Sub-program: Computer and Internet Access
Internal Services
Supporting information on lower-level programs Supporting information on results, financial and human resources relating to ISED’s lower-level programs is available on TBS InfoBase.xvi
2016–17 Departmental Results Report
52 Supplementary information
Supplementary information tables The following supplementary information tables are available on ISED’s website:xvii
Details on transfer payment programs of $5 million or more Internal audits and evaluations Response to parliamentary committees and external audits Up-front multi-year funding User fees, regulatory charges and external fees Departmental Sustainable Development Strategy
Federal tax expenditures The tax system can be used to achieve public policy objectives through the application of special measures such as low tax rates, exemptions, deductions, deferrals and credits. The Department of Finance Canada publishes cost estimates and projections for these measures each year in the Report on Federal Tax Expenditures.xviii This report also provides detailed background information on tax expenditures, including descriptions, objectives, historical information and references to related federal spending programs. The tax measures presented in this report are the responsibility of the Minister of Finance.
Organizational contact information
Corporate Management Sector Innovation, Science and Economic Development Canada 235 Queen Street 2nd Floor, East Tower Ottawa ON K1A 0H5 Email: [email protected] Fax: 613-954-2340
2016–17 Departmental Results Report
Innovation, Science and Economic Development Canada 53
Appendix: definitions appropriation (crédit) Any authority of Parliament to pay money out of the Consolidated Revenue Fund.
budgetary expenditures (dépenses budgétaires) Operating and capital expenditures; transfer payments to other levels of government, organizations or individuals; and payments to Crown corporations.
Core Responsibility (responsabilité essentielle) An enduring function or role performed by a department. The intentions of the department with respect to a Core Responsibility are reflected in one or more related Departmental Results that the department seeks to contribute to or influence.
Departmental Plan (Plan ministériel) Provides information on the plans and expected performance of appropriated departments over a three-year period. Departmental Plans are tabled in Parliament each spring.
Departmental Result (résultat ministériel) A Departmental Result represents the change or changes that the department seeks to influence. A Departmental Result is often outside departments’ immediate control, but it should be influenced by program-level outcomes.
Departmental Result Indicator (indicateur de résultat ministériel) A factor or variable that provides a valid and reliable means to measure or describe progress on a Departmental Result.
Departmental Results Framework (cadre ministériel des résultats) Consists of the department’s Core Responsibilities, Departmental Results and Departmental Result Indicators.
Departmental Results Report (Rapport sur les résultats ministériels)
Provides information on the actual accomplishments against the plans, priorities and expected results set out in the corresponding Departmental Plan.
Evaluation (évaluation)
In the Government of Canada, the systematic and neutral collection and analysis of evidence to judge merit, worth or value. Evaluation informs decision making, improvements, innovation and accountability. Evaluations typically focus on programs, policies and priorities and examine
2016–17 Departmental Results Report
54 Appendix: definitions
questions related to relevance, effectiveness and efficiency. Depending on user needs, however, evaluations can also examine other units, themes and issues, including alternatives to existing interventions. Evaluations generally employ social science research methods.
full-time equivalent (équivalent temps plein) A measure of the extent to which an employee represents a full person-year charge against a departmental budget. Full-time equivalents are calculated as a ratio of assigned hours of work to scheduled hours of work. Scheduled hours of work are set out in collective agreements.
government-wide priorities (priorités pangouvernementales)
For the purpose of the 2016–17 Departmental Results Report, government-wide priorities refers to those high-level themes outlining the government’s agenda in the 2015 Speech from the Throne, namely: Growth for the Middle Class; Open and Transparent Government; A Clean Environment and a Strong Economy; Diversity is Canada's Strength; and Security and Opportunity.
horizontal initiatives (initiative horizontale) An initiative where two or more federal organizations, through an approved funding agreement, work toward achieving clearly defined shared outcomes, and which has been designated (for example, by Cabinet or a central agency) as a horizontal initiative for managing and reporting purposes.
Management, Resources and Results Structure (Structure de la gestion, des ressources et des résultats) A comprehensive framework that consists of an organization’s inventory of programs, resources, results, performance indicators and governance information. Programs and results are depicted in their hierarchical relationship to each other and to the Strategic Outcome(s) to which they contribute. The Management, Resources and Results Structure is developed from the Program Alignment Architecture.
non-budgetary expenditures (dépenses non budgétaires) Net outlays and receipts related to loans, investments and advances, which change the composition of the financial assets of the Government of Canada.
performance (rendement) What an organization did with its resources to achieve its results, how well those results compare to what the organization intended to achieve, and how well lessons learned have been identified.

2016–17 Departmental Results Report
Innovation, Science and Economic Development Canada 55
performance indicator (indicateur de rendement) A qualitative or quantitative means of measuring an output or outcome, with the intention of gauging the performance of an organization, program, policy or initiative respecting expected results.
performance reporting (production de rapports sur le rendement) The process of communicating evidence-based performance information. Performance reporting supports decision making, accountability and transparency.
planned spending (dépenses prévues) For Departmental Plans and Departmental Results Reports, planned spending refers to those amounts that receive Treasury Board approval by February 1. Therefore, planned spending may include amounts incremental to planned expenditures presented in the Main Estimates.
A department is expected to be aware of the authorities that it has sought and received. The determination of planned spending is a departmental responsibility, and departments must be able to defend the expenditure and accrual numbers presented in their Departmental Plans and Departmental Results Reports.
plans (plans) The articulation of strategic choices, which provides information on how an organization intends to achieve its priorities and associated results. Generally a plan will explain the logic behind the strategies chosen and tend to focus on actions that lead up to the expected result.
priorities (priorité) Plans or projects that an organization has chosen to focus and report on during the planning period. Priorities represent the things that are most important or what must be done first to support the achievement of the desired Strategic Outcome(s).
program (programme) A group of related resource inputs and activities that are managed to meet specific needs and to achieve intended results and that are treated as a budgetary unit.
Program Alignment Architecture (architecture d’alignement des programmes) A structured inventory of an organization’s programs depicting the hierarchical relationship between programs and the Strategic Outcome(s) to which they contribute.

2016–17 Departmental Results Report
56 Appendix: definitions
results (résultat) An external consequence attributed, in part, to an organization, policy, program or initiative. Results are not within the control of a single organization, policy, program or initiative; instead they are within the area of the organization’s influence.
statutory expenditures (dépenses législatives) Expenditures that Parliament has approved through legislation other than appropriation acts. The legislation sets out the purpose of the expenditures and the terms and conditions under which they may be made.
Strategic Outcome (résultat stratégique) A long-term and enduring benefit to Canadians that is linked to the organization’s mandate, vision and core functions.
sunset program (programme temporisé) A time-limited program that does not have an ongoing funding and policy authority. When the program is set to expire, a decision must be made whether to continue the program. In the case of a renewal, the decision specifies the scope, funding level and duration.
target (cible) A measurable performance or success level that an organization, program or initiative plans to achieve within a specified time period. Targets can be either quantitative or qualitative.
voted expenditures (dépenses votées) Expenditures that Parliament approves annually through an Appropriation Act. The Vote wording becomes the governing conditions under which these expenditures may be made.

2016–17 Departmental Results Report
Innovation, Science and Economic Development Canada 57
Endnotes i. The Ministers’ mandate letters, http://pm.gc.ca/eng/mandate-letters
ii. Canada’s Innovation and Skills Plan, http://www.ic.gc.ca/eic/site/062.nsf/eng/home
iii. Mandatory inspection frequencies, https://www.ic.gc.ca/eic/site/mc-mc.nsf/eng/lm04707.html
iv. Intellectual Property Enforcement Guidelines, http://www.competitionbureau.gc.ca/eic/site/cb- bc.nsf/eng/04031.html
v. A Summary of Consultation Responses — Data Breach Notification and Reporting Regulations, https://www.ic.gc.ca/eic/site/smt-gst.nsf/eng/sf11212.html
vi. Based on rankings in the World Economic Forum’s Global Competitiveness Report
vii. TBS InfoBase, https://www.tbs-sct.gc.ca/ems-sgd/edb-bdd/index-eng.html#start
viii. Innovation 2020, http://www.ic.gc.ca/eic/site/icgc.nsf/eng/h_07591.html
ix. ISED Parliamentary reports, http://www.ic.gc.ca/eic/site/017.nsf/eng/home
x. ISED Parliamentary reports, http://www.ic.gc.ca/eic/site/017.nsf/eng/home
xi. Public Accounts of Canada 2017, http://www.tpsgc-pwgsc.gc.ca/recgen/cpc-pac/index-eng.html
xii. Whole-of-government framework, https://www.tbs-sct.gc.ca/ems-sgd/edb-bdd/index-eng.html#tag-nav/~(current_branch~'GOCO~sort_key~'name~sort_direction~'asc~open_nodes~(~'tag_SA0001~'tag_SA9999~'tag_SA0002~'tag_SA0003~'tag_SA0004~'tag_SA0005))
xiii. ISED Financial Statements, http://www.ic.gc.ca/eic/site/017.nsf/eng/07606.html
xiv. The actual expenditures presented in other areas of this document were prepared on a cash basis, while the financial highlights that follow were prepared on an accrual basis. The tables in note 3 of the financial statements provide a reconciliation of these two accounting methods.
xv. Department of Industry Act, http://laws-lois.justice.gc.ca/eng/acts/i-9.2/
xvi. TBS InfoBase, https://www.tbs-sct.gc.ca/ems-sgd/edb-bdd/index-eng.html#start
xvii. Supplementary information tables, http://www.ic.gc.ca/eic/site/017.nsf/eng/07605.html
xviii. Report on Federal Tax Expenditures, http://www.fin.gc.ca/purl/taxexp-eng.asp


