
Innovation of Mathematics Education through Lesson Study ... · •Measures of central tendency...
39
Innovation of Mathematics Education through Lesson Study Textbook Development for SDGs, STEM, and Energy by Cross-border Education The case of Indonesia APEC – Khon Kaen International Symposium XII 9-12 September 2017 Wahyudi & Russasmita Sri Padmi SEAMEO Regional Center for QITEP in Mathematics
Transcript of Innovation of Mathematics Education through Lesson Study ... · •Measures of central tendency...

Innovation of Mathematics Education through Lesson Study
Textbook Development for SDGs, STEM, and
Energy by Cross-border EducationThe case of Indonesia
APEC – Khon Kaen International Symposium XII
9-12 September 2017
Wahyudi & Russasmita Sri PadmiSEAMEO Regional Center for QITEP in Mathematics

BACKGROUND
As a continuation of APEC-Tsukuba and UNESCO (MGIEP) International Conference XI, which was held in Tokyo, February 9-12, 2017,
Indonesia and Thailand have embarked on Cross-Border Lesson Study together. The cross-border lesson study was conducted on August 8, 2017.
Tasks using APEC Energy Database. The preparation start in the beginning of June

LESSON STUDY
PLAN
Research Lesson, Unit, Anticipate
students’ thinking
DO
Research Lesson, collect data
REFLECT
On Lesson Data and the
implication of teaching and
learning
STUDY
Teaching materials;
consider long term goals for
students.
(Lewis, 2016)

PHASE 1: STUDY

Lesson Plan
Theme set during APEC-
Tsukuba meeting
APEC energy database
Curriculum of statistics in Indonesia and
Thailand
CONSIDERATION PRIOR TO
DESIGNING THE LESSON

THE THEME OF THE LESSON
“Imagine hidden variables and relations through the questioning the graphs, and
appreciate the significance of being able to analyze the situation and predict the
future by using them.”

APEC DATABASE
http://www.egeda.ewg.apec.org/egeda/database/database-top.html
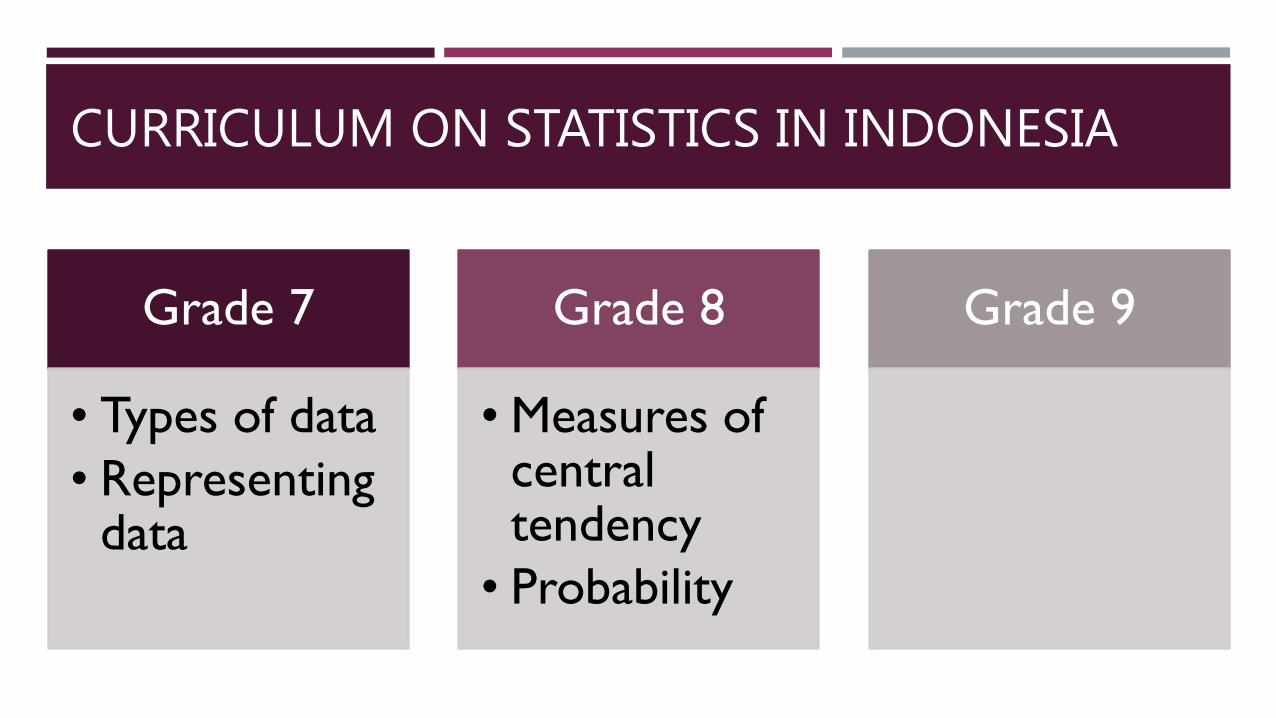
CURRICULUM ON STATISTICS IN INDONESIA
Grade 7
• Types of data
• Representing data
Grade 8
• Measures of central tendency
• Probability
Grade 9

PHASE II: PLAN

TIMELINE
DATE ACTIVITIES
22 May – 21 July, 2017 Desining lesson plan
2 June – 23 July 2017 Discussing and editing lesson plan together between Thailand and Indonesia
via email and video call
24-31 July, 2017 Prepare for Cross Border Lesson study
1 and 8 August, 2017 Cross-border Lesson study between Thailand and Indonesian students
Writing of the Report

INDONESIAN TEAM
Researchers
Dr. Wahyudi
Ms. Russasmita Sri Padmi
Ms. Fina Hanifa Hidayati
Ms. Mutiatul Hasanah
Model teacher
Darto
Staffs
Mr. Deni Saputra
Mr. Febriarto
Mr. Agus

THAILAND TEAM
Maitree Inprasith
Nalumon Inprasith
Auijit Pattanajak
Narumon Changsri
Phuangthong Poonrueng
Prapawadee Suwannatrai

THE LESSON PLAN
Title: The Cost of Our Bright World
Grade: 9
Topic: Statistics (in the context of energy)
Materials:
Worksheets 1.1 and 1.2 (for students)
PowerPoint presentation (for teacher)
Graph paper or graphing software (Ms. Excel)
projector and screen
A3 graphing paper.
WebEx meeting room and internet connection
SDG to be addressed:
SDG 13: take urgent action
to combat climate change
and its impacts.
SDG 7: ensure access to
affordable, reliable, and
sustainable energy for all.

LESSON OBJECTIVES
represent and describe energy-related data in the form of tables,
graph, and charts
interpret data in the context of energy
explain the correlation between different energy consumption and CO2
emission

OVERVIEW OF THE TASK
Focus was on
The data of electricity consumption and CO2 emission.
Analyzing data visually, mainly through the shape of the graph.
Meeting 1 (Worksheet 1)
The students compare electricity consumption of Indonesia and Thailand using
APEC Energy Database. This meeting is conducted separately in each country.
Meeting 2 (Worksheet 2)
The students investigate the primary source of energy used to generate
electricity and how it is related to CO2 emission. This meeting is connected via
WebEx.

“Which country, between Thailand and Indonesia, consume more electricity?”“What could be the reason behind this phenomenon?”
How much electricity do Indonesia and Thailand use?
THE COST OF OUR BRIGHT WORLDWorksheet 1

The table on the right shows electricity comparison of Thailand
and Indonesia during the period 1990-2014.
Represent the data in the form of line graph; blue pen for
Indonesia and red pen for thailand. You can also plot it on
Microsoft Excel and then copy it to the grid provided below.
Use the graph to help you answer the given questions in the
following pages.
Data can be accessed online at:
http://www.egeda.ewg.apec.org/egeda/
database/database-top.html
There are two sections of the worksheet: DESCRIBING DATA and INTERPRETING DATA.
How much electricity do Indonesia and Thailand use?
THE COST OF OUR BRIGHT WORLDWorksheet 1

INTERPRETING DATA
By looking at the graph,
describe the differences
and similarities between
electricity consumption of
Thailand and Indonesia.
The following are the
population count of
Indonesia and Thailand
from 1990 to 2015.
Do you agree that the consumption of electricity is related to the
number of people living in the country? Explain your reason.
What do you think is the factor that influence the amount of electricity
consumption of a country? Explain.
1
2
3
Source: www.gapminder.org/data/
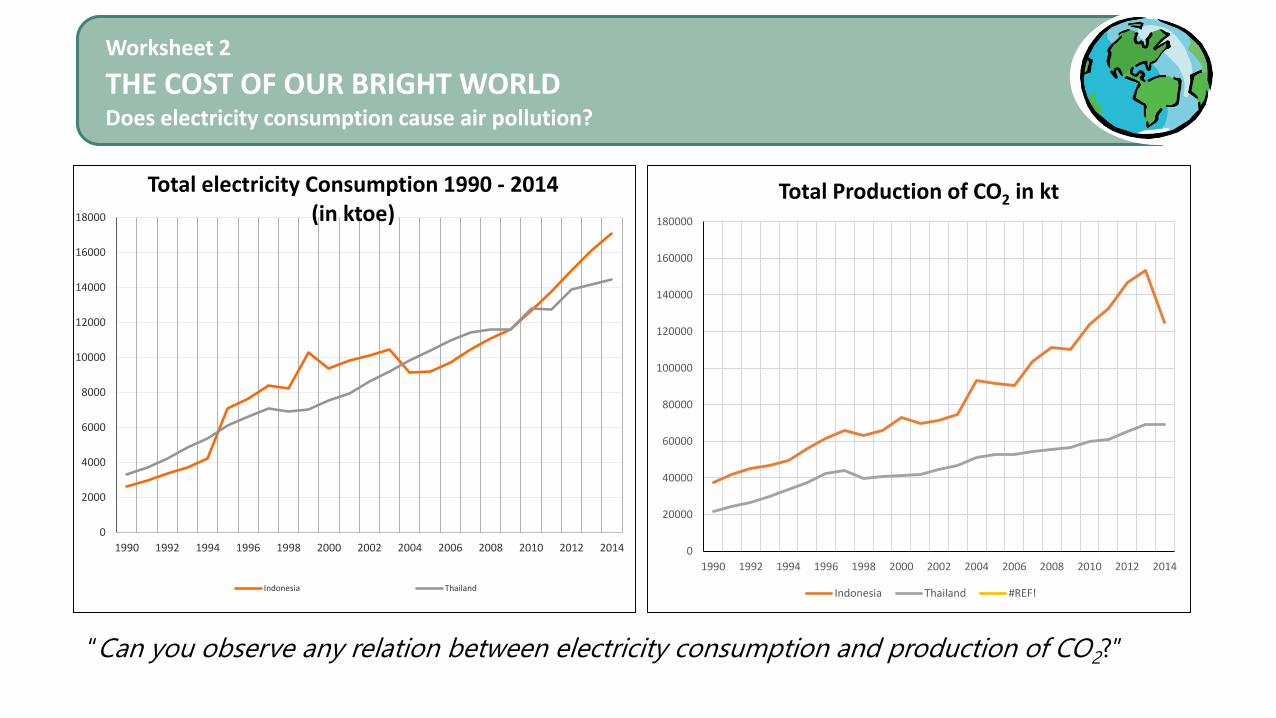
Does electricity consumption cause air pollution?
THE COST OF OUR BRIGHT WORLDWorksheet 2
0
2000
4000
6000
8000
10000
12000
14000
16000
18000
1990 1992 1994 1996 1998 2000 2002 2004 2006 2008 2010 2012 2014
Total electricity Consumption 1990 - 2014 (in ktoe)
Indonesia Thailand
0
20000
40000
60000
80000
100000
120000
140000
160000
180000
1990 1992 1994 1996 1998 2000 2002 2004 2006 2008 2010 2012 2014
Total Production of CO2 in kt
Indonesia Thailand #REF!
“Can you observe any relation between electricity consumption and production of CO2?”

The students are going to investigate data from the following countries.

0
50000
100000
150000
200000
250000
300000
350000
400000
450000
1990 1992 1994 1996 1998 2000 2002 2004 2006 2008 2010 2012 2014
Total Electricity consumption 1990 - 2014 (in ktoe)
China Indonesia Thailand United States of America
Graph 1
source: http://www.egeda.ewg.apec.org/egeda/database/database-top.html

Indonesia China USA Thailand
SOURCE OF ENERGY TO CREATE ELECTRICITY
The following are pie charts depicting source of energy for electricity in 2014. What can you conclude?
Graph 2
source: http://www.egeda.ewg.apec.org/egeda/database/database-top.html

0
100000
200000
300000
400000
500000
600000
700000
800000
900000
1990 1992 1994 1996 1998 2000 2002 2004 2006 2008 2010 2012 2014
Coal Consumption for Power Generation (in ktoe)
China Indonesia Thailand United States of America
Graph 3
source: http://www.egeda.ewg.apec.org/egeda/database/database-top.html

0
500000
1000000
1500000
2000000
2500000
3000000
1990 1992 1994 1996 1998 2000 2002 2004 2006 2008 2010 2012 2014
Total CO2 Emission in kt
China Indonesia Thailand United States of America
Graph 4
source: http://www.egeda.ewg.apec.org/egeda/database/database-top.html

INTERPRETING DATA
Observe Graph 1. For China and USA, their electricity consumption is going up.
However, in Graph 4, CO2 production of China is going up while USA’s CO2 production is going down.
What do you think is the cause behind these phenomenon? Explain your answer. Use the graph to support your reasoning.
1
2 Does higher electricity consumption influence higher CO2
production? Explain your assumptions.

PHASE III: DO

OUR STUDENTS
34 grade 8
students from SMPN
(Junior High School) 4
Pakem
32 grade 8
students from
Demonstration School of
Khon Khaen University
(Mo Ding Dang)

LESSON DAY 1August 1, 2017

LESSON DAY 1August 1, 2017

EXAMPLE OF STUDENTS’ ANSWER: MEETING 1Indonesian students

LESSON DAY 2August 8, 2017

VIDEO: MEETING 2

EXAMPLE OF STUDENTS’ ANSWER: LESSON DAY 2

PHASE IV: REFLECT

REFLECTION
The students were enthusiastic and greatly enjoyed the lesson.
They can understand the world through mathematics lesson by
investigating real life, raw data from reliable sources.
The lesson opens the possibility for the use of ICT which is
completely new to Indonesian education: connectivity.
The study needs to be implemented in more than one cycle to
accommodate the revision.

REFLECTION
Internet connection was a big obstacle.
Even though most of the time teachers and students can speak
English well, sometimes words are hard to comprehend due to
internet connection.
Recording the sound of the room makes it hard to understand
through internet.

SUGGESTION FOR THE NEXT LESSON STUDY:
For internet, it is recommended to use LAN/cable connection.
The broadcast should be provided with subtitles.
It is recommended that instead of recording the sound of the
room, the microphone should be connected through the
internet instead.

WHAT DO THE STUDENT THINK?
What did they like about the lesson?
What do they want to improve from
the lesson?

Thank you.


![Probability and Statistics Chapter 2: Descriptive Statistics PART 1 … · 2016-08-09 · 2.3A – Measures of Central Tendency [Distribution Shapes] 2.3A HW INSTRUCTIONS: Do not](https://static.fdocuments.net/doc/165x107/5f8f5cfe958ce6747727aeb4/probability-and-statistics-chapter-2-descriptive-statistics-part-1-2016-08-09.jpg)


![Subject: PSYCHOLOGY Code No. 04 SYLLABUS 1 ......Statistics in Psychology: Measures of Central Tendency and Dispersion. Normal Probability Curve. Parametric [t-test] and Non-parametric](https://static.fdocuments.net/doc/165x107/5e901d1ff2c54a70b970b56b/subject-psychology-code-no-04-syllabus-1-statistics-in-psychology-measures.jpg)


