Innovation is achieved when product specific process knowledge is discovered using 7Epsilon's...
15
“If only my foundry knew what it knows …”: A 7Epsilon perspective on root cause analysis and corrective action plans for ISO9001:2008 H.Md. Roshan Maynard Steel Casting Company,Milwaukee, WI, USA C. Giannetti (a) , M.R. Ransing (b) , R.S. Ransing (a) (a) [email protected] College of Engineering, Swansea University, Swansea SA2 8PP, UK (b) p-matrix Ltd., Swansea SA2 7PD, UK |||||||||||||||||||||||||||||||||||||||||||||||||||||||||||||||||||||||||||||||||||||||||||||||||||||||||||||||||||||||||||||||||||||||||||||||||||||||||||||||||||||||||||||||||||||||||||||||||||||||||||||||||||||||||||||||||||| Copyright 2014 World Foundry Organization ABSTRACT The famous quotes of a former Chairman, president and CEO of Texas Instruments and Chairman of HP “if only we knew what we know” are very much applicable to the foundry industry. Despite the fact that many advances have been made in the field of foundry technologies relating to simulation software, moulding machines, binder formulation and alloy development, poor quality still remains a major issue that affects many foundries not only in terms of lost revenues but also contributing to negative environmental impacts. On an annual casting production of 95 million tonnes, assuming that on average 5% defective castings are produced with a production cost of 1.2€ per kg for ferrous alloys, the foundry industry is losing 5.7 billion €, producing landfill waste well in excess of two million tonnes and releasing just under two million tonnes of CO 2 emissions. Foundries have vast proportion of knowledge that is waiting to be tapped, documented, shared and reused in order to realise the saving potential of 5.7 billion € per year. This ambitious goal can only be achieved by developing effective knowledge management strategies to create, retain and re- use foundry and product specific process knowledge whilst supporting a smart and sustainable growth strategy. This is the focus of 7Epsilon (7ε), an innovative methodology led by Swansea University along with a consortium of European universities and research organisations. At the core of 7ε capabilities is casting process optimisation which is defined as a methodology of using existing casting process knowledge to discover new process knowledge by studying patterns in data 1 . According to the 7ε terminology, casting process knowledge is actionable information in the form of a list of measurable factors and their optimal ranges to achieve a desired business goal 1, 2 . In this paper a penalty matrix approach is described for discovering main effects and interactions among process factors and responses by analysing data collected during a stable casting process. Through a practical cases study it is shown how this technique can be used as an effective tool in the root cause analysis of nonconforming products in the implementation of ISO9001:2008 requirements for continual improvement. In addition some practical aspects concerning the development of a knowledge management repository to store and retrieve foundry process knowledge are discussed. A template to document and structure foundry and product specific process knowledge is proposed so that knowledge can be stored and retrieved more efficiently by process engineers and managers with the final aim to improve process operations and reduce defects rates, taking a significant step towards achieving zero defect manufacturing. Keywords: Continual Process Improvement, Zero Defect Manufacturing, Quality, Process Knowledge, Data Analysis, Casting Optimisation, Six Sigma, 8D, 7Epsilon, 7ε, FMEA.
-
Upload
meghana-ransing -
Category
Data & Analytics
-
view
274 -
download
0
Transcript of Innovation is achieved when product specific process knowledge is discovered using 7Epsilon's...

“If only my foundry knew what it knows …”: A 7Epsilon perspective on root cause analysis and corrective action plans for ISO9001:2008
H.Md. Roshan
Maynard Steel Casting Company,Milwaukee, WI, USA
C. Giannetti(a)
, M.R. Ransing(b)
, R.S. Ransing(a)
(a) [email protected] College of Engineering, Swansea University, Swansea SA2 8PP, UK
(b) p-matrix Ltd., Swansea SA2 7PD, UK
||||||||||||||||||||||||||||||||||||||||||||||||||||||||||||||||||||||||||||||||||||||||||||||||||||||||||||||||||||||||||||||||||||||||||||||||||||||||||||||||||||||||||||||||||||||||||||||||||||||||||||||||||||||||||||||||||||
Copyright 2014 World Foundry Organization
ABSTRACT
The famous quotes of a former Chairman, president and
CEO of Texas Instruments and Chairman of HP “if only
we knew what we know” are very much applicable to the
foundry industry. Despite the fact that many advances
have been made in the field of foundry technologies
relating to simulation software, moulding machines,
binder formulation and alloy development, poor quality
still remains a major issue that affects many foundries not
only in terms of lost revenues but also contributing to
negative environmental impacts. On an annual casting
production of 95 million tonnes, assuming that on average
5% defective castings are produced with a production cost
of 1.2€ per kg for ferrous alloys, the foundry industry is
losing 5.7 billion €, producing landfill waste well in
excess of two million tonnes and releasing just under two
million tonnes of CO2 emissions. Foundries have vast
proportion of knowledge that is waiting to be tapped,
documented, shared and reused in order to realise the
saving potential of 5.7 billion € per year. This ambitious
goal can only be achieved by developing effective
knowledge management strategies to create, retain and re-
use foundry and product specific process knowledge
whilst supporting a smart and sustainable growth strategy.
This is the focus of 7Epsilon (7ε), an innovative
methodology led by Swansea University along with a
consortium of European universities and research
organisations. At the core of 7ε capabilities is casting
process optimisation which is defined as a methodology
of using existing casting process knowledge to discover
new process knowledge by studying patterns in data 1.
According to the 7ε terminology, casting process
knowledge is actionable information in the form of a list
of measurable factors and their optimal ranges to achieve
a desired business goal 1, 2
. In this paper a penalty matrix
approach is described for discovering main effects and
interactions among process factors and responses by
analysing data collected during a stable casting process.
Through a practical cases study it is shown how this
technique can be used as an effective tool in the root
cause analysis of nonconforming products in the
implementation of ISO9001:2008 requirements for
continual improvement. In addition some practical aspects
concerning the development of a knowledge management
repository to store and retrieve foundry process
knowledge are discussed. A template to document and
structure foundry and product specific process knowledge
is proposed so that knowledge can be stored and retrieved
more efficiently by process engineers and managers with
the final aim to improve process operations and reduce
defects rates, taking a significant step towards achieving
zero defect manufacturing.
Keywords: Continual Process Improvement, Zero Defect
Manufacturing, Quality, Process Knowledge, Data
Analysis, Casting Optimisation, Six Sigma, 8D, 7Epsilon,
7ε, FMEA.

INTRODUCTION
Metal casting process is a complex manufacturing process
with several sub-processes such as patternmaking,
molding, coremaking, melting and pouring, heat
treatment, welding and finishing. It is also energy
intensive process. On average foundries lose a minimum
of 5% of their revenue in scrap (rejected castings) and
rework. On an annual casting production of 95 million
tonnes, with a production cost of 1.2€ per kg for ferrous
alloys, the foundry industry is losing 5.7 billion €1. This
indicates that there is a scope for improvement in metal
casting process and its sub-processes. ISO 9000 quality
management standards have gone evolution ever since
their inception in 1987 and presently have ISO
9001:2008. This quality management system standard
focuses on ‘Process Approach’ and ‘Continual
Improvement’ and these are highly relevant to the
foundries to be profitable.
In the foundry context, process knowledge is described as
actionable information, in terms of the optimal tolerance
limits and target values for continuous factors and optimal
levels for discrete factors, in order to achieve desired
process response(s)1. Reducing rejection rates from 5%
to 2-3% and then further to 0% requires understanding of
product specific process knowledge that also happens to
be foundry specific. The metal casting process is
considered as a complex process not only because it has
several sub-processes but, for most sub-processes, it is
difficult to assign variability in process responses to the
tolerance limits or levels of one or more measurable
factors. Each foundry has its own product specific local
optimum for various measurable factors and it is normally
not possible to reproduce the same process variability in
two foundries – even if the foundries are owned by the
same management. This makes foundry managers wonder
whether manufacturing zero defect castings is an ‘art’ or
‘science’. If it was just ‘art’ then experienced foundry
operators would have developed the skill of
manufacturing zero defect castings without the need of
continuous professional development, access to technical
peer reviewed literature and any formal qualifications. If
it was just ‘science’ then foundry engineers would have
solved the zero defect rejection problem by answering
‘exam style questions’ correctly. One of the challenges
that the foundry industry is facing is the capture, storage
and reuse of both skills; the ‘art’ and the ‘science’, in
order to continually improve the process. The next
generation of foundry engineers are growing up in the
Google and Wikipedia age who rely on internet for
instantaneous access to structured knowledge and may not
have the privilege of receiving formal foundry training
during their undergraduate degree training. Most of the
foundry departments across many prestigious Universities
have lost their identities over the last 15-20 years. In order
to remain sustainable and avoid the risk of rediscovering
the wheel, the foundry trade associations, suppliers and
foundry experts also need to embrace a cultural change in
the way knowledge is disseminated.
Foundries have vast proportion of knowledge that is
waiting to be tapped, documented, shared and reused in
order to realize the saving potential of 5.7 billion € per
year. This indicates that foundries do not have the
technology and/or the culture to produce castings without
incurring these costs that could affect their profitability.
We have a serious problem of ‘Technology Gap’ in our
foundry industry. The gap in technology lies in the lack of
process knowledge in foundries and lack of adequate
personnel trained in process control.
Process knowledge can be obtained by developing a
sound understanding of the relationship between process
factors and responses for a specific casting. Process
engineers can learn product specific process characteristic
by re-using past experiences and analysing patterns in
data. In order to discover improvement opportunities
engineers need to be able to analyse sometimes weak
patterns in noisy data. At the same time, it is critical that
past knowledge is made available at the right time to
verify hypothesis and support decision making. In modern
foundries, knowledge is stored in the form of electronic
documents or databases but it is often underutilised due to
the fact that knowledge is scattered in heterogeneous
systems and difficult to be retrieved. Usually there is not a
single entry point to access process knowledge so a lot of
effort is spent in knowledge retrieval.
The 7Epsilon (7ε) (www.7epsilon.org) approach is
designed to address this gap. The 7ε term was coined by
Dr. Patricia Caballero at Tecnalia in Spain and the 7 steps
of 7ε to ERADICATE defects were introduced by Dr.
Rajesh Ransing at Swansea University, UK who is also
leading the initiative along with a consortium of European
research institutions and trade associations. The approach
is similar to Six Sigma initiatives in that it has the usual
‘Define, Measure, Analyse, Improve and Control’ steps.
However, it focuses on foundry and product specific
continual process improvement and knowledge discovery
by analyzing in-process data and recommends a
knowledge repository concept to reuse the knowledge in
order to stimulate a culture of innovation. In other words,
it also helps foundry CEO’s and chairpersons to share the
famous quotes of a former Chairman, president and CEO
of Texas Instruments and Chairman of HP “if only we
knew what we know …”.

Between July 2013 and October 2013, Drs Rajesh and
Meghana Ransing, have personally trained over 150
foundry engineers from UK, Spain, Poland, Sweden and
India on the 7ε approach. An on-demand internet based
course, given by Dr Roshan, is also available from the
American Foundrymen Society. Almost all engineers
have said that they would recommend the course to their
colleagues. The feedback comments are available on the
7ε website (www.7epsilon.org). A need was identified for
a prescriptive template that any process engineer can use
for the root cause analysis and developing a corrective
action plan for ISO9001:2008. It was decided to formalize
the 7ε template for continuous process improvement
studies and present it in this paper as a ‘use case’.
PROCESS APPROACH
Any activity, or set of activities, that uses resources to
transform inputs to outputs are considered as a ‘Process’
according to ISO 9001:2008. In order to be profitable,
organizations need to initially identify all the relevant
processes and their interrelationships. The output of one
process will be input into the next process. The systematic
identification and management of the processes employed
within a foundry and the interactions between such
processes is considered as the “PROCESS APPROACH”.
An example of process in foundries is shown in Fig. 1.
The sub-processes that are potential candidates for
continuous process improvements studies in individual
foundries will be specific to the foundries and need not be
the same in all foundries. The first step to become
profitable is to identify the sub-processes specific to the
foundry.
PROCESS EFFECTIVENESS ISO 9001:2008 emphasizes the importance of process
effectiveness. Performance metrics for each of the sub-
processes need to be identified and monitored. There
needs to be an evidence of continual improvement in the
performance metrics of the processes in the foundry. This
indicates that ISO 9001:2008 is not only a Quality
Management System, but also a Business Management
System to improve the bottom line of foundries. Process
effectiveness is related to process optimization. Process
optimization is the identification and control of input
process parameters (Factors) to achieve the desired output
(Response) in any process.
Optimizing foundry processes is not a trivial task because
both the factor response relationships and the optimal
conditions are process and part specific.
Even for the same foundry a set of parameters can
produce acceptable casting for one part but not for
another2. Available literature can often help process
engineers in achieving process improvement objectives,
but in most cases trends leant from the literature are too
generic to drive process optimisation. Improvement can
usually be achieved by performing small adjustments to
the process, ultimately leading to significant savings in
terms of cost reduction and waste minimisation.
Fig. 1 – The systematic identification of processes in the foundry industry is shown in a Product Realization diagram.
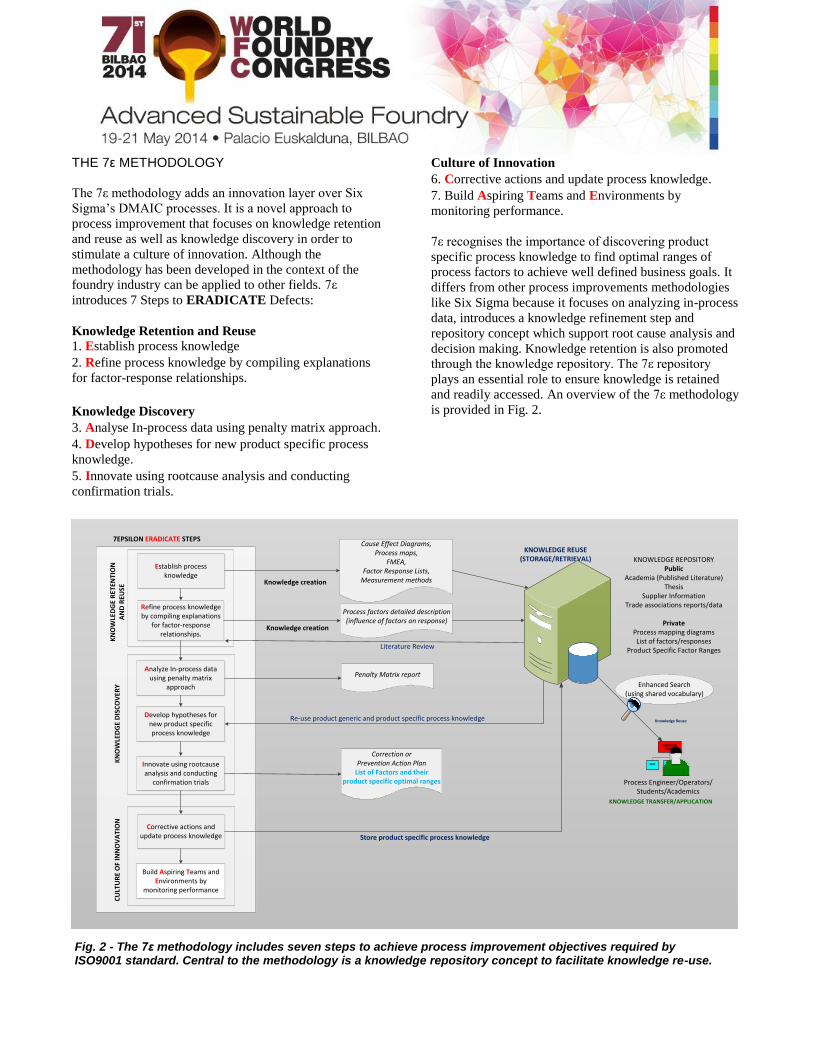
THE 7ε METHODOLOGY
The 7ε methodology adds an innovation layer over Six
Sigma’s DMAIC processes. It is a novel approach to
process improvement that focuses on knowledge retention
and reuse as well as knowledge discovery in order to
stimulate a culture of innovation. Although the
methodology has been developed in the context of the
foundry industry can be applied to other fields. 7ε
introduces 7 Steps to ERADICATE Defects:
Knowledge Retention and Reuse 1. Establish process knowledge
2. Refine process knowledge by compiling explanations
for factor-response relationships.
Knowledge Discovery
3. Analyse In-process data using penalty matrix approach.
4. Develop hypotheses for new product specific process
knowledge.
5. Innovate using rootcause analysis and conducting
confirmation trials.
Culture of Innovation
6. Corrective actions and update process knowledge.
7. Build Aspiring Teams and Environments by
monitoring performance.
7ε recognises the importance of discovering product
specific process knowledge to find optimal ranges of
process factors to achieve well defined business goals. It
differs from other process improvements methodologies
like Six Sigma because it focuses on analyzing in-process
data, introduces a knowledge refinement step and
repository concept which support root cause analysis and
decision making. Knowledge retention is also promoted
through the knowledge repository. The 7ε repository
plays an essential role to ensure knowledge is retained
and readily accessed. An overview of the 7ε methodology
is provided in Fig. 2.
Fig. 2 - The 7ε methodology includes seven steps to achieve process improvement objectives required by ISO9001 standard. Central to the methodology is a knowledge repository concept to facilitate knowledge re-use.
Refine process knowledge by compiling explanations
for factor-response relationships.
Process factors detailed description (influence of factors on response)
Analyze In-process data using penalty matrix
approach
Penalty Matrix report
Develop hypotheses for new product specific process knowledge
Innovate using rootcause analysis and conducting
confirmation trials
Corrective actions and update process knowledge
Correction or Prevention Action Plan
List of Factors and their product specific optimal ranges
KNOWLEDGE REPOSITORYPublic
Academia (Published Literature)Thesis
Supplier InformationTrade associations reports/data
PrivateProcess mapping diagramsList of factors/responses
Product Specific Factor Ranges
KNOWLEDGE REUSE (STORAGE/RETRIEVAL)
Process Engineer/Operators/Students/Academics
KNOWLEDGE TRANSFER/APPLICATION
Enhanced Search (using shared vocabulary)
Knowledge Reuse
Establish process knowledge
Cause Effect Diagrams,Process maps,
FMEA,Factor Response Lists,
Measurement methods
Build Aspiring Teams and Environments by
monitoring performance
Store product specific process knowledge
Literature Review
7ΕPSILON ERADICATE STEPS
CU
LTU
RE
OF
INN
OV
ATI
ON
KN
OW
LED
GE
DIS
CO
VER
YK
NO
WLE
DG
E R
ETEN
TIO
N
AN
D R
EUSE
Knowledge creation
Knowledge creation
Re-use product generic and product specific process knowledge

CASE STUDY
Professional organizations related to foundries all over the
world can contribute by communicating the importance of
continual improvement of foundry sub-processes and
promote the dissemination of information relating to these
processes. This would in turn assist foundries to be more
profitable than they are today and hopefully the foundries
will contribute to the less utilization of energy than what
it is today. The following paragraphs will illustrate a case
study on how to achieve continual improvement in one of
the sub-processes namely melting in a low alloy steel
foundry. For continual improvement, one needs to
identify one product at a time and improve the process
specific to the product. A process is considered to be
‘EFFECTIVE’ if there is no scrap or rework attributable
to the sub-process.
It is necessary to have the skills of identifying all the
responses and factors for the process, collect and analyze
the data and take appropriate actions for continual
improvement. The analysis should be able to provide
actionable information, so the necessary actions can be
taken. This will also satisfy the requirement of AS 9100
that requires Process Validation. Process validation is
carried out by determining the process capability of
identified responses and the factors relevant to the
process. In general, the customer specifications will have
the requirements on product such as they need to meet the
dimensional tolerances, freedom from casting defects
both internal and external. It is the responsibility of the
foundries to determine the specifications for process
parameters to achieve the product specifications. In this
case study a step by step procedure to discover
PRODUCT SPECIFIC PROCESS KNOWLEDGE’1, 2
is
provided.
PROBLEM STATEMENT
A low alloy steel foundry has a product specification that
has the requirement of carrying out a fracture test on the
test block and having 0% of fractured surface area with
conchoidal nature. The chemistry of the product is
considered to play a significant role in the incidence of
conchoidal fracture. The product material specification is
described in Table 1. Although the chemistry of the heats
for the products was within the material specification, the
fracture tests were failing in conchoidal fracture3. This is
also referred as rock candy fracture or intergranular
fracture. A simple scatter plot of the percentage of
conchoidal fractured surface out of the unit fractured
surface (1 in x 1 in) for each observation shows variability
of values across the process (Fig. 3).
Table 1 - Product Specifications
Element Concentration
C 0.20-0.25
Mn 0.90-1.0
Si 0.40-0.60
S 0.015 max
P 0.015 max
Ni 1.70-1.90
Cr 0.90-1.2
Mo 0.40-0.50
Cu 0.30 max
Al 0.06 max
Ti 0.025 max
Zr 0.025 max
Ca 0.006 max
The foundry decided to perform root cause analysis
following the 7ε methodology. A step by step description
of the methodology will be described in the next sections.
STEP1 – ESTABLISH PROCESS KNOWLEDGE
The first step of the 7ε methodology is a preliminary
phase where engineers acquire knowledge about the
process, its factors and responses as well as causal
relationships. This phase is similar to the “Define” step of
Six Sigma projects. A team of people is formed and the
team starts to gather process knowledge which is then
externalised and codified using pictorial diagrams such as
Process Maps, SIPOC Diagrams and Cause and Effect
Diagrams. This phase enables to capture team member
knowledge and is considered crucial to the success of
process improvement activities4.
Fig. 3 - The scatter plot of %Conchoidal Fractured Surface shows variation of responses in different batches.

An example of Process Map for Melting and Pouring
process is shown in Fig. 4.
SIPOC (suppliers, inputs, process, outputs, customers)
diagrams are also used to identify all the relevant
elements of process improvement including suppliers,
customers, input and output of the process. An example of
SIPOC diagram is given in Fig. 5.
Finally causal relationships between process inputs and
outputs are also visualised by using Cause and Effect
diagrams as shown in Fig. 6.
STEP 2 – REFINE PROCESS KNOWLEDGE BY COMPILING EXPLANATIONS FOR FACTOR-RESPONSE RELATIONSHIPS
Process knowledge is obtained by knowing that process
responses Y are functions of process factors X. An
understanding of the type of functional relationship and
how the variability of factors affects responses is an
essential prerequisite to develop a sound process
approach. Generic knowledge about input/outputs
relationships can come from experience after observing
the process over the time or by referring to findings from
published literature. However the knowledge acquired by
foundries in not systematically collected and made
available for future references. Foundries often rely on
“process experts” but issues may arise when “experts” are
not available.
STARTSTART
REVIEW UNPOURED MOLD LIST
REVIEW UNPOURED MOLD LIST
CHARGE PREPARATION & CHARGING
CHARGE PREPARATION & CHARGING
ARC FURNACE START MELTING
ARC FURNACE START MELTING
IS TEMPERATURE
MEASURED OK?
IS TEMPERATURE
MEASURED OK?
SEND SAMPLE TO LAB FOR TESTING
SEND SAMPLE TO LAB FOR TESTING
NO
YES
ARC FURNACE REFINING
ARC FURNACE REFINING
IS CHEMISTRY
OK?
IS CHEMISTRY
OK?
YES
NO
SEND SAMPLE TO LAB FOR TESTING
SEND SAMPLE TO LAB FOR TESTING
IS TEMPERATURE
MEASURED OK?
IS TEMPERATURE
MEASURED OK?
YES
IS CHEMISTRY
OK?
IS CHEMISTRY
OK?BLOCK BLOCK
ARC FURNACE START- MELTING
ARC FURNACE START- MELTING
NO
YES
BRING FURNACE TO TAP TEMPERATURE MAKE ALLOY
ADDITIONS
BRING FURNACE TO TAP TEMPERATURE MAKE ALLOY
ADDITIONS
IS TEMPERATURE
MEASURED OK?
IS TEMPERATURE
MEASURED OK?
ARC FURNACE TAPPING & DEOXIDATION
ARC FURNACE TAPPING & DEOXIDATION
YESARGON STIRARGON STIR
NO
IS TEMPERATURE
MEASURED OK?
IS TEMPERATURE
MEASURED OK?
SEND SAMPLE TO LAB FOR TESTING
SEND SAMPLE TO LAB FOR TESTING
YES
IS CHEMISTRY
OK?
IS CHEMISTRY
OK?YES
POUR CASTINGSPOUR CASTINGS
YES
RED LIGHT/REMAKERED LIGHT/REMAKE
NO
NO
RESOURCES
1. Trained Melters, Pourers & Supervisors
2. Melting Furnaces, Ladles, Ladle Preheater
3. Temperature Measuring Equipment
SUPPLIERS
Molding &
Core making
INPUTS
1. Scrap
2. Ferro Alloys
3. Deoxidizers
MELTING &
POURING
OUTPUTS
1. Acceptable heats
2. Off chemistry heats
3. Remake heats
4. Pigged heats
CUSTOMERS
Cleaning Room
DOCUMENTS
1. Metal Grade Specifications
2. Daily un-poured mold list
CONTROLS
Procedures & Work
Instructions
EFFECTIVENESS MEASURES
1. % of Conchoidal Fractures
2. % of Red Lights
3. Number of pigged heats
4. Number of Remakes
5. % of Monthly customer returns
Fig. 5 – The SIPOC Diagram for Melting and Pouring is an high level description of the all the process components. Effectiveness measures are also identified.
Fig. 6 – A Cause and Effect Diagram shows causal relationship between process inputs and outputs. It is often used in root cause analysis.
Fig. 4 – The Process Map for Melting and Pouring is a flowchart that indentifies all the process steps.

The 7ε methodology extends traditional process
improvement approaches since it introduces a “knowledge
refinement” step. During this phase process engineers
systematically research about process factors and
responses to find out:
how factors are related to responses and how
they can be measured;
Importance of factors in relation to responses.
Knowledge acquisition at this stage is supported and
facilitated by means of a knowledge repository which
indexes and stores process knowledge created by
academia or during past process improvement activities.
The outcome of this phase is a written description of
process factors’ characteristics with respect to one or
more responses.
As part of this case study on conchoidal fracture the
following descriptions were created.
X1: Carbon Drop: In the basic melting practice of steel,
charge carbon is so adjusted that during the Oxygen blow
there is a minimum carbon drop of 30 points. During the
Oxygen blow the extra carbon is oxidized and the
resulting CO bubbles essentially remove N and H from
the melt.
X2: Tap temperature: Higher tap temperatures have been
found to result in the retention of harmful gases in the
liquid metal.
X3: Pouring Temperature: Higher pouring temperature
than the optimum also have been found to be undesirable
in the production of sound castings.
X4: Argon Stirring: Argon stirring is found be very useful
in removing the harmful gases N and H through the
bubbling action and also maintain uniformity in
temperature in the ladle.
X5: %C: Higher C than the optimum is found to have
undesirable effect in increasing the propensity of defects
resulting from quenching.
X6:%Mn6: Optimum range of Mn is necessary to
minimize the harmful effects of S in the melt and to
produce sound castings.
X7: %S: S in the melt plays a significant role in the
incidence of brittle fracture in steel castings5, 6
. Although
0.015% is the upper limit in the specification, lower
percentages can cause brittle fractures. It is essential to
determine the optimum range of S to minimize incidence
of brittle fracture such as Conchoidal Fracture
X8: %P: P in the melt plays a significant role in the
incidence of brittle fracture in steel castings5, 6
. Although
0.015% is the upper limit in the specification, lower
percentages can cause brittle fractures. It is essential to
determine the optimum range of P to minimize incidence
of brittle fracture such as Conchoidal Fracture
X9: %Si: Si steel mainly influences the castability and it
has less significant role compared to S, P and Mn.
X10:%Ni: Ni plays a significant role in the properties of
steel castings, specifically in impact properties, enhancing
significantly to higher properties. Generally higher Ni
steel castings are preferred in applications requiring
higher Charpy values at low temperatures of -40F.
However, these higher percentages of Ni in low alloy
steels have disadvantages making the steel as a long-
freezing range alloy with tendency towards micro-
porosity and the resulting poor properties. Also, care
needs to be taken during heat treatment to prevent the
formation of retained austenite.
X11: %Cr: Cr provides hardness and hardenability to steel
castings. However, care needs to be exercised in
controlling the range of this element, as this can adversely
affect the impact properties.
X12: %Mo: Mo is very desirable element in steel
castings, as it increases the hardenability, enables to have
higher tempering temperatures without adversely
affecting the hardness, resulting in desirable impact
properties.
X13: %Cu: Cu is an undesirable element in low alloy
steel castings, and it is desirable to control the range of
this element.
X14: %Al: Al in steel castings comes from the deoxidizer.
In low strength steel castings, Al can be tolerated up to
0.08%, however higher strength steel castings need to
have lower percentages to prevent brittle fractures
resulting from Aluminum Nitride7. A minimum
percentage of Al of about 0.02% is necessary to prevent
the propensity for pinholes in steel castings.
X15:%Ti: Ti in steel castings is added as a deoxidizer to
enable having low percentages of Al thus preventing the
formation of Aluminum Nitride. Titanium is a more
powerful deoxidizer compared to Aluminum and will tie
up Nitrogen more effectively. However percentage of Ti
should be carefully controlled to prevent the formation of
excessive titanium carbonitrides. Titanium8 also acts as a
grain refiner in steel castings.
X16: Mn/S Ratio: Mn/S ratio is helpful to control the
propensity of steels for cracking tendency. Although
individual elements Mn and S need control, this ratio
needs to be high to reduce the tendency for brittle
fracture.
X17: %Zr: Similar to Ti, Zirconium9 will stabilize the
nitrogen and helps to reduce the formation of brittle
fracture due to Aluminum Nitride.
X18: %Ca: the purpose of calcium treatment in steels
after aluminum deoxidation is to modify the composition
of alumina inclusions and form low melting point calcium
aluminates that float at a faster rate and produce cleaner
liquid steel10
.
X19:Ca/Al Ratio: Calcium is added to molten steel to
modify the morphology of inclusions formed due to
aluminum deoxidation. The relative percentages of Ca
and Al are essential to the formation of clean steel and
Ca/Al ratio determines the optimum ratio to provide clean
steel with minimal tendency for brittle fracture.
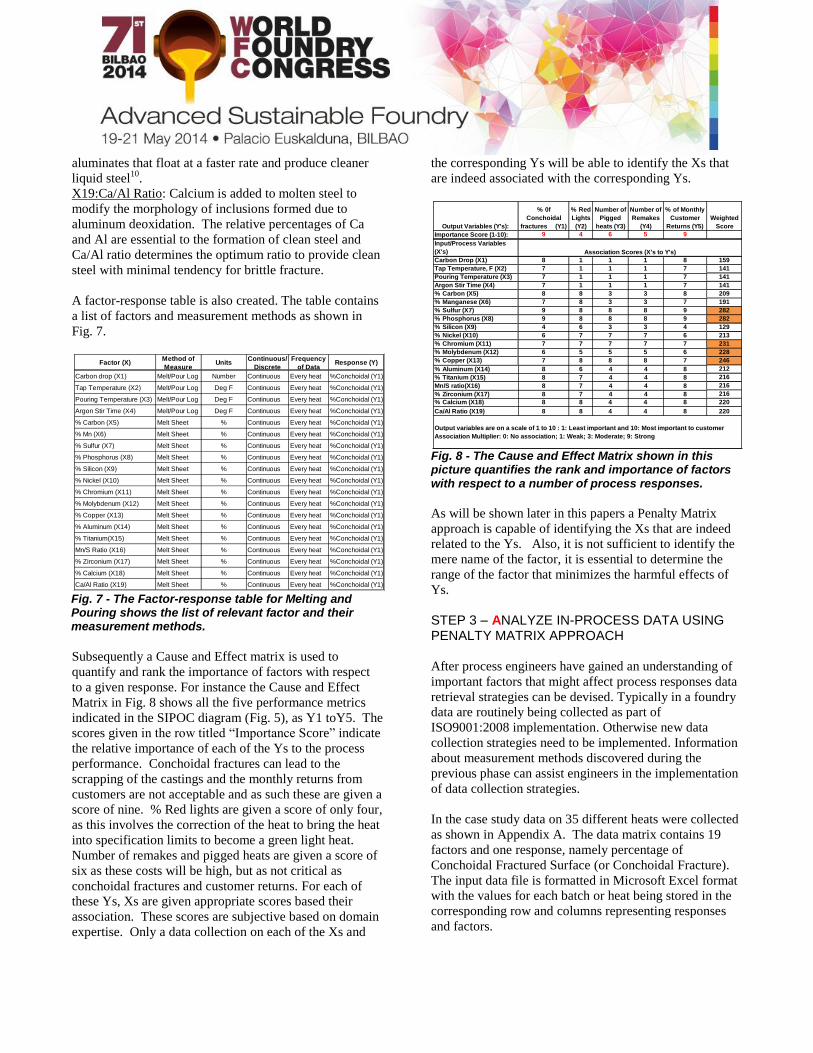
A factor-response table is also created. The table contains
a list of factors and measurement methods as shown in
Fig. 7.
Subsequently a Cause and Effect matrix is used to
quantify and rank the importance of factors with respect
to a given response. For instance the Cause and Effect
Matrix in Fig. 8 shows all the five performance metrics
indicated in the SIPOC diagram (Fig. 5), as Y1 toY5. The
scores given in the row titled “Importance Score” indicate
the relative importance of each of the Ys to the process
performance. Conchoidal fractures can lead to the
scrapping of the castings and the monthly returns from
customers are not acceptable and as such these are given a
score of nine. % Red lights are given a score of only four,
as this involves the correction of the heat to bring the heat
into specification limits to become a green light heat.
Number of remakes and pigged heats are given a score of
six as these costs will be high, but as not critical as
conchoidal fractures and customer returns. For each of
these Ys, Xs are given appropriate scores based their
association. These scores are subjective based on domain
expertise. Only a data collection on each of the Xs and
the corresponding Ys will be able to identify the Xs that
are indeed associated with the corresponding Ys.
Fig. 8 - The Cause and Effect Matrix shown in this picture quantifies the rank and importance of factors with respect to a number of process responses.
As will be shown later in this papers a Penalty Matrix
approach is capable of identifying the Xs that are indeed
related to the Ys. Also, it is not sufficient to identify the
mere name of the factor, it is essential to determine the
range of the factor that minimizes the harmful effects of
Ys.
STEP 3 – ANALYZE IN-PROCESS DATA USING PENALTY MATRIX APPROACH
After process engineers have gained an understanding of
important factors that might affect process responses data
retrieval strategies can be devised. Typically in a foundry
data are routinely being collected as part of
ISO9001:2008 implementation. Otherwise new data
collection strategies need to be implemented. Information
about measurement methods discovered during the
previous phase can assist engineers in the implementation
of data collection strategies.
In the case study data on 35 different heats were collected
as shown in Appendix A. The data matrix contains 19
factors and one response, namely percentage of
Conchoidal Fractured Surface (or Conchoidal Fracture).
The input data file is formatted in Microsoft Excel format
with the values for each batch or heat being stored in the
corresponding row and columns representing responses
and factors.
Factor (X)Method of
MeasureUnits
Continuous/
Discrete
Frequency
of Data Response (Y)
Carbon drop (X1) Melt/Pour Log Number Continuous Every heat %Conchoidal (Y1)
Tap Temperature (X2) Melt/Pour Log Deg F Continuous Every heat %Conchoidal (Y1)
Pouring Temperature (X3) Melt/Pour Log Deg F Continuous Every heat %Conchoidal (Y1)
Argon Stir Time (X4) Melt/Pour Log Deg F Continuous Every heat %Conchoidal (Y1)
% Carbon (X5) Melt Sheet % Continuous Every heat %Conchoidal (Y1)
% Mn (X6) Melt Sheet % Continuous Every heat %Conchoidal (Y1)
% Sulfur (X7) Melt Sheet % Continuous Every heat %Conchoidal (Y1)
% Phosphorus (X8) Melt Sheet % Continuous Every heat %Conchoidal (Y1)
% Silicon (X9) Melt Sheet % Continuous Every heat %Conchoidal (Y1)
% Nickel (X10) Melt Sheet % Continuous Every heat %Conchoidal (Y1)
% Chromium (X11) Melt Sheet % Continuous Every heat %Conchoidal (Y1)
% Molybdenum (X12) Melt Sheet % Continuous Every heat %Conchoidal (Y1)
% Copper (X13) Melt Sheet % Continuous Every heat %Conchoidal (Y1)
% Aluminum (X14) Melt Sheet % Continuous Every heat %Conchoidal (Y1)
% Titanium(X15) Melt Sheet % Continuous Every heat %Conchoidal (Y1)
Mn/S Ratio (X16) Melt Sheet % Continuous Every heat %Conchoidal (Y1)
% Zirconium (X17) Melt Sheet % Continuous Every heat %Conchoidal (Y1)
% Calcium (X18) Melt Sheet % Continuous Every heat %Conchoidal (Y1)
Ca/Al Ratio (X19) Melt Sheet % Continuous Every heat %Conchoidal (Y1)
Output Variables (Y's):
% 0f
Conchoidal
fractures (Y1)
% Red
Lights
(Y2)
Number of
Pigged
heats (Y3)
Number of
Remakes
(Y4)
% of Monthly
Customer
Returns (Y5)
Weighted
Score
Importance Score (1-10): 9 4 6 5 9
Input/Process Variables
(X's)
Carbon Drop (X1) 8 1 1 1 8 159
Tap Temperature, F (X2) 7 1 1 1 7 141
Pouring Temperature (X3) 7 1 1 1 7 141
Argon Stir Time (X4) 7 1 1 1 7 141
% Carbon (X5) 8 8 3 3 8 209
% Manganese (X6) 7 8 3 3 7 191
% Sulfur (X7) 9 8 8 8 9 282
% Phosphorus (X8) 9 8 8 8 9 282
% Silicon (X9) 4 6 3 3 4 129
% Nickel (X10) 6 7 7 7 6 213
% Chromium (X11) 7 7 7 7 7 231
% Molybdenum (X12) 6 5 5 5 6 228
% Copper (X13) 7 8 8 8 7 246
% Aluminum (X14) 8 6 4 4 8 212
% Titanium (X15) 8 7 4 4 8 216
Mn/S ratio(X16) 8 7 4 4 8 216
% Zirconium (X17) 8 7 4 4 8 216
% Calcium (X18) 8 8 4 4 8 220
Ca/Al Ratio (X19) 8 8 4 4 8 220
Association Multiplier: 0: No association; 1: Weak; 3: Moderate; 9: Strong
Association Scores (X's to Y's)
Output variables are on a scale of 1 to 10 : 1: Least important and 10: Most important to customer
Fig. 7 - The Factor-response table for Melting and Pouring shows the list of relevant factor and their measurement methods.

A Penalty Matrix approach is adopted to perform root
cause analysis 1 and discover product specific process
knowledge. The Penalty Matrix algorithm1, 11
discovers
product specific optimal and avoid ranges by visualizing
patterns in data. It uses a simple but novel idea of
associating penalty values to responses and displaying
data using bubble diagram and penalty matrices.
Penalty values are calculated by performing a
transformation of response values that assigns a zero
penalty value to the best performing observations and 100
penalty value to the worst performing observations.
Intermediate values are linearly scaled between zero and
100. Lower and upper thresholds to determine best and
worst performing observations are chosen by the analyst
based on experience and previous domain knowledge. In
addition to domain knowledge some heuristic rules can be
also used to determining upper and lower thresholds such
as:
penalizing the worst 10-15% observations or at
least 5-10 bad points (whichever is higher) while
giving a penalty value 0 to the best 30-40% or
10-20 good points (whichever is higher);
plot the scatter of responses values in ascending
(or descending) order and find by visual
inspection two points where the curvature of the
plot changes.
In this case study the second rule is used (examination of
the curvature of scatter plot), leading to a lower threshold
value for the conchoidal fracture of 0% and upper
threshold value of 10%. Any value between 0% and 10%
is linearly scaled to give a corresponding penalty value
between 0 and 100. The scatter plot of responses with
corresponding threshold values is shown in Fig. 9.
Penalty values can be displayed in bubble diagrams to
help process engineers to identify regions of desired,
undesired and intermediate response values. Fig. 10
shows scatter and bubble diagrams for %Ti.
(a)
(b)
In the bubble diagram (Fig. 10 (b)) the radius of the circle
represents the corresponding Conchoidal Facture penalty
value. The penalty values combined with Importance
Scores described in Fig. 8 can help in estimating cost
saving opportunities. From a visual inspection of the
bubble diagram it can be found that values of %Ti below
the median (0.011) are desirable since they are associated
with low penalty values. A limitation of bubble diagrams
is that, in the presence of overlapping observations, it
might be difficult to find optimal regions. In this case the
same data can be visualised using penalty matrices.
In penalty matrices rows correspond to five penalty bins
(0-20, 20-40, 40-60, 60-80, 80-100) and columns Fig. 9- The scatter plot of responses shows the upper and lower thresholds for penalty values.
Fig. 10 - Scatter (a) and bubble (b) diagrams for %Ti are shown in the picture.

correspond to factor quartile ranges (Q1 to Q4). Using
penalty matrices it possible to find optimal and avoid
ranges based on quartiles. An example of penalty matrix
of Conchoidal Fracture for %Ti is shown in Fig. 11.
Fig. 11 – The Penalty Matrix of Conchoidal Fracture for %Ti helps in identifying regions of desired and undesired response. It can be seen that Bottom 50% of %Ti (Q1 and Q2) is an optimal range since it has a high proportion of low penalty values.
A study of this figure shows that nine data points lie in
Bottom 50% range (quartiles Q1 and Q2) with a penalty
value of 0-20, four data points lie in Bottom 50% with a
penalty value of 20-40 and one data point lies in Bottom
50% with a penalty value of 80-100. Bottom 50% range
of %Ti corresponds to an optimal range since it has a
higher proportion of response values with low penalties.
This method can be further extended to analyze
interactions between any two factors. Fig. 12 shows
respectively the bubble diagram and penalty matrix of
interactions between %Carbon Drop and Ca/Al ratio. In
the example, process conditions when Ca/Al ratio is in the
Bottom 50% range (F1) and Carbon Drop in the Top 50%
range (F2) are considered optimal due to higher number
of good batches (0-20 penalty values) compared to bad
ones.
STEP 4 - DEVELOP HYPOTHESES FOR NEW PRODUCT SPECIFIC PROCESS KNOWLEDGE
The results of the analysis conducted with the Penalty
Matrix approach are used during Quality Improvement
meetings to develop new hypothesis on possible root
causes of defects. This step is crucial for the
implementation of the 7ε methodology. Although it may
be perceived very similar to other process improvement
approaches, 7ε recommends that hypothesis formulation
does not happen only as a result of data driven analysis.
Firstly correlations and patterns found using the Penalty
Matrix approach needs to be prioritised. The calculation
of penalty matrices for main effects (i.e. single factor) and
interactions can become quite cumbersome in the
presence of large number of factors. In the case study, the
P-Matrix software (http://www.p-matrix.com) has been
used to calculate penalty matrices. In addition the
software provides strength values to prioritize
optimal/avoid ranges. Another possible way of ranking
strength is using Principal Component Analysis1.
Following the study five factors have been identified as
those that have a significant effect on the process
response, namely the incidence of Conchoidal Fracture.
These are: %Ti, %S, Mn/S Ratio, %Ca/%Al ratio and
Carbon Drop. Also the following optimal ranges were
found:
%Ti: 0.0009 to 0.011
%S: 0.007 to 0.009
Mn/S Ratio: 104 to 134
%Ca/%Al ratiox1000: 6.67 to 57.5
Carbon Drop: 47 to 84
Q1 Q2 Q3 Q4
Minimum Median Maximum
0.0009 0.0075 0.011 0.0135 0.016
Q1 & Q2: Optimal; Range: Bottom 50%, [>=0.0009 & <=0.011];
Q1: Optimal; Range: Bottom 25%, {>=0.0009 & <=0.0075};
Q3 & Q4: Avoid; Range: Top 50%, [>0.011 & <=0.016];
Penalty Q1 Q2 Q3 Q4
80-100 1 4 5
60-80
40-60 4 2 3
20-40 2 2 1
0-20 6 3 2
Fig. 12 - Bubble diagram and penalty matrix can be used to find out optimal and avoid ranges due to interactions of two factors. Bottom50% of Ca/Al ratio (F1) and Top 50% of Carbon Drop (F2) is considered optimal.
F1: %Ca/%Al ratiox1000, Range:Bottom 50%,[>=6.667 & <=57.5]; Strength: 1.5
F2: Carbon Drop, Range:Top 50%,[>47 & <=84]; Strength: 1.9
Strength of Optimal Interaction: 2.9
Penalty F1:F2 F1:¬F2 ¬F1:F2 ¬F1:¬F2
80-100 0 4 3 3
60-80 0 0 0 0
40-60 3 1 2 3
20-40 0 2 1 2
0-20 6 2 2 1

In addition, one avoid range was found:
%Ti: 0.011 to 0.016
The optimal and avoid ranges are compared with trends
found during the “knowledge refinement” phase (step 2)
accessed via the knowledge repository. Causation is then
inferred if the results of the analysis are supported by the
knowledge base, otherwise it is suggested that
correlations should be dropped. For example, the ranges
for Carbon Drop, %P and %Ca/%Al ratio x1000 for the
in-process data used in this case study are such that the
individual correlations of each factor with Conchoidal
Fracture are very weak however, the interactions of
Carbon Drop and %P as well as Carbon Drop and
%Ca/%Al ratio x1000 (Fig. 12) are relatively strong. The
current literature, as well as the domain knowledge, does
not support any relationship between Carbon Drop and
%P that can jointly influence the occurrence of
Conchoidal Fracture. As a result, this relationship is
ignored. However, this is not true for the Carbon Drop
and %Ca/%Al ratio relationship. A minimum Carbon
Drop of 30 points (preferably 50 points) is necessary to
remove Nitrogen and Hydrogen from the melt.
Conchoidal Fracture occurs due to the formation of
Aluminium Nitride. Hence, it was decided to maintain
higher Carbon Drop as suggested by the penalty matrix
analysis.
STEP 5 - INNOVATE USING ROOT CAUSE ANALYSIS AND CONDUCTING CONFIRMATION TRIALS
Innovation is generated when new root causes that are
supported by trends in the literature are found. Based on
the results of previous phase, foundries are expected to
determine the optimum ranges for all the process
variables (Xs) and carry out confirmation trials to validate
the hypothesis. In this case study only one Y, namely %
Conchoidal fracture response or defect has been selected
as a representative case study. Foundries are expected to
identify all the potential defects related to the parts they
manufacture and determine the product specific process
parameters that give sound castings.
STEP 6 – CORRECTIVE ACTIONS AND UPDATE PROCESS KNOWLEDGE
Upon successful completion of Confirmation Trials, the
new knowledge obtained in the previous steps can be then
be stored in tabular form and consists of a list of values
with their new specifications. It must be noted that the
new specification ranges are specific for a given part and
process. The product specific process knowledge
discovered as part of this case study is summarized in Table 2.
The new knowledge acquired contributes to devise
preventive and corrective action plans to achieve
reduction of Conchoidal Fracture defects as required by
ISO9001:2008 standard. Following a successful trial plan
FMEA (Failure Mode Effect Analysis) tables are also
updated to include the new specification ranges in the
recommended action field. The updated FMEA table is
shown in Fig. 13.
In addition operators need to be trained on the new
process specifications. The 7ε methodology also requires
updating the knowledge base so that the new specification
ranges can be stored and indexed for future use in the 7ε
repository.
STEP 7 – BUILD ASPIRING TEAMS AND ENVIRONMENTS BY MONITORING PERFORMANCE Once the new process specifications have been
implemented, foundries must continually monitor the
responses of defects so that continually improvement on
the processes can be made to meet the requirements of
ISO 9001:2008.
Table 2 - Product specific process knowledge
Sub-Process
Process Variable
(CTQ)
Specification Range
Frequency of data
collection
Melting and Pouring
Carbon Drop (X1)
47-84 Every Heat
Melting and Pouring
% Sulfur (X7)
0.007-0.009 Every Heat
Melting and Pouring
%Titanium (X15)
0.0009-0.011 Every Heat
Melting and Pouring
Mn/S Ratio (X16)
104-134 Every Heat
Melting and Pouring
%Ca/%Al Ratiox1000
(X19) 6.67-57.5 Every Heat

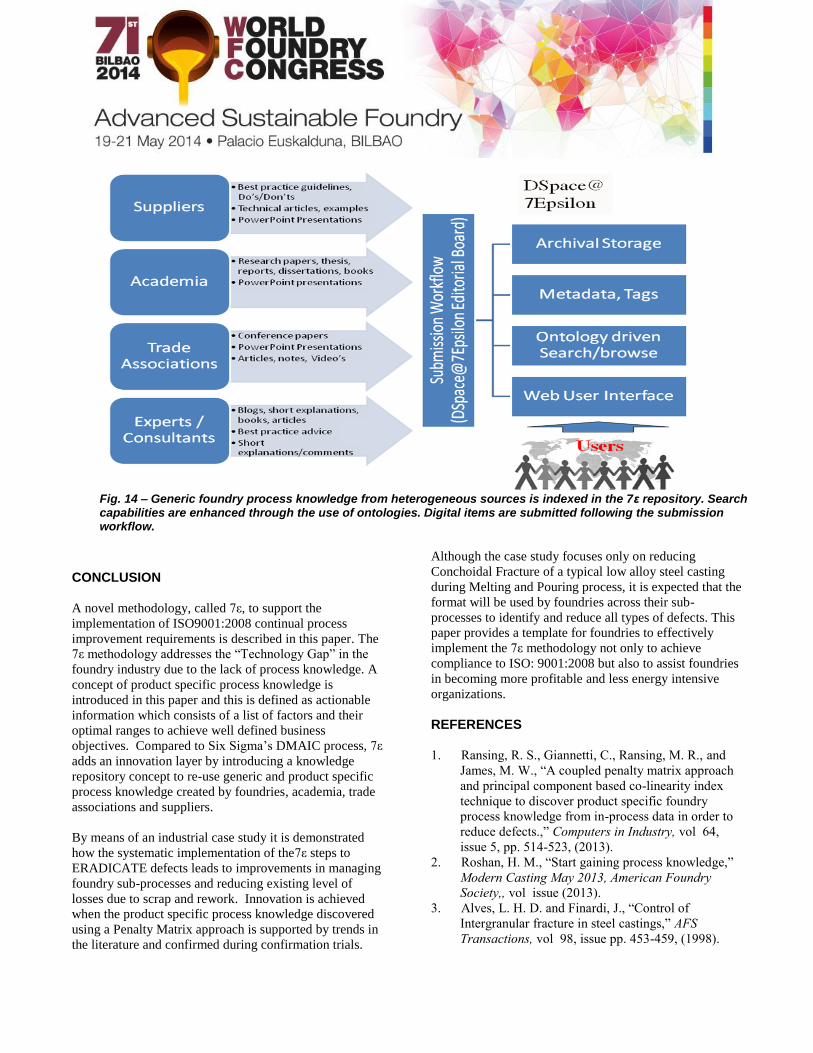
KNOWLEDGE REPOSITORY
The 7ε methodology introduces the concept of a
knowledge repository to store and index foundry process
knowledge. Typically during process improvement
activities process engineers need to access proprietary
foundry knowledge as well as knowledge from a variety
of sources, including trade associations, academia or
suppliers. This knowledge is usually scattered throughout
the organisation or over the World Wide Web and
knowledge retrieval can become a cumbersome task due
to the lack of efficient retrieval methods.
The 7ε repository provides a single entry point to access
and re-use foundry knowledge. It also links product
specific process knowledge discovered with data driven
methodologies to generic foundry knowledge acquired by
academia and trade associations. In order to demonstrate
the knowledge repository concept a prototype system has
been build. Although a detailed description of the
technologies used for building the knowledge repository
prototype system is outside the scope of this paper, a brief
overview is given below.
The 7ε repository has been developed by using DSpace, a
web based open source software package to store and
manage a wide range of digital content, including word
processing files, pictures, videos and data files.
DSpace is widely used by academia and it can perform
searches using metadata or full text search. Metadata are
description of items which are stored by the system and
help to retrieve digital artefacts more efficiently. Secure
access to the repository is provided using login
credentials. Submission of papers or other documents to
the repository is performed following a submission
workflow which involves approval given by the 7ε
Editorial Board before the digital item is made available
to registered users. In addition to indexing of generic
knowledge, the repository can be customised to securely
store foundry specific knowledge which will then only be
accessed within each foundry environment.
New knowledge discovered through 7ε case studies can
also be stored and made available for future projects.
In order to improve search precision DSpace standard
search capabilities have been enhanced by using the
Controlled Vocabulary software adds-on that allows
specifying metadata from a fixed taxonomy 12
. In
information technologies, taxonomies are hierachical
calssifications of terms to describe concepts in a specific
domain. They are typically used to enable efficent
retrieval and sharing of knowledge. As part of the 7ε
repository a Foundry Taxonomy is being developed to
enhance the retrieval of foundry knowledge. An overview
of DSpace capabilities in provided in Fig. 14.
Fig. 13- Failure Mode Effect Analysis (FMEA) is updated after the discovery of product specific process knowledge.
Process
Requirements
Potential Failure
Mode
Potential Effect(s)
of Failure S
E
V
C
l
a
s
s
Potential Cause(s)
Mechanism(s) of Failure
O
c
c
u
r
Current Process
Controls R
P
N
Recommended
Action(s)
Melting -
Chemistry
Incorrect Carbon
Drop points during
Oxygen Blow (X1)
% Conchoidal
fracture(Y1) 6 FF
Melter Error - Improper
Training of Melters in the
Oxygen blow
6
Periodic Auditing
by Supervisor 8 288Optimal range
47-84
Melting -
Chemistry
Incorrect
percentage of S
(X7)
% Conchoidal
fracture(Y1)
8 FF
Melter Error - Inadequate
Training of Melter in
Basic Slag practice 8
Periodic Auditing
by Supervisor8 512
Optimal range
0.007-0.009
Melting -
Chemistry
Incorrect
percentage of Ti
(X15)
% Conchoidal
fracture(Y1) 7 FF
Melter Error - Inadequate
Training of Melter in
Deoxidation Practice8
Periodic Auditing
by Supervisor 8 448Optimal range
0.0009 to 0.011
Melting -
Chemistry
Incorrect Ratio of
Mn/S (X16)
% Conchoidal
fracture(Y1) 7 FF
Melter Error - Inadequate
Training of Melter in
melting practice7
Periodic Auditing
by Supervisor 6 294Optimal range
104-134
Melting -
Chemistry
Incorrect Ratio of
Ca/Al (X19)
% Conchoidal
fracture(Y1)7 FF
Melter Error - Inadequate
Training of Melter in
Deoxidation Practice 8
Periodic Auditing
by Supervisor8 448
Optimal range
6.67-57.5
D
e
t
e
c
t
CONCLUSION
A novel methodology, called 7ε, to support the
implementation of ISO9001:2008 continual process
improvement requirements is described in this paper. The
7ε methodology addresses the “Technology Gap” in the
foundry industry due to the lack of process knowledge. A
concept of product specific process knowledge is
introduced in this paper and this is defined as actionable
information which consists of a list of factors and their
optimal ranges to achieve well defined business
objectives. Compared to Six Sigma’s DMAIC process, 7ε
adds an innovation layer by introducing a knowledge
repository concept to re-use generic and product specific
process knowledge created by foundries, academia, trade
associations and suppliers.
By means of an industrial case study it is demonstrated
how the systematic implementation of the7ε steps to
ERADICATE defects leads to improvements in managing
foundry sub-processes and reducing existing level of
losses due to scrap and rework. Innovation is achieved
when the product specific process knowledge discovered
using a Penalty Matrix approach is supported by trends in
the literature and confirmed during confirmation trials.
Although the case study focuses only on reducing
Conchoidal Fracture of a typical low alloy steel casting
during Melting and Pouring process, it is expected that the
format will be used by foundries across their sub-
processes to identify and reduce all types of defects. This
paper provides a template for foundries to effectively
implement the 7ε methodology not only to achieve
compliance to ISO: 9001:2008 but also to assist foundries
in becoming more profitable and less energy intensive
organizations.
REFERENCES
1. Ransing, R. S., Giannetti, C., Ransing, M. R., and
James, M. W., “A coupled penalty matrix approach
and principal component based co-linearity index
technique to discover product specific foundry
process knowledge from in-process data in order to
reduce defects.,” Computers in Industry, vol 64,
issue 5, pp. 514-523, (2013).
2. Roshan, H. M., “Start gaining process knowledge,”
Modern Casting May 2013, American Foundry
Society,, vol issue (2013).
3. Alves, L. H. D. and Finardi, J., “Control of
Intergranular fracture in steel castings,” AFS
Transactions, vol 98, issue pp. 453-459, (1998).
Fig. 14 – Generic foundry process knowledge from heterogeneous sources is indexed in the 7ε repository. Search capabilities are enhanced through the use of ontologies. Digital items are submitted following the submission workflow.
4. Anand, G., Ward, P. T., and Tatikonda, M. V.,
“Role of explicit and tacit knowledge in Six Sigma
projects: An empirical examination of differential
project success,” Journal of Operations
Management, vol 28, issue pp. 303-315, (2019).
5. Thomas, E., “Critical factors in the manufacturing
of thick section alloy steel castings,” in Proceedings
of SFSA T&O Conference, 2006.
6. Murphy, K. W., “Understanding under riser
cracking,” in Proceedings of SFSA T&O
Conference, 1998.
7. Monroe , C. A. and Huff, R. K., “Prediction of
Aluminum Nitride embrittlement in heavy section
steel castings,” AFS Transactions, vol 118, issue
10-094, (2010).
8. Tuttle, R. B., “Role of Titanium on the grain
refinement of 1030 steel castings,” AFS
Transactions, vol.119, vol 119, issue 11-030,
(2011).
9. Duncan, R., “Identification and prevention of cracks
in steel castings,” in Proceedings of SFSA T&O
Conference, 1997.
10. Martinez, E. Y., Peaslee, K. D. L., and Lekhak, S.
N., “Calcium wire ladle treatment to improve
cleanliness of centrifugally cast steel,” AFS
Transactions, vol 119, issue 11-037, (2011).
11. Giannetti, C., Ransing, R. S., Ransing, M. R.,
Bould, D. C., Gethin, D. T., and Sienz, J., “ A novel
variable selection approach based on co-linearity
index to discover optimal process settings by
analysing mixed data,” Computes & Industrial
Engineering (under review).
12. Ferreira, M. and Baptista, A., The use of taxonomies
as a way to achieve interoperability and improved
resource discovery in DSpace-based repositories,
2005.

APPENDIX A Data on 35 different heats analyzed during Step3.