INNER NORTH BELFAST - nihe.gov.uk · Renewal areas and to see if there was sufficient overlap to...
80
INNER NORTH BELFAST Neighbourhood Renewal Survey 2014
Transcript of INNER NORTH BELFAST - nihe.gov.uk · Renewal areas and to see if there was sufficient overlap to...

INNER NORTH BELFASTNeighbourhood Renewal Survey
2014

1

C O N T E N T S Page Introduction and methodology ................................................................................. 3 Key findings ............................................................................................................. 5 Commentary 1.0 Socio-economic profile .................................................................................... 9 2.0 Characteristics of the home and area ........................................................... 13 3.0 Inner North Belfast NRA ............................................................................... 16 4.0 Neighbourhood Renewal ............................................................................... 21 5.0 Well-being………………………………………………………………………… 24 6.0 Education in Inner North Belfast NRA ........................................................... 25 7.0 Final Comments …………………………………………………………………. Appendices Appendix 1: Technical information ....................................................................... 29 Appendix 2: Questionnaire ................................................................................... 31 Appendix 3: Tabular analysis ............................................................................... 51 Appendix 4: Map of Inner North Belfast Neighbourhood Renewal Area ............... 79
2

Introduction and methodology Inner North Belfast Neighbourhood Renewal Survey 2014 Introduction and methodology Background to the survey The Northern Ireland Housing Executive (NIHE) is the regional housing authority for Northern Ireland. Part of its remit is to ‘conduct or promote research into any matter relating to any of its functions’1. Research for the NIHE is carried out by the Research Unit and this work assists the NIHE in informing policy and improving services. One of the Research Unit’s key on-going areas of research is its rolling programme of neighbourhood renewal surveys, carried out annually in a number of NIHE estates, regardless of tenure. Residents are invited to participate in the research; their views are a key source of information for local offices and community organisations trying to address the complex web of problems which characterise many of these estates. In June 2003, the government launched “People and Place – A strategy for Neighbourhood Renewal”. The strategy seeks to target those communities throughout Northern Ireland that are experiencing the highest levels of deprivation. It is also about bringing together the work of all government departments, in partnership with local people, to tackle disadvantage and deprivation in all aspects of everyday life. The total population affected by deprivation throughout Northern Ireland is approximately 280,000 (one person in six)2. The Neighbourhood Renewal Area (NRA) strategy falls within the remit of the Department for Social Development (DSD). In light of the NIHE’s broad experience in undertaking research in Neighbourhood Renewal Areas, the DSD Neighbourhood Renewal team and staff from the NIHE’s Research Unit met in November 2006 to discuss the DSD’s objectives with regard to Neighbourhood Renewal areas and to see if there was sufficient overlap to allow the NIHE to undertake NRA surveys on the DSD’s behalf. Following NIHE Board approval for its research programme in March 2007 – which included DSD-requested NRA research – representatives from the Research Unit met formally with the DSD and NISRA (Northern Ireland Statistics and Research Agency) on 8 May 2007 to develop a way forward. The DSD confirmed the following in relation to its 36 NRAs: i) the need to monitor change over time at NI level; that is, closing the gap
between the 36 Neighbourhood Renewal Areas and the NI average; ii) the need to identify local level issues for people living in the 36 Neighbourhood
Renewal Areas; iii) that there was a considerable overlap between the questionnaires used by the
NIHE in its Neighbourhood Renewal Surveys and the issues the DSD wanted to explore;
iv) that the DSD would like a small number of additional questions/amendments which, in the event, were acceptable to NIHE;
v) That the top 10% of deprived neighbourhoods across Northern Ireland have been identified using the New Noble Multiple Deprivation Measure. Following extensive consultation, this resulted in a total of 36 areas being targeted for
1 Housing (NI) Order 1981, Article 6 2 DSD website Urban Regeneration - Neighbourhood Renewal (2001 Census of Population) – Mid-Term Review Feb 2011
3

Introduction and methodology Inner North Belfast Neighbourhood Renewal Survey 2014
action. The areas include 15 in Belfast, six in the North West and 15 in other towns and cities across Northern Ireland.
DSD and NIHE in partnership Given the NIHE’s experience in conducting similar household surveys in deprived areas, the DSD’s Neighbourhood Renewal team formally requested NIHE’s assistance in undertaking surveys in Northern Ireland’s 36 NRAs. In consultation with the DSD and on the basis of its priorities, four NRAs were selected for study in 2013/14:
• South West Belfast (Sandy Row, Lower Donegall Road, The Village, Roden Street)
• Inner North Belfast (Duncairn, Limestone Road, Mountcollyer, New Lodge, Unity/Carrick Hill)
• Inner East Belfast (Short Strand, Lower Newtownards Road, Albertbridge Road, Alberbridege/Beersbridge, The Mount, Woodstock Road, Lower Ravenhill Road)
• Outer West Derry/Londonderry (Ballymagroarty, Hazelbank, Rosemount, Glen)
Conduct of the survey The project management, design, quality assurance, analysis and report writing were the responsibility of the Research Unit. Fieldwork in the Inner North Belfast NRS commenced and was completed in February 2014. A random sample of 400 households from all tenures was selected of which 42 were vacant/derelict/demolished or non-residential leaving 358 within the survey scope. A total of 174 completed interviews were achieved giving a response rate of 49% (Appendix 1). Survey objectives The objectives of Neighbourhood Renewal Surveys are: • to examine the housing history, tenure, aspects of the home and satisfaction
with current dwelling; • to ascertain intention to buy or transfer from the current NIHE/housing
association dwelling; • to investigate perceptions about the image of the area and personal safety; • to gather opinions on the impact of crime and the extent of anti-social
behaviour. • to ascertain respondents’ views on education; • to determine the extent of local participation in and the impact of local
Neighbourhood Renewal Initiatives; • to investigate the socio-economic characteristics of the household. The DSD requested two new objectives to be included into the forthcoming surveys; • mental well-being assessment; • public confidence in the police service.
4

Key Findings Inner North Belfast Neighbourhood Renewal Survey 2014
Key findings Socio-economic profile Almost one-third (30%) of HRPs were in employment (20% worked full-time, 8% worked part-time and 2% were self-employed). More than one-fifth (22%) of respondents were retired and 22% were permanently sick/disabled. Two-fifths of HRPs were in receipt of Housing Benefit (40%), more than one-quarter in receipt of Disability Benefit (29%) and more than one-fifth in receipt of Retirement Pension (21%). The main four household types were lone adult (27%); lone older (17%); lone parent (11%) and two adult (8%). The majority (91%) of HRPs were white (NI level – 99%3). Eight per cent of respondents did not state the ethnicity of the HRP and 1% stated another ethnic origin. The average household size was 1.84 (Northern Ireland average 2.483). Twenty-one per cent of all household members were aged under 16 (a slightly higher proportion to the NI level – 20%4). A further 20% were aged 60 or over (NI level – 19%4). More than one-third (35%) of households surveyed had a gross annual income of less than £10,000 (10% had less than £5,000 and 25% had £5,000-<£10,000). Almost half (46%) of respondents said they or someone in their household had a disability that limited their daily activities (NI level – 37%5). More than two-fifths (44%) of respondents said the religious composition of the household was Protestant and 42% were Catholic.
Characteristics of the home The survey indicated a fairly high level of tenure mix; however, in terms of length of tenure there was a high level of residential stability. Almost three-fifths (59%) of respondents lived in social housing (NIHE and housing associations); 31% were in owner-occupied accommodation and the remaining 10% rented privately. More than three-fifths (70%) of respondents had lived in the Inner North Belfast NRA for more than 15 years (social housing 76% and owner occupiers 80%). More than two-thirds (69%) of respondents lived in a house; the remaining 31% of respondents lived in flats/apartments (28%) or bungalows (3%). Regardless of household heating system, the majority of respondents (98%) had full central heating in their home. The main heating source for homes represented in the survey was mains gas (66%) followed by oiled fired
3 NISRA - Continuous Household Survey 2012/13 4 NISRA – Population and Migration Estimates (2012) 5 NI Survey of Activity Limitation and Disability 2007
5

Key Findings Inner North Belfast Neighbourhood Renewal Survey 2014 heating with radiators (20%). Oil was the predominant home heating source at NI level (68%6). There were high levels of satisfaction among respondents with various aspects of their heating system - the control over the level of heat (76%); the type of heating system (74%), the ease of using the system (73%), and the amount of heat you can get (71%). One-third (33%) of respondents were dissatisfied with the cost of running the heating system due to low household income. Almost one-third (51; 29%) of respondents said they had been unable to adequately heat their home in the last 12 months. Low household income (33; 65%), the cost of domestic fuel (27; 53%) and money needed for other priorities (27; 53%) were factors contributing to respondents’ inability to adequately heat their home. Overall, more than two-thirds (70%) of respondents were satisfied/very satisfied with their home. A very small proportion (3%) of respondents who are currently living in social housing intend to buy their home within the next two years.
Inner North Belfast NRA The survey indicated moderate levels of satisfaction with the area and a perception that the area had not really changed, although there were a number of anti-social behaviour issues to be addressed. Three-fifths (60%) of respondents agreed that they really felt part of the community and 56% felt proud to come from the area More than half (51%) of respondents disagreed that they felt embarrassed to bring people to the area. Almost one-third (28%) of respondents reported the area was changing for the better, 48% believed it was not really changing and 24% thought it was changing for the worse. Almost one-third (32%) of people in Inner North Belfast NRA perceived the level of anti-social behaviour (ASB) in their area to be high. The equivalent figure for Northern Ireland is much lower at 13%7. The main problems of ASB identified by respondents in the area were ‘rubbish or litter’ (49%); ‘vandalism, graffiti and other deliberate damage to property or vehicles’ (39%) and ‘teenagers hanging around the streets’ (39%). The most prevalent perceived ASB problems at Northern Ireland level were ‘rubbish and litter’ (26%) and ‘people using or dealing with drugs’ (23%)8. The majority (85%) of respondents said they felt safe walking alone in the area during the day and 76% felt safe alone in their home at night. More than half (51%) of respondents felt safe walking alone in the area after dark.
6 NI House Condition Survey 2011 7 NICS 2011/12: Perceptions of Crime Research and Statistical Bulletin 2/2013 8 NICS 2011/12: Perceptions of Crime Research and Statistical Bulletin 2/2013
6

Key Findings Inner North Belfast Neighbourhood Renewal Survey 2014 Policing in the Area Almost three-fifths (57%) of respondents strongly or tended to agree that the police would treat you with respect if you contact them for any reason and almost half (49%) of respondents strongly or tended to agree that the police understand the issues that affect the community. Neighbourhood renewal The survey indicated fairly low levels of awareness of neighbourhood renewal and community involvement. Four-fifths (80%) of respondents said they were not aware of physical changes that had improved the neighbourhood within the previous 12 months. Almost half (48%) of respondents thought there were important issues that needed to be addressed in their neighbourhood. The most common issue that respondents said needed to be addressed in their neighbourhood was to ‘deal with ASB’ (27%); ‘clean up the area’ (16%); and ‘leisure centre with facilities for elderly/youth’ (12%). The majority (86%) of all respondents were not aware of the Housing Executive’s neighbourhood warden service. Three-fifths (60%) of respondents said they did not know if their area had a community/residents’ association; 32% said their area did have one and 6% said their area did not. Almost two-thirds (65%) of all respondents said they would not consider joining a local community/residents’ association, compared to 22% who said they did not know if they would join and 11% who said they would join. More than two-thirds (69%) of respondents were not aware that their household lies within the Inner North Belfast Neighbourhood Renewal Area. Well-Being The Warwick-Edinburgh Mental Wellbeing Scale asks people to indicate how often they have felt a certain way on a range of items, such as feeling optimistic, feeling relaxed, thinking clearly, feeling confident and feeling cheerful In Inner North Belfast, the mean score was 47, with mean scores for males (47) and females (48). This is similar to the Northern Ireland population mean score of 50 with the same mean scores for males and females (50).
7

Key Findings Inner North Belfast Neighbourhood Renewal Survey 2014 Education More than four-fifths (87%) of respondents agreed that ‘children at school in Northern Ireland get a good education’ (NI level – 88%9). Almost three-quarters (74%) of respondents agreed that ‘staying at school is important if you want to get a good job’ (NI level - 84%9). More than two-thirds (69%) of respondents agreed that they ‘enjoyed their time at school’ (NI level – 67%9). Almost one-quarter (39: 22%) of parent/legal guardians had one or more children of school age (4-18 years). Of these respondents, equal proportions (36; 92% in each case) agreed their child’s school gives clear information on how their child was getting on and their child’s school was welcoming to parents. Ninety per cent (35) of respondents agreed their child’s school was well led and well managed and the same (35: 90%) agreed their child’s school was a good school. Almost all respondents (39; 97%) with children of school age agreed that making sure their child attends school regularly and on time is important. The majority of respondents with children of school age (36; 92%) said helping their child with schoolwork was important. More than one-third (14; 36%) of respondents said they would consider taking their child out of school during term time (NIOS 2010: 24%). The vast majority (97%) of respondents with children of school age said they felt involved personally in their child’s school life (61% very involved; 36% fairly involved).
9 NISRA – NI Omnibus Survey 2011 – Education module
8

Chapter 1: Socio-economic profile Inner North Belfast Neighbourhood Renewal Survey 2014 Socio-Economic Profile
This chapter details the socio-economic characteristics of households within the Inner North Belfast NRA.
1.1 Age of Household Reference Person/gender
More than one-third (35%) of HRPs were aged between 40 and 59; 21% were between 25 and 39; 20% were aged between 60 and 74; 9% were aged 75 or older and 3% were aged between 16 and 24. Data from the Northern Ireland House Condition Survey (2011) are included in Figure 1.1 below for reference (Appendix Table 1.1).
More than half (52%) of HRPs were male and 40% were female. The remaining 8% of respondents did not provide information on gender. Analysis of gender by age shows that a higher proportion of male HRP were aged 60-74 (74%) than female HRPs (26%) (Appendix Table 1.2).
1.2 Age of all household members
In total, 320 individuals were identified as resident in the 174 households surveyed. Almost one-quarter (23%) of household members were aged 40 and 59, 19% were between 25 and 39; 15% were aged between 60 and 74; 21% were aged 15 and less and 5% were aged 75 or over (Figure 1.2; Appendix Table 1.3).
3%
21%
35%
20%
9% 12%
4%
24%
38%
23%
11%
0% 16-24 25-39 40-59 60-74 75+ No response/
Refused
Figure 1.1: Age of HRP
Inner North Belfast HCS 2011Base: 174 respondents
21%
10%
19% 23%
15%
5% 7%
0-15 16-24 25-39 40-59 60-74 75+ No response/refused
Figure 1.2: Age of all household members
Base: 320 household members
9

Chapter 1: Socio-economic profile Inner North Belfast Neighbourhood Renewal Survey 2014 1.3 Average household size
The survey found that the mean household size in Inner North Belfast NRA was 1.84. The Northern Ireland average was 2.4810.
1.4 Employment status of Household Reference Person
Almost one-third (30%) of HRPs were in employment (20% worked full-time, 8% worked part-time and 2% were self-employed). More than one-fifth (22%) of respondents were retired and 22% were permanently sick/disabled. Eight per cent were not working and 7% looked after family home (Figure 1.3, Appendix Table 1.4).
1.5 Household type
Households were classified into eight types according to the number and ages of household members. Table 1A includes a description of each household type.
Table 1A: Household types and definitions (%)
Inner North Belfast NRA
2014 % Lone Adult (lone person below pensionable age - 65 years for men, 60 years for women) 27
Lone Older (lone person of pensionable age – 65 years for men, 60 years for women) 17
Lone Parent (sole adult living with dependent child(ren) <16) 11
Two Adult (two people – related or unrelated – below pensionable age) 8
Small Family (any two adults - related or unrelated - living with 1 or 2 dependent children < 16) 7
Large Adult (three or more adults - related or unrelated – and no dependent children <16) 7
Two Older (two people – related or unrelated - at least one of whom is of pensionable age) 6
Large Family (any two adults - related or unrelated - living with more than 2 dependent children < 16) 3
Not enough information supplied to classify household type 14 TOTAL 100
10 NISRA Continuous Household Survey 2012/13
30%
22% 22%
8% 7% 1%
10%
Working Retired Permanently sick/disabledNot workingLooking after family/home Student No response/Refused
Figure 1.3: Employment status of HRP
Base: 174 respondents
10

Chapter 1: Socio-economic profile Inner North Belfast Neighbourhood Renewal Survey 2014
Table 1A shows that lone adults (27%) were the predominant household type followed by lone older (17%), lone parent (11%) and two adult (8%) (Appendix Table 1.5).
1.6 Annual household income
This survey defines household income as the total annual income before tax of the Household Reference Person (HRP) and partner (if applicable), including all income from savings, employment, benefits and other sources. More than one-third (35%) of respondents said their annual gross household income was less than £10,000; 18% had between £10,000 and £14,999, 5% had between £15,000 and £19,999, and 11% had £20,000 or more. Almost one-third (31%) of respondents either did not know or refused to give any details of their household income. Full income details are in Figure 1.4 and Appendix Table 1.6; data from the HCS 2011 are included in the graph below for comparison (Note: the HCS 2011 had no missing data).
35%
18%
5% 8%
3%
11%
20%
17%
29%
15% 15%
24%
0% 0% Less than£10,000
£10,000 -£14,999
£15,000-£19,999
£20,000-£29,999
£30,000 or more Refused Don't know/Noreply
Figure 1.4: Household income
Inner North Belfast HCS 2011Base: 174 respondents
11
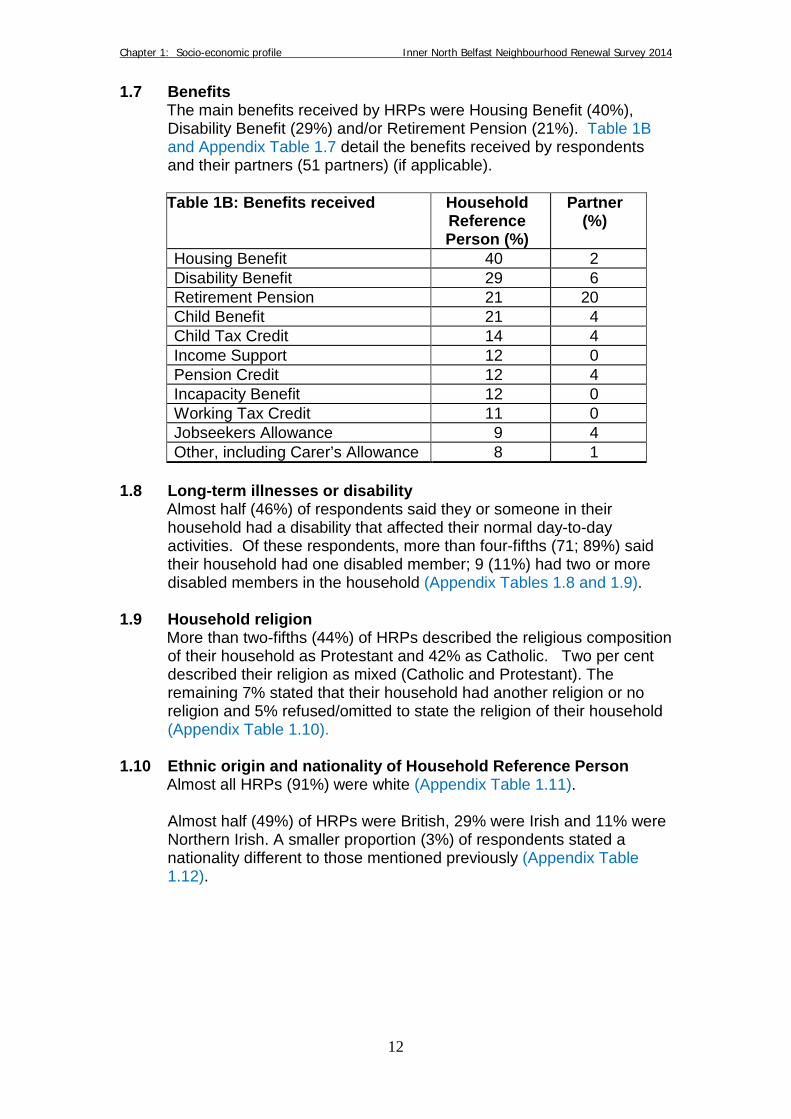
Chapter 1: Socio-economic profile Inner North Belfast Neighbourhood Renewal Survey 2014 1.7 Benefits
The main benefits received by HRPs were Housing Benefit (40%), Disability Benefit (29%) and/or Retirement Pension (21%). Table 1B and Appendix Table 1.7 detail the benefits received by respondents and their partners (51 partners) (if applicable). Table 1B: Benefits received Household
Reference Person (%)
Partner (%)
Housing Benefit 40 2 Disability Benefit 29 6 Retirement Pension 21 20 Child Benefit 21 4 Child Tax Credit 14 4 Income Support 12 0 Pension Credit 12 4 Incapacity Benefit 12 0 Working Tax Credit 11 0 Jobseekers Allowance 9 4 Other, including Carer’s Allowance 8 1
1.8 Long-term illnesses or disability
Almost half (46%) of respondents said they or someone in their household had a disability that affected their normal day-to-day activities. Of these respondents, more than four-fifths (71; 89%) said their household had one disabled member; 9 (11%) had two or more disabled members in the household (Appendix Tables 1.8 and 1.9).
1.9 Household religion
More than two-fifths (44%) of HRPs described the religious composition of their household as Protestant and 42% as Catholic. Two per cent described their religion as mixed (Catholic and Protestant). The remaining 7% stated that their household had another religion or no religion and 5% refused/omitted to state the religion of their household (Appendix Table 1.10).
1.10 Ethnic origin and nationality of Household Reference Person
Almost all HRPs (91%) were white (Appendix Table 1.11). Almost half (49%) of HRPs were British, 29% were Irish and 11% were Northern Irish. A smaller proportion (3%) of respondents stated a nationality different to those mentioned previously (Appendix Table 1.12).
12

Chapter 2: Characteristics of the Home and Area Inner North Belfast Neighbourhood Renewal Survey 2014
Characteristics of the home and area
This chapter presents an analysis of some of the characteristics of homes within the Inner North Belfast NRA, the tenure, length of tenure, satisfaction with aspects of accommodation and intention to buy or transfer to/from NIHE or housing association properties.
2.1 Tenure
Almost three-fifths (59%) of respondents were Housing Executive/housing association tenants. Almost one-third (31%) were owner-occupiers and 10% rented privately. Data at the Northern Ireland level from the Northern Ireland House Condition Survey 2011 are included in Figure 2.1 for comparison (Appendix Table 2.1).
2.2 Length of time living in Inner North Belfast NRA
Almost three-quarters (70%) of respondents had lived in the Inner North Belfast NRA for 15 years or more and the remaining 30% of respondents had lived in the area for less than 15 years (Appendix Table 2.2).
2.3 More than three-fifths (61%) of respondents said they had lived within
the Inner North Belfast NRA before moving to their present home. Thirteen per cent had lived outside the Belfast Council area and 11% had lived outside the Inner North Belfast Neighbourhood Renewal area but within the Belfast Council Area. A further 15% of respondents had never lived anywhere else (Appendix Table 2.3).
2.4 Tenure by length of time living in Inner North Belfast NRA
Analysis of length of tenure by tenure type shows that a higher proportion of people living in owner occupation (80%) than those in social housing (76%) had lived in the area 15 years or more. In the private rented sector there was a much higher level (64%) that had lived in the Inner North Belfast NRA for 1 year or more but less than five. Further detail is in Figure 2.2 and Appendix Table 2.4.
59%
31%
10%
0%
15%
62%
16% 7%
Social housing Owner-occupied Privately rented Other
Figure 2.1: Tenure
Inner North Belfast NIHCS 2011Base: 174 respondents
13

Chapter 2: Characteristics of the Home and Area Inner North Belfast Neighbourhood Renewal Survey 2014
2.5 Dwelling type Almost three-quarters (69%) of respondents lived in houses; 28% in flats/apartments and the remaining 3% lived in bungalows (Appendix Table 2.5).
2.6 Heating system
Almost all households (98%) had full central heating. Equal proportions of respondents (1% in each case) had partial central heating or no central heating. The main heating source in two-thirds (66%) of homes was mains gas. One-fifth (20%) of respondents had oil fired heating with radiators and 11 % had Economy 7 heating (Appendix Tables 2.6 and 2.7).
2.10 Satisfaction with heating system There were high levels of satisfaction among respondents with various aspects of their heating system - the control over the level of heat (76%), the type of heating system (74%), the ease of using the system (73%) and the amount of heat you can get (71%). One-third (33%) of respondents were dissatisfied with the cost of running the heating system (Figure 2.3; Appendix Table 2.8).
7%
17%
7% 8%
33%
7% 7%
11%
6% 9%
0%
80% 76%
39%
Owner-occupied Social housing Privately rented
Base: 174 respondents
Figure 2.2: Length of tenure (by tenure type)
Up to 1 year
>1, up to 5 years
>5, up to 10 years
>10, up to 15 years
>15 years
14

Chapter 2: Characteristics of the Home and Area Inner North Belfast Neighbourhood Renewal Survey 2014
Base: 174 respondents
2.11 Ability to adequately heat the home
Almost one-third (51: 29%) of respondents said they had been unable to adequately heat their home during the previous 12 months. Low household income (33; 65%), the cost of domestic fuel (27; 53%) and also money needed for other priorities (27; 53%) were factors contributing to the difficulties experienced by those respondents who had been unable to heat their homes (Appendix Tables 2.9-2.11).
2.14 Satisfaction with home
Almost three-quarters (70%) of respondents were satisfied/very satisfied with their home; 13% were neither satisfied nor dissatisfied and 17% were dissatisfied/very dissatisfied. The main reason for dissatisfaction was ‘repairs required’ and ‘health reasons, property not suitable’ (Appendix Tables 2.12 and 2.13).
2.15 House sales and transfers
Respondents living in social housing (NIHE or housing association properties – 59%; 102 respondents) were asked about their intentions to purchase or transfer/exchange their dwelling. Only three tenants said they intended to buy their home during the following two years; the majority (94: 92%) did not intend to buy their home and 5% (5) were unsure (Appendix Table 2.14).
Transfer applications Of the 97% of respondents in social housing who did not intend to buy their home, twelve (12%) had applied for a transfer from their present property during the previous two years. Of the respondents who had not applied for a transfer (88%) a small number (7; 8%) intended to apply for a transfer during the following 12 months. Most of those who wished to transfer wanted to stay within the local area (17 respondents) and the main reasons were ‘ASB reasons’ and ‘property not suitable’ (Appendix Tables 2.15-2.18).
76%
74%
73%
71%
51%
14%
10%
13%
8%
16%
10%
16%
14%
21%
33%
Control over level ofheat
Type of heating system
Ease of using thesystem
Amount of heat you canget
Cost of running yoursystem
Figure 2.3: Satisfaction with aspects of the heating system
Very satisfied/satisfied Neither Dissatisfied/very dissatisfied
Base:166 respondents
15

Chapter 3: Inner North Belfast NRA Inner North Belfast Neighbourhood Renewal Survey 2014
Inner North Belfast NRA
This chapter presents an analysis of data from questions aimed specifically at respondents’ perceptions of life in the Inner North Belfast NRA, including opinion of the area, crime and anti-social behaviour and sense of community safety.
3.1 Perceptions about the area
Respondents were asked to state how much they agreed or disagreed with a number of statements related to their perceptions of the area (Figure 3.1; Appendix Table 3.1). • Three-fifths (60%) of respondents agreed that they felt part of the
community living in the area; 19% neither agreed nor disagreed and 17% disagreed.
• Almost three-fifths (56%) agreed that they were proud to come from
the area; 23% neither agreed nor disagreed and 16% disagreed. • More than half (51%) of respondents disagreed that they felt
embarrassed to bring people to the area; 28% agreed and 17% neither agreed nor disagreed.
28
56
60
17
23
19
51
16
17
2
3
3
3
2
1
0% 10% 20% 30% 40% 50% 60% 70% 80% 90% 100%
I'm embarrassed to bringpeople to this area
I'm proud to come fromthis area
I feel part of thecommunity
Figure 3.1 Respondents perception of the area
Strongly agree/agree Neither agree nor disagree
Disagree/strongly disagree Don't know
No response
Base: 174 respondents
16

Chapter 3: Inner North Belfast NRA Inner North Belfast Neighbourhood Renewal Survey 2014
3.2 More than one-quarter (28%) of respondents thought the area overall
was changing for the better; 48% thought the area was not really changing and 24% thought it was changing for the worse (Appendix Table 3.2).
3.3 Reasons given by the 28% (49 respondents) who thought the area was
changing for the better included ‘good area to live in and good housing’ (12; 21%), ‘renovation and new build’ (9; 16%) and ‘less ASB’ (9; 16%). Among the 42% (24 respondents) who said the area was changing for the worse, the most common reason was ‘increase of ASB in area’ (30 respondents) and ‘derelict dwellings’ (9 respondents) (Table 3A; Appendix Table 3.3).
Table 3A: Perceived reasons why the local area is changing
Changing for the better Changing for the worse No. % No. % Good area to live and good housing 12 21 ASB in the area 30 41
Renovation and new build 9 16 Derelict dwellings 9 12
Less ASB 9 16 Drug dealing in area 7 10 People working together to improve the area
8 14 Too many private rentals and immigrants 7 10
Area cleaned up and murals removed 6 10 Dogs fouling and
barking 6 8
More facilities 3 5 Shops closing and decline in population 4 6
No comment 11 18 Others, no parking, rubbish; new Holyland’s 7 10
No comment 2 3 Base: 49 respondents who gave 58 reasons Base: 42 respondents who gave 72 reasons
3.4 Perceptions about anti-social behaviour in Inner North Belfast
NRA Respondents were asked to rate how much of a problem different types of anti-social behaviour (ASB) were in their area within a 15 minute walk of their home. In line with the latest Northern Ireland Crime Survey 2011/12 (NICS), the following seven strands of ASB were used to form a composite measure11 to gauge the overall perceived level of ASB in Inner North Belfast NRA compared to Northern Ireland as a whole (Table 3.4A). 1. abandoned or burnt out cars; 2. noisy neighbours or loud parties;
11 Perceptions of ASB were measured using the NICS scale based on respondents’ answers to the questions related to the seven ASB strands, as follows: ‘very big problem'=3, 'fairly big problem'=2, 'not a very big problem'=1' and 'not a problem at all'=0. The maximum score for the seven questions was 21. Those respondents with 'high' levels of perceived anti-social behaviour scored 11 or more on this scale
17

Chapter 3: Inner North Belfast NRA Inner North Belfast Neighbourhood Renewal Survey 2014
3. people being drunk or rowdy in public places; 4. people using or dealing drugs; 5. teenagers hanging around on the streets; 6. rubbish or litter lying around; and 7. vandalism, graffiti and other deliberate damage to property.
3.5 Based on this composite measure, findings from this survey shows that 32% of respondents in Inner North Belfast NRA perceived the level of ASB in their local area to be high. The equivalent figures for Northern Ireland was much lower (13%12) (Appendix Table 3.4B).
3.6 The two ASB types perceived by the largest proportions of respondents to be a very/fairly big problem in the local area were: • rubbish or litter lying around (49%); and • vandalism, graffiti and other deliberate damage to property or
vehicles (39%). • teenagers hanging around on street (39%) The most prevalent issues perceived as a very/fairly big problem at the Northern Ireland level13were: • rubbish or litter lying around (26%); and • vandalism, graffiti and other deliberate damage (21%)
(Figure 3.2: Appendix Table 3.4A & B).
3.7 Findings from the Inner North Belfast NRA survey show that the lowest
proportions of respondents perceived the following types of ASB to be problematic: ‘abandoned/burnt out cars (17%) and ‘noisy neighbours or loud parties’ (9%).
3.8 Perceptions about the effect of ‘fear of crime’ on quality of life Respondents were asked to rate how much their quality of life was affected by fear of crime, on a scale of 1 to 10 where 1 being of ‘little
12 NICS 2011/12: Perceptions of Crime Research and Statistical Bulletin 2/2013 13 NICS 2011/12 Perceptions of Crime Research and Statistical Bulletin 2/20123
9%
17%
29%
38%
39%
39%
49%
4%
8%
21%
23%
22%
20%
26%
Abandoned/burnt out cars
Noisy neighbours
People drunk or rowdy
Using or dealing drugs
Teenagers on streets
Vandalism or graffiti
Rubbish or litter
Base: 174 respondents
Figure 3.2: Perceptions of very/fairly big problems of ASB
Inner North Belfast NICS 2011/12
18

Chapter 3: Inner North Belfast NRA Inner North Belfast Neighbourhood Renewal Survey 2014
effect’ and 10 ‘a total effect’. In order to standardise the results, the following conventions have been used to gauge the effect of ‘fear of crime’ on quality of life: 1. minimally affected (responded in the range 1 to 3); 2. moderately affected (responded in the range 4 to 7); and 3. greatly affected (responded in the range 8 to 10).
3.9 Half (50%) of the respondents in Inner North Belfast NRA felt that ‘fear of crime’ had a minimal impact on their quality of life (NICS 67%), more than one-third (34%) said it had a moderate effect and 15% considered that it had a great effect (Figure 3.3; Appendix Table 3.5) (NICS: 5% of respondents felt that fear of crime had a great effect on their quality of life).
3.10 Perceptions about personal safety
The majority (85%) of respondents said they felt safe walking alone in the area during the day. More than three-quarters (76%) felt safe in their own home when alone at night and more than half (51%) of respondents felt safe walking alone in the area after dark. Respondents’ reasons for not feeling safe are detailed in the appendix tables (Figure 3.4; Appendix Tables 3.6-3.10).
50%
34%
15%
67%
27%
5%
Minimal effect Moderate effect Great effect
Base: 174 respondents
Figure 3.3: Perceived effect on quality of life caused by fear of crime
Inner North Belfast NICS 2011/12
85% 76%
51%
15% 24%
49%
walking alone in this area during theday?
alone in your home at night? walking alone in this area afterdark?
Base: 174 respondents
Figure 3.4: How safe do you feel ...
Very/fairly safe A bit/very unsafe
19

Chapter 3: Inner North Belfast NRA Inner North Belfast Neighbourhood Renewal Survey 2014
3.11 Policing in the area
Respondents were asked to agree or disagree with six statements regarding public confidence with the police in their area (15 minute walk from their home). Respondents did not need to have had contact with the police to answer these questions. Almost three-fifths (57%) of respondents strongly agreed or tended to agree that the police would treat them with respect if contacted for any reason; almost half (49%) of respondents strongly agreed or tended to agree that they understood the issues that affect their community and 45% stated that taking everything into account, they had confidence in the police in their area. One-fifth (20%) strongly disagreed or tended to disagree that the police could be relied on to deal with minor crimes and the same proportion (20%) strongly disagreed/tended to disagree that the police could be relied on to be there when you need them. Thirty-five per cent strongly agreed/tended to agree that the police are dealing with things that matter to people in the community (Table 3.11: Appendix 3.11).
Table 3.11 Police confidence in the area
Strongly/ tend to agree
Neither agree or disagree
Strongly /Tend to disagree
Don’t Know/No response
TOTAL
No % No % No % No % No % The Police would treat you with respect if you contact them for any reason
99 57 32 18 13 8 30 17 174 100
The Police understand the issues that affect this community
86 49 30 17 24 14 34 20 1774 100
Taking everything into account I have confidence in the police in this area
77 45 38 22 30 17 29 17 174 100
The Police treat everyone fairly regardless of who they are
76 44 37 21 28 16 33 19 174 100
The Police could be relied on to deal with minor crimes
69 39 40 23 34 20 31 18 174 100
The Police can be relied on to be there when we need them
66 38 36 21 35 20 37 21 174 100
The Police are dealing with things that matter to people in the community
61 35 44 25 33 19 36 21 174 100
Base: 174 respondents
20

Chapter 4: Neighbourhood Renewal Inner North Belfast Neighbourhood Renewal Survey 2014
Neighbourhood Renewal
This chapter analyses respondents’ awareness of physical improvements to the area and recent neighbourhood renewal activity, assesses community involvement, measures satisfaction with services and identifies perceptions about other services, facilities or improvements needed in the Inner North Belfast NRA.
4.1 Physical changes within the Inner North Belfast NRA Four-fifths (80%) of respondents were not aware of any physical changes, which had improved the neighbourhood within the previous 12 months. Physical changes identified by the remaining 20% (35 respondents) included ‘new houses being built’; ‘garden area and park improved’ and ‘repairs carried out in area’ (Appendix Tables 4.1 and 4.2).
4.2 Important issues to be addressed in the neighbourhood Almost half (48%) of respondents thought there were important issues that needed to be addressed (Appendix Tables 4.3). The most common issues were to ‘deal with ASB’; ‘clean up the area’ and new ‘leisure centre and facilities for elderly and youth’. A full breakdown of issues identified by respondents is in Appendix Table 4.4.
4.3 Facilities/services/activities in the area Respondents were asked about their awareness and use of certain facilities in the area and whether anyone in their household would use them. The highest proportions of respondents were aware of mothers and toddler group (52%); youth activities (49%) and sports facilities (48%). Use of these facilities varied greatly as shown in Table 4A and Appendix Table 4.5.
Table 4A: Awareness and use of local facilities Percentage (%)
Aware of… Would use… Mother and Toddler Group 52 21 Youth activities 49 27 Sports facilities 48 26 Facilities for senior citizens 42 19 Pre/extended school play group 39 30 Adult education classes 36 16
Base: 174 respondents 4.4 Services needed that were not already available
More than half (53%) of respondents gave examples of services or facilities needed in the area, 31 respondents (27%) said ‘more facilities for young people and the elderly’ and 20 respondents (17%) stated the need for a ‘leisure centre in the area’. Responses were varied and are detailed fully in the appendix tables; however, almost two-fifths (39; 34%) of respondents did not state what services or facilities were needed in the area (Appendix Table 4.6).
21

Chapter 4: Neighbourhood Renewal Inner North Belfast Neighbourhood Renewal Survey 2014
13/05/2014
4.5 Neighbourhood warden The majority (86%) of respondents said they were not aware of the Housing Executive’s neighbourhood warden service. Of the 14% of respondents who were aware, only a small number (9) had used the service and more than half (6) were satisfied with the service they had received (Appendix Tables 4.7-4.9).
4.6 General services within the area
Respondents were asked about a number of general services provided in the area and whether they found them satisfactory or unsatisfactory. Respondents were most satisfied with the emptying of recycle bins (91%); emptying of general household waste and wheelie bins and street lighting (87%). Respondents were least satisfied with the provision of bus shelters in the area (41%) and weeding of footpaths and alleyways (37%). The reasons for dissatisfaction were varied and are detailed in the appendix tables (Figure 4.1: Appendix Tables 4.10-4.31).
Base: 174 respondents
91
87
87
86
85
79
78
73
71
67
9
13
13
13
12
19
20
25
28
32
0% 20% 40% 60% 80% 100%
Emptying of recycle bins
Empty waste and wheelie bins
Street lighting
Street Sweeping
Maintenance of open green spaces
Clearing of road drains
Repairing roads/pavements
Policing
Bus Shelters
Weeding footpaths & alleyways
Figure 4.1: Satisfaction with local services
Satisfied Dissatisfied
Base: 166 respondents
22

Chapter 4: Neighbourhood Renewal Inner North Belfast Neighbourhood Renewal Survey 2014
13/05/2014
4.7 Community/residents’ associations Three-fifths (60%) of respondents said they did not know if their area had a community/residents’ association; 32% said they had and the remaining 6% said their area did not have one. Respondents who were aware of a community/residents’ association in their area were asked to name it. Their responses are listed in the appendix tables (Appendix Tables 4.32 and 4.33).
Of the 56 (32%) respondents who said their area had a community/residents’ association, almost three-fifths (59%) felt it was representative of the community as a whole; 11% said it was not representative and the remaining respondents (29%) did not know (Appendix Table 4.34). The reasons given by respondents who thought the community/residents’ association did not represent the community are detailed in Appendix Table 4.35. Almost two-thirds (65%) of all respondents said they would not consider joining a local community/residents’ association and 11% said they would consider doing so. A further 22% of respondents were undecided and 2% were already a member of a local community/residents’ association (Figure 4.2; Appendix Table 4.36).
4.7 Awareness of the local NRA
More than two-thirds (69%) of respondents had not been aware that their home was within the Inner North Belfast NRA. Of the 31% (54 respondents) who had been aware that their home was within the Inner North Belfast NRA, a small number (5) had contributed to the consultation process for the development of a neighbourhood renewal action plan. The main reasons given by the 39 respondents who had not contributed to the consultation process were that they had not known about the consultation process (Appendix Tables 4.37-4.40).
12% 60%
27%
1%
Figure 4.2: Would you consider joining a local community/residents' association?
Yes No Don't know Already a member
Base: 174 respondents
23

Chapter 5: Well-Being Inner North Belfast Neighbourhood Renewal Survey 2014
Well-Being The Warwick-Edinburgh Mental Wellbeing Scale (WEMWBS) asks
people to indicate how often they have felt a certain way on a range of issues, such as feeling optimistic, feeling relaxed, thinking clearly, feeling confident, and feeling cheerful. A score is then assigned (minimum score of 14 and maximum score of 70) and the higher a person’s score, the better their level of mental wellbeing.
5.1 In Inner North Belfast, the mean score was 47, with similar mean
scores for males (47) and females (48). This is similar to the Northern Ireland population mean score of 50 with the same mean scores for males and females (5014) (Appendix Table 5.1. Although not directly comparable because this survey asked one respondent from a household rather than the general population it does provide a useful indication of the levels of well-being in the Inner North Belfast area under study (all tenures).
Scores were only collected from those who answered 6 or more of the questions - it must be noted that this score is based on the HRP (household reference person) however this may not be the person who completed the survey). (Source: Warwick- Edinburgh Mental Wellbeing Scale).
14 Health Survey Northern Ireland: First Results from the 2011/12 Survey: Bulletin 1
26

Chapter: 6 Education Inner North Belfast Neighbourhood Renewal Survey 2014
Education in Inner North Belfast NRA
One of the main objectives of the Neighbourhood Renewal Strategy is to improve educational standards. This survey sought to ascertain respondents’ views on educational services for children and their personal experiences of, and opinions on, educational provision in Inner North Belfast NRA. The results of the latest education module of the 2010 Northern Ireland Omnibus Survey15 (NIOS) have been included for information.
6.1 General opinions about education
Respondents were asked how much they agreed or disagreed with a series of statements relating to education in general. More than four-fifths (87%) agreed that children at school in Northern Ireland get a good education (NIOS: 88%). Almost three-quarters (74%) of respondents agreed that staying on at school is important if one wants to get a good job (NIOS: 84%) and more than two-thirds (69%) of respondents agreed that they had enjoyed their time at school (NIOS: 67%) (Figure 5.1; Appendix Table 6.1).
Base: 174 respondents
6.2 Parents of children aged 4-18
The survey included a series of questions on education, directed at respondents who were the parent/guardian of children aged between 4 and 18 and attending school (39; 22% of all respondents in the survey). If respondents had more than one child of school age, they were asked to answer the questions with particular reference to the child with the nearest upcoming birthday (Appendix Table 6.2).
15 NISRA – Northern Ireland Omnibus Survey 2011 – Education Module
87 88
74 84
69 67
0102030405060708090
100
Inner North Belfast NIOS 2011
Figure 5.1: Respondents who agreed that.....
Children at school get a goodeducaiton
Staying at school is important
I enjoyed my time at school
27

Chapter: 6 Education Inner North Belfast Neighbourhood Renewal Survey 2014
6.3 Primary/secondary education
More than one-third (14; 36%) of respondents with school-age children said their child was in primary education (Years 1 to 7) and 25 (64%) respondents said their child was in post-primary education (Years 8 to 14) (Appendix Table 6.3).
6.4 Parents’ opinions on schools Respondents who were parents of school-aged children were asked to state the extent to which they agreed or disagreed with a series of statements relating to their child’s school. The majority (36; 92%) of respondents agreed that their child’s school gives clear information on how their child is getting on and they found their child’s school welcoming to parents (36: 92%). Equal proportions of respondents (35; 90% in each case) agreed their child’s school is well led and well managed and their child’s school is a good school (Appendix Table 6.4). Results from the NIOS 2011 are illustrated in Figure 5.2.
6.5 Importance of parental responsibilities regarding education
Almost all respondents (39; 97%; NIOS 2010 - 94%) who had school-age children said making sure their child attends school regularly and on time was very/quite important. Almost all respondents (36; 92%; NIOS 2011 - 96%) said helping their child with homework was very/quite important (Appendix Table 6.5).
92% 92% 90% 90% 86% 87% 87%
92%
gives me clear informationon how my child is getting
on
is welcoming to parents is well led and wellmanaged
…is a good school
Figure 5.2: Respondents who agreed that their child's school...
Inner North Belfast NIOS 2011 (NI)Base: 39 respondents
28

Chapter: 6 Education Inner North Belfast Neighbourhood Renewal Survey 2014
6.6 Term-time holidays Almost two-fifths (14; 36%) of respondents with school-age children, reported that they would consider taking their child out of school during term time, for example, for a family break or holiday. This figure is higher than the Northern Ireland level as reported by the NIOS 2011, which found that 23% of parents would consider taking their child out of school during term time (Appendix Table 6.6).
6.7 Parental involvement The majority (38: 97%) of respondents said they felt involved in their child’s school life (NI level – 88%). Respondents reported different levels of involvement in their child’s school, ranging from 36 (92%) attending parent-teacher meetings to three (8%) helping out with school clubs/classrooms. Findings from this survey and from the 2011 NIOS at Northern Ireland level are included for reference in Table 5A and Appendix Tables 6.7-6.9.
Table 5A: Type of parental involvement in child’s school
Activity
Percentages % Inner North Belfast 2013
NIOS 2011 (NI)
Attending parent/teacher meetings 92 85 Helping out with dinner duties/school trips and so on 21 9
Get involved with the Parent/Teacher Association (PTA) 10 12
Helping out with school clubs/classroom 8 10 Base: 39 respondents
6.8 Assistance with homework Almost half (19; 49%) of respondents with school-age children said they help their child with their homework every time; 23% (9) of respondents said they help most times and 15% (6) of respondents said they help occasionally. This is illustrated in Figure 5.3, which also shows data at the Northern Ireland level from the NIOS 2011(Figure 5.3 and Appendix Table 6.10).
49%
23% 15%
3% 10%
34%
18%
28%
11% 8%
Everytime Most times Occasionally Never Other
Base: 39 respondents
Figure 5.3: Assistance with homework
Inner North Belfast NIOS 2011 (NI)
29

Chapter: 6 Education Inner North Belfast Neighbourhood Renewal Survey 2014
6.9 Confidence helping child with homework Almost one-quarter (16: 41%) of respondents with children at school said they would feel confident most of the time helping their child with homework, 9 (23%) respondents said they would always feel confident. Ten (26%) respondents said they would feel confident some of the time and fewer respondents said it depends what the homework is (2: 5%). Findings from the 2011 NIOS are included for reference in the appendix tables (Appendix Table 6.11).
6.10 Children of primary school age
Of those 39 respondents with children who were still at school, 23 (59%) had one child or more between Year 1 and Year 7, i.e. at primary school (Appendix Tables 6.12 and 6.13). Respondents with more than one child of primary school age were asked to think about their eldest child when answering the following questions: Almost all respondents with children at primary school (22 out of 23) agreed that their child’s school puts enough emphasis on reading and writing skills. (2011: NIOS 87%). Most of this sub-sample of respondents (22 out of 23) agreed that their child’s school puts enough emphasis on basic numeracy skills/sums (2011: NIOS 91%) (Appendix Table 6.14).
6.11 Working in schools All respondents were asked if they had ever worked in a school: 10% said they had done so (Appendix Table 6.15).
30

Chapter: 7 Final Comment Inner North Belfast Neighbourhood Renewal Survey 2014
Final Comment
7.1 Respondents were asked if they had any other comment they would like to make about life in the Inner North Belfast Neighbourhood Renewal area. A total of 89 respondents gave 107 comments of which 17 (16%) stated that they were ‘happy living in the area and good community spirit’ ‘not enough housing in the area’ (10: 9%) and ‘lots of demolition and waste ground, needs regeneration’ (10: 9%) (Appendix Table 7.1).
31

Appendix: 1 Technical information Inner North Belfast Neighbourhood Renewal Survey 2013
Appendix 1: Technical information Survey methodology The Housing Executive Research Unit sent each randomly selected household a self-complete questionnaire and letter explaining the objectives of the survey prior to doorstep visits by qualified researchers from the Housing Executive’s Research Unit. Up to five attempts were made to achieve an interview at each issued address, unless a sampled household had notified the Research Unit that they did not wish to participate in the survey. At least one of the five attempts was made in the evening or at the weekend. Interviewers did not make calls on Sundays. The sample and response rate A total of 1299 properties were in the Inner North Belfast Neighbourhood Renewal Area, as identified by Pointer Address Data Base (GIS). The Housing Executive’s Research Unit selected a random sample of 400 households from all tenures within the NRA using specialised software, IBM SPSS Statistics. On completion of fieldwork, 66 addresses in the sample were identified as being ineligible due to being vacant, inaccessible or derelict, which reduced the valid sample to 336 addresses. A total of 174 completed interviews were achieved, giving a response rate of 49% (Table A1). Table A1 Breakdown of response: Number % Original target sample 400
Vacant/derelict/ inaccessible/demolished 35 Non residential 7 Revised target sample 358 100 Refusals 48 13 Non-contacts 136 38 Actual interviews achieved 174 49
Sample error The proportion of respondents who gave a particular answer was only an estimate of the proportion of all potential respondents in Inner North Belfast NRA who would have given that answer, i.e. there was a margin of error, plus or minus, known as the sample error. Table A2 shows the margins of error for various percentages for a sample size of 174 at the 95% confidence level. The 95% confidence level means that if the same survey were to be carried out 20 times, exactly the same results would be obtained in 19 of those cases. If, for example, the percentage cited in the report is 80%, the probable sample error is ± 6.1%. Therefore, there are 95 chances in 100 that the true figure lies between 73.9% and 86.1%.
32

Appendix: 1 Technical information Inner North Belfast Neighbourhood Renewal Survey 2013 Table A2 Response: 174 Percentages
5 or 95
10 or 90
15 or 85
20 or 80
25 or 75
30 or 70
35 or 65
40 or 60
45 or 55
50
50 Sample error: 3.3 4.6 5.4 6.1 6.6 7.0 7.3 7.5 7.6 7.6
Reporting conventions Conditions regarding the inclusion of numbers and/or percentages in findings, depending on the size of the sample or sub-sample, are set out below: ♦ Where the sample, or sub-sample, is 100 or more, the textual analysis (i.e. the
main body of the report) includes percentages only. The tabular analysis (i.e. the appendix tables) includes both numbers and percentages.
♦ Where the sample, or sub-sample, is 50 or more but less than 100, both the
textual and tabular analyses include numbers and percentages. ♦ Where the sample, or sub-sample, is less than 50, both the textual and tabular
analyses include numbers, but not percentage figures. Since the total achieved sample in this survey is 174 and questions were directed at sub-samples of less than 100 and also less than 50 respondents, all of the above conditions apply to sections of both the textual and tabular analyses. However, in the case of the sub-sample group of respondents with school-age children (40 respondents), the Research Unit decided, due to the proximity to the normal cut-off figure of 50, it was acceptable to include percentage figures in the analysis for the benefit of the client.
33

Appendix: 2 Questionnaire Inner North Belfast Neighbourhood Renewal Survey 2013
DEPARTMENT FOR SOCIAL DEVELOPMENT AND NORTHERN IRELAND HOUSING EXECUTIVE
AM PM Evening Schedule Number:
INNER NORTH BELFAST
NEIGHBOURHOOD RENEWAL SURVEY The Housing Executive, on behalf of the Dept for Social Development is carrying out a survey of people living in the Inner North Belfast area. The aim of the survey is to understand your views of the type of housing you live in and your perceptions of the Inner North Belfast area as a place to live. The findings will be used by Government to assess the impact of the Neighbourhood Renewal Initiative.
All information given will be treated in the strictest confidence
Section 1 – You and your home
Q1. How long have you lived in the Inner North Belfast area?
Please circle one response only Less than 6 months 1 6 months or more but less than 1 year 2 1 year or more but less than 5 3 5 years or more but less than 10 4 10 years or more but less than 15 5 More than 15 years 6
Q2. Where did you live immediately before your present home?
Please circle one response only Within the Inner North Belfast area? 1 Outside the Inner North Belfast area but within the (South West) Belfast City Council area
2
Outside the (South West) Belfast City Council area 3 Have never lived anywhere else 4
Q3. Which of the following best describes your home?
Please circle one response only House 1 Flat/apartment 2 Bungalow 3 Other,please specify here 4
34

Appendix: 2 Questionnaire Inner North Belfast Neighbourhood Renewal Survey 2013 Q4. Do you rent or own your home?
Please circle one response only Rent from Housing Executive 1
Rent from Housing Association 2
Rent Privately 3
Owner Occupier 4
Purchased through Co-ownership 5
Other, please specify here
6
Q5. Do you have central heating in your home?
Please circle one response only Yes – full 1 Yes – partial 2 No 3
Q6. What is your main source of heating?
Please circle one response only Oil Fired with radiators 1
Mains Gas 2
Bottled/Tank gas 3
Economy 7 4
Electric fire (not Economy 7) 5
Solid Fuel Open Fire (with radiators) 6
Solid Fuel Open Fire (no radiators) 7
Solid Fuel Glass Fronted Fire (with radiators) 8
Solid Fuel Glass Fronted Fire (no radiators) 9
Other, please specify here 10
Q7. How satisfied or dissatisfied are you with each of the following aspects of your main
heating system?
Please circle one response for each aspect of your main heating system
Very satisfied Satisfied
Neither satisfied
nor dissatisfied
Dissatisfied Very dissatisfied
the type of heating system 1 2 3 4 5
the cost of running your system 1 2 3 4 5
the amount of heat that you can get 1 2 3 4 5
the control over the level of heat 1 2 3 4 5
the ease of use of the system 1 2 3 4 5
35

Appendix: 2 Questionnaire Inner North Belfast Neighbourhood Renewal Survey 2013 Q8. In the last 12 months, have you ever been unable to adequately heat your home?
Please circle one response only
Yes 1 »Continue to question 9 No 2 »Go to question 10
Q9. Thinking about the last occasion, which of the following factors were responsible for your
inability to adequately heat your home? Please circle one answer for each line
Yes No The cost of domestic fuel 1 2 Low household income 1 2 Money needed for other priorities 1 2 Other, please specify here
1 2
Q10. Overall, how satisfied or dissatisfied are you with your home?
Please circle one response only Very satisfied 1 Quite satisfied 2 » Go to Section 2 Neither satisfied nor dissatisfied 3 Dissatisfied 4 » Continue to question 11 Very dissatisfied 5
Q11. If dissatisfied, can you please tell us your main reasons why?
1.
2.
36

Appendix: 2 Questionnaire Inner North Belfast Neighbourhood Renewal Survey 2013 Section 2 – Future Intentions THE FOLLOWING QUESTIONS ARE FOR HOUSING EXECUTIVE AND HOUSING ASSOCIATION TENANTS ONLY. IF YOU ARE NOT A HOUSING EXECUTIVE/ ASSOCIATION TENANT PLEASE GO TO SECTION 3 Q1. Do you intend within the next 2 years to buy your home from the Housing
Executive/Housing Association? Please circle one response only
Yes 1 » Go to Section 3 No 2 » Continue to question 2 Don’t know 3 » Continue to question 2
Q2. Have you applied in the last 2 years to the Housing Executive/Housing Association for a
transfer from your present property? Please circle one response only
Yes 1 » Go to question 4 No 2 » Continue to question 3
Q3. Do you intend within the next 12 months to apply for a Housing Executive/Housing
Association transfer?
Please circle one response only Yes 1 » Continue to question 4 No 2 » Go to Section 3
Q4. If Yes, where do you wish to transfer to?
Please circle one response only
Within the Inner North Belfast area? 1
Outside the Inner North Belfast area but within the (South West) Belfast City Council area 2
Outside the (South West) Belfast City Council area 3
Q5. What are your main reasons for applying for a transfer?
1. 2. 3.
37

Appendix: 2 Questionnaire Inner North Belfast Neighbourhood Renewal Survey 2013 Section 3 – Your Neighbourhood THE FOLLOWING QUESTIONS ARE FOR ALL RESPONDENTS Q1. To what extent do you agree or disagree with each of the following statements about your
area? Please circle one response on each line
Strongly agree
Agree a little
Neither / nor
Disagree a little
Strongly disagree
Don’t know
I really feel part of the community, living in this area 1 2 3 4 5 6
I’m embarrassed to bring people to this area 1 2 3 4 5 6
I feel proud to come from this area 1 2 3 4 5 6
Q2. Would you say that,overall, this area is…
Please circle one response only Changing for the better 1 » Continue to question 3 Not really changing 2 » Go to question 4 Changing for the worse 3 » Continue to question 3
Q3. Why do you say that?
1. 2. 3.
Q4. For the following types of anti-social behaviour, can you tell me how much of a
problem they are in your area? By area we mean within a 15 minute walk.
Please circle one answ er on each line
Very big problem
Fairly big problem
Not a very big problem
No problem at all
Noisy neighbours or loud parties 3 2 1 0 Teenagers hanging around on streets 3 2 1 0 Rubbish or litter lying about 3 2 1 0 Vandalism, graffiti and other deliberate damage to property or vehicles 3 2 1 0
People using or dealing in drugs 3 2 1 0 Abandoned or burnt out cars 3 2 1 0 People being drunk or rowdy in public places 3 2 1 0
38

Appendix: 2 Questionnaire Inner North Belfast Neighbourhood Renewal Survey 2013 Q5. How much is your own quality of life affected by fear of crime on a scale from 1 to 10, where
1 is no effect and 10 is a total effect on your quality of life?
Please circle one response only 1 2 3 4 5 6 7 8 9 10
Q6. How safe do you feel walking alone in this area after dark? (by area we mean within a 15-
minute walk). If you never go out alone at night, how safe would you feel?
Please circle one response only Very safe Fairly safe A bit unsafe Very unsafe
1 2 3 4 » Go to question 8 » Continue to question 7
Q7. Why do you feel unsafe walking alone in this area after dark?
Please circle one response only Too old 1 Ill/sick/disabled 2 Family responsibilities 3 Fear of being mugged or physically attacked 4 Fear of burglary/vandalism 5 Fear of becoming a victim of crime 6 Fear of being subject to or witnessing anti-social behaviour 7 Fear of receiving verbal abuse 8 Young people hanging around 9 People using or dealing drugs 10 Other, please specify here
11
Q8. How safe do you feel walking alone in this area during the day? If you never go out alone
during the day, how safe w ould you feel?
Please circle one response only
Very safe Fairly safe A bit unsafe Very unsafe 1 2 3 4 » Go to question 10 » Continue to question 9
Q9. Why do you/would you feel unsafe walking alone in this area during the day?
Please circle one response only Too old 1 Ill/sick/disabled 2 Family responsibilities 3 Fear of being mugged or physically attacked 4 Fear of burglary/vandalism 5 Fear of becoming a victim of crime 6 Fear of being subject to or witnessing anti-social behaviour 7 Fear of receiving verbal abuse 8 Young people hanging around 9 People using or dealing drugs 10 Other, please specify here
11
39

Appendix: 2 Questionnaire Inner North Belfast Neighbourhood Renewal Survey 2013 Q10. How safe do you feel when you are alone in your own home at night? NB – if you are
never alone at night, how safe would you feel if you were alone in your home at night?
Please circle one response only
Very safe Fairly safe A bit unsafe Very unsafe 1 2 3 4
POLICING IN THE AREA
The NI Housing Executive works in partnership with other agencies including the police in order to reduce crime, anti-social behaviour and fear of crime. Public confidence in the police is an important aspect in achieving this and hence we’re interested your responses to the following questions. Q11. How much do you agree or disagree with each of the following statements about the police
in your area? You don’t need to have had contact with the police to answer these questions and again, by area we mean within a 15-minute walk from your home.
Strongly agree
Tend to agree
Neither agree nor disagree
Tend to disagree
Strongly disagree
Don’t know
They (the police in this area) can be relied on to be there when you need them.
1 2 3 4 5 6
They (the police in this area) would treat you with respect if you had contact with them for any reason.
1 2 3 4 5 6
They (the police in this area) treat everyone fairly regardless of who they are
1 2 3 4 5 6
They (the police in this area) can be relied on to deal with minor crimes 1 2 3 4 5 6
They (the police in this area) are dealing with the things that matter to people in this community
1 2 3 4 5 6
Taking everything into account I have confidence in the police in this area 1 2 3 4 5 6
Please go to Section 4.
40

Appendix: 2 Questionnaire Inner North Belfast Neighbourhood Renewal Survey 2013 Section 4 – Neighbourhood Renewal
Q1. Are you aware of any physical changes that have improved your neighbourhood in the
last 12 months?
Please circle one response only Yes 1 » Continue to question 2 No 2 » Go to question 3
Q2. If yes, please give details of the most recent improvements to your area.
1
2.
3.
Q3. Are there any important issues in your neighbourhood that you think need to be addressed?
Please circle one response only Yes 1 » Continue to question 4 No 2 » Go to question 5
Q4. What are the most important issues in your neighbourhood that you would like to see addressed? Please limit your responses to 3 issues.
1.
2.
3.
41

Appendix: 2 Questionnaire Inner North Belfast Neighbourhood Renewal Survey 2013 TO ALL RESPONDENTS Q5 Here is a list of facilities and services in the area. Please tell us whether you aware of
the facility/service in your area (Part A). And if yes, you are aware, do you or household members use these facilities (Part B).
Part A Part B Aware of the
facilities/services If yes, do you or household members use these facilities
Mother/Toddler & Childcare Facilities Yes No Yes No Pre/Extended School Facilities
Yes No Yes No
Youth Facilities
Yes No Yes No
Facilities for Senior Citizens
Yes No Yes No
Education Classes
Yes No Yes No
Sports Facilities
Yes No Yes No
Q6. We are interested in obtaining your views on what facilities, services or activities you would like to see provided in the area that are not already available.
1 2 3
Q7. Do you know about the neighbourhood warden service provided by the Housing Executive?
Please circle one response only Yes 1 » Continue to question 8 No 2 » Go to question 11
Q8. Have you ever used the service?
Please circle one response only Yes 1 » Continue to question 9 No 2 » Go to question 11
Q9. How satisfied or dissatisfied were you with the service you received?
Please circle one response only Very satisfied 1 Quite satisfied 2 » Go to question 11 Neither satisfied nor dissatisfied 3 Dissatisfied 4 » Continue to question 10 Very dissatisfied 5
42

Appendix: 2 Questionnaire Inner North Belfast Neighbourhood Renewal Survey 2013 Q10. If dissatisfied, how could the service be improved? (please specify)
1. 2.
Q11. Here is a list of general services in the area. Please tell us whether the service is
satisfactory or unsatisfactory in Part A and if it is unsatisfactory, please give your main reason why in Part B.
Part A Part B Satisfactory Unsatisfactory Why unsatisfactory Emptying of general household waste wheelie bins
1 2
Emptying of recycling bins 1 2 Repairing of roads & pavements
1 2
Street sweeping
1 2
Clearing of road drains
1 2
Street lighting
1 2
Policing in the area
1 2
Bus services
1 2
Provision of bus shelters 1 2
Maintenance of open green areas
1 2
Weeding of footpaths and alleyways
1 2
Q12. Does your area have a local Community/Residents’ Association?
Please circle one response only Yes 1 » Continue to question 13 No 2 » Go to question 16 Don’t know 3 » Go to question 16
Q13. If yes, please state the name of your local Community/Residents Association.
43

Appendix: 2 Questionnaire Inner North Belfast Neighbourhood Renewal Survey 2013 Q14. Do you feel the local Community/Residents Association is representative of the local
community as a whole?
Please circle one response only Yes 1 » Go to question 16 No 2 » Continue to question 15 Don’t know 3 » Go to question 16
Q15. If no – please give your main reasons why?
Q16. Would you consider joining a local Community/Residents Association?
Please circle one response only Yes 1 No 2 Don’t know 3 Already a member 4
Neighbourhood Renewal is a partnership between all government departments, agencies, communities and others to work together to close the gap between the quality of life for those living in the most disadvantaged areas with the rest of Northern Ireland. Your household has been selected to participate in this survey because you live within the Inner North Belfast Neighbourhood Renewal Area.
To all respondents
Q17. Were you aware that your household lies within the Inner North Belfast Neighbourhood Renewal Area?
Please circle one response only Yes 1 » Continue to question 18 No 2 » Go to Section 5
Q18. Neighbourhood Renewal Action Plans have been developed for your area. Did you contribute to the consultation process for the development of the Neighbourhood Renewal action plan for your area?
Please circle one response only Yes 1 » Continue to question 19 No 2 » Go to question 20 Don’t know 3 » Go to Section 5
44

Appendix: 2 Questionnaire Inner North Belfast Neighbourhood Renewal Survey 2013 Q19. If yes, please give brief details about your level of contribution to the Neighbourhood
Renewal Consultation Exercise?
» Go to Section 5
Q20. If no, please tell us your main reason why you did not contribute to the consultation process?
» Go to Section 5
45

Appendix: 2 Questionnaire Inner North Belfast Neighbourhood Renewal Survey 2013 SECTION 5: WELL-BEING
TO ALL RESPONDENTS
Below are some statements about feelings and thoughts.
Q1 Please indicate for each of the seven statements that is closest to how you feel over the
last 2 weeks? (Notice the higher number means better well-being)
Please circle one response for each line
STATEMENTS None of the time
Rarely Some of the time
Often All of the
time
I’ve been feeling optimistic about the future 1 2 3 4 5
I’ve been feeling useful 1 2 3 4 5
I’ve been feeling relaxed 1 2 3 4 5
I’ve been dealing with problems well 1 2 3 4 5
I’ve been thinking clearly 1 2 3 4 5
I’ve been feeling close to other people 1 2 3 4 5
I’ve been able to make up my own mind about things 1 2 3 4 5
46
Appendix: 2 Questionnaire Inner North Belfast Neighbourhood Renewal Survey 2013 Section 6 – Education
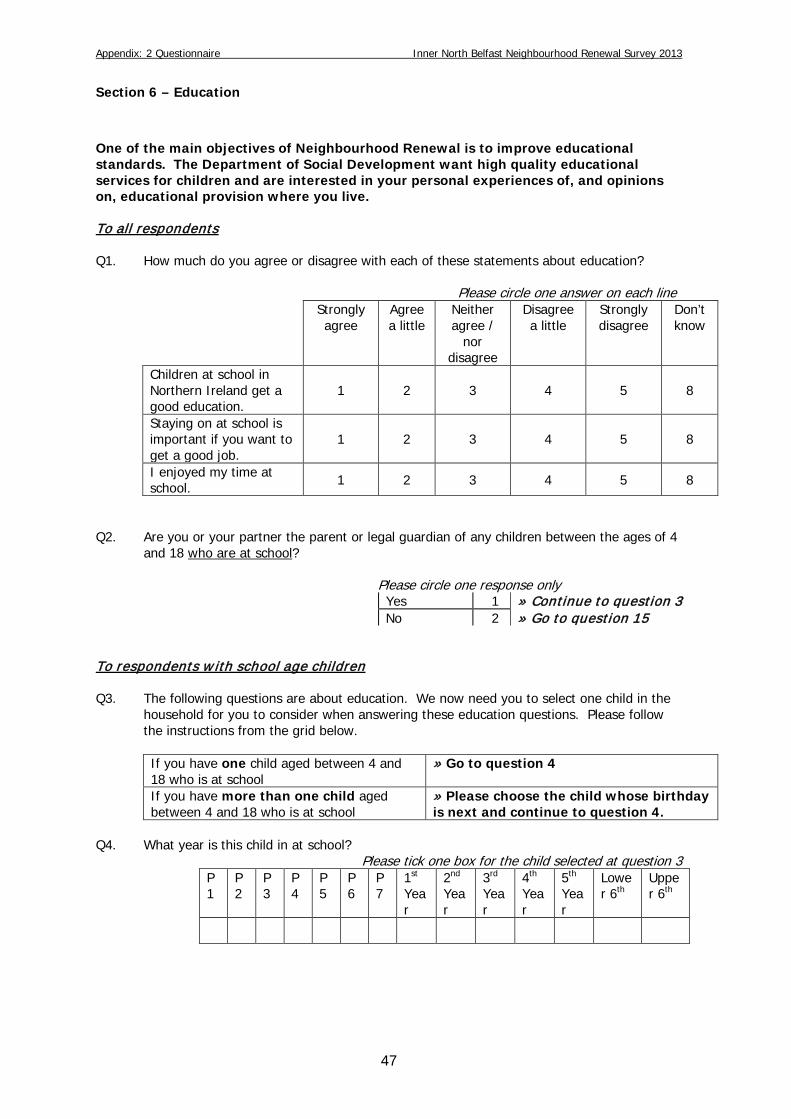
One of the main objectives of Neighbourhood Renewal is to improve educational standards. The Department of Social Development want high quality educational services for children and are interested in your personal experiences of, and opinions on, educational provision where you live. To all respondents Q1. How much do you agree or disagree with each of these statements about education?
Please circle one answer on each line
Strongly agree
Agree a little
Neither agree /
nor disagree
Disagree a little
Strongly disagree
Don’t know
Children at school in Northern Ireland get a good education.
1 2 3 4 5 8
Staying on at school is important if you want to get a good job.
1 2 3 4 5 8
I enjoyed my time at school. 1 2 3 4 5 8
Q2. Are you or your partner the parent or legal guardian of any children between the ages of 4
and 18 who are at school?
Please circle one response only Yes 1 » Continue to question 3 No 2 » Go to question 15
To respondents w ith school age children Q3. The following questions are about education. We now need you to select one child in the
household for you to consider when answering these education questions. Please follow the instructions from the grid below.
If you have one child aged between 4 and 18 who is at school
» Go to question 4
If you have more than one child aged between 4 and 18 who is at school
» Please choose the child whose birthday is next and continue to question 4.
Q4. What year is this child in at school?
Please tick one box for the child selected at question 3 P1
P2
P3
P4
P5
P6
P7
1st Year
2nd Year
3rd Year
4th Year
5th Year
Lower 6th
Upper 6th
47

Appendix: 2 Questionnaire Inner North Belfast Neighbourhood Renewal Survey 2013 Questions 5 to 11 are in relation to the child selected at Q3 Q5. Please indicate the extent to which you agree or disagree with the following statements.
Please circle one answer on each line Strongly
agree Agree a little
Neither agree nor disagree
Disagree a little
Strongly disagree
Don’t know
I find my child’s school welcoming to parents 1 2 3 4 5 8
My child’s school gives me clear information on how my child is getting on
1 2 3 4 5 8
My child’s school is well led and well managed 1 2 3 4 5 8
My child’s school is a good school 1 2 3 4 5 8
Q6. Here is a list of responsibilities parents have told the Department of Education about. For
each one can you tell us how important it is to you?
Please circle one answer on each line Very
important Quite
important Not very important
Not at all important
Don’t know
Making sure your child attends school regularly and on time. 1 2 3 4 8
Helping your child with schoolwork 1 2 3 4 8 Q7. Sometimes parents take their child out of school during term time, for example on a family
break or holiday. Would you consider doing this yourself?
Please circle one response only Yes 1 No 2
Q8. How involved do you personally feel in your child’s school life?
Please circle one response only Very
involved Fairly
involved Not very involved
Not at all involved
1 2 3 4 Q9. Thinking of your involvement with your child’s school, which (if any) of the following
activities do you do? Please circle one answer on each line
Yes No Go to parent teacher meetings 1 2 Help out in the classroom 1 2 Help out with dinner duties/school trips and so on 1 2 Help out with school clubs 1 2 Get involved with the Parent Teacher Association (PTA) 1 2 None of these 1 2 Other, please specify
1 2
Q10. How often do you help your child with their homework?
Please circle one response only
48

Appendix: 2 Questionnaire Inner North Belfast Neighbourhood Renewal Survey 2013
Doesn’t get homework 1 Every time 2 Most times 3 Occasionally 4 Never 5 When the child asks for help 6
Q11. How confident do you/would you feel helping your child with their homework?
Please circle one response only Always confident Confident most
of the time Confident some
of the time Never
confident Depends what it
is 1 2 3 4 5
Q12. The next question applies only to respondents who are the parent/guardian of a child or
children in primary school, from Year 1 (P1) to Year 7 (P7).
If you have one child in Primary School » Go to question 13 If you have more than one child in primary school
» P lease choose the eldest of these children and continue to question 13.
Q13. What year is this child in at school?
Please tick one box for the child selected at question 12 P1 P2 P3 P4 P5 P6 P7
Q14. Please indicate the extent to which you agree or disagree with the following statements
(about the child in primary school between years 1 and 7)
Please circle one answer on each line Strongly
agree Agree a
little Neither
agree nor disagree
Disagree a little
Strongly disagree
Don’t know
My child’s school puts enough emphasis on reading and writing skills
1 2 3 4 5 8
My child’s school puts enough emphasis on basic numeracy skills/sums
1 2 3 4 5 8
To all respondents Q15. Have you ever worked in a school?
Please circle one response only Yes 1 No 2
Section 6 – You and Your Household
49

Appendix: 2 Questionnaire Inner North Belfast Neighbourhood Renewal Survey 2013
It would be very helpful to the research if you could provide some details about yourself and the people who live with you
Under the Disability Discrimination Act (1995) a “disabled person” is defined as a person with:
“A physical or mental impairment which has a substantial and long term adverse effect on a person’s ability to carry out normal day to day activities”.
Day to day activities are normal activities carried out by most people on a regular basis. The affect of the disability must have lasted at least 12 months, or are likely to last at least 12 months or for the rest of the life of the person affected.
Q1. Does any member of your household have a disability which affects their normal day to day activities?
Please circle one response only Yes 1 » Continue to question 2
No 2 » Go to question 3
Q2. How many members of your household have a disability that affects their normal day to day activities?
Please circle one response only 1 2 3+
Q3 How many people live in this household? Enter number
Now please go to question 4
50

Appendix: 2 Questionnaire Inner North Belfast Neighbourhood Renewal Survey 2013 Q4. Could you please complete the following table and provide details of everyone who lives
here and how they are related to the Household Reference Person (HRP)? This is the person who would be considered to be the head of the household. Please circle a response for each category that applies to each person. Please start by giving the age of the Household Reference Person and then work down the categories, circling the appropriate response.
Person: HRP 2 3 4 5 6 7 8 9 10 Age on last birthday:
Gender Male Female
1 2
1 2
1 2
1 2
1 2
1 2
1 2
1 2
1 2
1 2
Your Household HRP Relationship to HRP: Partner (married)
Partner (cohabiting) Partner (civil partnership)
Child Parent
Other Relative Lodger
Other non-relative
1 2 3 4 5 6 7 8 9
2 3 4 5 6 7 8 9
2 3 4 5 6 7 8 9
2 3 4 5 6 7 8 9
2 3 4 5 6 7 8 9
2 3 4 5 6 7 8 9
2 3 4 5 6 7 8 9
2 3 4 5 6 7 8 9
2 3 4 5 6 7 8 9
Employment Status Self Employed
Working full-time Working part-time
Not working short term (< 1 year) Not working long term (> 1 year)
Retired (excludes looking after home) Student (further / higher education)
Permanent Sick/Disabled Looking after family/home
Other, including schoolchild
1 2 3 4 5 6 7 8 9 10
1 2 3 4 5 6 7 8 9 10
1 2 3 4 5 6 7 8 9 10
1 2 3 4 5 6 7 8 9 10
1 2 3 4 5 6 7 8 9 10
1 2 3 4 5 6 7 8 9 10
1 2 3 4 5 6 7 8 9 10
1 2 3 4 5 6 7 8 9 10
1 2 3 4 5 6 7 8 9 10
1 2 3 4 5 6 7 8 9 10
Marital Status Single (never married)
Married (first marriage) Re-married
Civil Partnership Separated (but still legally married) Divorced (but not legally remarried) Widowed (but not legally remarried)
1 2 3 4 5 6 7
1 2 3 4 5 6 7
1 2 3 4 5 6 7
1 2 3 4 5 6 7
1 2 3 4 5 6 7
1 2 3 4 5 6 7
1 2 3 4 5 6 7
1 2 3 4 5 6 7
1 2 3 4 5 6 7
1 2 3 4 5 6 7
Ethnic Group White
Chinese Irish Traveller
Indian Pakistani
Bangladeshi Black Caribbean
Black African Mixed Ethnic (please specify)
Other, please specify Black other (please specify)
1 2 3 4 5 6 7 8 9 10 11
1 2 3 4 5 6 7 8 9 10 11
1 2 3 4 5 6 7 8 9 10 11
1 2 3 4 5 6 7 8 9 10 11
1 2 3 4 5 6 7 8 9 10 11
1 2 3 4 5 6 7 8 9 10 11
1 2 3 4 5 6 7 8 9 10 11
1 2 3 4 5 6 7 8 9 10 11
1 2 3 4 5 6 7 8 9 10 11
1 2 3 4 5 6 7 8 9 10 11
Nationality British
Irish Northern Irish
Portuguese Latvian
Lithuanian Polish
Nigerian Other (please specify)
1 2 3 4 5 6 7 8 9
1 2 3 4 5 6 7 8 9
1 2 3 4 5 6 7 8 9
1 2 3 4 5 6 7 8 9
1 2 3 4 5 6 7 8 9
1 2 3 4 5 6 7 8 9
1 2 3 4 5 6 7 8 9
1 2 3 4 5 6 7 8 9
1 2 3 4 5 6 7 8 9
1 2 3 4 5 6 7 8 9
51

Appendix: 2 Questionnaire Inner North Belfast Neighbourhood Renewal Survey 2013 Q5. Can you please indicate the approximate total GROSS WEEKLY/MONTHLY/ ANNUAL
income from all sources for yourself and your partner (if you have one). That will be the amount before deductions of income tax, National Insurance and other compulsory deductions. Please take into account any money you may have from employment including bonuses, overtime, pensions and state pensions, benefits and interests from savings. Exclude money you may receive from other members of the household.
Please circle one response only
Less than £96 per week Less than £417 per month Less than £5,000 per year 1 £97 - £192 per week £418 - £833 per month £5,000 - £9999 per year 2 £193 - £288 per week £834 - £1,250 per month £10,000 - £14,999 per year 3 £289 - £385 per week £1,251 - £1,667 per month £15,000 - £19,999 per year 4 £386 - £481 per week £1,668 - £2,083 per month £20,000 - £24,999 per year 5 £482 - £577 per week £2,084 - £2,500 per month £25,000 - £29,999 per year 6 £578 - £673 per week £2,501 - £2,917 per month £30,000 - £34,999 per year 7 £674 - £769 per week £2,918 - £3,333 per month £35,000 - £39,999 per year 8 £770 - £962 per week £3,334 - £4,167 per month £40,000 - £49,999 per year 9 £963 or more per week £4,168 or more per month £50,000 or more per year 10 Refused Refused Refused 77 Don’t know Don’t know Don’t know 88
Q6. Does the Household Reference Person or partner (if applicable) receive any of the
following benefits? (If no partner code N/A)
P lease circle a response for each benefit the household reference person and partner, if applicable, receives. Household Reference
Person Partner
Yes No Refused
Don’t
know
Yes No Refused
Not applicabl
e
Don’t know
Child Benefit 1 2 7 9 1 2 7 8 9 A Disability Benefit 1 2 7 9 1 2 7 8 9 Incapacity Benefit 1 2 7 9 1 2 7 8 9 Housing Benefit 1 2 7 9 1 2 7 8 9 Income Support 1 2 7 9 1 2 7 8 9 Jobseeker’s Allowance 1 2 7 9 1 2 7 8 9 Retirement Pension (inc works pension) 1 2 7 9 1 2 7 8 9
Working Tax Credit 1 2 7 9 1 2 7 8 9 Child Tax Credit 1 2 7 9 1 2 7 8 9 Pension Credit 1 2 7 9 1 2 7 8 9 Other Benefits, please specify
1 2 7 9 1 2 7 8 9
52

Appendix: 2 Questionnaire Inner North Belfast Neighbourhood Renewal Survey 2013 Q7. The Housing Executive has a policy of promoting complete equality in the provision of
housing and housing related services in Northern Ireland. In order to help monitor this it would be helpful if you would describe the religious composition of this household.
Please circle one response only
Protestant Catholic Mixed Religion Protestant/Catholic
Other None D\K Refused
1 2 3 4 5 8 7 Q8. Have you any other comments you would like to make about life in the Inner
North Belfast Neighbourhood Renewal area?
End of Questionnaire
THANK YOU VERY MUCH FOR YOUR HELP
53

Appendix 3: Tabular analysis Inner North Belfast Neighbourhood Renewal Survey 2014
Appendix 3: Tabular analysis
Socio-economic profile Table 1.1: Age of HRP Number %
16-24 5 3 25-39 37 21 40-59 60 35 60-74 35 20 75+ 15 9 No response/refused 22 12
Total 174 100 Base: 174 (all respondents) Table 1.2: Gender of HRP by Age of HRP 16-24 25-39 40-59 60-74 75+ Refused/
No response
Total %
Male
No. 2 16 32 26 9 6 91 % 40 43 53 74 60 27 52
Female
No. 3 21 28 9 6 3 70 % 60 57 47 26 40 14 40
No response
No. - - - - - 13 13 % - - - - - 59 8
Total No. 5 37 60 35 15 22 174 % 100 100 100 100 100 100 100
Base: 174 (all respondents) Table 1.3: Age of all household members Number %
15 and less 68 21 16-24 32 10 25-39 62 19 40-59 74 23 60-74 47 15 75+ 17 5 Refused/ no response 20 7
Total 320 100 Base: 320 (all respondents: 174 households)
54

Appendix 3: Tabular analysis Inner North Belfast Neighbourhood Renewal Survey 2014
Table 1.4: Employment status of HRP Number %
Working full-time 34 20 Working part-time 14 8 Self employed 4 2 Not working long-term (>1 year) 2 1 Not working short-term (<1 year) 12 7 Looking after family/home 12 7 Permanent sick/disabled 39 22 Retired (excludes looking after home) 39 22 Student 2 1 No response 16 10 Total 174 100
Base: 174 (all respondents) Table 1.5: Household type Household type definitions Number Inner North
Belfast 2014 %
Lone Adult (lone person below pensionable age – 65 years for men, 60 years for women) 47 27
Lone Older (lone person of pensionable age – 65 years for men, 60 years for women) 29 17
Lone Parent (sole adult living with dependent child(ren) < 16) 19 11
Two Adults (two people – related or unrelated – below pensionable age) 14 8
Small family (any two adults – related or unrelated – living with 1 or 2 dependent children < 16) 12 7 Large Adult (three or more adults – related or unrelated – and no dependent children < 16) 12 7 Two Older (two people – related or unrelated – at least one of whom is of pensionable age) 11 6 Large Family (any two adults – related or unrelated – living with more than 2 dependent children < 16) 5 3
Not enough information supplied to classify household type 25 14 TOTAL 174 100 Base: 174 (all respondents)
55

Appendix 3: Tabular analysis Inner North Belfast Neighbourhood Renewal Survey 2014
Table 1.6: Annual household Income Number %
Less than £10,000 60 35 £10,000 to £14,999 31 18 £15,000 to £19,999 8 5 £20,000 to £29,999 14 8 £30,000 or more per year 6 3 Refusal 20 11 Don’t know 22 13 No response 13 7 Total 174 100
Base: 174 (all respondents) Table 1.7: Benefits Benefits received Household
Reference Person (%)
Partner (%)
Housing Benefit 40 2 A Disability Benefit 29 6 Retirement Pension 21 20 Child Benefit 21 4 Child Tax Credit 14 4 Income Support 12 - Pension Credit 12 4 Incapacity Benefit 12 - Working Tax Credit 11 - Jobseekers Allowance 9 4 Other including Carer’s Allowance 8 1
Base: 174 (all respondents): 51 (Partners) Table 1.8: Does any member of your household have a disability that affects their normal day to day activities? Number %
Yes 80 46 No 92 53 No response 2 1 Total 174 100
Base: 174 (all respondents) Table 1.9: How many members of your household have a disability that affects their normal day to day activities? Number % One 71 89 Two or more 9 11 Total 80 100
Base: 80 respondents with one or more disabled members in their household
56

Appendix 3: Tabular analysis Inner North Belfast Neighbourhood Renewal Survey 2014
Table 1.10: Household religion Number %
Protestant 77 44 Catholic 73 42 Other/No religion 13 7 Mixed Catholic/Protestant 3 2 Refused/no response 8 5 Total 174 100
Base: 174 (all respondents) Table 1.11: Ethnicity of HRP Number %
White 158 91 Other 3 1 No response/refused 13 8
Total 174 100 Base: 174 (all respondents) Table 1.12: Nationality of HRP Number %
British 86 49 Irish 51 29 Northern Irish 19 11 Other 4 3 No response 14 8 Total 174 100
Base: 174 (all respondents) Characteristics of the home and area Table 2.1: Tenure Number %
Social Housing 102 59 Owner Occupier 54 31 Rent privately 18 10 Total 174 100
Base: 174 (all respondents)
57

Appendix 3: Tabular analysis Inner North Belfast Neighbourhood Renewal Survey 2014
Table 2.2: Length of time living in Inner North Belfast NRA Number %
15 years or more 121 70
10 years or more but less than 15 12 7
5 years or more but less than 10 13 7 1 year or more but less than 5 18 10 Up to 1 year 10 6 Total 174 100
Base: 174 (all respondents) Table 2.3: Where did you live immediately before your present home? Number %
Within this Neighbourhood Renewal Area 107 61 Outside Belfast Council area 22 13 Outside Inner North Belfast NRA but within the Belfast Council Area 19 11 Have never lived anywhere else 26 15 Total 174 100
Base: 174 (all respondents) Table 2.4: Tenure by length of time living in Inner North Belfast NRA All
Social
Housing Owner
occupier Rent
privately TOTAL
Up to 1 year No 7 0 3 10 % 7 0 17 6
1 year or more but less than 5 No 8 4 6 18 % 8 7 33 10
5 years or more but less than 10 No 7 4 2 13 % 7 7 11 7
10 years or more but less than 15 No 9 3 0 12 % 9 6 0 7
15 years or more No 71 43 7 121 % 76 80 39 70
Total No 102 54 18 174 % 100 100 100 100
Base: 174 (all respondents) Table 2.5: Which of the following best describes your home? Number %
House 121 69 Flat/apartment 48 28 Bungalow 5 3 Total 174 100
Base: 174 (all respondents)
58

Appendix 3: Tabular analysis Inner North Belfast Neighbourhood Renewal Survey 2014
Table 2.6: Do you have central heating in your home? Number %
Yes – full 171 98 Yes – partial 2 1 No 1 1 Total 174 100
Base: 174 (all respondents) Table 2.7: What is your main source of heating? Number %
Mains gas 114 66 Oil fired with radiators 35 20 Economy 7 20 11 Solid fuel glass fronted fire – with radiators 5 3
Total 174 100 Base: 174 (all respondents) Table 2.8: How satisfied are you with the following aspects of your heating system?
Very satisfied/ Satisfied
Neither Dissatisfied/ Very
dissatisfied
Total
No % No % No % No % The control over the level of heat
132 76 24 14 18 10 174 100
The type of heating system 128 74 17 10 29 16 174 100
Ease of using the system 127 73 23 13 24 14 174
100
The amount of heat that you can get
123 71 14 8 37 21 174 100
The cost of running your system
89 51 27 16 58 33 174 100
Base: 174 (all respondents) Table 2.9: In the last 12 months, have you ever been unable to adequately heat your home? Number %
Yes 51 29 No 123 71 Total 174 100
Base: 174 (all respondents)
59

Appendix 3: Tabular analysis Inner North Belfast Neighbourhood Renewal Survey 2014
Table 2.10: Factors in your inability to heat your home?
Yes No
No % No %
Low household income 33 65 18 35
Cost of domestic fuel 27 53 24 47
Money needed for other priorities
27 53 24 47
Other factors 6 12 45 88
Base: 51 (respondents who have been unable to adequately heat their home in the last 12 months) Table 2.11: Specified other reasons for inability to heat home Number System breaking down/inefficient 5 Change from oil to gas 1 Total 6
Base: 6 (respondents who gave another reason for their inability to adequately heat their home) Table 2.12: Overall, how satisfied or dissatisfied are you with your home? Number % Very satisfied/satisfied 122 70 Neither satisfied nor dissatisfied 23 13 Dissatisfied/very dissatisfied 29 17 Total 174 100
Base: 174 (all respondents) Table 2.13: Reasons for dissatisfaction with home Number Repairs required 14 Health reasons and property not suitable 8
Difficult to heat 7 Property damp 6 ASB reasons 6 Total 41 Base: 29 (respondents who were dissatisfied with the home who gave 41 reasons)
60

Appendix 3: Tabular analysis Inner North Belfast Neighbourhood Renewal Survey 2014
Table 2.14: Do you intend to buy your home from the Housing Executive / Housing Association within the next 2 years?
Number %
Yes 3 3 No 94 92 Don’t know/no response 5 5
Total 102 100 Base: 102 (respondents who were Housing Executive or Housing Association tenants) Table 2.15: Have you applied to the Housing Executive / Housing Association
for a transfer from your present property in the last 2 years? Number %
Yes 12 12 No 87 88 Total 99 100
Base: 99 (respondents who did not – or did not know if they – intend to buy their home) Table 2.16: Do you intend to apply for a Housing Executive / Housing
Association transfer within the next 12 months? Number %
Yes 7 8 No 80 92 Total 87 100
Base: 87 (respondents who did not intend to apply for a transfer) Table 2.17: Where do you wish to transfer? Number
Within the local area 17 To a different area 1 No response 1 Total 19
Base: 19 (respondents who had applied for a transfer or who intend to apply within the next 12 months) Table 2.18: Reason for applying for a transfer Number ASB reasons 12 Property not suitable 9 Repairs required and difficult to heat 3
Health reasons 3 Other, rats in area 1 No response 1 Total 29 Base: 17 (respondents who gave 29 comments)
61

Appendix 3: Tabular analysis Inner North Belfast Neighbourhood Renewal Survey 2014
Inner North Belfast NRA Table 3.1: Perceptions about the local area Strongly
agree/ Agree a
little
Neither Disagree a little/
Strongly disagree
Don’t know
No response
TOTAL
No % No % No % No % No % No % I really feel part of the community
104 60 33 19 29 17 6 3 2 1 174 100
I feel proud to come from this area
97 56 40 23 28 16 6 3 3 2 174 100
I’m embarrassed to bring people to this area
48 28 29 17 88 51 4 2 1 3 174 100
Base: 174 (all respondents) Table 3.2: Would you say that, overall, this area is… Number %
Changing for the better 49 28 Not really changing 83 48 Changing for the worse 42 24
Total 174 100 Base: 174 (all respondents) Table 3.3: Perceived reasons why the local area is changing Changing for the better Changing for the worse No. % No. % Good area to live and good housing 12 21 ASB in the area 30 41
Renovation and new build 9 16 Derelict dwellings 9 12
Less ASB 9 16 Drug dealing in area 7 10 People working together to improve the area 8 14 Too many private
rentals and immigrants 7 10
Area cleaned up and murals removed 6 10 Dogs fouling and
barking 6 8
More facilities 3 5 Shops closing and decline in population 4 6
No comment 11 18 Others, no parking, rubbish; new Holylands 7 10
No comment 2 3
Base: 49 respondents who gave 58 reasons Base: 42 respondents who gave 72 reasons
62

Appendix 3: Tabular analysis Inner North Belfast Neighbourhood Renewal Survey 2014
Table 3.4A: How much of a problem are the following issues in your area? By area we mean within a15-minute walk (%).
Very big problem
Fairly big
problem
Not a very big problem
No problem
at all No
Response Total
Rubbish or litter lying about 26 23 28 22 1 100% Vandalism, graffiti and other deliberate damage to property or vehicles
21 18 32 29 - 100%
Teenagers hanging around on streets 17 22 34 26 1 100% People using or dealing in drugs 21 17 28 34 - 100% People being drunk or rowdy in public places 12 17 33 38 - 100% Noisy neighbours or loud parties 9 8 32 50 1 100% Abandoned or burnt out cars 3 6 33 58 - 100%
Base: 174 (all respondents) Table 3.4B: Perceptions of ASB in the Inner North Belfast NRS area Number % Score of 10 or less 119 68 Score of 11 or more 55 32 TOTAL 174 100
Base: 174 (all respondents) Table 3.5: How much is your own quality of life affected by fear of crime on a scale of 1 to 10 (1 = no effect to 10 = total effect) Number %
1 – 3 (minimum effect) 87 50 4 – 7 (moderate effect) 59 34 8 -10 (fear of crime) 26 15 Not stated 2 1 Total 174 100
Base: 174 (all respondents) Table 3.6: How safe do you feel walking alone in this area during the day? Number %
Very safe 77 44 Fairly safe 72 41 A bit unsafe 20 12 Very unsafe 5 3 Total 174 100
Base: 174 (all respondents)
63

Appendix 3: Tabular analysis Inner North Belfast Neighbourhood Renewal Survey 2014
Table 3.7: Why do you not feel safe walking alone in this area during the day? Number Ill/sick/disabled 6 Fear of being mugged or physically attacked 5 Fear of becoming a victim of crime 5 Fear of being subjected to or witnessing ASB 3 Family responsibilities 2 Fear of receiving verbal abuse 1 Young people hanging around 1 Fear of burglary/vandalism 1 People using or dealing drugs 1 Total 25
Base: 25 (respondents who do not feel safe walking alone in the area during the day) Table 3.8: How safe do you feel when you are alone in your own home at night (if you are never alone at night, how safe would you feel)? Number %
Very safe 51 29 Fairly safe 82 47 A bit unsafe 31 18 Very unsafe 10 6 Total 174 100
Base: 174 (all respondents) Table 3.9: How safe do you feel walking alone in this area after dark? Number %
Very safe 24 14 Fairly safe 65 37 A bit unsafe 56 32 Very unsafe 29 17 Total 174 100
Base: 174 (all respondents) Table 3.10: Why do you not feel safe walking around this area after dark? Number %
Fear of being mugged or physically attacked 23 27 Fear of becoming a victim of crime 16 19 Ill/sick/disabled 9 11 Fear of being subject to or witnessing anti-social behaviour 12 14 Fear of receiving verbal abuse 3 3 Young people hanging around 6 7 People using or dealing drugs 5 6 Fear of burglary/vandalism 7 8 Family responsibilities 2 2 Others, strangers in area and poor street lighting 2 2 Total 85 100
Base: 85 (respondents who feel unsafe walking around the area after dark)
64
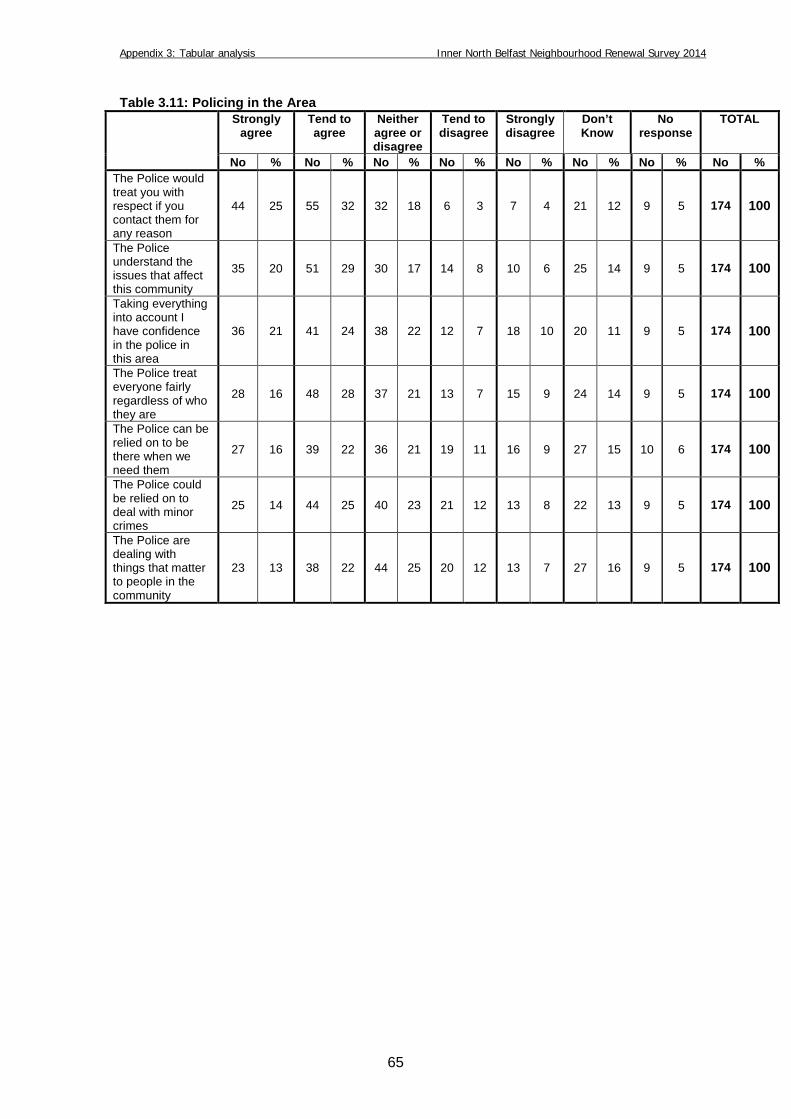
Appendix 3: Tabular analysis Inner North Belfast Neighbourhood Renewal Survey 2014
Table 3.11: Policing in the Area Strongly
agree
Tend to agree
Neither agree or disagree
Tend to disagree
Strongly disagree
Don’t Know
No response
TOTAL
No % No % No % No % No % No % No % No % The Police would treat you with respect if you contact them for any reason
44 25 55 32 32 18 6 3 7 4 21 12 9 5 174 100
The Police understand the issues that affect this community
35 20 51 29 30 17 14 8 10 6 25 14 9 5 174 100
Taking everything into account I have confidence in the police in this area
36 21 41 24 38 22 12 7 18 10 20 11 9 5 174 100
The Police treat everyone fairly regardless of who they are
28 16 48 28 37 21 13 7 15 9 24 14 9 5 174 100
The Police can be relied on to be there when we need them
27 16 39 22 36 21 19 11 16 9 27 15 10 6 174 100
The Police could be relied on to deal with minor crimes
25 14 44 25 40 23 21 12 13 8 22 13 9 5 174 100
The Police are dealing with things that matter to people in the community
23 13 38 22 44 25 20 12 13 7 27 16 9 5 174 100
65

Appendix 3: Tabular analysis Inner North Belfast Neighbourhood Renewal Survey 2014
Neighbourhood Renewal Table 4.1: Are you aware of any physical changes that have improved your neighbourhood in the last 12 months?
Number %
Yes 35 20 No 139 80 Total 174 100
Base: 174 (all respondents) Table 4.2: Changes to neighbourhood identified by respondents Number %
New houses being built 13 28 Garden area and park improved 10 22 Repairs carried out in area 10 22 Removal of murals and area cleaned up 5 12 Outdoor gym; dog walking area and cycle path 4 8 Improved roads and Grove demolished 4 8 Total number of responses 46 100
Base: 35 respondents that gave 46 responses Table 4.3: Are there any important issues in your neighbourhood that you think
need to be addressed?
Number %
Yes 83 48 No 91 52 Total 174 100
Base: 174 (all respondents)
66

Appendix 3: Tabular analysis Inner North Belfast Neighbourhood Renewal Survey 2014
Table 4.4: Important issues that respondents think need to be addressed
Number of responses
%
Deal with ASB 41 27 Clean up the area 25 16 Leisure Centre; facilities for elderly and young 18 12 More housing and regeneration 13 8 Dog fouling 11 7 More policing, alley gates and CCTV 10 6 Lots of derelict dwellings and waste ground 10 7 High number of break-ins 5 3 Too many private rentals and immigrants 6 4 More bus shelters, street lighting; police; shops 8 5 Others; deal with marches; football crowds and rats 5 3 No response 1 2 Total number of responses 153 100
Base: 83 respondents who gave 153 responses Table 4.5: Facilities/services/activities in the area Aware
of… %
Those who use… Number %
Mother and toddler group 52 19 21 Youth Activities 49 23 27 Sports Facilities 48 21 26 Facilities for senior citizens 42 14 19 Pre/extended school play group 39 20 30 Adult education classes 36 10 16
Base: 174 (all respondents) Table 4.6: Facilities/Services needed that are not already available
Number %
More facilities for young persons and elderly 31 27 Leisure Centre 20 17 Park or playground facilities and child care 9 8 Clean area up 4 3 New build and regeneration 4 3 Others, CCTV, allotments; jobs; less private rental, shops 9 8
Do nothing/don’t know 39 34 Total number of responses 116 100
Base: 174 (93 respondents who gave 116 responses)
67

Appendix 3: Tabular analysis Inner North Belfast Neighbourhood Renewal Survey 2014
Table 4.7: Do you know about the Neighbourhood Warden Service provided by the Housing Executive?
Number %
Yes 24 14 No 150 86 Total 174 100
Base: 174 (all respondents) Table 4.8: Have you ever used the service?
Number
Yes 9 No 15 Total 24
Base: 24 respondents who knew about the Neighbourhood Warden Service Table 4.9: How satisfied or dissatisfied were you with the service you received?
Number
Very satisfied/quite satisfied 6 Neither satisfied nor dissatisfied 1
Dissatisfied/very dissatisfied 2 Total 9
Base: 9 respondents who had used the Neighbourhood Warden Service Table 4.10: Satisfaction with emptying of general household waste and wheelie bins
Number %
Satisfactory 151 87 Unsatisfactory 22 13 No response 1 - Total 174 100
Base: 174 (all respondents) Table 4.11: Why is emptying of general household waste unsatisfactory?
Number
Need emptied more often 7 Don’t always empty 6 Don’t always return 3 Have to take through house and illegal dumping 2 Not stated 4 Total 22
Base: 22 respondents who found the emptying of household waste to be unsatisfactory
68

Appendix 3: Tabular analysis Inner North Belfast Neighbourhood Renewal Survey 2014
Table 4.12: Satisfaction with emptying of recycling bins
Number %
Satisfactory 158 91 Unsatisfactory 15 9 No response 1 - Total 174 100
Base: 174 (all respondents) Table 4.13: Why is emptying of recycling bins unsatisfactory?
Number
Don’t always emptied 5 Rubbish left lying 3 Not empties often enough/don’t lift if incorrect items put in 3
Don’t always return 2 Should have proper bins 1 No response 1 Total 15
Base: 15 respondents who found the emptying of recycling bins to be unsatisfactory Table 4.14: Repairing of roads and pavements
Number %
Satisfactory 136 78 Unsatisfactory 34 20 No response 4 2 Total 174 100
Base: 174 (all respondents) Table 4.15: Why is repairing of roads and pavements unsatisfactory?
Number
Poor condition; lots of holes and uneven 15 Poor service 7 No longer done 2 Too many cars parked 1 Not stated 9 Total 34
Base: 34 respondents who found the repairing of roads and pavements unsatisfactory
69

Appendix 3: Tabular analysis Inner North Belfast Neighbourhood Renewal Survey 2014
Table 4.16: Satisfaction with street sweeping
Number %
Satisfactory 150 86 Unsatisfactory 23 13 No response 1 1 Total 174 100
Base: 174 (all respondents) Table 4.17: Why is street sweeping unsatisfactory?
Number
Always litter/areas not covered 8 Not done often enough 7 Never see it being done 3 Don’t know 1 Not stated 4 Total 23
Base: 23 respondents who had found the street sweeping service to be unsatisfactory Table 4.18: Satisfaction with clearing of road drains
Number %
Satisfactory 138 79 Unsatisfactory 33 19 No response 3 2 Total 174 100
Base: 174 (all respondents) Table 4.19: Why is clearing of road drains unsatisfactory?
Number
Drains block/flood 12 Never see it done 8 Needs to be done more regularly 4 Not stated 9 Total 33
Base: 33 respondents who found the clearing of road drains to be unsatisfactory Table 4.20: Satisfaction with street lighting
Number %
Satisfactory 151 87 Unsatisfactory 22 13 No response 1 - Total 174 100
Base: 174 (all respondents)
70

Appendix 3: Tabular analysis Inner North Belfast Neighbourhood Renewal Survey 2014
Table 4.21: Why is street lighting unsatisfactory?
Number
Not enough lighting 10 Not bright enough 5 Often faulty 4 Not stated 3 Total 22
Base: 22 respondents who had found the provision of street lighting to be unsatisfactory Table 4.22: Policing in the area
Number %
Satisfactory 127 73 Unsatisfactory 43 25 No response 4 2 Total 174 100
Base: 174 (all respondents) Table 4.23: Why is policing in the area unsatisfactory?
Number
Never see them 13 Not enough police 11 Only deal with major crimes 4 Don’t deal with marches 1 Not stated 14 Total 43
Base: 43 respondents who had found the policing service to be unsatisfactory Table 4.24: Satisfaction with bus services
Number %
Satisfactory 161 93 Unsatisfactory 12 7 No response 1 - Total 174 100
Base: 174 (all respondents) Table 4.25: Why are bus services unsatisfactory?
Number
Bus service not regular 5 Not stated 7 Total 12
Base: 12 respondents who had found bus services to be unsatisfactory
71

Appendix 3: Tabular analysis Inner North Belfast Neighbourhood Renewal Survey 2014
Table 4.26: Satisfaction with provision of bus shelters
Number %
Satisfactory 124 71 Unsatisfactory 49 28 No response 1 - Total 174 100
Base: 174 (all respondents) Table 4.27: Why is the provision of bus shelters unsatisfactory?
Number
None in the area 18 Not enough 12 Vandalised 5 Not stated 14 Total 49
Base: 49 respondents who had found the provision of bus shelters to be unsatisfactory Table 4.28: Satisfaction with maintenance of open green spaces
Number %
Satisfactory 148 85 Unsatisfactory 21 12 No response 5 3 Total 174 100
Base: 174 (all respondents) Table 4.29: Why is the maintenance of open green spaces unsatisfactory?
Number
Litter/dog foul/wasteland 5 Not maintained 4 There is no green area 4 Not stated 8 Total 21
Base: 21 respondents who had found the maintenance of open green spaces to be unsatisfactory Table 4.30: Satisfaction with weeding of footpaths and alleyways
Number %
Satisfactory 117 67 Unsatisfactory 55 32 No response 2 1 Total 174 100
Base: 174 (all respondents)
72

Appendix 3: Tabular analysis Inner North Belfast Neighbourhood Renewal Survey 2014
Table 4.31: Why is the weeding of footpaths and alleyways unsatisfactory?
Number
Have never seen it done 16 Not weeded often enough 11 Not done properly/alleyways not done 11 Not stated 17 Total 55
Base: 55 respondents who had found the weeding of footpaths and alleyways to be unsatisfactory Table 4.32: Does your area have a community/residents’ association?
Number %
Yes 56 32 No 11 6 Don’t know 104 60 No response 3 2 Total 174 100
Base: 174 (all respondents) Table 4.33: Can you state the name of your local community/residents’ association?
Number %
Carrickhill Community Centre 5 9 Mount Vernon Community House 4 7
New Lodge 3 5 Newington Residents Assoc 3 5 Shore Crescent; Tiger’s Bay RA; STAR; The HUBB; Nth Queen Street; Upper Long St (2 respondents each)
12 22
TKD; Victoria; Camberwell Terr RA; Holy Family Youth Centre; Friends of the Grove (1 respondent each)
5 9
Don’t know 18 32 No response 6 11 Total 56 100
Base: 56 (respondents whose area has a community/residents’ association) Table 4.34: Do you feel the local community/residents’ association is representative of the local community as a whole?
Number %
Yes 33 59 No 7 11 Don’t know 16 29 Total 56 100
Base: 56 (respondents whose area has a community/residents association)
73

Appendix 3: Tabular analysis Inner North Belfast Neighbourhood Renewal Survey 2014
Table 4.35: Why do you feel the local community/resident association is not representative of the local community as a whole?
Number
Not always informed/don’t know what they do 2 Don’t involve everyone/only a few attend 2 Don’t deal with issues 1 No response 2 Total 7
Base: 7 (respondents who feel the community group is not representative of the local community) Table 4.36: Would you consider joining a local community/residents’ association?
Number %
Yes 19 11 No 113 65 Don’t know 39 22 Already a member 3 2 Total 174 100 Base: 174 (all respondents) Table 4.37: Were you aware that your household lies within the Inner North Belfast NRA?
Number %
Yes 54 31 No 120 69 Total 174 100
Base: 174 (all respondents) Table 4.38: Did you contribute to the consultation process for the development
of the Neighbourhood Renewal Action Plan?
Number
Yes 5 No 40 Don’t know/no response 9
Total 54 Base: 54 (respondents who were aware their household lies within the Inner North Belfast NRA)
74

Appendix 3: Tabular analysis Inner North Belfast Neighbourhood Renewal Survey 2014
Table 4.39: Level of involvement
Number
Via Resident’s Group 2 Went to meetings 2 No response 1 Total 5
Base: 5 (respondents who contributed to the consultation process) Table 4.40: Please tell us your main reason why you did not contribute to the consultation process?
Number Didn't know about it 10 I wasn’t asked 5 Too old/didn’t have time/not interested 5 Just talking shops 2 Don’t know/Not stated 20 Total 42
Base: 42 (respondents who did not contribute to the consultation process) Well-Being Table 5.1 Gender Number Mean Inner North Belfast Mean 149 47 Male 79 47 Female 70 46 Northern Ireland Mean 50 Base: 149 respondents who answered 6 or more of the questions
75

Appendix 3: Tabular analysis Inner North Belfast Neighbourhood Renewal Survey 2014
Education Table 6.1: To what extent do you agree/disagree with the following statements? relating to education? Strongly
agree/ agree a
little
Neither Disagree a little/strongly
disagree
Don’t know/no response
TOTAL
No % No % No % No % No % Children at school in Northern Ireland get a good education
152 87 9 5 4 3 9 5 174 100
Staying at school is important if you want to get a good job
129 74 22 13 8 5 15 8 174 100
I enjoyed my time at school 121 69 21 12 20 12 12 7 174 100
Base: 174 (all respondents) Table 6.2: Are you (or is your partner) the parent or legal guardian of any
children between the ages of 4 and 18 who are at school
Number %
Yes 39 22 No 135 78 Total 174 100
Base: 174 (all respondents) Table 6.3: What year is your child (or if more than one child, your eldest child) in at school? Number % Year 1 (P1) to Year 7 (P7) 14 36
Year 8 (Form 1) to Year 14 (Upper sixth) 25 64
Total 39 100 Base: 39 respondents with school-age children
76

Appendix 3: Tabular analysis Inner North Belfast Neighbourhood Renewal Survey 2014
Table 6.4: Please indicate the extent to which you agree or disagree with the following statements: Strongly
agree/ Agree a little
Neither Disagree a little/
Strongly disagree
TOTAL
No % No % No % No % My child’s school gives me clear information on how my child is getting on
36 92 2 5 1 3 39 100
I find my child’s school welcoming to parents 36 92 2 5 1 3 39 100
My child’s school is well led and well managed 35 90 3 7 1 3 39 100
My child’s school is a good school 35 90 2 5 2 5 39 100
Base: 39 respondents with school-age children Table 6.5: I am now going to read out a list of responsibilities parents have told
the Department of Education about. For each one can you tell me how important it is to you?
Very important
Quite important
Not very important
TOTAL
No. % No % No % No % Making sure your child attends school regularly and on time.
39 97 1 3 - - 39 100
Helping your child with schoolwork
36 92 3 8 - - 39 100
Base: 39 respondents with school-age children Table 6.6: Sometimes parents take their child out of school during term time,
for example, on a family break or holiday. Would you consider doing this yourself?
Number %
Yes 14 36 No 25 64 Total 39 100
Base: 39 respondents with school-age children Table 6.7: How involved do you personally feel in your child’s school life?
Number %
Very involved 24 61 Fairly involved 14 36 Not at all involved 1 3 Total 39 100
Base: 39 respondents with school-age children
77

Appendix 3: Tabular analysis Inner North Belfast Neighbourhood Renewal Survey 2014
Table 6.8: Do you go to parent-teacher meetings?
Number %
Yes 36 92 No 13 8 Total 39 100
Base: 39 respondents with school-age children Table 6.9: Involvement in local schools
Yes No TOTAL No % No % No %
Go to parent/teacher meetings 36 92 3 8 39 100 Help out with the dinner duties/school trips and so on 8 21 31 79 39 100 Involved with Parent/Teacher Association (PTA) 4 10 35 90 39 100 Help out with school clubs/classroom 3 8 36 92 39 100
Base: 39 respondents with school-age children Table 6.10: How often do you help your child with their homework?
Inner North Belfast
NIOS 2011
Number % %
Every time 19 49 34 Most times 9 23 18 Occasionally 6 15 28 Never 1 3 11 Other 4 10 8 Total 39 100 100
Base: 39 respondents with school-age children (Inner North Belfast NRS only) *Note: Others include: don’t get homework; when the child asks for help, Table 6.11: How confident do you/would you feel helping your child with their homework?
Inner North Belfast
NIOS 2010
Number % %
Always confident 9 23 34 Confident most of the time 16 41 18 Confident some of the time 10 26 28 Depends what it is 2 5 8 Never confident 2 5 11 Total 39 100 100
Base: 39 respondents with school-age children (Inner North Belfast NRS only)
78

Appendix 3: Tabular analysis Inner North Belfast Neighbourhood Renewal Survey 2014
Table 6.12: Do you have any children in the household in Year 1 to Year 7?
Number %
Yes 23 59 No 16 41 Total 39 100
Base: 39 respondents with school-age children Table 6.13: What year is your child (eldest primary school child if more than
one in the household) in at school?
Number
Year 1 4 Year 2 2 Year 3 4 Year 4 2 Year 5 1 Year 6 4 Year 7 5 Total 23
Base: 23 respondents with children in primary school Table 6.14: Please indicate the extent to which you agree or disagree with the
following statements. Number
Strongly agree/agree
a little
Neither/nor Total
My child’s school puts enough emphasis on reading and writing skills 22 1 23 My child’s school puts enough emphasis on basic numeracy skills/sums
22 1 23
Base: 23 respondents with children in primary school Table 6.15: Have you ever worked in a school?
Number %
Yes 17 10 No 138 79 No response 19 11 Total 174 100
Base: 174 (all respondents)
79
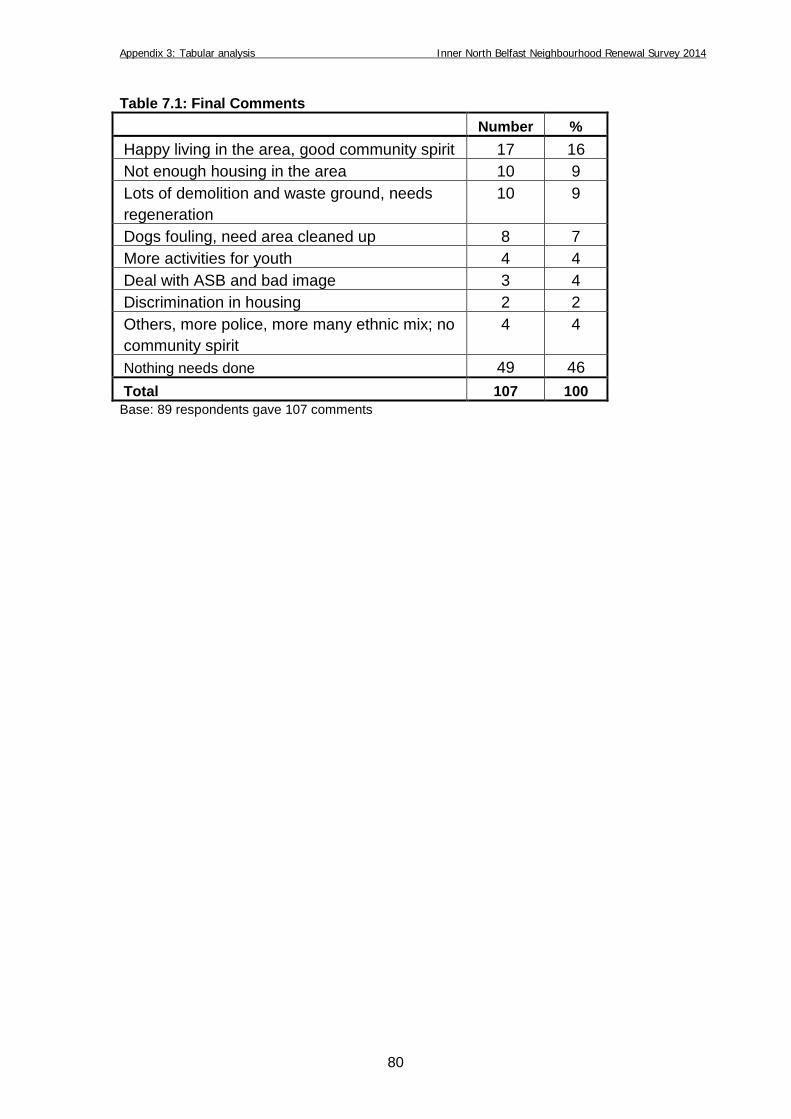
Appendix 3: Tabular analysis Inner North Belfast Neighbourhood Renewal Survey 2014
Table 7.1: Final Comments Number % Happy living in the area, good community spirit 17 16 Not enough housing in the area 10 9 Lots of demolition and waste ground, needs regeneration
10 9
Dogs fouling, need area cleaned up 8 7 More activities for youth 4 4 Deal with ASB and bad image 3 4 Discrimination in housing 2 2 Others, more police, more many ethnic mix; no community spirit
4 4
Nothing needs done 49 46 Total 107 100
Base: 89 respondents gave 107 comments
80

Appendix 4 Map of Inner North Belfast NRA Inner North Belfast Neighbourhood Renewal Survey 2014
Appendix 4: Map of Inner North Belfast Neighbourhood Renewal Area
81