Inner City Rail Capacity Study - Pre-Feasibility Report
138
INNER CITY RAIL CAPACITY STUDY Pre-Feasibility Report OCTOBER 2008
Transcript of Inner City Rail Capacity Study - Pre-Feasibility Report
INNER CITY RAIL CAPACITY STUDYPre-Feasibility Report
OCTOBER 2008
October, 2008
For Queensland Transport – Integrated Transport Planning
The contents of this report do not represent Queensland Transport or State Government policy ICRCS-Rpt-QT-008-D (Pre-Feasibility Report).doc
Inner City Rail Capacity Study:Pre-Feasibility Report

Authors: Les Chandra, Mark Bachels, Mischa Nugent, John Martin..........
Signed: .....................................................................................................
Reviewer: Mark Bachels, Ken Bagget...........................................................
Signed: .....................................................................................................
Approved by: Ray Rawlings ...............................................................................
Signed: .....................................................................................................
Date: .....................................................................................................
Distribution: .....................................................................................................

Inner City Rail Capacity Study Pre-Feasibility Report
i
The contents of this report do not represent Queensland Transport or State Government policy
Contents
Page Number
1. The Inner City Rail Capacity Study 11.1 Purpose 11.2 Background 1
1.2.1 Current rail system 11.2.2 Increasing demand for rail transport 21.2.3 Population growth 31.2.4 Desired pattern of city growth and the SEQRP 31.2.5 Improving public transport 41.2.6 Peak period rail service forecasts 51.2.7 Constraints to rail service expansion 51.2.8 Freight 61.2.9 Environment 61.2.10 Delivering a quality rail system for Brisbane 7
1.3 Study Objectives and Scope 81.3.1 Study objectives 81.3.2 Study area 81.3.3 Scope 9
2. Study process 112.1 Stage 1 – ICTCS strategic framework development 112.2 Stage 2 – Rail network concept planning 11
2.2.1 Stakeholder engagement 132.2.2 Multidisciplinary investigations 142.2.3 Detailed transport modelling 142.2.4 Multi-criteria analysis 14
2.3 Stage 3 – Technical pre-feasibility 15
3. Key study assumptions 163.1 Land use planning 163.2 Transport planning and modelling 163.3 Rail operations 173.4 Engineering 193.5 Environment 203.6 Finance/Economic analysis 20
4. Rail network concept planning 224.1 Key planning tasks 224.2 Concept generation process overview 234.3 Concept generation – objectives, techniques and tools 25
4.3.1 Objectives and criteria for concept generation 254.3.2 Stakeholder input into concept generation 31
4.4 Future demand estimation and capacity requirements 324.4.1 Demand-based future year patronage projections 324.4.2 Rail operations and timing of capacity requirements 354.4.3 Capacity constrained network case 38
4.5 SEQIPP 2008 input design 394.6 Options evaluation 39
4.6.1 Preferred 10 options 394.6.2 Options evaluation process 464.6.3 ‘10 to 6 options’ evaluation 464.6.4 ‘6 to 3 options’ short-listing 494.6.5 Financial/Economic analysis 51
4.7 Summary of outcomes 544.7.1 Short-listed options 544.7.2 Additional inner city options recommended 57
5. Technical pre-feasibility 60

I Inner City Rail Capacity Study Pre-Feasibility Report
Contents (continued) Page Number
ii
The contents of this report do not represent Queensland Transport or State Government policy
5.1 Objectives 605.1.1 Key objectives 60
5.2 Process overview 605.2.1 Inputs assumptions and standards 615.2.2 Environmental and sustainability considerations 625.2.3 Options for consideration 63
5.3 Alignment and built infrastructure assessment: 2016 645.3.1 Short-listed options (2, 4, 7) 645.3.2 Merivale bridge / tunnel option 655.3.3 Newstead/Fortitude Valley route 675.3.4 Exhibition loop daylighting 67
5.4 Alignment and built infrastructure assessment: 2026 685.4.1 Option 2 685.4.2 Option 4 695.4.3 Option 7 70
5.5 Tunnelling and built environment 725.5.1 Built environment constraints 725.5.2 Tunnelling – dimensions and constructability 725.5.3 Geotechnical constraints, issues and risks 73
5.6 Stations assessment 745.7 Rail systems 765.8 Environmental pre-feasibility assessment 775.9 Costs 80
5.9.1 Costing basis — major components 815.9.2 Cost planning 845.9.3 Total network projects 85
5.10 Summary 86
6. Network master plan 886.1 Master plan: projects and costs 2008 – 2026 89
7. Issues and Conclusions 947.1 Stage 2 – Issues and Conclusions 94
7.1.1 Key Findings for Stage 2 967.2 Stage 3 – Issues and Conclusions 97
7.2.1 Basis for definition of infrastructure 977.2.2 Summary of short-listed options 987.2.3 Other network projects 987.2.4 Overview of investigations of additional inner city options 997.2.5 TOD Opportunities and low station loading 1007.2.6 Integration with other government studies 101
7.3 Overall corridor recommendations 1017.4 Project risks going forward 105
7.4.1 Patronage Modelling 1057.4.2 Engineering and operational feasibility 1077.4.3 Scale, timing and cost 1087.4.4 Environment 108
8. Way forward 109

I Inner City Rail Capacity Study Pre-Feasibility Report
Contents (continued) Page Number
iii
The contents of this report do not represent Queensland Transport or State Government policy
List of tables Table 1-1: Future employment and population projections, 2016 and 2026 (thousands) 3Table 3-1: Land use assumptions 16Table 3-2: Transport planning assumptions 17Table 3-3: Rail operations assumptions 17Table 3-4: Engineering assumptions 19Table 3-5: Environment assumptions and general principles 20Table 3-6: Financial and economic assumptions 21Table 4-1: Concept Generation Process 23Table 4-2: Engineering standards 29Table 4-3: Total daily passenger trips 2006-2026 (model outputs) 33Table 4-4: AM 2 hour peak inbound boardings 34Table 4-5: Model inputs for capacity constrained network case 38Table 4-6: Objectives and mandatory evaluation criteria 40Table 4-7: '10 to 6 options' evaluation criteria by discipline 47Table 4-8: Evaluation criteria for '6 to 3' options assessment 49Table 4-9: Summary score and rank of options 50Table 4-10: Net present values for each option 52Table 4-11: Outcome of quantitative economic assessment (NPV) ($million) 53Table 4-12: Overall assessment of quantitative financial and economic impacts 53Table 5-1: Rail engineering standards adopted for technical pre-feasibility phase 61Table 5-2: Scoping of Environmental and Sustainability Issues for Review at this Stage of
Planning 62Table 5-3: Environmental impact - key findings 78Table 5-4: Cost overview for short-listed options 2, 4 and 7 81Table 5-5: Station construction and acquisition costing ($m) 82Table 5-6: 2016 project cost overview 84Table 5-7: 2026 Option 2 project cost overview 84Table 5-8: 2026 Option 4 project cost overview 85Table 5-9: 2026 Option 7 project cost overview 85Table 5-10: Expected cost of network projects 2008–2026 86Table 5-11: Most expensive network capacity projects 86Table 7-1 Recommended corridors for further investigation 102
List of figures Figure 1-1 QR Citytrain and busway network map 2Figure 1-2: Capacity constraints in the Brisbane inner-city rail network 6Figure 1-3 - ICRCS Study Area 9Figure 2-1: ‘Filter’ project methodology for options development and selection 12Figure 2-2 - Study process flowchart 13Figure 4-1: Map of city attractors 26Figure 4-2: Vertical constraints due to Brisbane River 30Figure 4-3: Corridors identified during stakeholder workshops 31Figure 4-4: Transport modelling, patronage estimation and rail capacity assessment
flowchart 32Figure 4-5: Compound Annual Growth Rate, by mode, all trips all day 34Figure 4-6: Forecast Citytrain boardings, suburban stations, inbound, 2 hour AM peak,
2006, 2016, 2026 35Figure 4-7: Recommended am peak period rail service patterns for 2016 36Figure 4-8: Recommended am peak period rail service patterns for 2026 37Figure 4-9: Option 1 41Figure 4-10: Option 2 41Figure 4-11: Option 3 42Figure 4-12: Option 4 42Figure 4-13: Option 5 43

I Inner City Rail Capacity Study Pre-Feasibility Report
Contents (continued) Page Number
iv
The contents of this report do not represent Queensland Transport or State Government policy
Figure 4-14: Option 6 43Figure 4-15: Option 7 44Figure 4-16: Option 8 44Figure 4-17: Option 9 45Figure 4-18: Option 10 45Figure 4-19: Three short listed options - Option 2 55Figure 4-20: Three short-listed options - Option 4 56Figure 4-21: Three short-listed options - Option 7 57Figure 5-1: All options (2016) Tunnelling long section - Fairfield to CBD1 65Figure 5-2: All options (2016) Tunnelling long section - Spring Hill to Eagle Junction 65Figure 5-3: Merivale Bridge/Tunnel Option - south-side main features 66Figure 5-4: Alternative 2016 route via Newstead/Fortitude Valley 67Figure 5-5: Possible alignment for exhibition loop daylighting 68Figure 5-6: Option 2 (2026) Tunnel long section from Indooroopilly to South Brisbane 69Figure 5-7: Option 2 (2026) Tunnel long section from South Brisbane to Breakfast Creek 69Figure 5-8: Option 4 (2026) Tunnel long section from Milton to CBD2 70Figure 5-9: Option 4 (2026) Tunnel long section from CBD2 to Breakfast Creek 70Figure 5-10: Option 7 (2026) Tunnel long section from Milton to CBD2 71Figure 5-11: Option 7 (2026) Tunnel long section from CBD2 to Breakfast Creek 71Figure 5-12: Key infrastructure constraints 72Figure 5-13: River crossing: Botanic Gardens to Kangaroo Point. Geotechnical section 74Figure 5-14: Station types 76Figure 5-15 Integration of platform screen doors and rollingstock 77Figure 7-1: 2016 Options A-B-C 103Figure 7-2: 2026 options D-E-F 104Figure 7-3: Impacts of fuel price rises on patronage 107
Executive summary Purpose
The purpose of the Inner City Rail Capacity Study (ICRCS) is to develop an Inner City Rail Master Plan that specifies the projects, estimated costs, staging and timing for the future development options for Brisbane’s inner city rail network.
Background
The Queensland Rail (QR) Citytrain suburban network extends approximately 400 km from the centre of Brisbane, south to Beenleigh and Robina on the Gold Coast, north to Ferny Grove, Shorncliffe, Caboolture and Gympie, east to Cleveland and west to Ipswich and Rosewood. The network includes 143 stations and plays a key role in supporting the public transport network, with suburban and interurban Citytrain services carrying more than 50 million passengers each year.
Generally, passenger rail services in Brisbane are medium- to long-distance suburban/commuter services, with heavy use during the AM and PM peaks and light use outside the peaks.

Inner City Rail Capacity Study Pre-Feasibility Report
v
The contents of this report do not represent Queensland Transport or State Government policy
Citytrain shares its network with other services, including regional and interstate freight and passengers services. Typically, 54 freight services and around 10 regional and interstate passenger services operate each day.
The QR Citytrain system has seen a steady growth in patronage over the past decade, with growth accelerating in the past five years.
A key challenge for the rail network is to accommodate the anticipated significant growth in passenger demand driven by population growth in south-east Queensland (SEQ) over the next 20 years and beyond, while also supporting growth in freight traffic.
Annual growth in public transport patronage (including rail patronage) is averaging approximately 10% per annum over the past 2–3 years1 and is driven by:
� sustained population growth
� increasing traffic congestion
� improvements of public transport services and infrastructure provision generally (i.e. improved integration and coordination of public transport delivery across all modes)
� rising fuel prices and parking charges
� growing awareness of climate change, as people seek to reduce their contribution to air pollution and greenhouse gas emissions.
The population of SEQ is expected to reach around 4 million by the year 2026, an increase of 1.5 million from 2001 and equivalent to over 1,200 people per week2.
The South East Queensland Regional Plan (SEQRP) promotes a system of activity nodes, of which Brisbane CBD would be the largest and most concentrated. The activity nodes are intended to be the focus of economic activity and infill development, and to encourage increasing use of public transport, particularly of rail and bus.
Two key policies from the SEQRP are relevant for the rail capacity study:
� Policy 12.2.1 — Develop a high quality and accessible public transport network linked to regional and sub-regional centres and services
� Policy 12.3.1 — Support the preferred sequence and form of development through investment in transport infrastructure and services.
The South East Queensland Integrated Plan and Program (SEQIPP) is a strategic long-term infrastructure plan that supports the SEQRP. It provides direction to state government agencies, local governments, the private sector and communities on the priorities and timing for major infrastructure investment in SEQ.
A key challenge for the rail capacity study is to identify how expanded rail capacity may be used to facilitate the desired land use strategies outlined in the SEQRP. 1 Source: Translink Network Plan 2 Source: OUM. South East Queensland Regional Plan 2005-2026. Amendment 1. Oct 2006

Inner City Rail Capacity Study Pre-Feasibility Report
vi
The contents of this report do not represent Queensland Transport or State Government policy
The inner city rail network is the backbone of the Citytrain rail network for SEQ. The capacity of this section of the network constrains the number of services that can be run across the network. A number of previous studies have indicated that continued growth in demand for rail services means that the inner city rail network will reach capacity in 2016.
Study objectives
The key objectives of the ICRCS are to:
� identify a preferred integrated land use and transport strategy for inner city Brisbane, particularly in relation to the rail network
� identify and assess the options for future development of the rail network, including river crossing(s)
� support best value integrated transport and land use outcomes
� provide input to the 2008 update of the SEQIPP.
The ICRCS study area broadly includes the rail network triangle between Bowen Hills, Park Road and Milton rail stations, and all of the inner city area within that triangle, as shown in Figure ES- 1 below.
Figure ES- 1: ICRCS study area
Inner City Rail Capacity Study Pre-Feasibility Report
vii
The contents of this report do not represent Queensland Transport or State Government policy
Study implementation stages
The ICRCS has been undertaken in three stages:
� Stage 1: Strategic framework development
� Stage 2: Rail network concept planning
� Stage 3: Technical pre-feasibility.
The Stage 1 study developed some high-level concepts and policies for integrated land use and transport for inner Brisbane which informed the more specialised studies conducted in Stages 2 and 3.
Queensland Transport engaged the Maunsell–Parsons Brinckerhoff (MPB) consortium to undertake the ICRCS Stages 2 and 3.
Stage 2 developed and evaluated a number of conceptual rail network options. The development of corridor concepts for Stage 2 involved a complex process, including:
� numerous stakeholder and technical team workshops
� a multidisciplinary approach to identify background opportunities, constraints and assessment methodologies for land use, transport planning, rail operations, engineering, environmental and financial/economic considerations
� detailed modelling of future transport and rail demand operational strategies
� a multicriteria assessment approach for option selection.
To assist with development of operating strategies used in the options development, and to provide quantitative data for transport, economic and environmental assessment of options, the study team undertook detailed strategic transport modelling. The model simulates multimodal transport networks and travel behaviour throughout SEQ. The study team undertook a major update to the multimodal model, including updates to:
� future rail network using planned or committed SEQIPP projects
� future road network using planned or committed SEQIPP projects
� land use projections for population and employment to 2026
� future public transport network using planned public transport network upgrades to 2026 as developed by TransLink, including a bus operating strategy which feeds passengers to rail.
For the ICRCS transport modelling exercise, three key tasks were undertaken:
1. calibration and validation for 2006 2. forecast demand estimation for 2016 and 2026, including modelling a capacity-constrained
network 3. Options testing for 2016 and 2026.

Inner City Rail Capacity Study Pre-Feasibility Report
viii
The contents of this report do not represent Queensland Transport or State Government policy
Importantly, the demand modelling and the rail operations analysis confirmed that two additional corridors/river crossings (or four additional tracks) are required by 2026. These include one corridor (or two additional tracks) from the south by 2016, and another corridor (or two additional tracks) from the west by 2026.
The approach taken to options development and selection involved: identifying numerous possible network concepts; selecting 10 preferred options for further assessment against agreed criteria; reducing these 10 options to 6 options for detailed assessment; and finally recommending a short-list of 3 options for detailed technical feasibility assessment in Stage 3. This selection process is outlined in Figure ES- 2 below.
Figure ES- 2: Options selection process
While all solutions were required to meet high standards in each assessment phase, analytical rigour in the development, refinement and selection of preferred options became progressively more detailed.
A multicriteria assessment (MCA) was conducted for both the ’10 to 6 options’ elimination phase and the ‘6 to 3’ assessment. The MCA was applied across the disciplines of land use, transport planning, rail operations, engineering, environment and finance/economics. Detailed criteria and weightings were applied for each discipline in the MCA, and sensitivity tests were conducted on option scores to ensure informed decisions were achieved.
Potential network concepts were required to achieve key objectives for land use, transport planning, rail operations, engineering and environment. These objectives were:
� Land use — integrates with and stimulates preferred land use development (as per the SEQRP and the Local Growth Management Strategy (LGMS) for Brisbane City Council)

Inner City Rail Capacity Study Pre-Feasibility Report
ix
The contents of this report do not represent Queensland Transport or State Government policy
� Transport planning — supports future ultimate general transport and public transport system, and does not preclude further public transport expansion
� Rail operations — solves the currently identified network constraints and meets identified future rail demand (passenger and freight)
� Engineering — is constructible; causes no unacceptable disruption of existing network; meets minimum rail engineering requirements (route curvature, platform lengths and passenger safety).
� Environmental standards — meets standards for new major infrastructure, including no unacceptable impacts.
Key assumptions
A number of assumptions were made in this study with respect to land use planning, transport planning, rail operations, engineering, environment, and financial/economic considerations. Some of the more fundamental assumptions are summarised below.
Discipline area
Key assumptions
Land use planning
� Prospective new rail corridors would service existing and future population and employment locations throughout SEQ. Forecast population and job distribution were a key determinant in identifying potential station locations and, thus, likely corridor alignments.
� The Brisbane CBD and core inner city area will remain the paramount destination for future employment and weekday commuter traffic within SEQ.
� Population and employment levels are based on Planning Information and Forecasting Unit (PIFU) 2026 SEQ population forecast of 3.96 million, and a National Institute of Economic and Industry Research (NIEIR) 2026 SEQ employment forecast of 2.08 million total jobs.
� As a general rule, the assumed residential catchment for stations is the area within an 800-m (10-minute) walk, while the employment catchment for stations is the area within a 400-m (5-minute) walk.
Transport planning
� Rail service plans were developed specifically for this project by the rail operations team to match estimated future demand.
� Future transport networks were derived from committed projects included in SEQIPP 2007, including:
� rail extensions to Springfield, Elanora and Caloundra by 2016
� rail extensions to Coolangatta and Maroochydore by 2026
� future road networks (confirmed with Brisbane City Council and Department of Main Roads)
Inner City Rail Capacity Study Pre-Feasibility Report
x
The contents of this report do not represent Queensland Transport or State Government policy
Discipline area
Key assumptions
� A ‘bus-shed’ strategy which encourages feeder bus networks and passenger transfers at outlying rail stations is to be developed in association with TransLink bus network planning.
� All costs are assumed to remain constant in real terms. (Separate sensitivity tests were run for increases in fuel prices).
� The Veitch Lister Consulting (VLC) Zenith model was used. The model area covers all of SEQ.
Rail operations
� All currently committed SEQIPP rail projects are assumed to be in place by the years specified in SEQIPP07.
� Capacity constraints outside the inner city study area, such as the Tennyson Loop and the corridor between Northgate and Bowen Hills, are considered within the analysis.
� The options will use current QR operating paradigms, including current rolling-stock performance characteristics and layout, and meet current Queensland Transport policy which aims to ensure no QR passenger will stand for more than 20 minutes.
� Future new stations in the study area should be designed for nine-car sets.
� The same corridor operations currently used for operating all QR lines through the network has generally been assumed throughout the 20-year master plan period.
� The current principle of segregating the network has been maintained.
� For the purpose of the train capacity analysis, the existing inner city corridor between Roma Street and Bowen Hills has an assumed capacity of 19 trains per hour (tph) on the ‘Mains’ and 23 tph on ‘Suburbans’.
� A general freight curfew for freight traffic will operate during the peak hours (sensitivity tests were conducted).
� The current length intermodal coal and freight services have been assumed (sensitivity test conducted).
� In principle, new infrastructure facilities were restricted to within the study area, as specified in the project brief.
Engineering � Physical engineering constraints involved in the study area that influenced route alignment include: depth of the Brisbane River and tunnel engineering considerations; underground building structures, particularly in the CBD; and existing main sewerage and transport infrastructure services (e.g. North–South Bypass Tunnel and S1 sewer).
� Horizontal curvatures (especially for the new tunnels) were constrained to desirable the minimum of 400-m radius and a limit minimum of 250-m radius.
� For vertical gradients, a desirable maximum gradient of 2% was used.

Inner City Rail Capacity Study Pre-Feasibility Report
xi
The contents of this report do not represent Queensland Transport or State Government policy
Discipline area
Key assumptions
Environment � Options, including above-ground alignments, will avoid significant impact to both natural environment and social/physical environment systems (the exception would be a duplication of the Merivale Bridge and associated tunnel).
� At this early stage of options development and analysis, limited consideration was made regarding climate change and prospective impacts on network capacity and associated engineering requirements.
Rail network concept development findings (Stage 2)
Detailed demand model and rail capacity analysis showed that four new tracks in two new corridors are required to meet the approximate 170% forecast growth in AM peak hour rail capacity demand to 2026 (from 52 trains in 2006 to 141 trains forecast for 2026).
Currently there are approximately 13.5 million passenger trips (all modes, including private transport, walking, cycling and public transport) across the modelled region. Given the predicted growth in population over the coming years, the number of trips is expected to grow significantly, reaching 21.5 million by 2026, as demonstrated in Table ES- 1 below.
Table ES- 1: Total daily passenger trips 2006-2026 (model outputs)
Year All modes All PT QR Citytrain
2006 13,485,302 510,528 235,948
2016 17,892,736 786,766 410,717
2026 21,452,742 1,004,992 615,231
The critical flow for rail capacity planning is peak hour trips towards the CBD, as this is when passenger flow is greatest and most concentrated. Table ES- 2 shows the two hour inbound passenger flows for 2006 and the average flow for the modelled options in 2016 and 2026.
Table ES- 2: AM 2 hour peak inbound boardings
Year/scenario Inbound passenger boarding
2006 44,571
2016 71,746
2026 105,260
Sensitivity testing using the multimodal transport model for increases in fuel prices demonstrated that public transport patronage would increase by about 30% under a scenario where fuel prices increased by 100% in real terms; hence any significant increase in fuel price (e.g. continued fuel price increases associated with peak oil) will result in additional demand for rail rollingstock and network capacity.
Based on the preliminary construction estimates and outputs from the strategic model, preliminary financial and economic analysis of the options was conducted. The aim of the economic analysis at this stage is to differentiate between options and not to create a business case for the project. The findings of the financial and economic assessment indicate an

Inner City Rail Capacity Study Pre-Feasibility Report
xii
The contents of this report do not represent Queensland Transport or State Government policy
estimated overall preliminary project economic NPV of approximately $35 billion. The assessed quantifiable economic impact varies only marginally across options, falling generally between $35.99 billion and $36.63 billion.
Detailed options development and evaluation of alignments which service the inner city and achieve integrated land use, public transport and viable engineering results produced a number of excellent options with limited variability. Viable options were somewhat limited due to a number of constraints, including:
� the relatively small footprint area of Brisbane’s CBD (relative to other major cities)
� the significant impact of the river on crossing points, required tunnel depth and station/land use development opportunities
� rail engineering (vertical and horizontal) alignment standards
� the study area.
The major addition of rail network corridors envisioned in this study is a city-transforming exercise and presents a significant opportunity for Brisbane to become a world class city in its provision of a fully integrated public transport network. The multi-billion dollar investment required to meet forecast rail capacity demand is clearly a challenge but also a tremendous opportunity for Brisbane’s future.
The three recommended options for Stage 3 technical pre-feasibility review (Options 2, 4 and 7) all have one southern corridor approach via a new ‘south’ CBD station and continue north to connect at Bowen Hills, with a second western corridor approach via the inner city and also connecting at Bowen Hills. There are differing alignments for each of these options. All three recommended options include reasonably deep tunnels under the Brisbane River and associated new and reasonably deep underground inner city stations.
Options 2, 4 and 7 are depicted in Figure ES- 3 below.
Figure ES- 3: Options 2, 4 and 7 respectively

Inner City Rail Capacity Study Pre-Feasibility Report
xiii
The contents of this report do not represent Queensland Transport or State Government policy
Although the preferred 3 options are different ‘as a package’, each option has a common corridor at 2016 proceeding from the south through the CBD and via Spring Hill to Bowen Hills. MPB identified that the lack of alternatives for 2016 might prove a risk for the project. In particular there was concern that a potentially cheaper alternative using the current corridor had not been fully investigated, nor had an alternative city underground alignment for a 2016 corridor (as opposed to 2026) that captured prospective land development along the Newstead/Fortitude Valley route.
In order to provide the opportunity to investigate alternatives at 2016, Queensland Transport and the study team agreed that the following additional corridors would be carried forward to the technical pre-feasibility Stage 3 for the 2016 corridor:
� Merivale bridge or tunnel (to use as much of the existing alignment as possible along the Merivale bridge alignment)
� Newstead/Fortitude Valley route (as an alternative to the Spring Hill route) — this option essentially utilises the alignment of Option 3 (which was the fourth highest ranked option of the six evaluated).
2016 options taken forward to technical pre-feasibility including Merivale Bridge/Fortitude Valley alternative are shown in the figure below:

Inner City Rail Capacity Study Pre-Feasibility Report
xiv
The contents of this report do not represent Queensland Transport or State Government policy
Figure ES- 4: All 2016 options taken forward to technical pre-feasibility
In addition to identifying three preferred options, the rail concept development phase raised a number of important considerations, including:

Inner City Rail Capacity Study Pre-Feasibility Report
xv
The contents of this report do not represent Queensland Transport or State Government policy
� Given the scale, cost and timeframe of the infrastructure required, there is a need to find cost-effective lead-up projects to maximise network capacity in advance of this major infrastructure investment.
� Operational solutions and initiatives should also be considered as additional ways to maximise network capacity in advance of this major infrastructure investment — for example, improving passenger loading and dwell time management at stations.
� Transport-oriented development (TOD) sensitivity and low station loadings —The transport modelling work to date forecasts reasonably low station loadings for many of the new identified ICRCS stations compared to existing station patronage. Sensitivity testing of potential improvements and TOD opportunities regarding these low station patronage levels showed significant potential increase in patronage associated with increases in development at and around station precincts.
� Other government studies — A number of government bodies and agency studies are either about to begin, currently under way, or recently completed for transport and land use in the inner city. The MPB team recommends strong integration and ongoing engagement between relevant government studies and the ICRCS study, including bus capacity and the Urban Land Development Authority.
� There is significant potential land value capture around existing and future stations which government should explore as a means of offsetting future inner city rail infrastructure investment.
Technical pre-feasibility findings (Stage 3)
It is important to understand the basis for the ICRCS Stage 3 assessment. The scope and timing of the infrastructure works are based on today’s ‘above’ rail track operational paradigm of train operations, including existing train sizes and system performance characteristics, as per client request. The scope of the infrastructure forecast for ICRCS Stages 2 and 3 over the next 20 years thus relies and is based upon this key assumption of current operational paradigm. In reality, a combination of ‘above’ rail and ‘below’ rail enhancements will lead to overall capacity improvements over the next 20 years.
The scope of the infrastructure presented in Stage 3 could therefore be considered a worst-case scenario for infrastructure requirements to meet forecast patronage demand.
For example, the timing of all projects are based on six-car train set operation and assume no discrete improvement in capacity or reliability as a result of any above rail initiatives such as dwell time improvements at stations. Greater passenger numbers will put more pressure on dwell times. Numerous system improvements could be pursued to reduce dwell times and improve network capacity (station design, rollingstock design, platform management and driver management etc.). For example, there appears to be potential for operational improvements which would improve system capacity.
The timing of required capacity increases, including major cross river projects, will be influenced by the above assumptions.

Inner City Rail Capacity Study Pre-Feasibility Report
xvi
The contents of this report do not represent Queensland Transport or State Government policy
The three short-listed options were all found to be technically feasible based on the desktop pre-feasibility assessment conducted in Stage 3. It is important to note that the objective of Stages 2 and 3 of the ICRCS is not to determine a preferred option or to have carried out sufficient detailed investigations to allow this to occur. As would be expected in a study of this magnitude, city-wide impact and investment determination of a preferred option will require further detailed analysis that is beyond the scope of this current study.
On this basis, the three short-listed options are addressed below.
Some adjustments in alignments and station locations were required in Stage 3 from the initial Stage 2 alignments; most of these adjustments were made to minimise the impacts of constraints (e.g. North–South Bypass Tunnel or the S1 Sewer). However, the basic station locations and number of stations remained unchanged from Stage 2. Table ES- 3 provides a high-level overview of the options.
All estimates for project works between 2008 and 2026 are in 2008 dollars with no allowance for escalation. The lower and upper bound cost estimates quoted for all project works are generally +/- 50% accuracy.
Table ES- 3: Three options overview
Option value or characteristic
Option 2 Option 4 Option 7
1. Option Total Cost (2016 and 2026)*
$10.5 – $13 billion $9.5 - $12 million $9.5 - $12 billion
2. 2016 Option Cost* $5.5 – $7 billion $5.5 – $7 billion $5.5 – $7 billion
3. 2026 Option Cost* $5 – $6 billion $4 – $5 billion $4 – $5 billion
4. Total Approximate Route Length (km – 2016 and 2026)
26km 22km 21.5km
5. 2016 Route Length 10km – Bored length
13.5km - Total length
6. 2026 Route Length 10.5km – Bored length
12.5km – Total length
6.0km – Bored length
8.5km – Total length
5.5km – Bored length
8km – Total length
7. Public transport benefits and integration with BACICS (Bus Access Capacity Inner City Study)
Additional PT/Bus integration points at Toowong and South
Brisbane compared to Options 4 and 7
Additional Rail/Bus connectivity at Roma
Street Station
Additional Rail/Bus connectivity at Roma
Street Station
8. New underground stations en-route in 2016
Park Road, Woolloongabba, CBD 1(Edward St), Spring Hill, Exhibition 2, Bowen Hills (6 stations)
9. New underground stations en-route in 2026
Toowong, West End, South Brisbane, CBD 2
(Queen St), Newstead/Valley, Bowen
Hills (6 stations)
Milton, Roma Street, CBD 2 (Queen Street), Newstead/Valley and
Bowen Hills (5 stations)
Milton, Roma Street, CBD 2 (Central Station),
Brunswick Street and Bowen Hills (5 stations)

Inner City Rail Capacity Study Pre-Feasibility Report
xvii
The contents of this report do not represent Queensland Transport or State Government policy
* All estimates for project works between 2008 and 2026 are in 2008 dollars with no allowance for escalation. The lower and upper bound cost estimates quoted for all project works are generally +/- 50% accuracy.
The most expensive option — Option 2 — is the longest and provides for six additional underground stations in 2026. The ‘cheapest’ option — Option 7 — provides five new stations in 2026. However in 2026, Option 7 provides no new land use development, public transport (PT) opportunities or any new servicing of the rail network into the CBD.
In terms of impact on the built environment, there are many points of impact at all station sites and at the locations where the tunnel systems surface.
The dominant cost impact of all options is the underground stations and it is recommended that the need for each of these stations be carefully considered in subsequent detailed planning. The stations have been sited in response to anticipated land use and/or PT demands.
Further preliminary concept engineering review was undertaken for a Merivale bridge/tunnel option as a potential lower cost cross-river option for 2016. The concept engineering determined a potential option that consisted of a tunnel on the north-side of the river and surface railway on the south-side. The north-side design for the project has identified numerous substantial constraints. Although preliminary findings appear to present a possibly feasible alignment, without detailed survey in all areas on the north-side the design is not a guaranteed solution. The order of magnitude of cost for this option is believed to be $3.5–$4 billion, which is approximately 50% – 67% of the cost of the other major 2016 tunnel options. A key caveat on this option is its inability to provide a major bus–rail interchange node on the south-side of the river (i.e. there is no connection at Woolloongabba as with the other preferred short-listed options). In addition, as outlined in Stage 2, a Merivale bridge duplication option does not have any additional land use development or value capture opportunities.
A technical pre-feasibility assessment has been undertaken for a 2016 tunnel option that travels via a north–south route from the CBD to a proposed Newstead/Fortitude Valley station. The technical pre-feasibility assessment confirmed that the major constraint was at the CBD end of the alignment. The route beyond the CBD through to Newstead/Fortitude Valley appears to be viable, but some more detailed consideration may be required at the CBD, particularly regarding subsurface (building) constraints.
In terms of a 2026 alignment, the Option 2 alignment to Spring Hill is compatible with this Newstead/Fortitude Valley route alignment with a change to the northern section of the CBD route via Spring Hill. A deep skew station would result and this would need to be positioned to avoid particularly tall future building developments (i.e. � 40 storeys).
As a result of transport patronage modelling in Stage 2, a number of proposed stations showed relatively low boarding and alightings. To investigate rail patronage changes at some of these stations, increases in TOD potential (employment and residential population) were estimated for seven station areas. The results of this TOD sensitivity test show reasonably significant increases in daily rail patronage (+5.6%) and slight decreases in bus patronage (-2.1%), with an overall increase in total public transport system patronage of 1.2%; Fortitude Valley, Woolloongabba and Gregory Terrace showed the most positive results in response to the TOD sensitivity test.

Inner City Rail Capacity Study Pre-Feasibility Report
xviii
The contents of this report do not represent Queensland Transport or State Government policy
Network Master Plan
Over the next 20 years, in addition to the two major underground network extensions required and referenced in the section above (Technical Pre-feasibility Findings) there is a significant range of other network projects required over the next 20 year period to meet capacity.
The other network projects are based on two key criteria:
4. the projects required to meet capacity requirements, as determined by demand modelling and rail operations modelling
5. the SEQIPP 2007 plan of rail projects, with approximate timeframes for commissioning.
These general network-wide projects are approximately equal in investment to the inner city projects over this period. The total investment for all SEQ rail network projects is estimated at between $21 billion and $28 billion, which include $10–$14 billion for the two underground inner city projects, a further $1–$2 billion of inner city investment as well as additional, network-wide projects in the ‘outer’ city requiring an additional $8–$12 billion of investment.
Table ES- 4 shows the general investments broken into three time periods:
1. now (2008) to first tunnel commissioning (2015) 2. between the first tunnel (2015) and second tunnel commissioning (2022) 3. the period remaining from the second tunnel (2022) to 2026

Inner City Rail Capacity Study Pre-Feasibility Report
xix
The contents of this report do not represent Queensland Transport or State Government policy
Table ES- 4: Project costing
ALL Projects (excluding Signalling Upgrade Projects) Cost ($ million)
(Capacity Projects plus network extensions) Lower Bound
Upper Bound
Total Inner City : 2008 – 2015 5,860 7,470
Total Approach Corridor Upgrade Projects: 2008 - 2015 830 1,300
Total Outer City : 2008 – 2015 3,670 5,670
Total Inner City: 2016 – 2022 4,000 6,000
Total Approach Corridor Upgrade Projects: 2016 - 2022 10 20
Total Outer City: 2016 – 2022 3,890 5,580
Total Inner City: 2023 – 2026 400 600
Total Approach Corridor Upgrade Projects: 2023 – 2026 510 670
Total Outer City: 2023 – 2026 150 200
Inner City: 2008 – 2026 10,260 14,070
Approach Corridor Upgrades: 2008 – 2026 1,350 1,990
Outer City: 2008 – 2026 7,710 11,550
It is important to note that network expansion projects comprise a significant proportion of the forecast expenditure. Network expansion projects account for $5.2 to $7.3 billion of projects between 2008 and 2020. These projects have been included based on understood timings from SEQIPP 2008.
The top five most expensive network capacity projects (in $ terms) are the following:
1. Darra to Ipswich triple tracking (2020) $800M – $1,000M 2. fourth Track Fairfield to Banoon (2015) $400M - $600M 3. fifth Track between Northgate and Bowen Hills (2015) $350M - $550M 4. Park Road Grade Separation (2010 – 2015) $350M - $400M 5. Corinda Grade Separation (2026) $300M - $400M
Issues and conclusions
This study identified a number of viable options. As would be expected, government will need to take into account many considerations in progressing to the next phase.
The Stage 2 analysis raised a number of important issues, including:
� Scale of the infrastructure required — the need to find cost-effective ‘lead up’ projects to delay this investment is considered to be of critical importance.

Inner City Rail Capacity Study Pre-Feasibility Report
xx
The contents of this report do not represent Queensland Transport or State Government policy
� Time for infrastructure required — operational solutions and initiatives should be considered to delay the timing of the major new corridor(s).
� Cost of infrastructure required — a perceived ‘lower cost’ option for a bridge (or tunnel) adjacent to the Merivale bridge should be further assessed.
� Alternate 2016 alignment — further exploration should be made of an alignment that services Newstead/Fortitude Valley in 2016 (as all three short-listed options do not service Fortitude Valley until 2026).
� TOD opportunities and ‘low station loadings’ — increasing development opportunities at station precincts should be explored.
� Other government studies — there should be strong integration and ongoing engagement between relevant government studies and the ICRCS study, including bus capacity planning and site development planning.
� Financial and economic analysis — the findings of the financial and economic assessment indicate an estimated overall preliminary project NPV of approximately $35 billion. Further refinement and assessment of benefits and costs will be required.
In addition, the scope of the infrastructure forecast for ICRCS over the next 20 years relies and is based upon a key assumption of using the current operational paradigm. In reality, a combination of ‘above’ rail and ‘below’ rail enhancements will lead to overall capacity improvements over the next 20 years (e.g. operational system improvements).
As the project moves forward, there will be a need to determine the viability or business-case justification for investment in underground stations (and corridors), and land value capture and land development opportunity should form part of the investment equation to ensure maximum opportunity for rail patronage and TOD/station land development integration.
As a result of the complete study investigation to date, the MPB team would recommend that Queensland Transport proceed with the next stage of corridor assessment and selection, exploring three corridors for 2016 (A, B and C) and three complementary corridors for 2026 (D, E and F), as outlined in Table ES- 5.

Inner City Rail Capacity Study Pre-Feasibility Report
xxi
The contents of this report do not represent Queensland Transport or State Government policy
Table ES- 5: Recommended corridors for further investigation
Option Name Timing and CorridorDirection
Brief route description Reference to Options comment
A 2016
(north-south)
Park Rd – CBD – Spring Hill – Bowen Hills
The same as 2016 route for Options 2, 4, and 7
B
(via Newstead)
2016
(north-south)
Park Rd – CBD – Newstead – Bowen Hills
Similar to Option 3
C (via Merivale
Bridge/ Tunnel)
2016
(north-south)
Park Rd– Merivale Bridge – Bowen Hills
Lower cost option (Option 10)
D 2026
(east-west)
Toowong – CBD – Newstead – Bowen Hills
Same as Option 2 for 2026
E 2026
(east-west)
Toowong – CBD – Newstead – Bowen Hills
Same as Option 4 for 2026
These are broadly shown in Figure ES- 5 and Figure ES- 6 below.

Inner City Rail Capacity Study Pre-Feasibility Report
xxii
The contents of this report do not represent Queensland Transport or State Government policy
Figure ES- 5: 2016 Options A-B-C

Inner City Rail Capacity Study Pre-Feasibility Report
xxiii
The contents of this report do not represent Queensland Transport or State Government policy
Figure ES- 6: 2026 Options D-E-F

Inner City Rail Capacity Study Pre-Feasibility Report
xxiv
The contents of this report do not represent Queensland Transport or State Government policy
Way forward
There are a number of projects risks to future stages. Some of these include:
� Estimates of patronage and passenger flows, and hence demand for new rail infrastructure, has been based on outputs from the strategic Zenith transport model. While this model has been validated to a high degree on known 2006 data, the accuracy of the model in predicting future years relies heavily on a number of key assumptions about such factors as development, growth, predicting human behaviour etc. If these assumptions fulfilled, then there is the risk that the model may over- or under-predict future train patronage and rail capacity demand.
� There will be a need to determine the viability or business-case justification for investment in underground stations (and corridors); land value capture and land development opportunity should form part of the investment equation to ensure maximum opportunity for rail patronage and TOD/station land development integration.
� There are engineering scope risks associated with the project, some of which are outlined below:
� Built infrastructure constraints — no site investigations were undertaken and no detailed examination of individual building records was undertaken at this pre-feasibility level and there may be as-yet undetermined constraints along the proposed project.
� Extent of station infrastructure — the full built environment constraints can only be accurately mapped after detailed station concept design; this will be undertaken in the next phases of the project.
� Geotechnical mapping has been based on available data and not specifically verified.
� Track arrangements at surface connection points need detailed planning to ensure they can be implemented at the desired locations.
� Construction staging is a risk in terms of timing of the overall project.
� The key operational risk is a drop in service quality, particularly on-time reliability (i.e. punctuality) due to factors such as disruption during construction. Construction of projects throughout the network will need to be managed to minimise disruption to rail services.
� Given the scale of demand and the scale, cost and timeframe to deliver the infrastructure required, it is critically important:
� to find cost-effective ‘lead up’ projects to delay this major investment using a combination of techniques (including operational improvements)
� to achieve the maximum separation between the first and second major corridor infrastructure investments.

Inner City Rail Capacity Study Pre-Feasibility Report
xxv
The contents of this report do not represent Queensland Transport or State Government policy
The scope of works post-ICRCS is generally suggested around the following potential phases with indicative timeframes leading to the first major river crossing project:
� preferred option selection
� optimisation of network master plan
� preferred option detailed planning, reference design, environmental studies, consultation, business case
� land acquisition
� final pre-construction activities
� construction and commissioning.

Inner City Rail Capacity Study Pre-Feasibility Report
1
The contents of this report do not represent Queensland Transport or State Government policy
1. The Inner City Rail Capacity Study
1.1 Purpose The purpose of this study is to develop an “Inner City Rail Masterplan” which will specify the projects, estimated costs, staging and timing for the future development options for Brisbane’s inner city rail network. It is intended that this study will support considerations of State Government in the development of preferred options for the development of the rail network, and for funding in the South East Queensland Infrastructure Plan and Programme (SEQIPP).
1.2 Background
1.2.1 Current rail system
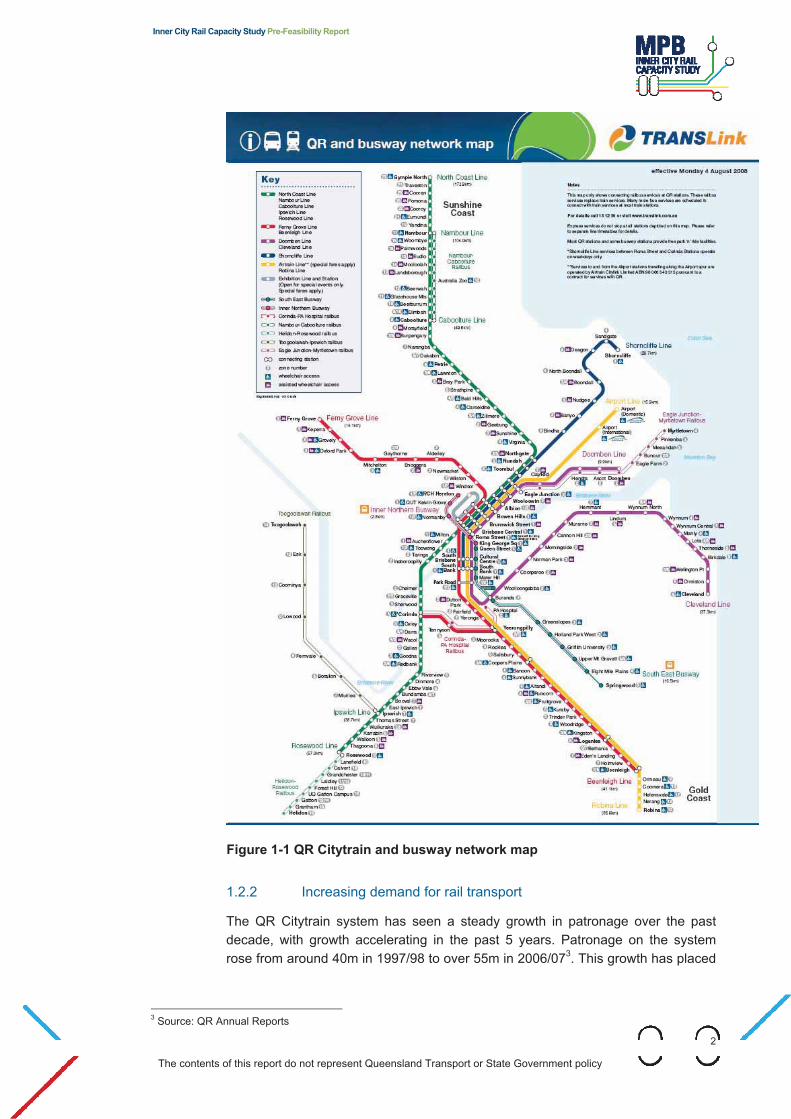
The QR Citytrain suburban network extends approximately 400km from the centre of Brisbane, south to Beenleigh and Robina on the Gold Coast, north to Ferny Grove, Shorncliffe, Caboolture and Gympie, east to Cleveland and west to Ipswich and Rosewood. The network includes 143 stations and plays a key role in supporting the public transport network, with suburban and interurban Citytrain services carrying more than 50 million passengers each year. Refer Figure 1-1.
Generally, passenger rail services in Brisbane are medium to long distance suburban/commuter services, with heavy use during the AM and PM peaks and light use outside the peaks.
Citytrain shares its network with other services including regional and interstate freight and passengers services. Typically 54 freight services and around 10 regional and interstate passenger services operate each day.
Inner City Rail Capacity Study Pre-Feasibility Report
2
The contents of this report do not represent Queensland Transport or State Government policy
Figure 1-1 QR Citytrain and busway network map
1.2.2 Increasing demand for rail transport
The QR Citytrain system has seen a steady growth in patronage over the past decade, with growth accelerating in the past 5 years. Patronage on the system rose from around 40m in 1997/98 to over 55m in 2006/073. This growth has placed
3 Source: QR Annual Reports

Inner City Rail Capacity Study Pre-Feasibility Report
3
The contents of this report do not represent Queensland Transport or State Government policy
pressures on the system and recent QR research shows services on key lines are already officially overcrowded during the peak hours.4
A key challenge for the rail network is to accommodate the anticipated significant growth in passenger demand in south east Queensland over the next 20 years and beyond, while also supporting growth in freight traffic.
Growth in public transport patronage (including rail patronage) is driven by:
� Sustained population growth
� increasing traffic congestion
� improvements of public transport services and infrastructure provision generally (i.e. improved integration and coordination of public transport delivery across all modes)
� rising fuel prices and parking charges
� growing awareness of climate change, as users seek to reduce their contribution to air pollution and greenhouse gas emissions.
In future, these and other factors are expected to continue to increase pressure on the rail system.
1.2.3 Population growth
The population of south-east Queensland (SEQ) is expected to reach around 4 million by the year 2026, an increase of 1.5 million from 2001 and equivalent to over 1,200 people per week5. Significant growth in employment is also expected. As a result, development and building activity will place significant pressure on land availability and property value, and strain established planning and development policy. Urban areas are extending beyond the reach of the current rail network.
Table 1-1: Future employment and population projections, 2016 and 2026 (thousands)6
2006 2016 2026
jobs residents jobs residents jobs residents
CBD 140 8 210 10 260 13
Rest of SEQ 1160 2770 1520 3370 1820 3950
Total 1300 2780 1720 3380 2080 3960
1.2.4 Desired pattern of city growth and the SEQRP
In recent years, increasing housing demand has mainly been met through greenfield outer-fringe developments, with smaller infill developments in the existing metropolitan area. Although house sizes are increasing, household sizes are falling (expected to fall to 2.29 people by 2026), and the number of one and
4 Source: QR Citytrain Patronage Data http://www.citytrain.com.au/about/overview/citytrain_patronage_data.asp 5 Source: OUM. South East Queensland Regional Plan 2005-2026. Amendment 1. Oct 2006 6 Source: Planning Information and Forecasting Unit (PIFU); National Institute of Economic and Industry Research (NIEIR) – previously unpublished data

Inner City Rail Capacity Study Pre-Feasibility Report
4
The contents of this report do not represent Queensland Transport or State Government policy
two person households is increasing (expected to account for around 60% of households by 2026). Many people are choosing a suburban or beach lifestyle, and consequently commute long distances for work, increasing the demand for efficient and effective public transport services and for outer suburban and inter-urban services.
However, the South East Queensland Regional Plan (SEQRP) promotes a system of activity nodes, of which Brisbane CBD would be the largest and most concentrated. The activity nodes are intended to be the foci of economic activity and infill development. This nodal model would encourage increasing use of public transport, particularly of rail and bus.
SEQRP also supports regional growth as infill development in existing areas, and more compact development in new areas, supported by good transit services. New land use development scenarios are likely to be based on transit-oriented development (TOD). Although well established overseas, TOD has received a mixed response in Australia. In SEQ it largely remains at the planning and design stage (e.g. developments at Albion, Milton, Indooroopilly and Varsity Lakes). TOD would place additional pressure on the rail network, particularly at its heaviest loaded locations.
Two key policies from the SEQRP are relevant for the rail capacity study:
� Policy 12.2.1 – Develop a high quality and accessible public transport network linked to regional and sub-regional centres and services, and
� Policy 12.3.1 – Support the preferred sequence and form of development through investment in transport infrastructure and services.
A key challenge for the rail capacity study is to identify how expanded rail capacity may be used to facilitate these desired land use strategies.
1.2.5 Improving public transport
The South East Queensland Regional Plan (SEQRP) sets a strategic policy framework for transport in the region. It emphasises the need for integrating transport, land use and economic activity. Public transport infrastructure and service investment is required to lead and support the desired future urban form. The plan also gives strategic direction in regard to sustainability and environmental protection which impact on transport.
The South East Queensland Integrated Plan and Program (SEQIPP) is a strategic long-term infrastructure plan that supports the SEQRP. It provides direction to State Government agencies, local governments, the private sector and communities on the priorities and timing for major infrastructure investment in SEQ.
Delivery of public transport in SEQ is coordinated by the TransLink Transport Authority.
The TransLink Network Plan (TNP) contains a short term rolling program (2004-05 to 2007-08) and a longer term plan (2004-05 to 2013-14) that aims to guide the development of a better public transport network in SEQ. A key aim of the TNP is

Inner City Rail Capacity Study Pre-Feasibility Report
5
The contents of this report do not represent Queensland Transport or State Government policy
to…make services faster, more frequent and more reliable, particularly during peak periods.
Key rail service and infrastructure upgrades identified by SEQIPP and TNP over the next 20 years include:
� track duplication and triplication on key corridors
� extension of the Gold Coast line to Varsity Lakes (2009-10), Elanora and Coolangatta (by around 2026)
� construction of a new route from the north coast line at Beerwah to Caloundra and Maroochydore (by around 2020)
� construction of a new branch line from the Ipswich line at Darra to Richlands (2011) and Springfield (2015)
� improvements to bus co-ordination and park and ride
� general service frequency improvements.
1.2.6 Peak period rail service forecasts
The end result of the increasing population, expansion of the rail network and subsequent increased patronage demand is a requirement to run additional train services.
Previous capacity studies identified the need to upgrade the inner city rail network by 2016 to cater for increased passenger services.
1.2.7 Constraints to rail service expansion
Currently, the network faces a number of constraints to meeting future rail service level demand. Ability of the network to handle more trains in the inner and near city is limited by:
� line capacity on the two-track Merivale Bridge section
� line capacity generated by multiple tracks merging onto single tracks at Park Road and Milton
� internal operational issues, such as crew changes at Bowen Hills and the need for trains terminating at Roma Street and Bowen Hills to reach Mayne Yard for stabling
� problems in handling large passenger numbers at single platforms at Central, Brunswick Street and Bowen Hills stations, and associated long dwell times at Central
� general congestion at locations such as Park Road, Eagle Junction and Northgate, caused by high numbers of services and exacerbated by a mixture of running times (stopping, express, interurban, freight)
These are illustrated in see Figure 1-2, below.

Inner City Rail Capacity Study Pre-Feasibility Report
6
The contents of this report do not represent Queensland Transport or State Government policy
Figure 1-2: Capacity constraints in the Brisbane inner-city rail network
As the network and demand continue to grow, more rolling stock will be required for peak hour services, more staff will be required for the additional services, particularly train crews; and additional stabling and maintenance facilities will be required to service the future fleet.
1.2.8 Freight
Freight services are expected to double by 2020, and its efficient movement is essential for economic growth. Increasing freight services will increase conflicts with other rail traffic. Operating freight services amongst the peak passenger services would have a severe impact on the passenger operation and would in most cases result in significant additional infrastructure requirements. Infrastructure requirements and impacts on passenger operation depend such elements as the number of services, running times, train lengths and routes.
A key challenge for the inner city rail capacity study is to cater for freight and passenger demand in the future.
1.2.9 Environment
Protection of the environment is one of the policy drivers for determining appropriate network additions to increase inner city rail capacity. The SEQRP includes the principle of providing ‘sustainable travel choices to support the accessibility needs of all members of the community,’ and notes that ‘A high quality public transport network in SEQ will improve environmental outcomes by reducing the number of private motor vehicle trips’ (SEQRP p. 108).
Principles that must be followed during the planning, design and construction of the rail alignments include:
� avoiding any serious or irreversible environmental effects
� minimising pollution
� mitigating effects and planning for rehabilitation of affected areas

Inner City Rail Capacity Study Pre-Feasibility Report
7
The contents of this report do not represent Queensland Transport or State Government policy
� preventing displaced environmental impacts (i.e. making an improvement in one place but causing an effect at another time or place)
� identifying opportunities to advance sustainability
In all areas where there are interfaces between the new infrastructure and the community, precincts and neighbourhoods, excellent design and architecture has the potential to make a desirable feature out of a structure that might otherwise be a blight.
1.2.10 Delivering a quality rail system for Brisbane
Population growth in south east Queensland combined with changes in travel behaviour will result in significant growth in travel demand on key inner city rail routes. To meet this increasing demand and deliver an integrated outcome and “city building opportunity” for Brisbane long term, the rail network must:
� support the desired pattern of city growth — supporting the South East Queensland Regional Plan (SEQRP) intentions, including higher population density in preferred locations through use of techniques such as transit-oriented development (TOD)
� cater for increasing public transport demand resulting from significant population growth and increasing traffic congestion, including impacts from increasing fuel prices and possible climate change responses
� provide an integrated public transport solution, including excellent support for and integration with Brisbane’s bus system and busway network
� provide sufficient capacity through the inner city area to handle demand generated across the entire Citytrain network
� service the city’s key destinations
� support growth of freight services and associated economic activity
� be practicable, including meeting rail operations requirements such as:
� engineering requirements for constructability
� Queensland Rail (QR) system requirements (rollingstock, gradients, curvature, station lengths, etc.)
� Focusing on the suburban rail network requirements while integrating with existing and possible future mass transit networks.
� meet environmental standards for new major infrastructure, including no unacceptable impacts.
In addition, the network development process faces several major constraints:
� the relatively small footprint of Brisbane’s CBD compared to other major cities
� the significant impact of the river on crossing points, required tunnel depth, and station and land use development opportunities
� rail engineering (vertical and horizontal) alignment standards

Inner City Rail Capacity Study Pre-Feasibility Report
8
The contents of this report do not represent Queensland Transport or State Government policy
The ICRCS will need to take all these issues into account in order to deliver the ‘Inner City Rail Masterplan’ for future development of the rail network.
1.3 Study Objectives and Scope
1.3.1 Study objectives
The key objectives of the Inner City Rail Capacity study are to:
� identify a preferred integrated land use and transport strategy for inner city Brisbane supporting the longer term development of the rail network and taking into account desired regional outcomes identified in the South East Queensland region
� identify and assess the options for the future development of the rail network in the inner city, including river crossings(s) to support this network, to address the capacity upgrade requirements for 2026, having regard to the longer term development of the rail network
� have regard to supporting best value integrated transport and land use outcomes for passenger and freight services in the inner city
� provide input to the 2008 update of the South East Queensland Infrastructure Plan and Program (SEQIPP) and supporting strategic plans.
1.3.2 Study area
The study area for this project is the inner city area bounded by Albion, Buranda, Dutton Park and Milton as depicted Figure 1-3 below:

Inner City Rail Capacity Study Pre-Feasibility Report
9
The contents of this report do not represent Queensland Transport or State Government policy
Figure 1-3 - ICRCS Study Area
1.3.3 Scope
The rail network contained in the study area is the hub of the entire Citytrain network and therefore effectively determines the total number of trains that can be run across the network
Inner City Rail Capacity Study Pre-Feasibility Report
10
The contents of this report do not represent Queensland Transport or State Government policy
The primary scope of this study is to investigate rail capacity requirements and upgrades necessary in this central study area to maintain and enhance the capacity of the suburban rail network.

Inner City Rail Capacity Study Pre-Feasibility Report
11
The contents of this report do not represent Queensland Transport or State Government policy
2. Study process
The Inner City Rail Capacity Study (ICRCS) has been undertaken in three stages:
� Stage 1: Strategic framework development
� Stage 2: Rail network concept planning
� Stage 3: Technical pre-feasibility
Queensland Transport engaged Maunsell Parsons Brinckerhoff (MPB) consortium to undertake the ICRCS stages 2 and 3, which is the subject of this report.
2.1 Stage 1 – ICTCS strategic framework development
As part of the Inner City Transport Capacity Study (ICTCS), a separate Stage 1 study engaged a broad range of stakeholders to explore planning solutions at a series of workshops. The Stage 1 study developed a range of concepts and policies for integrated land use and transport strategy for inner Brisbane which to inform the more specialised transport studies including the ICRCS and BACICS. Participants determined that the ICRCS should focus on enhancements to the suburban rail network and not explore the possibility of a future metro system.
The planning horizon used in this process was 2056, rather than the 2026 horizon used in the ICRCS.
2.2 Stage 2 – Rail network concept planning Stage 2 developed and evaluated a number of conceptual rail network options supporting the sustainable development of the inner city rail network and future rail system.
In order to address the broad spectrum of possible solutions an approach was applied that took numerous possible solutions through a ‘funnel’ or sieving process to arrive at the desired ‘preferred 3’ options requested in the brief. Taking this ‘funnel’ approach (see Figure 2-1), the MPB team developed numerous network concepts, used a selection process to choose the ‘preferred 10’ options, refined this list to the ‘preferred 6’ options for detailed assessment, and finally selected the ‘preferred 3’ options for detailed technical pre-feasibility assessment in Stage 3 of the ICRCS.

Inner City Rail Capacity Study Pre-Feasibility Report
12
The contents of this report do not represent Queensland Transport or State Government policy
Figure 2-1: ‘Filter’ project methodology for options development and selection
To develop and assess the options, the MPB team used an integrated multidisciplinary approach involving the disciplines of land use, transport planning, rail operations, engineering, environment, and finance and economics.
In developing, assessing and choosing the proposed inner-city rail solutions, the MPB team used the most up-to-date and industry-recognised tools and data. The complex process included:
� numerous stakeholder and technical team workshops
� sourcing key information from all relevant policies and planning studies
� a multidisciplinary approach to identify background opportunities, constraints and assessment methodologies for land use, transport planning, rail operations, engineering, environmental and financial/economic considerations detailed modelling of future transport and rail demand operational strategies
� multi-criteria analysis for option selection.
An overview of the study process is shown below in Figure 2-2.

Inner City Rail Capacity Study Pre-Feasibility Report
13
The contents of this report do not represent Queensland Transport or State Government policy
Figure 2-2 - Study process flowchart
While all solutions were required to meet high standards in each assessment phase, analytical rigour in the development, refinement and selection of preferred options became progressively more detailed.
2.2.1 Stakeholder engagement
A series of key stakeholder workshops was held to assist in:
� Identifying key objectives
� Developing network concept options
� Identifying and refining evaluation criteria
� Selecting network concept options for further evaluation.
Participants in the workshops included:
� Queensland Transport – Rail Ports and Freight, Integrated Transport Planning
� TransLink (now the Translink Transit Authority)
� Office of Urban Management (now part of Department of Infrastructure and Planning)
� Queensland Rail
� Brisbane City Council.
� Department of Main Roads

Inner City Rail Capacity Study Pre-Feasibility Report
14
The contents of this report do not represent Queensland Transport or State Government policy
� Department of Local Government, Planning, Sport and Recreation (now Department of Infrastructure and Planning)
� Department of State Development (now Department of Infrastructure and Planning)
In addition to the stakeholder workshops, the MPB team held a series of internal workshops and detailed technical meetings to develop, refine and recommend draft preferred options for consideration by the Project Control Group, stakeholders and the Steering Committee.
Further supporting the development of concept options, a number of separate meetings and ‘as required’ communication occurred with various stakeholders (e.g. QR, TransLink) to improve the study analytical understanding and approach, to gain further insight into key challenges, and to improve the options refinement. These meetings and information exchanges occurred with the multidisciplinary technical streams of the study described below.
2.2.2 Multidisciplinary investigations
Disciplines considered critical for this study were land use, transport planning and modelling, rail operations, engineering, environment, and finance/economics. Mandatory evaluation criteria and objectives were established for each discipline and applied when developing and assessing the options. The criteria were both qualitative and quantitative.
2.2.3 Detailed transport modelling
To help determine operating strategies used in the options development, and to provide quantitative data for transport, economic and environmental assessment of options, the MPB team developed a detailed strategic transport model that simulated multimodal transport networks and travel behaviour throughout south-east Queensland. The transport modelling undertook three key tasks:
� calibration and validation for 2006
� forecast demand estimation for 2016 and 2026
� options testing for 2016 and 2026.
2.2.4 Multi-criteria analysis
For both the ’10 to 6 options’ elimination phase and the assessment of ‘6 options’, multi-criteria analysis was applied across the disciplines of land use, transport planning, rail operations, engineering, environment and finance/economics with associated criteria. Chapter 5 explains the purpose and methods used in more detail.

Inner City Rail Capacity Study Pre-Feasibility Report
15
The contents of this report do not represent Queensland Transport or State Government policy
2.3 Stage 3 – Technical pre-feasibility Once the preferred options were identified in Stage 2 a more detailed technical pre-feasibility was conducted in Stage 3. During the Technical Pre-feasibility stage the MPB team:
� assessed the engineering and environmental technical pre-feasibility of the options identified in Stage 2 (the Rail Network Concept Development stage), taking into account:
� tunnel and underground system sizing
� intended rail operational services
� alignment standards
� fire and life safety in tunnels and stations
� rollingstock
� station sizing
� property impacts
� architectural aspirations
� investigated additional issues as requested by Queensland Transport following recommendations made in the Rail Network Concept Development stage
� further investigated “Transit Oriented Development” opportunities and patronage changes at stations that in transport modelling showed low levels of boardings and alightings
� integrated study findings with information from other government studies to determine synergies and compatibility and, where appropriate, to exchange data/information
� recommended a scope of works with indicative timeframes leading to the first major river crossing; this included recommendations for further investigations and refinements.
� determined all rail projects in south-east Queensland for the period 2008–2026 for the Inner City Rail Network Master Plan.

Inner City Rail Capacity Study Pre-Feasibility Report
16
The contents of this report do not represent Queensland Transport or State Government policy
3. Key study assumptions
Outlined below are the key assumptions used in development of the study. This listing is not meant to be exhaustive as inherent in a study of this complexity literally hundreds of assumptions are made.
These key assumptions are broken down into the key areas of land use planning, transport planning, rail operations, engineering, environment, financial/economic and some general considerations.
3.1 Land use planning A first principle in identifying prospective corridors was to service existing and future travel demand. To identify this demand and plan accordingly, the following key assumptions were made.
Table 3-1: Land use assumptions
Topic Assumption
SEQ employment distribution Brisbane CBD and core inner-city area will remain the paramount destination for future employment and weekday commuter traffic within south-east Queensland
Population forecasts As supplied to the study by the Planning Information and Forecasting Unit (PIFU). 2026 SEQ population: 3.96 million
Employment forecasts As supplied to the study by the NIEIR as commissioned by the Brisbane City Council. 2026 SEQ employment total jobs: 2.08 million
Study area Overall, the study area as specified in the project brief was adopted. The strategic planning documents used to guide the land use planning assumptions in this study, including the ICTCS Stage 1 report, indicate a reasonably continuous defined centre within the study area, while identifying major centres outside of the inner city.
Station catchments As a general rule, assumed residential catchment for stations to be a 800m (10 minute) walk, while employment catchment for stations to be 400m (5 minute) walk
3.2 Transport planning and modelling Transport planning included planned network upgrades and public transport services. Transport modelling was conducted for final selected six options for 2016 and 2026. Key input assumptions to the transport model are outlined below.

Inner City Rail Capacity Study Pre-Feasibility Report
17
The contents of this report do not represent Queensland Transport or State Government policy
Table 3-2: Transport planning assumptions
Topic Assumption
Population forecasts As supplied to the study by the Planning Information and Forecasting Unit (PIFU) – same base data set as used in land use assumptions
Employment forecasts As supplied to the study by the NIEIR as commissioned by the Brisbane City Council. – same base data set as used in land use planning
Transport network All committed transport projects included in SEQIPP 2007, including
� rail extensions to Springfield, Elanora and Caloundra by 2016
� rail extensions to Coolangatta and Maroochydore by 2026
� future road networks agreed with Brisbane City Council and Department of Main Roads
Rail service plans Service plans were developed specifically for this project by the rail operations team to match estimated future demand
Bus services A ‘bus-shed’ strategy, which encourages feeder bus networks and transferring at outlying rail stations was developed by TransLink (and BACICS team) in conjunction with the modelling team specifically for this project
Fuel, tolls, parking and other costs All costs assumed to remain constant in real terms. (Separate sensitivity tests were run for increases in fuel prices)
Model and Modelled area The Veitch Lister Consulting (VLC) Zenith model was used. The model area covers all of SEQ (including Toowoomba) and Tweed. Reporting undertaken either for specific stations within study area or for entire model area as appropriate
Model years Base calibration year: 2006
Base case demand estimation years: 2016, 2026
Option testing years: 2016, 2026
3.3 Rail operations Table 3-3: Rail operations assumptions
Topic Assumption
Transport network All currently committed SEQIPP rail projects are assumed to be in place by the years specified in SEQIPP07.
Network considerations Capacity constraints outside the study area, such as the Tennyson Loop and the corridor between Northgate and Bowen Hills, are considered within the analysis.
Rollingstock The current rollingstock performance characteristics and layout, including number of doors and seating, has been assumed
Train size All train numbers have been based on using six-car train sets, as currently operated by QR

Inner City Rail Capacity Study Pre-Feasibility Report
18
The contents of this report do not represent Queensland Transport or State Government policy
Topic Assumption
Train capacity As per current QR operational practices for existing seating and door configurations:
450 seated passengers per 6-car EMU set
432 seated passengers per 6-car IMU set
750 seated plus standing for 6-car EMU and IMU sets
Loading standards Current QT policy of the 20-minute standee rule, which aims to ensure no QR passenger will stand for more than 20 minutes.
Corridor operations The same corridor operations currently used for operating all QR lines through the network has been assumed throughout the 20-year master plan period. The single exception is the southern Beenleigh – Gold Coast line, where the directional running has been changed from ‘up–down, up–down’ to a future ‘up–up, down–down’.
Stopping patterns A mix of express and all-station-stopping has been designed to satisfy passenger demand in service level, travel time and frequency.
Route segregation The current principle of segregating the network has been maintained to further ensure that at-grade crossing conflict between different lines and services can be kept at a minimum.
Track capacity For the purpose of the train capacity analysis the existing inner city corridor between Roma Street and Bowen Hills has an assumed capacity of 19 trains per hour (tph) on the ‘Mains’ and 23 tph on ‘Suburbans’ assuming:
o some minor upgrades to the operation such as platform management and signal layout optimisation.
o removal of flat junction crossings in the inner city, particularly Roma Street and Park Road junctions.
Freight The study uses the same broad assumption as previous capacity studies and assumes that there is a general freight curfew for freight traffic during the peak hours (sensitivity tests were conducted).
The current length intermodal coal and freight services have been assumed. Sensitivity test of 1,500m north-coast services has been conducted.
Coal traffic will increase as analysed in MCCS and the train lengths remain as current due to the layout of the port facilities.
Interstate freight traffic has been considered only where they interact with the narrow gauge network.
Shuttle traffic between Acacia Ridge and Fisherman Islands will remain rather insignificant and will not interfere with the peak traffic.
Regional and interstate operations It is assumed that regional ‘Traveltrain’ services, such as the Sunlander and TiltTrain, will not increase from current levels. The Express Passenger Train (XPT) is assumed to operate outside the peaks.
Stabling Trains from the south and west will be preferably stabled at Mayne Yard and Mayne Yard North, and trains from the north will be stabled at Clapham and somewhere on the western corridor (e.g. Redbank or near Corinda).

Inner City Rail Capacity Study Pre-Feasibility Report
19
The contents of this report do not represent Queensland Transport or State Government policy
3.4 Engineering A key assumption is that the current operational paradigm will be retained — that is, ‘above’ rail operations using existing train sizes and with existing power performance characteristics.
Table 3-4: Engineering assumptions
Topic Assumption
Study area In principle, new infrastructure facilities were restricted to within the study area as specified in the project brief. In practice, engineering constraints (particularly with regards to tunnelling) have meant actual routes extend somewhat beyond the formal study area.
Horizontal curvature Throughout the study the horizontal curvatures (especially for the new tunnels) were constrained to:
� Desirable minimum of 400m radius. To ease TBM tunnelling and minimise future rail wear
� Limit minimum of 250m (still better than QR Standard minimum of 140m) where necessary to achieve objectives of station locations etc. This value limiting the types of capable tunnel boring machine. (Note that Option-7 had to resort to a 225m radius to achieve its station location objectives.)
Vertical gradient For vertical gradients, a desirable maximum gradient of 2% (after compensation for horizontal radius effects) was applied. Note that for the purposes of option development, vertical gradients of up to 2.2% and 2.5% were used, but for engineering and cost estimating of the selected options, Stage 3 applied the 2% compensated limit to all.
Station Design Station design assumptions included:
� 250-metre long station construction to enable platforms for nine car train lengths
� platform widths of about 12m with 15m track centres at island platforms
� island platforms used as preferred arrangement for underground stations
� straight platforms
� platforms of sufficient width to allow free passenger movements
Tunnel type(s) and size � Main runs of plain tunnel based on twin tunnels with single track in each tunnel and cross-passages at intervals for fire and life safety considerations
� Tunnel size assumed as a (generous) 7m internal diameter. The prospective new tunnels are assumed to avoid (by desirably one diameter, 7.5m) the existing major underground infrastructure including NSBT, S1 sewer and the like.

Inner City Rail Capacity Study Pre-Feasibility Report
20
The contents of this report do not represent Queensland Transport or State Government policy
Topic Assumption
Current operational characteristics and engineering impacts
A key assumption is that the current operational paradigm will be retained — that is, ‘above’ rail operations using existing train sizes and with existing power performance characteristics. In reality, a combination of improved more powerful train configurations for the ‘above’ rail, coupled with ‘below’ rail enhancements such as non-ballasted tracks, will lead to:
� ability to apply more aggressive gradient designs that could shorten lengths of construction works
� improvements of overall capacity (in terms of passenger-per-hour throughput) on the system over the next 20 years.
3.5 Environment Table 3-5: Environment assumptions and general principles
Topic Assumption
General principles � Avoid significant impact to both natural environment and social/physical environment systems:
� Aim to avoid ’above ground alignments’ into the CBD which had very significant impacts on existing built form, natural ecosystems or parks (the exception would be a duplication of the Merivale Bridge and associated tunnel.)
Noise Noise intrusion due to new surface corridors not to be included as the options (in the form assumed for this step of the assessment) did not include any new surface corridors.
Climate Change At this early stage of options development and analysis, limited consideration was made regarding climate change and prospective impacts on network capacity additions and associated engineering requirements (however, the next stage of detailed concept design will need to consider possible climate change impacts on such matters as infrastructure longevity).
3.6 Finance/Economic analysis The key assumptions for the financial and economic analysis are shown in Table 3-6 below.
Note that many of the assumptions underlying the financial analysis (particularly those underlying the calculation of operating expenses) are based on estimates previously calculated for underground rail projects undertaken elsewhere in Australia.

Inner City Rail Capacity Study Pre-Feasibility Report
21
The contents of this report do not represent Queensland Transport or State Government policy
Table 3-6: Financial and economic assumptions
Topic Assumption
Purpose The financial and economic analysis in this stage was designed to support options evaluation (comparison) and not to develop a business case for the project
Evaluation period From the beginning of construction (which varies among the different options) to 2041, permitting all debt to be repaid.
Inflation 2.5% per annum (applied to revenues and costs)
Capital cost escalation 4%
Capital years For all options, capital expenditure would occur in two phases prior to the commissioning of new rail networks in both 2016 and 2026. The timing of capital expenditure is determined by the length of time to construct. The cost is spread over those years.
Modelled patronage years 2016, 2026 (as per strategic transport model outputs)
Patronage calculation, non model years Interpolated results for years between 2006–2016 and 2016–2026 applying a constant growth rate (4%)
constant growth rate for 2026–2041, 2% for the options, and 0.5% for the constrained network case
Rollingstock Purchase year before required
testing and commissioning costs: 25% of annual cost
Debt facilities: construction used to finance construction costs prior to commissioning in 2016 or 2026; not subject to repayments and the interest is capitalised into the value of the debt and asset each year
Debt facilities: operational drawn down in the first year of operation (either 2016 and 2026) to fully repay the construction debt facility, then subject to principal and interest payments that amortise the balance of the initial drawdown over 15 years
Interest on debt 6% (no other fees)
Limits of assessment The financial and economic analysis produced a broad economic and financial assessment of options to aid the development and comparison of options. The analysis did not intend to nor did it produce a business case analysis for consideration of the “project evaluation” by treasury.

Inner City Rail Capacity Study Pre-Feasibility Report
22
The contents of this report do not represent Queensland Transport or State Government policy
4. Rail network concept planning
The rail network concept planning phase is a process to identify the requirements and evaluate the options to upgrade inner city rail capacity having regard to the forecast demand for travel, the capacity of the network to handle trains, the constraints faced by the built environment, and various additional land use, transport planning, engineering, environmental and economic considerations.
4.1 Key planning tasks The following tasks were performed in the planning of network concepts:
� Development of rail operational strategies
� Development of conceptual rail network options to support the operational strategies
� Development of an evaluation framework reflecting a “best practice” approach for this assessment
� Prioritising the options based on their performance as assessed by the evaluation framework.

Inner City Rail Capacity Study Pre-Feasibility Report
23
The contents of this report do not represent Queensland Transport or State Government policy
4.2 Concept generation process overview This concept planning process is broadly shown in the following flowchart:
This process is briefly described in Table 4-1 below.
Table 4-1: Concept Generation Process
Topic Process
Conduct background analysis and determine principles for concept/option development
� Previous relevant studies were reviewed.
� Background information was analysed, and principles developed for land use, transport planning, rail operations, engineering, and environmental issues to be used when identifying possible network concepts.
� Reasonably detailed assessments were conducted across all disciplines to inform options development as well as rail corridor capacity needs/requirements.
Determine evaluation criteria
� Study objectives were confirmed and evaluation criteria identified with stakeholders for options development, evaluation and selection of preferred options.
� Principles and criteria were outlined for land use, transport planning, engineering, rail operations and environmental elements, to be applied in the concept generation process.
Develop concepts
� Detailed consultant team and stakeholder/PCG workshops generated a broad range of potential concepts.
� Concept options were developed using the ‘principles for options development’ established during the background analysis process

Inner City Rail Capacity Study Pre-Feasibility Report
24
The contents of this report do not represent Queensland Transport or State Government policy
Topic Process
Select preferred 10 options
� Using the adopted objectives and mandatory evaluation criteria, the team evaluated and selected ’10 options’ for further evaluation from the long list of possible network concepts.
Conduct base case transport modelling and assess rail capacity
� A transport model was developed for 2006, 2016 and 2026, with multimodal modelling used to determine an initial patronage ‘demand estimation’ case and ‘constrained’ base cases for 2016 and 2026, and for detailed evaluation of the ‘preferred 6’ options. Modelling required detailed input for land use (population and jobs), infrastructure and service upgrades and rail operational service plans.
� Rail capacity requirements were determined/confirmed using the ‘demand estimation’ case in 2016 and 2026.
� Rail network capacity requirements were confirmed for option development.
� A ‘constrained network’ transport modelling case was developed for ‘6 options’ comparison and to assist financial/economic evaluation
� Determine rail operational requirements to support demand
� Determine infrastructure requirements to support rail operations
Select preferred 6 options
� Detailed evaluation across all disciplines were conducted using qualitative and quantitative criteria and workshops held with key stakeholders to confirm preferred options
Select preferred 3 options
� Detailed evaluation across all disciplines were conducted using refined qualitative and quantitative criteria including detailed results of transport modelling outputs
� Workshops held with the key stakeholders to confirm preferred options and issues arising
The following considerations were used in guiding concept planning:
� provide additional network capacity to allow more trains and passengers to and through the inner city
� create a seamless integrated public transport network where new major network additions integrate with existing rail and current and future busway upgrades
� improve coverage to areas currently poorly served by public transport, such as Spring Hill and southern CBD
� connect to inner city areas with significant redevelopment potential, such as Milton, South Brisbane, Woolloongabba and Fortitude Valley
� integrate and improving public transport connectivity at existing rail and busway stations such as Bowen Hills, Park Road, Milton, Woolloongabba, South Brisbane and Central station

Inner City Rail Capacity Study Pre-Feasibility Report
25
The contents of this report do not represent Queensland Transport or State Government policy
� efficient scheduling of services
� provide quality rail infrastructure such as upgraded design, amenity and visual form of rail stations to match the quality of busway stations and ferry terminals
4.3 Concept generation – objectives, techniques and tools
4.3.1 Objectives and criteria for concept generation
Generation and evaluation of network concept options was driven by a multidisciplinary team. Potential network concepts were required to achieve key objectives:
� land use — integrates with and stimulates preferred land use development (as per the SEQRP and the LGMS for Brisbane City Council)
� transport planning — supports future ultimate general transport and public transport system, and does not preclude further public transport expansion
� rail operations — solves the currently identified network constraints and meets identified future rail demand (passenger and freight)
� engineering — is constructible; causes no unacceptable disruption of existing network; meets minimum rail engineering requirements (route curvature, platform lengths and passenger safety).
4.3.1.1 Land use
To ensure efficient, sustainable growth of rail patronage new station locations should service public and private facilities that are trip-generating uses. Important use types include:
� office and commercial activities
� significant residential locations
� retail nodes
� education facilities (e.g. tertiary facilities, major secondary education facilities)
� health facilities (e.g. hospitals)
� entertainment precincts (e.g. major retail areas)
� sporting facilities (e.g. stadiums)
� recreational facilities (e.g. major public parks and public outdoor/open space areas).
A map showing some of the key trip attractors is shown in Figure 4-1 below.

Inner City Rail Capacity Study Pre-Feasibility Report
26
The contents of this report do not represent Queensland Transport or State Government policy
Figure 4-1: Map of city attractors
The process for identifying preferred station locations from a land use perspective included:
� Information relevant to determining future land use planning and development trends in and around the study area were summarised and collated. These included identified areas of development opportunity expected to experience significant changes to land uses and/or development intensity, either through

Inner City Rail Capacity Study Pre-Feasibility Report
27
The contents of this report do not represent Queensland Transport or State Government policy
formalised master planning processes, market-driven redevelopment, or strategic planning amendments to preferred land uses.
� Current preferred development areas identified in the SEQRP and the Brisbane Council LGMS
� Currently forecast development areas including 2016 and 2026 demographic jobs and residential forecasts by collector districts
� Other sites with potential above and beyond current official forecasts
� Ability to develop Transit Oriented Development (TOD) sites with 18 hours of activity as key possible station locations
� Demographic forecast data analysed to determine the existing and forecast density demonstrated a continuation of a defined inner city business centre within the study area.
� Forecast land use data established a number of prospective station locations in a number of defined centres in the extended CBD precinct (such as Spring Hill, South Brisbane and Bowen Hills).
� In conjunction with the selection of corridor alignments, the initial land use investigations identified nominal station locations as a result of the land use analysis of attractors and development opportunities. From these nominal locations, the study undertook to determine the approximate station catchments using a 400 m and 800 m radius measurement, including assessments of walkable catchment areas.
� Urban design and consideration of public space improvements formed part consideration including exact station location, immediate land development opportunity, and portal locations for station entrances.
4.3.1.2 Transport planning
Overall principles for public transport connectivity used in the development of concept options included:
� integration and connection of all public transport networks and services, rail to rail and bus to rail
� integration of public transport interchanges with urban development through design and multiple use e.g. transit oriented development and mixed use development
� enhancement of pedestrian connectivity to stations
� potential short and long term impacts on road and street networks
� avoid duplicating existing major public transport services
4.3.1.3 Rail operations
A fundamental objective of the concept development was to meet future rail demand, alleviating current network capacity constraints wherever possible. Service plans from previous capacity studies were utilised to conduct a high-level analysis of possible sectorisation concepts and the benefits of each. This took into

Inner City Rail Capacity Study Pre-Feasibility Report
28
The contents of this report do not represent Queensland Transport or State Government policy
account the assumed current corridor capacity and operational paradigms. For evaluation purposes, a high-level strategic analysis was conducted including:
� Future demand – each option must to cater for future patronage demand, and associated service levels through the Inner City
� Capacity constraints – each option must alleviate capacity constraints
� Service type - the system needs to cater for passenger, freight (coal, bulk and intermodal), interstate (such as the XPT) and intrastate services (such as Travel Trains)
� Role of Heavy Rail - the new route should carry large numbers of people from outer Brisbane to the CBD, and to a lesser extent distribute people across the CBD
� Operational efficiency - the new routes and layout arrangements should be as efficient as possible. This requires optimal train loadings, avoiding empty runs, enabling second peak runs and a consistent operation between current, 2016 operations and 2026 operations
� Stabling facilities - stabling should be in an optimal location and, for example, should have few or no crossing conflicts and preferably minimise empty running
� Timetable connections - timetabled connections should address issues such as connecting Airport and Gold Coast services as is current policy, as well as connecting services to ensure the most appropriate rollingstock is used
� Interchange and travel opportunities - commuters should be able to get to any destination by a maximum of two transfers of any model type and therefore optimally only one rail transfer should be required.
� Freight - expected to double by 2020, and its efficient movement is essential for economic growth. Increasing freight services will increase conflicts with other rail traffic. Operating freight services amongst the peak passenger services would have a severe impact on the passenger operation and would in most cases result in significant additional infrastructure requirements. Infrastructure requirements and impacts on the passenger operation depend on the number of services, running times, consists and routes. A freight curfew during peak hours would reduce the need for more infrastructure but could have a negative economic effect. Longer freight trains are possible, but not for coal due to the layout of port facilities.
A combination of rail operational modelling techniques were applied throughout the study, including:
� Parametric techniques to calculate capacity throughput, interchanges, service numbers and more
� Static operational modelling using RailSys to timetable the operations, identifying the capacity bottlenecks, determining solutions, assessing operational alternatives
� Use of Systemwide’s Train Load PredictorTM to determine the affect on passengers and to quantify train loadings

Inner City Rail Capacity Study Pre-Feasibility Report
29
The contents of this report do not represent Queensland Transport or State Government policy
� Dynamic operational simulation using RailSys to illustrate the dynamic affects of dual platforms, dwell times and signalling headways in the inner city7
� Operational process modelling using Planimate to determine the freight capacity through the network, particularly the inner city
� Previous studies (e.g. the Metropolitan Rail Network Capacity Study and the Rail Service and Infrastructure Requirements Study), recommendations and operational ideas
4.3.1.4 Engineering
The engineering analysis for the concept development phase of the study focused primarily on civil, alignment and station layout aspects. The engineering was performed with attention to the probable needs of subjects such as rolling-stock, fire and life safety, traction power, signalling.
Engineering design has been guided by the basic assumption that standard QR practices will continue to apply. Therefore, the underground system has been developed for existing QR passenger rolling stock and allowance has been made for possible future use of wider body vehicles. Within the inner city area, it has been assumed that all trains including outer-suburban express services will stop at all underground stations.
The engineering discipline utilized aerial photography mapping, AutoCADTM and 12D SolutionsTM software to prepare horizontal alignments and vertical profiles for options assessed during the study. This software was interfaced either directly or with manual inputs to take account of relevant features as:
� major utilities and constraints such as S1 Sewer, NSBT using GIS mapping with representation in the 12D profiles8
� geotechnical mapping and records to identify likely ground conditions for construction of tunnels and stations; thus indication construction methods and costs.
Specific engineering standards that have been applied are summarized in Table 4-2.
Table 4-2: Engineering standards
Topic Standard adopted
Horizontal curvature Desirable minimum of 400m radius
Minimum limit of 250m radius
Vertical gradient desirable maximum gradient of 2% after compensation for horizontal radius effects (minimum standard of 2.2% and up to 2.5% if relatively short section)
Station design - capacity up to 40,000 pax in the AM peak (greater than the current Central station utilization).
7 Dynamic simulation has not been conducted to determine the maximal inner city throughput of the current system, which would be recommended. 8 Built constraint data for NSBT obtained from NSBT team, S1 sewer data obtained from BCC bimap GIS data

Inner City Rail Capacity Study Pre-Feasibility Report
30
The contents of this report do not represent Queensland Transport or State Government policy
Topic Standard adopted
Station design – platforms length 250m (9 car)
Station design – platform width platform widths of about 12m with 15m track centres at island platforms
Station design – platform type island
single platform face
Station design – platform curvature nil (straight platform)
Tunnels - type Plain tunnel based on twin tunnels with single track in each tunnel and cross-passages at intervals for fire and life safety considerations
Tunnel size 7m internal diameter
Clearance to other works Avoid (by desirably one diameter, 7.5m) the existing major underground infrastructure including NSBT, S1 sewer etc.
All tunnelled river crossings assumed to be deep tunnel
Design speed 60 km/h desirable minimum
Additionally there were a number of physical engineering constraints involved in the study area influencing route alignment including:
� Depth of the Brisbane River and tunnel engineering considerations
� Underground building structures
� Existing main sewage and transport infrastructure services (eg North-South Bypass Tunnel or S1 sewer).
An example of constraints on route alignment due to rail engineering are shown below in Figure 4-2
Figure 4-2: Vertical constraints due to Brisbane River
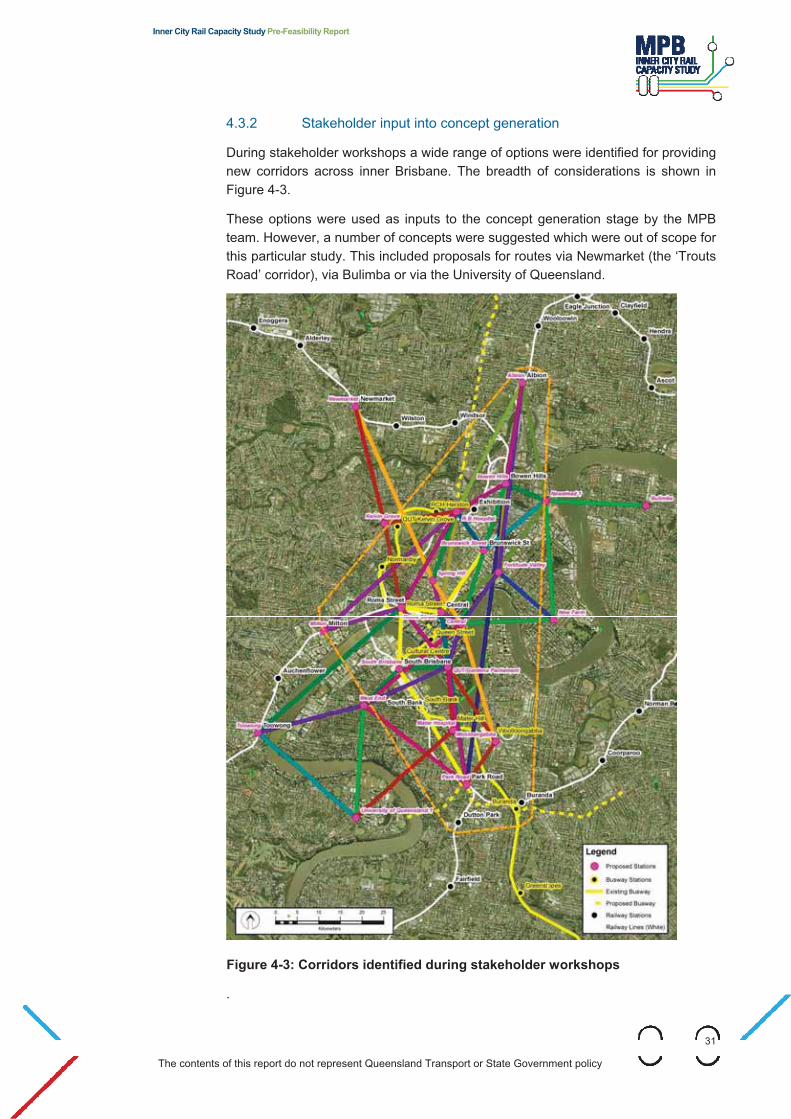
Inner City Rail Capacity Study Pre-Feasibility Report
31
The contents of this report do not represent Queensland Transport or State Government policy
4.3.2 Stakeholder input into concept generation
During stakeholder workshops a wide range of options were identified for providing new corridors across inner Brisbane. The breadth of considerations is shown in Figure 4-3.
These options were used as inputs to the concept generation stage by the MPB team. However, a number of concepts were suggested which were out of scope for this particular study. This included proposals for routes via Newmarket (the ‘Trouts Road’ corridor), via Bulimba or via the University of Queensland.
Figure 4-3: Corridors identified during stakeholder workshops
.

Inner City Rail Capacity Study Pre-Feasibility Report
32
The contents of this report do not represent Queensland Transport or State Government policy
4.4 Future demand estimation and capacity requirements
Critical to the ICRCS is an understanding of future demand for rail services.
Detailed transport modelling was used to inform rail patronage demand, rail operations and rail capacity network constraints and timing of upgrade requirements. Figure 4-4 below outlines the general process used in this assessment.
The following sections outline the process for derivation of demand estimates, rail operations and network capacity constrained assessments.
Figure 4-4: Transport modelling, patronage estimation and rail capacity assessment flowchart
4.4.1 Demand-based future year patronage projections
The transport system for SEQ was modelled using the ‘Zenith’ strategic transport model.
Developed by Veitch Lister Consulting Pty Ltd (VLC), this is a conventional four-step transport model that simulates travel behaviour and both private and public transport networks throughout south-east Queensland. Geographically, it covers a core modelled area and a buffer area. The core modelled area covers essentially all of South-East Queensland, and reaches from Gympie in the north to Tweed in the south and west to Toowoomba.
The outputs from the strategic transport model were able to shed light on a number of important characteristics and trends in the passenger transport task for SEQ today and into the future, each of which is addressed below.
4.4.1.1 Importance of study area to SEQ transport task
Public transport is critical to the effective functioning of the Brisbane city. On an average day in 2006 approximately 300,000 persons arrived or departed the inner

Inner City Rail Capacity Study Pre-Feasibility Report
33
The contents of this report do not represent Queensland Transport or State Government policy
city area by public transport. The transport model indicates that by 2026 the total is expected to double to over 600,000 persons per day.
At the same time, the inner city region represents a major part of the overall travel market for public transport in SEQ. Currently around 60% of all public transport trips either commence or terminate in the inner city area. Nearly two-thirds of these trips are destined for the CBD itself. This proportion destined for the CBD is likely to rise over the next twenty years while without further intervention the proportion headed for the city fringe (e.g. Spring Hill, South Brisbane) is likely to fall slightly.
4.4.1.2 Growth in daily travel demand
Currently there are approximately 13.5 million passenger trips (all modes, including private transport, walking, cycling and public transport) across the modelled region. Given the predicted growth in population over the coming years, the number of trips is expected to grow significantly, reaching 21.5 million by 2026 (see Table 4-3, below).
Table 4-3: Total daily passenger trips 2006-2026 (model outputs)
Year All Modes All PT QR Citytrain
2006 13,485,302 510,528 235,948
2016 17,892,736 786,766 410,717
2026 21,452,742 1,004,992 615,231
Public transport currently undertakes a relatively small percentage of trips across South East Queensland. The model estimates this as being only 3.9% of trips in 20069. Public transport will be expected to increase its role in the future. The mode share should rise to 4.5% of all trips by 2016 and again to 4.8% by 2026 in the base case (which assumes no new rail stations in the inner city).
Although the mode share figures remain small in absolute terms, the increase in actual trips associated is large. Figure 4-5 shows the estimated compound annual growth rates for transport by all modes, by public transport and by QR Citytrain. It can be seen that although all trips will grow by an average of 2.3% per annum between 2006 and 2026, the number of rail trips will grow by nearly 5% per annum over the same period.
The critical flow for rail capacity planning is peak hour trips towards the CBD, as this is when passenger flow is greatest and most concentrated. Table 4-4 shows the two hour inbound passenger flows for 2006 and the average flow for the modelled options in 2016 and 2026.
9 This applies to the entire model region.

Inner City Rail Capacity Study Pre-Feasibility Report
34
The contents of this report do not represent Queensland Transport or State Government policy
Table 4-4: AM 2 hour peak inbound boardings
Year/scenario Inbound passenger boarding
2006 44,571
2016 71,746
2026 105,260
Figure 4-5: Compound Annual Growth Rate, by mode, all trips all day
4.4.1.3 Growth in peak hour rail demand
Peak hour demand will continue to grow in line with daily demand growth. By 2026 over 100,000 passengers are expected to board inbound trains in the morning two-hour peak (see Figure 4-6).

Inner City Rail Capacity Study Pre-Feasibility Report
35
The contents of this report do not represent Queensland Transport or State Government policy
Figure 4-6: Forecast Citytrain boardings, suburban stations, inbound, 2 hour AM peak, 2006, 2016, 2026
4.4.2 Rail operations and timing of capacity requirements
Previous rail capacity studies had identified that demand for travel on the QR Citytrain network would continue to grow over the next decades. As a starting point, the medium growth estimates from these studies were used and appropriate service plans developed that would, in theory, provide sufficient capacity on the network to deliver services that met the demand at a level compliant with QR loading standards (notably the requirement that passengers should not be required to stand for more than 20 minutes).
These service plans provided a “demand estimation base case” for transport modelling in 2016 and 2026.
It was found that the increased services in turn generated additional patronage at a level that contravened loading standards in some areas, and provided excess capacity in other areas.
With these outputs, the service plans were then revised (using Systemwide’s Train Load Predictor) to more closely match the demand predicted by the model.
4.4.2.1 Key findings, 2016
For 2016 the following was identified:
� Significant increase in the model patronage figures compared to the patronage figures used in previous studies, notably Ferny Grove, Caboolture/North Coast and Ipswich lines.
� One new two-track corridor required to service the Gold Coast/Beenleigh and Cleveland lines by 2016 (Figure 4-7)

Inner City Rail Capacity Study Pre-Feasibility Report
36
The contents of this report do not represent Queensland Transport or State Government policy
Figure 4-7: Recommended am peak period rail service patterns for 2016
4.4.2.2 Key findings, 2026
For 2026 the following was identified:
� Gold coast line demand continues to rise above initial assumed figures
� Overall patronage is lower than the MRNCS assumptions
� Demand for travel from Northern corridor lower than previously predicted.
� However a second new corridor connecting the Northern corridor to Southern and/or Western Corridor is still required by around 2026 (Figure 4-8).
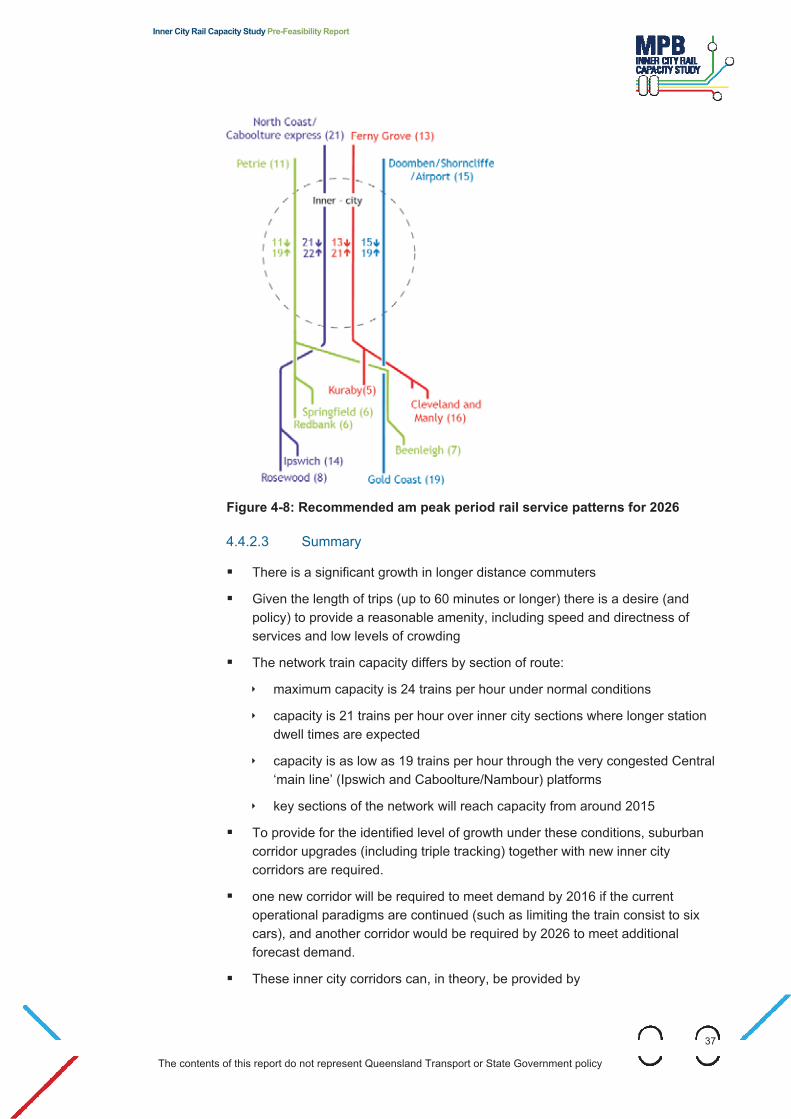
Inner City Rail Capacity Study Pre-Feasibility Report
37
The contents of this report do not represent Queensland Transport or State Government policy
Figure 4-8: Recommended am peak period rail service patterns for 2026
4.4.2.3 Summary
� There is a significant growth in longer distance commuters
� Given the length of trips (up to 60 minutes or longer) there is a desire (and policy) to provide a reasonable amenity, including speed and directness of services and low levels of crowding
� The network train capacity differs by section of route:
� maximum capacity is 24 trains per hour under normal conditions
� capacity is 21 trains per hour over inner city sections where longer station dwell times are expected
� capacity is as low as 19 trains per hour through the very congested Central ‘main line’ (Ipswich and Caboolture/Nambour) platforms
� key sections of the network will reach capacity from around 2015
� To provide for the identified level of growth under these conditions, suburban corridor upgrades (including triple tracking) together with new inner city corridors are required.
� one new corridor will be required to meet demand by 2016 if the current operational paradigms are continued (such as limiting the train consist to six cars), and another corridor would be required by 2026 to meet additional forecast demand.
� These inner city corridors can, in theory, be provided by
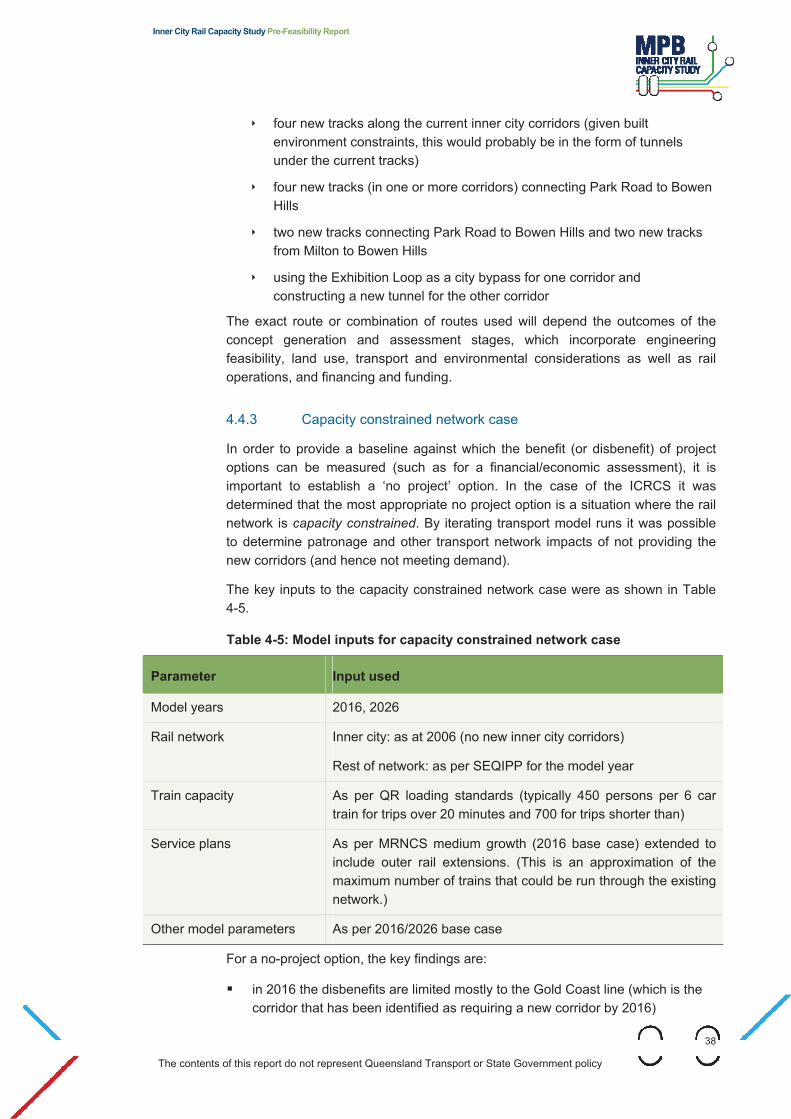
Inner City Rail Capacity Study Pre-Feasibility Report
38
The contents of this report do not represent Queensland Transport or State Government policy
� four new tracks along the current inner city corridors (given built environment constraints, this would probably be in the form of tunnels under the current tracks)
� four new tracks (in one or more corridors) connecting Park Road to Bowen Hills
� two new tracks connecting Park Road to Bowen Hills and two new tracks from Milton to Bowen Hills
� using the Exhibition Loop as a city bypass for one corridor and constructing a new tunnel for the other corridor
The exact route or combination of routes used will depend the outcomes of the concept generation and assessment stages, which incorporate engineering feasibility, land use, transport and environmental considerations as well as rail operations, and financing and funding.
4.4.3 Capacity constrained network case
In order to provide a baseline against which the benefit (or disbenefit) of project options can be measured (such as for a financial/economic assessment), it is important to establish a ‘no project’ option. In the case of the ICRCS it was determined that the most appropriate no project option is a situation where the rail network is capacity constrained. By iterating transport model runs it was possible to determine patronage and other transport network impacts of not providing the new corridors (and hence not meeting demand).
The key inputs to the capacity constrained network case were as shown in Table 4-5.
Table 4-5: Model inputs for capacity constrained network case
Parameter Input used
Model years 2016, 2026
Rail network Inner city: as at 2006 (no new inner city corridors)
Rest of network: as per SEQIPP for the model year
Train capacity As per QR loading standards (typically 450 persons per 6 car train for trips over 20 minutes and 700 for trips shorter than)
Service plans As per MRNCS medium growth (2016 base case) extended to include outer rail extensions. (This is an approximation of the maximum number of trains that could be run through the existing network.)
Other model parameters As per 2016/2026 base case
For a no-project option, the key findings are:
� in 2016 the disbenefits are limited mostly to the Gold Coast line (which is the corridor that has been identified as requiring a new corridor by 2016)

Inner City Rail Capacity Study Pre-Feasibility Report
39
The contents of this report do not represent Queensland Transport or State Government policy
� by 2026 the disbenefits are seen network-wide as growth in travel demand outstrips the capacity of the network on most corridors
� by 2026, faced with trains at capacity at their nearest station will travel some distance to find the next station with available capacity. This may be caused by serious congestion on the road network at that time.
These model outputs are used in later transport and financial assessment of various project options.
4.5 SEQIPP 2008 input design A specific output of the study was input into the development of the 2008 update of SEQIPP. This was required relatively early in the project.
For this particular output MPB was given a tunnel route (a single cross-city corridor from Woolloongabba to Bowen Hills) by Queensland Transport.
Based on this concept and using the limited information available at the early stage of the project, MPB developed a basic engineering concept design and costed the design on unit cost.
Following review by an independent third party, the construction cost (approximately $7 billion) was included in SEQIPP 2008.
Various components of this design have been incorporated into the options that were ultimately developed for the study.
4.6 Options evaluation This this section describes the evaluation of the preferred 10 options and the eventual selection of the preferred six and the shortlisted three options.
4.6.1 Preferred 10 options
From the original large number of options (over 70) the MPB team and the PCG distilled a set of 10 options that met (at a conceptual level) mandatory key criteria identified across the disciplines (see Table 4-6 below). These options were then carried forward to the formal options evaluation phase.

Inner City Rail Capacity Study Pre-Feasibility Report
40
The contents of this report do not represent Queensland Transport or State Government policy
Table 4-6: Objectives and mandatory evaluation criteria
Discipline Objectives and mandatory evaluation criteria
Land Use Integrates with and stimulates preferred land use development (as per SEQRP and LGMS for City of Brisbane).
Transport Supports future ultimate general transport and PT system, and does not preclude further PT expansion.
Rail Operations Solves the currently identified network constraints.
Meets identified future rail demand (passenger and freight).
Engineering Constructible.
No unacceptable disruption of existing network.
Meets minimum rail engineering requirements (route curvature, platform lengths, and passenger safety).
Environment No unacceptable negative environmental impacts.
These 10 preferred options are illustrated below.

Inner City Rail Capacity Study Pre-Feasibility Report
41
The contents of this report do not represent Queensland Transport or State Government policy
Figure 4-9: Option 1
Figure 4-10: Option 2

Inner City Rail Capacity Study Pre-Feasibility Report
42
The contents of this report do not represent Queensland Transport or State Government policy
Figure 4-11: Option 3
Figure 4-12: Option 4

Inner City Rail Capacity Study Pre-Feasibility Report
43
The contents of this report do not represent Queensland Transport or State Government policy
Figure 4-13: Option 5
Figure 4-14: Option 6

Inner City Rail Capacity Study Pre-Feasibility Report
44
The contents of this report do not represent Queensland Transport or State Government policy
Figure 4-15: Option 7
Figure 4-16: Option 8

Inner City Rail Capacity Study Pre-Feasibility Report
45
The contents of this report do not represent Queensland Transport or State Government policy
Figure 4-17: Option 9
Figure 4-18: Option 10

Inner City Rail Capacity Study Pre-Feasibility Report
46
The contents of this report do not represent Queensland Transport or State Government policy
4.6.2 Options evaluation process
The following best-practice process was used to evaluate options:
� review of the draft evaluation criteria from the Stage 1 Inner City Transport Capacity Study report
� review of the ICRCS brief (key considerations)
� internal MPB workshops and review
� workshops with stakeholders which resulted in agreed evaluation criteria and weightings for application in the ‘10 to 6 options’ elimination phase of the options refinement
� workshops with stakeholders and the Project Control, which refined the initial list of ‘6 to 3 options’ criteria for the final assessment process.
Multi-criteria analysis was conducted during the ’10 to 6’ and ‘6 to 3’ phases, and across disciplines of land use, transport planning, rail operations, engineering, environment, and finance/economics.
Pair-wise multi-criteria analysis (also known as ‘paired comparison analysis’) is a method used to compare options applying a range of very different evaluation criteria. It enables integration of, for example, economic, environmental and engineering considerations to produce a single ranking of options.
Multi-criteria analysis selects criteria that cover the range of themes that are considered important. These criteria must be measurable, manageable (no more than 15) and differentiate the options (if options achieve the same score, the criteria are useless). Each criterion is compared against each other criterion in turn; when this comparison is completed, a weight for each criterion is calculated. Each option is given a score for each criterion, usually a value from one to five. These scores are then multiplied by the weighting for each criterion, and the total score for each option calculated.
Sensitivity tests were used to further test the validity of the results of the multi-criteria analysis.
4.6.3 ‘10 to 6 options’ evaluation
4.6.3.1 Evaluation criteria
Each of the ‘preferred 10’ options was assessed by discipline against the evaluation criteria and scored on a relative basis. The scores were summed and weighted to determine discipline scores and relative option ranking. A multi-criteria analysis was used to assess all options across all disciplines. Each option was evaluated against the set criteria and scored on a relative-ranking system.
The evaluation criteria by discipline and their weightings for the ’10 to 6 options’ selection are outlined in Table 4-7.
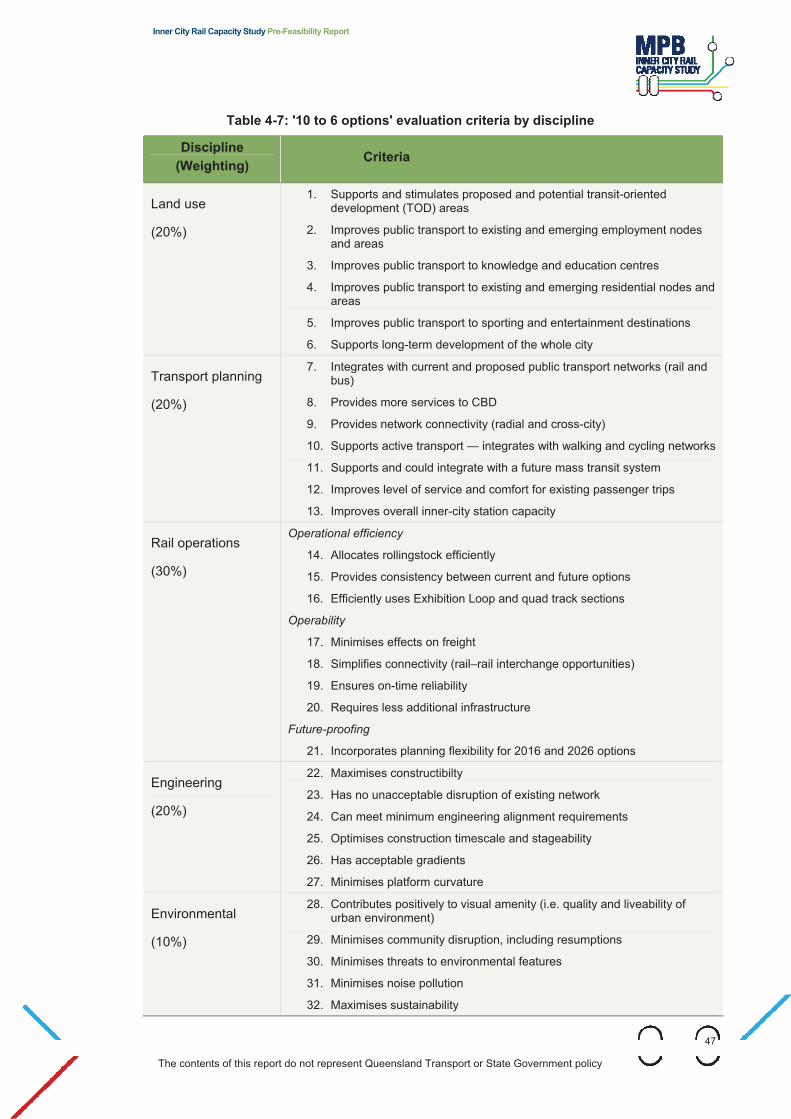
Inner City Rail Capacity Study Pre-Feasibility Report
47
The contents of this report do not represent Queensland Transport or State Government policy
Table 4-7: '10 to 6 options' evaluation criteria by discipline
Discipline(Weighting) Criteria
Land use
(20%)
1. Supports and stimulates proposed and potential transit-oriented development (TOD) areas
2. Improves public transport to existing and emerging employment nodes and areas
3. Improves public transport to knowledge and education centres
4. Improves public transport to existing and emerging residential nodes and areas
5. Improves public transport to sporting and entertainment destinations
6. Supports long-term development of the whole city
Transport planning
(20%)
7. Integrates with current and proposed public transport networks (rail and bus)
8. Provides more services to CBD
9. Provides network connectivity (radial and cross-city)
10. Supports active transport — integrates with walking and cycling networks
11. Supports and could integrate with a future mass transit system
12. Improves level of service and comfort for existing passenger trips
13. Improves overall inner-city station capacity
Rail operations
(30%)
Operational efficiency
14. Allocates rollingstock efficiently
15. Provides consistency between current and future options
16. Efficiently uses Exhibition Loop and quad track sections
Operability
17. Minimises effects on freight
18. Simplifies connectivity (rail–rail interchange opportunities)
19. Ensures on-time reliability
20. Requires less additional infrastructure
Future-proofing
21. Incorporates planning flexibility for 2016 and 2026 options
Engineering
(20%)
22. Maximises constructibilty
23. Has no unacceptable disruption of existing network
24. Can meet minimum engineering alignment requirements
25. Optimises construction timescale and stageability
26. Has acceptable gradients
27. Minimises platform curvature
Environmental
(10%)
28. Contributes positively to visual amenity (i.e. quality and liveability of urban environment)
29. Minimises community disruption, including resumptions
30. Minimises threats to environmental features
31. Minimises noise pollution
32. Maximises sustainability

Inner City Rail Capacity Study Pre-Feasibility Report
48
The contents of this report do not represent Queensland Transport or State Government policy
Discipline(Weighting) Criteria
Finance/economics
33. Estimated construction work/cost amount
(Note for this ’10 to 6 options’ evaluation phase, only a criteria for ‘construction cost/work amount’ was used; more extensive and detailed finance/economic criteria are used in the next ‘6 to 3 options’ evaluation phase.).
4.6.3.2 Assessment and scoring summary
These criteria were then applied in detail to each of the 10 preferred options. Scores were developed for each option utilising a combination of quantitative information and qualitative assessments to determine relative scores.
The six top-ranked options were Options 2, 3, 4, 7, 1 and 8 across all disciplines. Option 6 and Option 10 did not score as high as the top six. Option 5 and Option 9 failed: Option 5 failed on engineering criteria, Option 9 failed on both engineering and environmental criteria, and both had middle to poor scores compared to the other options. These results are summarised in Table 6-2.
Table 6-2: Multi-criteria assessment summary scores for all 10 options
Option Score Rank
1 342 5
2 439 1
3 393 2
4 393 3
5 failed engineering n/a
6 291 9
7 359 4
8 322 6
9 failed engineering and environment
n/a
10 295 8
To determine the robustness of these results, five sensitivity tests were conducted for land use, engineering, transport, environment and rail operations. The results of that sensitivity testing confirmed the preference for Options 2, 3, 4, 7, 1 and 8.
To enable more detailed analysis to be conducted in the next phase of the study, the ‘preferred 6’ options alignments were slightly revised for the ‘6 to 3’ elimination process.

Inner City Rail Capacity Study Pre-Feasibility Report
49
The contents of this report do not represent Queensland Transport or State Government policy
4.6.4 ‘6 to 3 options’ short-listing
4.6.4.1 General methodology
As in the ‘10 to 6 option’ assessment, each of the ‘preferred 6’ options was assessed against agreed evaluation criteria across all disciplines. Each was then subjected to a multi-criteria assessment to determine relative scores and to conduct a limited sensitivity assessment of the results against the strength of the various high-level criteria to determine if the initially preferred options still held high ranks under different weightings. Transport modelling results of the six options was also used in providing insights into option performance.
For the ‘6 to 3 options’ assessment, greater physical detail about the option implementation was available, so more quantitative and objective measures could be applied to discriminate between options.
The additional criteria incorporated are shown in Table 4-8.
Table 4-8: Evaluation criteria for '6 to 3' options assessment
Discipline Criteria
Land use
o increased catchment for existing and projected growth — a value for projected development intensity in 2026 for each phase of each option was calculated based on radial station catchments
o transit-oriented development (TOD) potential — developable land for each phase of each option was calculated based on ped-shed (walking distance along roads and paths) catchments
.
Transport planning
o mode share and patronage — ability to shift mode share from private vehicles from transport modelling results
o traffic impacts — on the road network during construction and operation.
Rail operations
o operational effectiveness, including the need for additional infrastructure, effect on freight, consistency, and utilisation of Exhibition loop and quad track sections
o operational efficiency, including on-time reliability, travel time, connectivity, rollingstock allocation/utilisation, train crew requirements (i.e. drivers and guards) and operational effort
o flexibility in terms of operational, planning, solution and extension.
Engineering o construction method, risks and difficulties — primarily affected by route
o rail engineering compromises that would be required
o convenience of providing facilities (e.g. stations, junctions and yards); also affected by route lengths.
Environmental o social cost, based on truck movements
o environment, resources and sustainability, based on volume of spoil and carbon footprint; carbon footprint was expressed as total greenhouse gas emissions over a 30-year period.

Inner City Rail Capacity Study Pre-Feasibility Report
50
The contents of this report do not represent Queensland Transport or State Government policy
Discipline Criteria
Finance/economics
o changes in the cost of travel time for commuters businesses
o changes in the financial cost of travel to commuters/businesses
o changes in the number of road accidents and corresponding costs to the community; and
o changes in greenhouse gas emissions and corresponding costs to the community.
The following qualitative economic, social and environmental impacts were assessed as part of the cost–benefit analysis:
o changes in consumer surplus
o opportunity cost of the land
o access to and utilisation of the public transport network
o other travel time benefits
o potential for transit-oriented development.
4.6.4.2 Overall Findings
Overall the 6 options considered are very similar in design, and all meet the basic criteria. Most score similarly, with the following key exceptions:
� Option 1 performs particularly poorly on rail operations grounds (it requires many Ipswich line trains to be routed via the Tennyson loop)
� Option 8 performs particularly poorly on land use grounds (it has very limited opportunity to encourage or support new development)
� Option 3 performs somewhat poorly on engineering grounds, as it requires a potentially risky CBD station build diagonally across blocks. It also had a slightly lower score on patronage.
The summary scores and ranks for the pair-wise multi-criteria assessment are shown in Table 4-9 below. The top three ranked options are options 2, 4 and 7.
Table 4-9: Summary score and rank of options
Score Rank
Option 1 400 5
Option 2 463 1
Option 3 422 4
Option 4 441 2
Option 7 433 3
Option 8 378 6
4.6.4.3 Sensitivity tests
To test the validity and robustness of the overall option preferences, the following reasonably simple sensitivity tests were carried out using the weighting agreed with stakeholders and the Project Control Group used in the ’10 to 6 options’ assessment, namely:

Inner City Rail Capacity Study Pre-Feasibility Report
51
The contents of this report do not represent Queensland Transport or State Government policy
� equal weighting — a test was conducted if the general criteria were equally weighted at 20% for each general criteria
� rail operations 60% weighting — a test was conducted in which ‘rail operations’ was given a much higher weighting (60%)
� land use and transport/public transport 80% weighting — a test was conducted in which ‘land use and transport/public transport’ was given a much higher weighting (80%)
� engineering 60% weighting — a test was conducted in which ‘engineering’ was given a much higher weighting (60%).
Overall, options 2, 4 and 7 consistently performed higher and were recommended for further investigation in Stage 3 of the study.
4.6.5 Financial/Economic analysis
The aim of the economic analysis at this stage is to differentiate between options and not to create a business case for the project. Based on the preliminary construction estimates and outputs from the strategic model, preliminary financial and economic analysis of the options was conducted.
4.6.5.1 Financial analysis
Assessment of financial impacts of investing in the range of inner city rail options focused on the incremental costs and benefits of investing in inner city rail options, comparing the revenue earned by, and costs associated with, public transport patronage of the different options with the capacity constraint network case. The resulting revenue and cost streams were evaluated using discounted cash flow analysis.
The evaluation period ranges from the beginning of construction (which varies among the different options) to 2041, which permits all debt to be repaid. Unless otherwise stated, revenues and costs were escalated by an assumed inflation rate of 2.5% per annum. All estimates for project works between 2008 and 2026 are in 2008 dollars with no allowance for escalation.
Revenues associated with each option were assessed by determining:
� additional fare revenue generated (additional patronage generated multiplied by an estimated fare per patron)
� net effect of the change in bus patronage levels
� working capital available.
The additional train-related operating expenses of the different options were estimated using comparable costs on similar underground rail projects elsewhere. They include:
� the costs of operating and staffing rollingstock
� station staffing costs
� station and other maintenance costs.

Inner City Rail Capacity Study Pre-Feasibility Report
52
The contents of this report do not represent Queensland Transport or State Government policy
Financial impacts were evaluated by calculating each option’s net present value (NPV) and funding requirements. The NPV of each option is calculated by discounting annual project cash flows (operating results plus the movement in working capital less capital expenditure) at 8%. These cash flows do not include the financing cash flows associated with interest expenses or the repayment of debt, and only cash flows over the period until 2041 are estimated. A terminal value for the assets in 2041 has not been estimated. Table 4-10 lists the resulting NPVs for the options.
Table 4-10: Net present values for each option
Option 1 Option 2 Option 3 Option 4 Option 7 Option 8
Financial NPV ($m)
-7,199 -6,793 -6,755 -6,075 --6,087 -6,438
Like most public transport projects, all options exhibit negative financial NPVs because the large amounts of capital expenditure dwarf the operational results of the rail investment options.
All options incur negative cash flows over the forecast period due to both negative operating positions and, more significantly, the burden of amortising debt. The real burden of these shortfalls will fall over time as inflation erodes the cost of the fixed (in nominal terms) amortisation payments. Nonetheless, these figures are important as an affordability measure as they represent the potential impact of the project on future government budgets.
4.6.5.2 Economic analysis
The financial analysis shows the options generate a negative return on a purely financial basis. This is normal for infrastructure projects. However, all infrastructure projects potentially generate very large economic benefits, which represent benefits to the entire community. When these benefits (and similar economic costs) are quantified (in dollar terms) infrastructure projects may show a positive return.
The following economic, social and environmental impacts were quantified as part of the economic assessment:
� changes in the cost of travel time for commuters / businesses
� changes in the financial cost of travel to commuters / businesses
� changes in the number of road accidents, injuries and fatalities and corresponding reduced costs to the community
� changes in greenhouse gas emissions and corresponding costs to the community
� increased transit-oriented development potential.
Table 4-11, below, summarises the outcome of the quantitative economic assessment. As can be seen, all options show positive NPVs in all categories. The assessed quantifiable economic impact varies only marginally across options

Inner City Rail Capacity Study Pre-Feasibility Report
53
The contents of this report do not represent Queensland Transport or State Government policy
falling generally between $35.99 billion and $36.63 billion, with Option Two providing the greatest net benefit and Option Seven the lowest.
Table 4-11: Outcome of quantitative economic assessment (NPV) ($million)
(Net Present value discounted @ 8%)
OptionOne
OptionTwo
OptionThree
OptionFour
OptionSeven
OptionEight
Travel Time savings $29,639 $29,744 $29,208 $29,218 $29,187 $29,365
Travel Cost savings $6,323 $6,320 $6,274 $6,218 $6,246 $6,341
Reduced Road Accidents $471 $471 $472 $469 $469 $471
Reduced CO2 emissions $92 $92 $91 $92 $92 $95
Economic NPV $36,525 $36,628 $36,045 $35,996 $35,993 $36,272
Ranking of options 2 1 4 5 6 3
4.6.5.3 Summary
Table 4-12, below, provides the summary results of the preliminary quantitative financial and economic assessment
Table 4-12: Overall assessment of quantitative financial and economic impacts
Net Present Value (discounted @ 8%)
OptionOne
OptionTwo
OptionThree
OptionFour
OptionSeven
OptionEight
Economic NPV ($m)
$36,525 $36,628 $36,045 $35,996 $35,993 $36,272
Financial NPV ($m) ($7,199) ($6,793) ($6,775) ($6,075) ($6,087) ($6,438)
Overall NPV ($m) $29,325.88 $29,834.30 $29,270.31 $29,921.37 $29,905.90 $29,834.03
Ranking of Option 5 3 6 1 2 4
The preliminary assessment indicates that there are substantial net benefits available from investment in any of the inner city rail investment options analysed, given the assumptions that have been made for these calculations (and listed above).
The preliminary nature of these calculations means that these estimates should not be taken as precise indicators of the benefits that could be expected. In other words, there may be a wide confidence interval around the NPVs estimated here.
Nonetheless, as shown above, assuming equal weighting of the financial and economic components, the outcome of the preliminary quantitative assessment varies only marginally across options, with Option Four providing the greatest net benefit and Options Three the lowest.

Inner City Rail Capacity Study Pre-Feasibility Report
54
The contents of this report do not represent Queensland Transport or State Government policy
4.7 Summary of outcomes
4.7.1 Short-listed options
The Rail Network Concept Development Stage (Stage 2) identified three top performing options: Option 2, 4 and 7 are preferred
All of these options:
� passed all mandatory criteria – they relieve the identified inner city capacity constraints, can be constructed using QR construction standards and have no totally unacceptable social or ecological implications.
� scored highest on a weighted multicriteria analysis across all disciplines, confirmed by sensitivity testing
� have the same route for the first corridor required by 2016
� has a different route for the second corridor required by 2026.
The following figures depict the preferred three options which received further detailed pre-feasibility investigations and analysis in Stage 3 of the ICRCS.

Inner City Rail Capacity Study Pre-Feasibility Report
55
The contents of this report do not represent Queensland Transport or State Government policy
Figure 4-19: Three short listed options - Option 2

Inner City Rail Capacity Study Pre-Feasibility Report
56
The contents of this report do not represent Queensland Transport or State Government policy
Figure 4-20: Three short-listed options - Option 4

Inner City Rail Capacity Study Pre-Feasibility Report
57
The contents of this report do not represent Queensland Transport or State Government policy
Figure 4-21: Three short-listed options - Option 7
4.7.2 Additional inner city options recommended
Although the preferred 3 options are different ‘as a package’, each option has a common corridor at 2016 proceeding from the south through the CBD and via Spring Hill to Bowen Hills.
MPB raised the concern with Queensland Transport that the lack of alternatives for 2016 might prove a risk for the project. In particular there was concern that a potentially cheaper alternative (in the form of using the current corridor) had not

Inner City Rail Capacity Study Pre-Feasibility Report
58
The contents of this report do not represent Queensland Transport or State Government policy
been fully investigated, nor had an alternative city underground alignment been fully explored, particularly one which captured prospective land development along the Newstead/Fortitude Valley.
In order to provide the opportunity to investigate alternatives at 2016, Queensland Transport and the study team agreed that the following three additional corridors would be carried forward to the technical pre-feasibility stage for the 2016 corridor:
� Merivale bridge or tunnel (to use as much of the existing alignment as possible along the Merivale bridge alignment)
� Newstead/Fortitude Valley route (as an alternative to the Spring Hill route) – this option essentially utilises the alignment of Option 4 (which was the fourth highest ranked option of the six evaluated)
� Exhibition loop ‘daylighting’ (shorter version of the Spring Hill route to use existing Exhibition loop infrastructure).
All 2016 options taken forward to technical pre-feasibility, including the Merivale Bridge/Fortitude Valley alternatives are shown in the figure below:
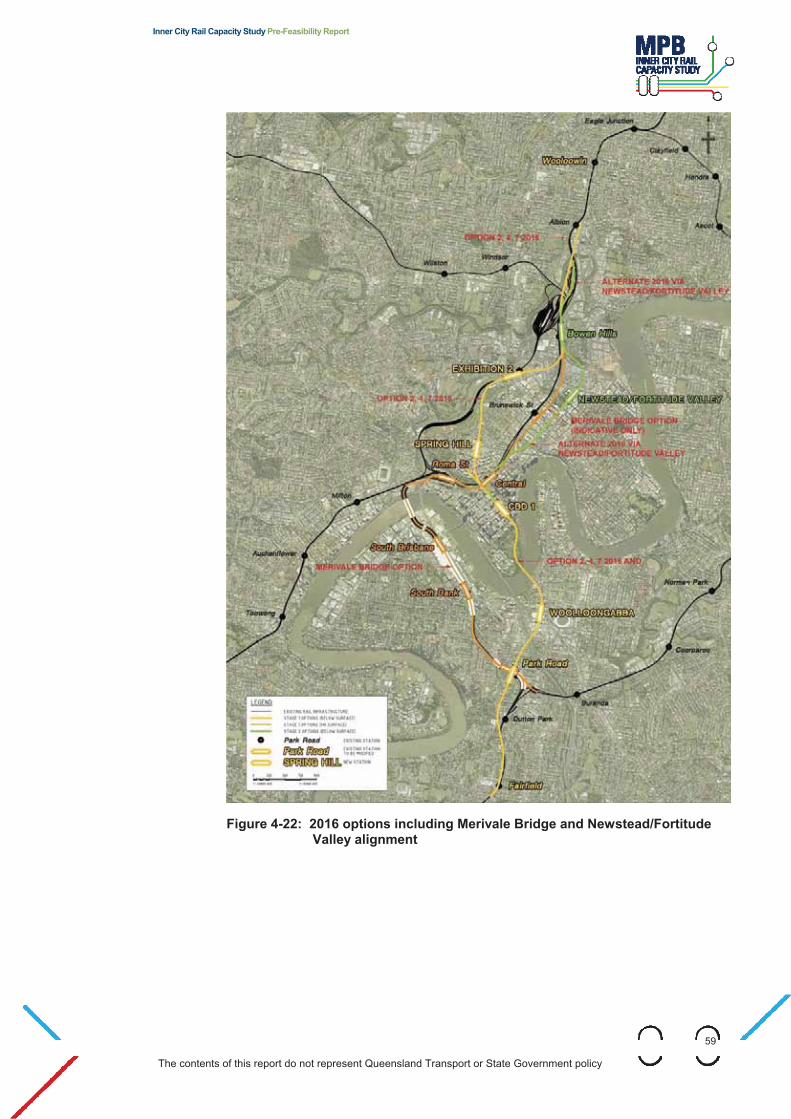
Inner City Rail Capacity Study Pre-Feasibility Report
59
The contents of this report do not represent Queensland Transport or State Government policy
Figure 4-22: 2016 options including Merivale Bridge and Newstead/Fortitude Valley alignment

Inner City Rail Capacity Study Pre-Feasibility Report
60
The contents of this report do not represent Queensland Transport or State Government policy
5. Technical pre-feasibility
5.1 Objectives
5.1.1 Key objectives
The aim of this stage is to investigate the technical feasibility of the three short-listed options. This includes
� conceptual engineering design of the short-listed options to a higher degree of accuracy than was completed in Stage 2, including network routes, junctions and station infrastructure
� consideration of requirements for rail power supply, signalling and communications and other supporting requirements
� consideration of safety and security
� review and consideration of constraints of the built environment (e.g. building foundations, underground car parks roads and streets and public utility infrastructure)
� indentify indicative property/land requirements and impacts
� review of environmental factors
5.2 Process overview The overall technical pre-feasibility process involved the following key steps:
� confirming design assumptions (Engineering Pre-Feasibility)
� confirming environmental considerations
� assessing built infrastructure constraints
� modifying alignments and/or station locations to avoid built infrastructure constraints
� identifying the extent of works for each option
� carrying out a broad environmental assessment
� undertaking a high level cost plan for each option and
� confirming the Technical Pre-Feasibility of each option.

Inner City Rail Capacity Study Pre-Feasibility Report
61
The contents of this report do not represent Queensland Transport or State Government policy
5.2.1 Inputs assumptions and standards
The key components of the railway are:
� twin single-track bored tunnels with regularly spaced cross-passages connecting the main running tunnels
� elevated longitudinal walkways along the tunnels for emergency escape
� steps between the walkways and track level at frequent intervals to assist emergency escape and maintenance staff access
� firemans’ access space on the opposite side to the walkway
� track-slab throughout the tunnel system (non-ballasted track).
� provision for Platform Screen Doors (PSDs) at stations
� train operations capable of accommodating PSDs
� allowance for conventional QR electrification system and also future smaller systems
� allowance for current QR signalling and also future ATP systems
� allowance for ventilation systems in the stations with no dedicated systems in the tunnels, although the tunnel geometry could cater for small jet fans if required.
Key standards that were adopted are as in Table 5-1below
Table 5-1: Rail engineering standards adopted for technical pre-feasibility phase
Area Standard or assumption
Alignment standard: speed 60 km/h
Alignment standard: min radius 300m
Alignment standard: max gradient for track
2% compensated
Alignment standard: max gradient at station
0.5%
Fire and life safety: tunnels Meets or exceeds US standard NFPA130 (2007) and UK Office of Rail Regulator (ORR) regulations
Fire and life safety: stations Meets or exceeds US standard NFPA130 (2007), UK Office of Rail Regulator (ORR) regulations and relevant Australian building codes
Rollingstock Current QR configuration with up to 9 car trains
Station sizing: loads Assumes maximum load of 750 passengers for 6 car train (1125 for 9 car train)

Inner City Rail Capacity Study Pre-Feasibility Report
62
The contents of this report do not represent Queensland Transport or State Government policy
Area Standard or assumption
Station platforms: single face, island configuration, 220m length, DDA compliant
Architecture A world-class architectural and engineering design featuring a high quality, comfortable and convenient passenger experience
5.2.2 Environmental and sustainability considerations
Environmental and sustainability issues were taken into account at the earliest possible stages. The approach scoped the issues for consideration and classified a degree of potential impact of each, as shown in Table 5-2 below.
From this starting point, MPB reviewed options based on:
� Addressing as many potentially ‘major’ considerations as possible within the study scope
� Addressing those issues where information was available
� Focussing on those issues that may show a difference between options.
Table 5-2: Scoping of Environmental and Sustainability Issues for Review at this Stage of Planning
Potential Adverse Impacts Construction Operation Decommissioning/ Refurbishment
Socio-cultural
Visual amenity � � �
Community severance � � �
Aboriginal cultural heritage � � �
European cultural heritage � � �
Public safety � � �
Business continuity � � �
Land resumptions � � �
Traffic � � �
Climate change risk � � �
Pollution
Noise � � �
Vibration � � �
Dust � � �

Inner City Rail Capacity Study Pre-Feasibility Report
63
The contents of this report do not represent Queensland Transport or State Government policy
Potential Adverse Impacts Construction Operation Decommissioning/ Refurbishment
Local air emissions � � �
Regional air pollution � � �
Greenhouse gas emissions � � �
Water pollution � � �
Land contamination and soils � � �
Natural Resources
Electricity consumption � � �
Oil dependence/depletion � � �
Fossil fuel use � � �
Water consumption � � �
Materials use � � �
Tunnel spoil � � �
Waste management � � �
Hydrology and flooding � � �
Biodiversity
River ecology � � �
Flora and fauna � � �
Weeds � � �
Regional ecosystems � � �
Key: � Major; � Moderate; � Minor considerations � Yellow indicates issues addressed at this stage of analysis
5.2.3 Options for consideration
The options to be considered for technical pre-feasibility were the three preferred options identified in the concept development phase. On the advice of Queensland Transport, additional concepts were investigated for 2016.
First corridor (by 2016)
� Fairfield – Woolloongabba – City – Spring Hill – Bowen Hills (Options 2/4/7)
� A concept for assessing the ability to reduce the length of the 2016 tunnel by daylighting (or surfacing) the tunnel on the Exhibition rail loop (requested by QT)

Inner City Rail Capacity Study Pre-Feasibility Report
64
The contents of this report do not represent Queensland Transport or State Government policy
� Fairfield – Woolloongabba – City – Fortitude Valley/Newstead – Bowen Hills (requested by QT)
� Upgrade of Park Road – Roma Street including Merivale Bridge duplication (requested by QT)
Second corridor (by 2026)
� Toowong – South Brisbane – City – Fortitude Valley/Newstead – Bowen Hills (Option 2)
� Milton – Roma Street – City – Fortitude Valley/Newstead – Bowen Hills (Option 4)
� Milton – Roma Street – Central – Brunswick Street – Bowen Hills (Option 7)
Table 7-1: Overview of three options
Option Value or Characteristic Option 2 Option 4 Option 7
Total Approximate Route Length (km – 2016 and 2026)
26km 22km 21.5km
2016 Route Length 10km – Bored length
13.5km - Total length
2026 Route Length 10.5km – Bored length
12.5km – Total length
6.0km – Bored length
8.5km – Total length
5.5km – Bored length
8km – Total length
New Underground stations en-route in 2016
Park Road, Woolloongabba, CBD 1(Edward St), Spring Hill, Exhibition 2, Bowen Hills (6 stations)
New Underground stations en-route in 2026
Toowong, West End, South Brisbane, CBD 2
(Queen St), Newstead/Valley, Bowen
Hills (6 stations)
Milton, Roma Street, CBD 2 (Queen Street), Newstead/Valley and
Bowen Hills (5 stations)
Milton, Roma Street, CBD 2 (Central Station),
Brunswick Street and Bowen Hills (5 stations)
5.3 Alignment and built infrastructure assessment: 2016
5.3.1 Short-listed options (2, 4, 7)
Each short-listed option has an identical southern corridor approach via a new ‘south’ CBD station and continues north to connect at Bowen Hills.
The common 2016 alignment joins the Gold Coast–Beenleigh corridor to the North Coast Line corridor via an underground route traversing the CBD in a south–north orientation. The route commences just south of the existing Fairfield station and traverses new underground stations at Park Road and Woolloongabba before crossing the river several hundred metres east of the Captain Cook Bridge.

Inner City Rail Capacity Study Pre-Feasibility Report
65
The contents of this report do not represent Queensland Transport or State Government policy
The alignment proceeds under, and parallel to, Edward Street before proceeding to potential new underground stations at Spring Hill, Exhibition and Bowen Hills. BowenHills station is the northernmost station for both the 2016 and 2026 underground alignments. The route length is approximately 13 km.
Design issues
Particular considerations in developing this alignment were to minimise station depth while avoid key building constraints. These constraints include the need to avoid the S1 sewer and the North South Bypass Tunnel (NSBT). Therefore the design includes relatively deep stations at Spring Hill and Exhibition 2 (RNA) and Bowen Hills, and a need to continue the tunnels north to surface beyond Breakfast Creek.
The following two diagrams show the indicative long-section profile along the 2016 route.
Figure 5-1: All options (2016) Tunnelling long section - Fairfield to CBD1
Figure 5-2: All options (2016) Tunnelling long section - Spring Hill to Eagle Junction
5.3.2 Merivale bridge / tunnel option
The Merivale Bridge / Tunnel option is a combination of surface corridor (south-side of the river), bridge (across river) and tunnel (north-side of the river). The corridor does not open up any new routes following the existing rail corridor from Park Road through to Bowen Hills.

Inner City Rail Capacity Study Pre-Feasibility Report
66
The contents of this report do not represent Queensland Transport or State Government policy
The restricted ability to expand surface stations and to create appropriate underground stations will affect the ultimate capacity of this option. The build constraints for this option are considered severe and limit the flexibility of the route.
Figure 5-3: Merivale Bridge/Tunnel Option - south-side main features
Although the cost of this option may be up to 50% lower than short-listed Options 2, 4 and 7, the Merivale Bridge / Tunnel option would most likely result in:
� substandard stations at Central and Roma Street
� narrow platforms at South Brisbane and South Bank stations
� considerable property impacts on both sides of the river

Inner City Rail Capacity Study Pre-Feasibility Report
67
The contents of this report do not represent Queensland Transport or State Government policy
� no major bus–rail interchange on the southside (i.e. no connection with Woolloongabba) thereby affecting long-term bus strategies
� no additional land use development or capture opportunities
� sub-standard alignment with potential noise related issues
Also, without a detailed survey and substantial design development work, its feasibility can’t be guaranteed.
5.3.3 Newstead/Fortitude Valley route
This route could meet the development opportunities in Fortitude Valley and Newstead better than a Spring Hill alignment. The route through Newstead/Fortitude Valley appears to be possible but more detailed consideration may be required at the CBD, particularly in relation to subsurface constraints. The CBD subsurface constraints result from a very tight alignment out of Edward Street towards Fortitude Valley, as per Figure 5-4 below.
Figure 5-4: Alternative 2016 route via Newstead/Fortitude Valley
In terms of a 2026 alignment, the Option 2 alignment to Spring Hill is compatible with this Newstead/Fortitude Valley route alignment with a change to the northern section of the CBD route via Spring Hill. The resulting deep skew station would need to be positioned to avoid particularly tall future building developments (i.e. � 40 storeys).
Substantial design development work would be required to assess the issues associated with a 2026 via Spring Hill and the resultant final alignment and station locations.
5.3.4 Exhibition loop daylighting
The purpose of this option was to save costs by shortening the tunnelling in 2016, as shown in Figure 5-5 below.

Inner City Rail Capacity Study Pre-Feasibility Report
68
The contents of this report do not represent Queensland Transport or State Government policy
Figure 5-5: Possible alignment for exhibition loop daylighting
After assessment, this adaption was found to be possible only if Spring Hill station, Exhibition 2 station and Bowen Hills station were not to form part of the 2016 project. Also, as the length of tunnelling does not dominate the project cost, the actual overall project saving would not be significant. This option was therefore not considered worthy of further, more detailed investigation.
5.4 Alignment and built infrastructure assessment: 2026
The 2026 alignment for options 2, 4 and 7 is coupled with the 2016 alignment described above. Each 2026 alignment is different.
5.4.1 Option 2
Option 2 is the most expensive and longest (11.4 km); it accesses the West End/South Brisbane area and crosses the river twice. To achieve a station at South Brisbane requires another river crossing from the Ipswich Line, resulting in a long route from Indooroopilly, via Toowong and West End.
The route commences in a dive structure on the city-side of Indooroopilly Station and traverses new underground stations at Toowong, West End, South Brisbane, the CBD 2 (within Queen St), a station at the north end of Ann Street near the

Inner City Rail Capacity Study Pre-Feasibility Report
69
The contents of this report do not represent Queensland Transport or State Government policy
Newstead River Park precinct and finishing at an underground station at Bowen Hills. The 2026 Bowen Hills underground station is a common station with the 2016 underground station.
The following two diagrams show the indicative long section profile along the 2026 Option 2 route with associated major constraints.
Figure 5-6: Option 2 (2026) Tunnel long section from Indooroopilly to South Brisbane
Figure 5-7: Option 2 (2026) Tunnel long section from South Brisbane to Breakfast Creek
5.4.2 Option 4
Option 4 provides an inner-city connection to the Ipswich corridor that is close to the city. The underground system commences in a dive structure on the city side of Auchenflower station and then traverses new underground stations at Milton and Roma Street before connecting to the Option 2 alignment immediately south-west of the CBD 2 station. Stations in common are CBD 2 (within Queen St), Newstead/Fortitude Valley at the far north-eastern end of Ann Street and Bowen Hills station. This option involves no river crossings. The proposed Milton and Roma Street stations are located directly under the existing corresponding stations.
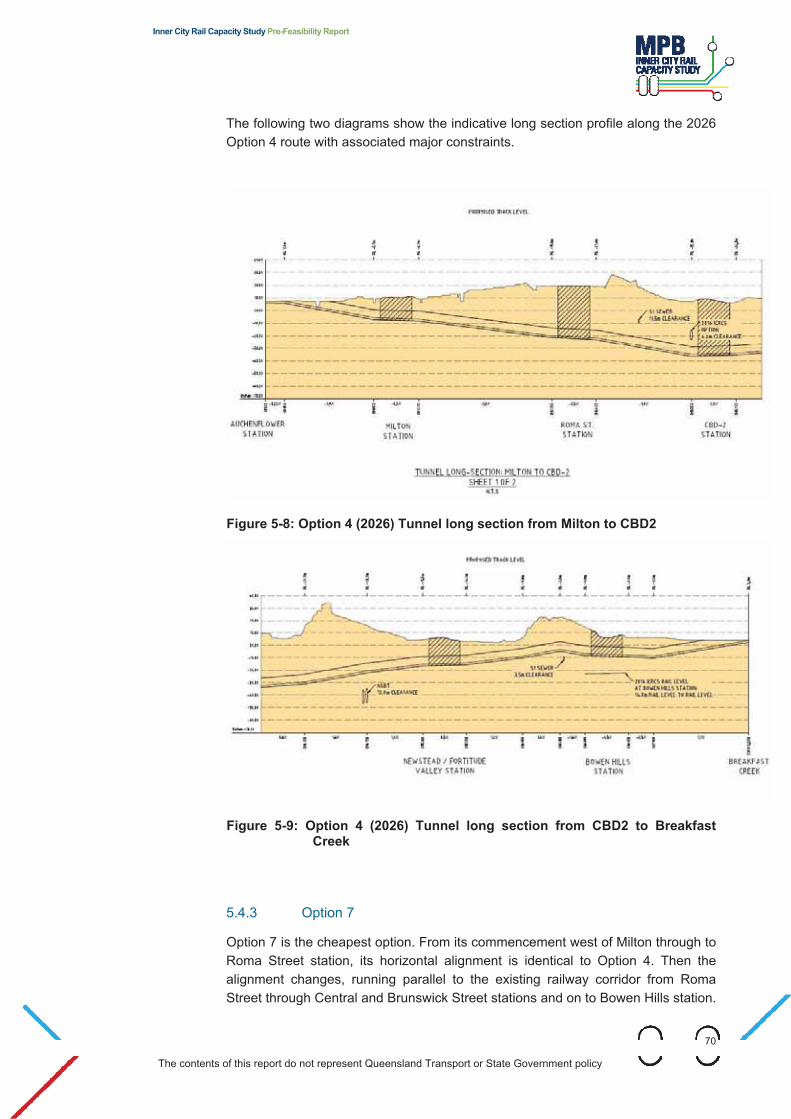
Inner City Rail Capacity Study Pre-Feasibility Report
70
The contents of this report do not represent Queensland Transport or State Government policy
The following two diagrams show the indicative long section profile along the 2026 Option 4 route with associated major constraints.
Figure 5-8: Option 4 (2026) Tunnel long section from Milton to CBD2
Figure 5-9: Option 4 (2026) Tunnel long section from CBD2 to Breakfast Creek
5.4.3 Option 7
Option 7 is the cheapest option. From its commencement west of Milton through to Roma Street station, its horizontal alignment is identical to Option 4. Then the alignment changes, running parallel to the existing railway corridor from Roma Street through Central and Brunswick Street stations and on to Bowen Hills station.

Inner City Rail Capacity Study Pre-Feasibility Report
71
The contents of this report do not represent Queensland Transport or State Government policy
In 2026 it provides five new stations but no new land use development, public transport opportunities or new servicing of the rail network into the CBD.
The following two diagrams show the indicative long section profile along the 2026 Option 7 route with associated major constraints.
Figure 5-10: Option 7 (2026) Tunnel long section from Milton to CBD2
Figure 5-11: Option 7 (2026) Tunnel long section from CBD2 to Breakfast Creek

Inner City Rail Capacity Study Pre-Feasibility Report
72
The contents of this report do not represent Queensland Transport or State Government policy
5.5 Tunnelling and built environment
5.5.1 Built environment constraints
Figure 5-12: Key infrastructure constraints
5.5.2 Tunnelling – dimensions and constructability
The basic tunnel sizes are 7m diameter (single track tunnels). Variations of several hundred millimetres in tunnel diameter can easily be accommodated to handle vehicles wider than narrow gauge. Therefore it is reasonable to say that at this pre-
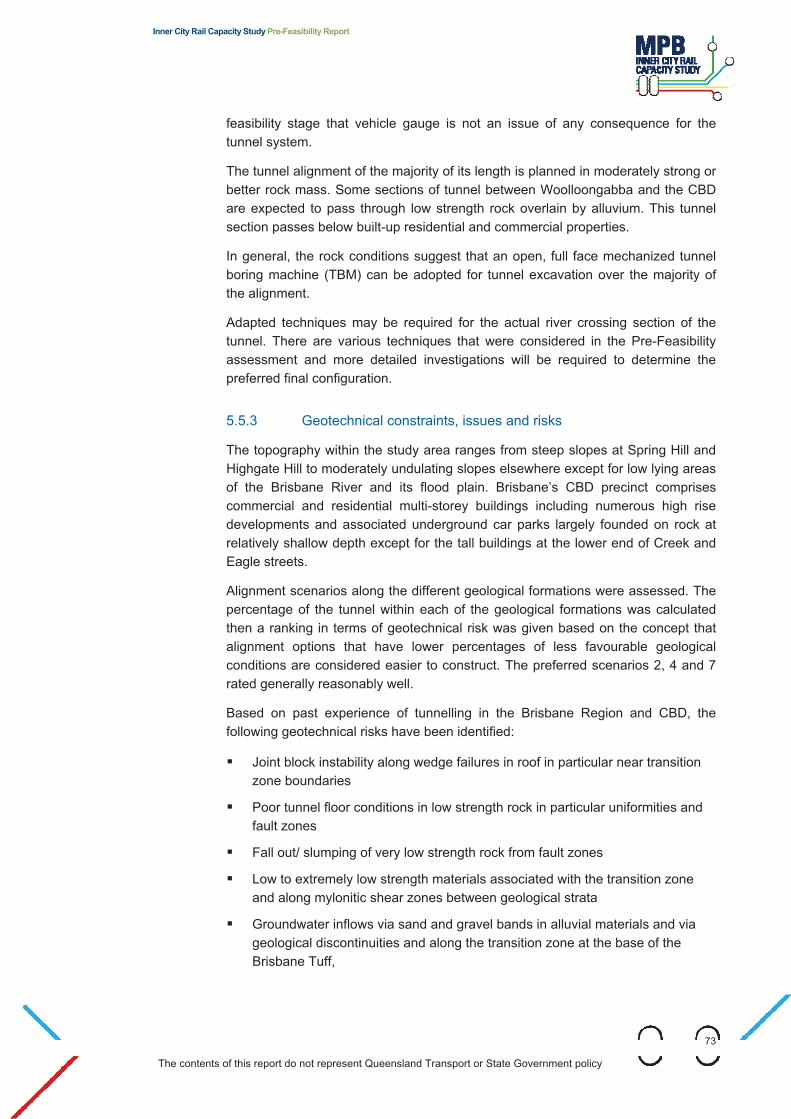
Inner City Rail Capacity Study Pre-Feasibility Report
73
The contents of this report do not represent Queensland Transport or State Government policy
feasibility stage that vehicle gauge is not an issue of any consequence for the tunnel system.
The tunnel alignment of the majority of its length is planned in moderately strong or better rock mass. Some sections of tunnel between Woolloongabba and the CBD are expected to pass through low strength rock overlain by alluvium. This tunnel section passes below built-up residential and commercial properties.
In general, the rock conditions suggest that an open, full face mechanized tunnel boring machine (TBM) can be adopted for tunnel excavation over the majority of the alignment.
Adapted techniques may be required for the actual river crossing section of the tunnel. There are various techniques that were considered in the Pre-Feasibility assessment and more detailed investigations will be required to determine the preferred final configuration.
5.5.3 Geotechnical constraints, issues and risks
The topography within the study area ranges from steep slopes at Spring Hill and Highgate Hill to moderately undulating slopes elsewhere except for low lying areas of the Brisbane River and its flood plain. Brisbane’s CBD precinct comprises commercial and residential multi-storey buildings including numerous high rise developments and associated underground car parks largely founded on rock at relatively shallow depth except for the tall buildings at the lower end of Creek and Eagle streets.
Alignment scenarios along the different geological formations were assessed. The percentage of the tunnel within each of the geological formations was calculated then a ranking in terms of geotechnical risk was given based on the concept that alignment options that have lower percentages of less favourable geological conditions are considered easier to construct. The preferred scenarios 2, 4 and 7 rated generally reasonably well.
Based on past experience of tunnelling in the Brisbane Region and CBD, the following geotechnical risks have been identified:
� Joint block instability along wedge failures in roof in particular near transition zone boundaries
� Poor tunnel floor conditions in low strength rock in particular uniformities and fault zones
� Fall out/ slumping of very low strength rock from fault zones
� Low to extremely low strength materials associated with the transition zone and along mylonitic shear zones between geological strata
� Groundwater inflows via sand and gravel bands in alluvial materials and via geological discontinuities and along the transition zone at the base of the Brisbane Tuff,
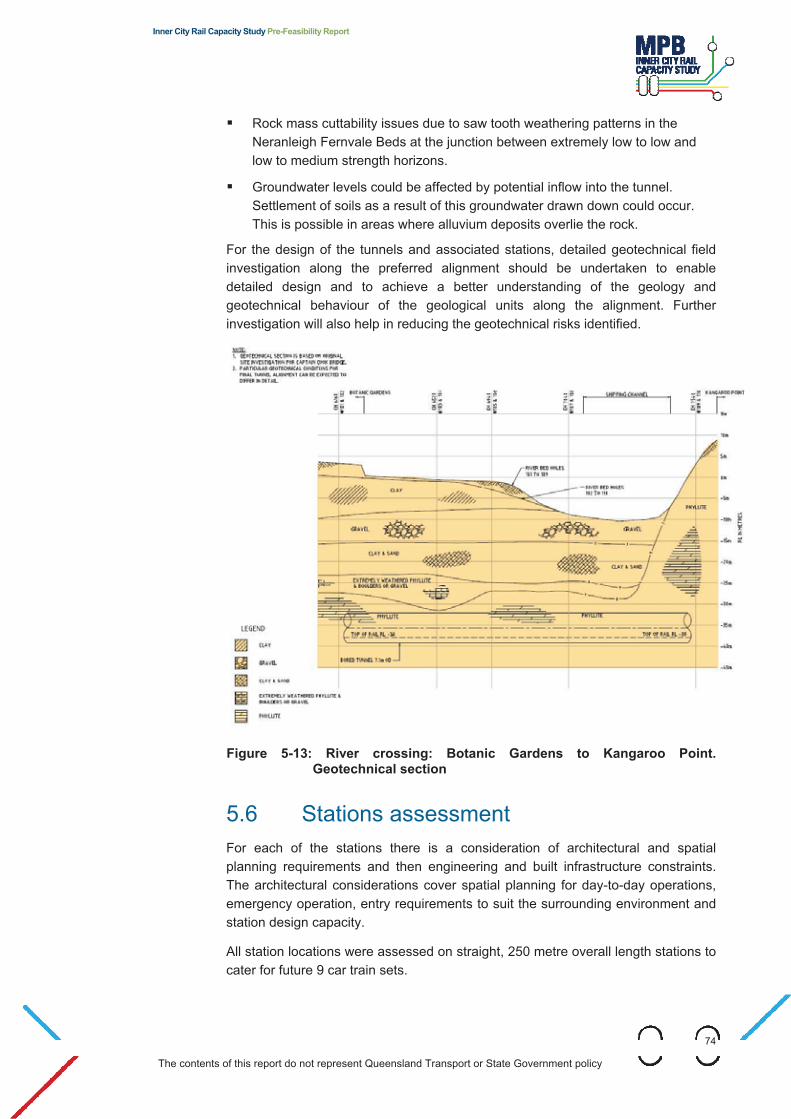
Inner City Rail Capacity Study Pre-Feasibility Report
74
The contents of this report do not represent Queensland Transport or State Government policy
� Rock mass cuttability issues due to saw tooth weathering patterns in the Neranleigh Fernvale Beds at the junction between extremely low to low and low to medium strength horizons.
� Groundwater levels could be affected by potential inflow into the tunnel. Settlement of soils as a result of this groundwater drawn down could occur. This is possible in areas where alluvium deposits overlie the rock.
For the design of the tunnels and associated stations, detailed geotechnical field investigation along the preferred alignment should be undertaken to enable detailed design and to achieve a better understanding of the geology and geotechnical behaviour of the geological units along the alignment. Further investigation will also help in reducing the geotechnical risks identified.
Figure 5-13: River crossing: Botanic Gardens to Kangaroo Point. Geotechnical section
5.6 Stations assessment For each of the stations there is a consideration of architectural and spatial planning requirements and then engineering and built infrastructure constraints. The architectural considerations cover spatial planning for day-to-day operations, emergency operation, entry requirements to suit the surrounding environment and station design capacity.
All station locations were assessed on straight, 250 metre overall length stations to cater for future 9 car train sets.

Inner City Rail Capacity Study Pre-Feasibility Report
75
The contents of this report do not represent Queensland Transport or State Government policy
Station construction techniques were considered in the context of each site. In all, up to seventeen different station locations were examined and five fundamental station construction types were adopted.
The construction types were classified as follows:
Type 1: Site specific general cavern
Type 2: Generic cavern
Type 3: Special method – shallow stations under existing stations
Type 4: Shallow cut-and-cover stations
Type 5: Two-level cut-and-cover stations
The various station types are show in Figure 5-14.
Out of the seventeen different station locations a focus was placed on the ones that were considered worthy of more discrete attention at this Pre-Feasibility stage to determine their technical viability. These stations were Park Road, Woolloongabba, CBD 1 and CBD 2 and Bowen Hills.
Island platform arrangements were assumed for all stations and certain entry/exit configurations were assumed based on envisaged station loading patterns. The depth of all stations was determined by the vertical alignment of the tunnel routes and the position of a station by the requirement to place on a straight, and be centred in accordance with Land Use and PT requirements.

Inner City Rail Capacity Study Pre-Feasibility Report
76
The contents of this report do not represent Queensland Transport or State Government policy
Figure 5-14: Station types
5.7 Rail systems A determination of traction power requirements has been made based on the operation of a mix of six and nine car sets in 2026 to forecast a likely maximum power draw. Traction power technology is still assumed to be based on gas insulation 25kV switchgear (GIS) in 2026.
Although undertaking preliminary study work on ‘next generation’ signalling and train control systems, QR is not advanced enough in its concept planning to enable

Inner City Rail Capacity Study Pre-Feasibility Report
77
The contents of this report do not represent Queensland Transport or State Government policy
future infrastructure architecture to be predicted with any certainty. It will therefore be necessary to plan both new lines and capacity improvement works to embrace existing technologies and current operational methodologies. This approach should, however, accommodate as far as is practicable a modular architecture so as to maximise the ongoing opportunities for technical and operational advances.
Signalling and train control systems in particular need to accommodate flexible migration paths that are both affordable from a cash flow perspective and are cost effective.
Issues regarding the use of existing rollingstock have to be investigated on several fronts, including in respect to fire and life safety in tunnels and to platform screen doors.
Figure 5-15 Integration of platform screen doors and rollingstock
Overall, the rail and tunnel systems require a planned design development path, which considers not just the status for tunnel in 2016, but the progression of existing systems and rollingstock into new generations of railway systems.
5.8 Environmental pre-feasibility assessment Analysis of the option designs shows the following:
� Overall, the options are very similar in terms of negative environmental and social impacts. A key reason for this is the homogeneous nature of the existing environment. The study area as a whole is characterised by residential areas on the fringes of the Brisbane CBD (in areas such as Bowen Hills, Milton and Fairfield) and multi purpose uses (mainly commercial and retail) within the Brisbane CBD. The land uses are predominantly the same throughout the study area, which is why the impacts associated with each option do not differ greatly;
� Preliminary assessment of chosen parameters shows that none of the Options will have significantly more environmental impact than the others. Similarly, none of the Options stand out as being significantly less environmentally damaging. Further studies are necessary to confirm this preliminary finding;
� During construction, the main issue to be managed along all alignment Options is likely to be disturbance of sensitive receivers, primarily residential areas, schools and hospitals. Specific impacts to sensitive receivers that will

Inner City Rail Capacity Study Pre-Feasibility Report
78
The contents of this report do not represent Queensland Transport or State Government policy
need to be managed will be noise and vibration and air pollution from construction activities; and
� During the operation phase the Key Environmental Impacts experienced along all alignment Options are likely to be greenhouse gas emissions, vibration impacts and increased congestion (of people and traffic) around Stations. There will also be positive social impacts including improved accessibility and connectivity between the CBD and fringe suburbs.
This assessment has provided a snapshot of the likely environmental and social impacts associated with the proposed Inner City Rail alignment Options. All proposed alignment Options will have an impact on the environment and surrounding community, however, due to the pre-feasibility and preliminary nature of the study, the exact extent and scale of likely environmental and social harm is unknown. All identified impacts can be managed and mitigated; however, further work is required to assess the likelihood and consequence of each impact.
A comprehensive, qualitative study of all relevant parameters is necessary to allow for the further assessment of the potential environmental and social impacts associated with each proposed alignment Option.
Table 5-3: Environmental impact - key findings
Option Impacts Unique to the Option
2016 North-South Option
� This Option is the only alignment that is likely to impact communities at Spring Hill and around the Brisbane Exhibition Grounds. During construction, sensitive receivers (such as residents and hospitals) are likely to be disturbed by noise and dust with appropriate mitigation measures required to manage these disturbances;
� This Option is the only alignment that bypasses Fortitude Valley, therefore limiting disturbance in built up, multi purpose districts. This Option does, however, pass through (under) Brisbane CBD which will cause disturbance; and
� This Option includes a subsurface river crossing between CBD 1 Station and Woolloongabba Station, potentially resulting in the contamination of surface and groundwater (though unlikely).

Inner City Rail Capacity Study Pre-Feasibility Report
79
The contents of this report do not represent Queensland Transport or State Government policy
Option Impacts Unique to the Option
2026 Option 2 � This Option is the only alignment that is likely to impact communities to the South of the CBD, specifically West End and Hill End, and to the West of the CBD (Toowong and Indooroopilly). During construction, sensitive receivers (such as residents and schools) are likely to be disturbed by noise and dust. Accessibility and visual amenity around the proposed Stations are also likely to be issues during construction;
� This Option includes two subsurface river crossings between CBD 1 Station and South Brisbane Station and between West End Station and Toowong Station, potentially resulting in the contamination of surface and groundwater (though unlikely);
� This Option will require the construction of approximately three new railway stations in areas that are not currently serviced by rail. During construction, the greenfield nature of a number of sites is likely to cause significant community disturbance; and
� This Option impacts the greatest number of sensitive receivers, specifically hospitals. During construction dust, noise, access and visual amenity are likely to be issues.
Option Impacts Unique to the Option
2016 North-South Option
� This Option is the only alignment that is likely to impact communities at Spring Hill and around the Brisbane Exhibition Grounds. During construction, sensitive receivers (such as residents and hospitals) are likely to be disturbed by noise and dust;
� This Option is the only alignment that bypasses Fortitude Valley, therefore limiting disturbance in built up, multi purpose districts. This Option does, however, pass through (under) Brisbane CBD which will cause disturbance; and
� This Option includes a subsurface river crossing between CBD 1 Station and Woolloongabba Station, potentially resulting in the contamination of surface and groundwater (though unlikely).

Inner City Rail Capacity Study Pre-Feasibility Report
80
The contents of this report do not represent Queensland Transport or State Government policy
Option Impacts Unique to the Option
2026 Option 2 � This Option is the only alignment that is likely to impact communities to the South of the CBD, specifically West End and Hill End, and to the West of the CBD (Toowong and Indooroopilly). During construction, sensitive receivers (such as residents and schools) are likely to be disturbed by noise and dust. Accessibility and visual amenity around the proposed Stations are also likely to be issues during construction;
� This Option includes two subsurface river crossings between CBD 1 Station and South Brisbane Station and between West End Station and Toowong Station, potentially resulting in the contamination of surface and groundwater (though unlikely);
� This Option will require the construction of approximately three new railway stations in areas that are not currently serviced by rail. During construction, the greenfield nature of a number of sites is likely to cause significant community disturbance; and
� This Option impacts the greatest number of sensitive receivers, specifically hospitals. During construction dust, noise, access and visual amenity are likely to be issues.
2026 Option 4 and 2026 Option 7
� Options 4 and 7 are very similar in terms of environmental and social impact;
� Both Options 4 and 7 are the only Options that will impact communities at Milton and Auchenflower;
� Both alignments predominantly impact major built up areas (Fortitude Valley, Brisbane CBD [including Roma St] and Milton). Unlike the other proposed Options, options 4 and 7 will only impact fringe communities at Dive Portion locations. Due to the locational characteristics (high density) of where the majority of works will occur, both Options are likely to cause significant disturbance (including decreased access and visual amenity and increased noise and air pollution) during construction; and
� Significant land resumption impacts on the community at Milton and Park Road.
5.9 Costs It will be important to ensure that the development of the infrastructure is undertaken in a manner that is consistent with the high-level environmental benefits being sought. To this end, budgeting should take a whole-of-life perspective and make allowance where necessary for sustainability innovations and sustainable technologies. With sufficient thought, sustainability innovations will save capital and operating expenses, but they may require additional thought and design upfront.

Inner City Rail Capacity Study Pre-Feasibility Report
81
The contents of this report do not represent Queensland Transport or State Government policy
Table 5-4 provides an overview of the costings for the three short-listed options. All estimates for project works between 2008 and 2026 are in 2008 dollars with no allowance for escalation. The lower and upper bound cost estimates quoted for all project works are generally +/- 50% accuracy. The upper bound for the cost estimate is generally considered to have a 50% probability of exceedance based on the current estimated work scope. The probability of exceedance reduces quickly beyond the upper bound such that the probability of a project cost that is equal to (upper bound +50%) is very small.
Table 5-4: Cost overview for short-listed options 2, 4 and 7
Option Value or Characteristic Option 2 Option 4 Option 7
1. Option Total Cost (2016 and 2026)*
$10.5 – $13 billion $9.5 - $12 million $9.5 - $12 billion
2. 2016 Option Cost* $5.5 – $7 billion
3. 2026 Option Cost* $5 – $6 billion $4 – $5 billion $4 – $5 billion
4. Total Approximate Route Length (km – 2016 and 2026)
26km 22km 21.5km
5. 2016 Route Length 10km – Bored length
13.5km - Total length
6. 2026 Route Length 10.5km – Bored length
12.5km – Total length
6.0km – Bored length
8.5km – Total length
5.5km – Bored length
8km – Total length
8. New Underground stations en-route in 2016
Park Road, Woolloongabba, CBD 1(Edward St), Spring Hill, Exhibition 2, Bowen Hills (6 stations)
9. New Underground stations en-route in 2026
Toowong, West End, South Brisbane, CBD 2
(Queen St), Newstead/Valley, Bowen
Hills (6 stations)
Milton, Roma Street, CBD 2 (Queen Street), Newstead/Valley and
Bowen Hills (5 stations)
Milton, Roma Street, CBD 2 (Central
Station), Brunswick Street and Bowen Hills
(5 stations)
5.9.1 Costing basis — major components
The project was separated into four major cost centres to reflect the different nature and uncertainty of works:
� Stations
� Surface connections
� Tunnelling
� Rail systems.
While the exact scope of each cost centre is unknown, the following rationale has been applied.

Inner City Rail Capacity Study Pre-Feasibility Report
82
The contents of this report do not represent Queensland Transport or State Government policy
5.9.1.1 Stations
Stations is the category with the highest level of uncertainty; the final number of stations, the size and location of each station, the size and configuration of surface entry points, the nature of both underground and above-ground constraints, the degree of land acquisition and compensation required, and the impact on surrounding developments — none of these details is exactly known.
However from the pre-feasibility work, a general station size and configuration was identified for all potential station sites; these station sizes and configurations were the basis for costing (see Table 5-5). Because the level of uncertainty at all station sites is similar, the same rationale was applied to each site. The station costing was benchmarked against recently completed stations in Sydney and underground works on the Perth New Metro rail project. The costing for the stations category groups all stations together for a particular route.
The lower cost range is considered be equivalent to a P10 condition and the higher cost range equivalent to a P50. Therefore, there is considered to be a 50% likelihood of the cost not exceeding the upper range. As project development progresses, confidence in this upper range will increase. The next stage of project station development would require discrete concepts to be developed for each location, as well as further needs analysis for each station. Final station concepts will need to be based on a well defined passenger flow resulting from the train service serving the station, the PT interchange function of the station and the station catchment itself.
Table 5-5: Station construction and acquisition costing ($m)
Station Construction of new 2016 station ($ million 2008))
Property acquisition ($ million 2008))
Comment
Park Road $325–$425 $10 Interchange station; cavern
Woolloongabba $325–$425 $40 Interchange station; cavern
CBD 1 $425–$550 $110 Large construction costs due to station location and entry/exit structures; large acquisition costs
Spring Hill $325–$400 $60 Centre-loaded cavern; large acquisition costs due to high land values
Exhibition 2 $325–$400 $25 Cavern; double-end loading assumed
Bowen Hills $250–$300 $65 Cut-and-cover station with impacts at surface; large acquisition cost due to high land values and disruptive construction
Toowong $325–$425 $25 Cavern
West End $325–$425 20 Cavern
South Brisbane $325–$425 $15 Cavern; lower land cost due to government land

Inner City Rail Capacity Study Pre-Feasibility Report
83
The contents of this report do not represent Queensland Transport or State Government policy
Station Construction of new 2016 station ($ million 2008))
Property acquisition ($ million 2008))
Comment
CBD 2 (option 2) $425–$550 $125 Large construction costs due to location and entry/exit locations; very high acquisition costs due to inner-city surface entry structures
Newstead/Fortitude Valley
$200–$225 $50 Large acquisition costs due to estimated surrounding surface acquisition
Milton (options 4 & 7) $225–$250 $10
Roma Street (option 4)
$325–$425 Nil Assumed to use government land only
CBD 2 (option 4) $425–$550 $125
CBD 2 (option 7) $400–$500 $15
Brunswick Street (option 7)
$200–$225 $25 Cut-and-cover; shallow station
* Property Acquisition Costs are indicative only
5.9.1.2 Surface connections
The costing of surface connection points assumes the connection points occur where currently specified in the ICRCS Stage 3 Pre-feasibility Report. The designs represent pre-feasibility concepts and are not fully developed concepts. The cost range and rationale is therefore on a very similar basis to the stations. The lower bound range could be considered as a P10 and the higher range a P50.
5.9.1.3 Tunnelling
The cost of the tunnelling is based on the length acceptability of the routes for each option. The tunnel size is well defined as is the general nature of the tunnelling. There is some uncertainty with regard to the final nature of tunnelling under the river but all other sections of tunnel are expected to be achievable by conventional TBM methods. The cost range for the tunnelling is considered to be P10 to P50. The tunnelling estimate is based on the scope of tunnelling work as defined by the route lengths contained in the ICRCS Stage 3 Pre-feasibility Report. Should any route length change in subsequent work then the tunnelling cost estimate will change accordingly.
5.9.1.4 Rail systems
The rail system costing is very high level and the costing specified is deemed to include all rail systems — traction power, signalling, overhead electrification, communications and train control. There is no cost allowance for a signalling system technology upgrade and the traction power upgrade assumptions have been based on an assumed train operating peak.
The extent of upgrade to the Train Control Centre is not well defined and there is a high level of uncertainty in that regard. Therefore, the lower and upper cost ranges should both be considered at a P10 level. This is because more work needs to be
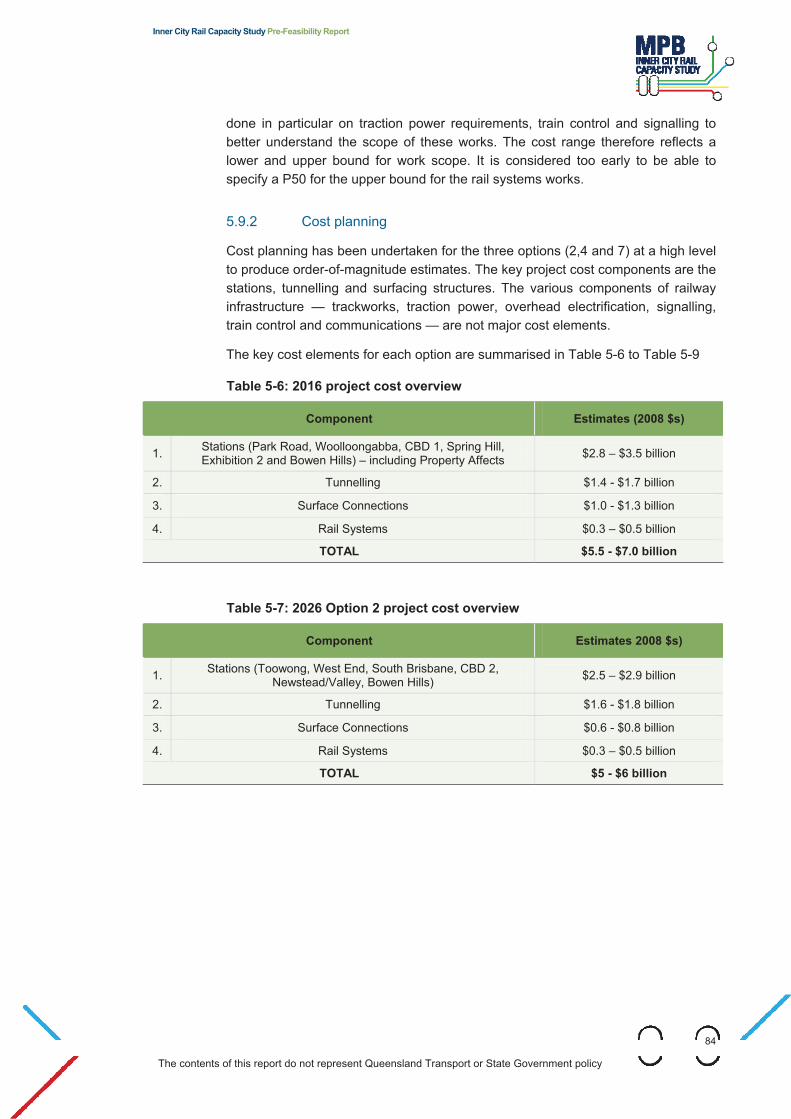
Inner City Rail Capacity Study Pre-Feasibility Report
84
The contents of this report do not represent Queensland Transport or State Government policy
done in particular on traction power requirements, train control and signalling to better understand the scope of these works. The cost range therefore reflects a lower and upper bound for work scope. It is considered too early to be able to specify a P50 for the upper bound for the rail systems works.
5.9.2 Cost planning
Cost planning has been undertaken for the three options (2,4 and 7) at a high level to produce order-of-magnitude estimates. The key project cost components are the stations, tunnelling and surfacing structures. The various components of railway infrastructure — trackworks, traction power, overhead electrification, signalling, train control and communications — are not major cost elements.
The key cost elements for each option are summarised in Table 5-6 to Table 5-9
Table 5-6: 2016 project cost overview
Component Estimates (2008 $s)
1. Stations (Park Road, Woolloongabba, CBD 1, Spring Hill, Exhibition 2 and Bowen Hills) – including Property Affects $2.8 – $3.5 billion
2. Tunnelling $1.4 - $1.7 billion
3. Surface Connections $1.0 - $1.3 billion
4. Rail Systems $0.3 – $0.5 billion
TOTAL $5.5 - $7.0 billion
Table 5-7: 2026 Option 2 project cost overview
Component Estimates 2008 $s)
1. Stations (Toowong, West End, South Brisbane, CBD 2, Newstead/Valley, Bowen Hills) $2.5 – $2.9 billion
2. Tunnelling $1.6 - $1.8 billion
3. Surface Connections $0.6 - $0.8 billion
4. Rail Systems $0.3 – $0.5 billion
TOTAL $5 - $6 billion
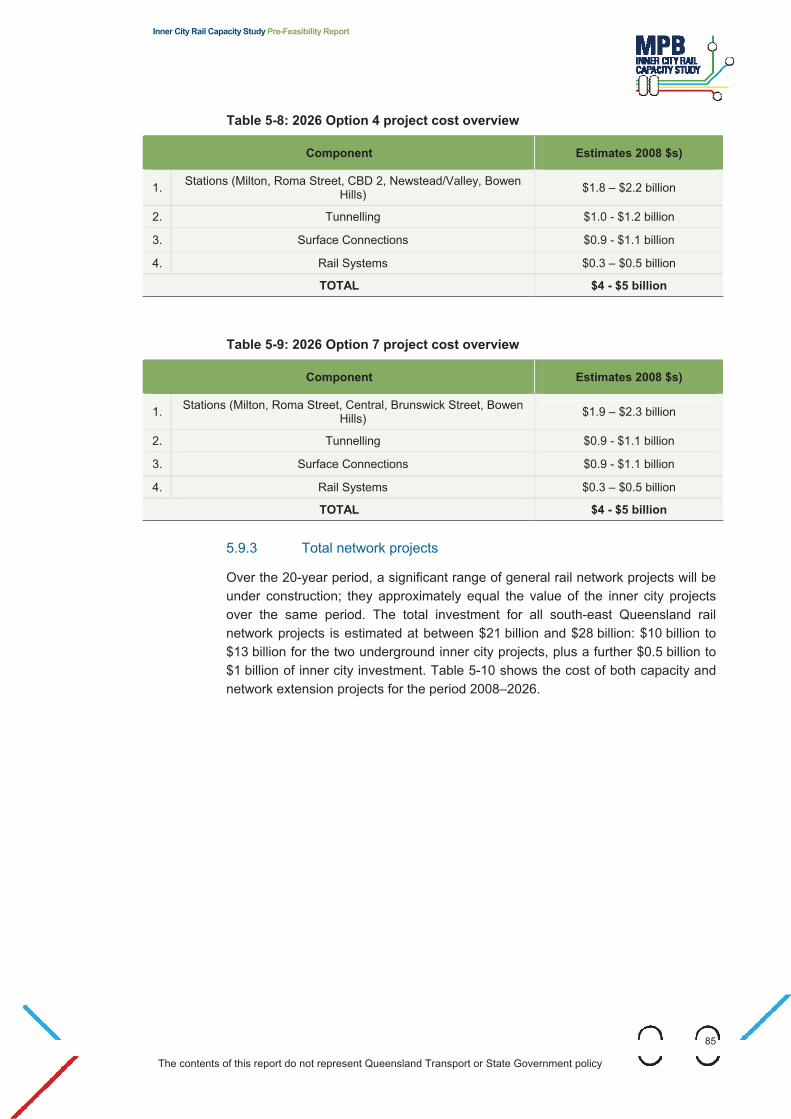
Inner City Rail Capacity Study Pre-Feasibility Report
85
The contents of this report do not represent Queensland Transport or State Government policy
Table 5-8: 2026 Option 4 project cost overview
Component Estimates 2008 $s)
1. Stations (Milton, Roma Street, CBD 2, Newstead/Valley, Bowen Hills) $1.8 – $2.2 billion
2. Tunnelling $1.0 - $1.2 billion
3. Surface Connections $0.9 - $1.1 billion
4. Rail Systems $0.3 – $0.5 billion
TOTAL $4 - $5 billion
Table 5-9: 2026 Option 7 project cost overview
Component Estimates 2008 $s)
1. Stations (Milton, Roma Street, Central, Brunswick Street, Bowen Hills) $1.9 – $2.3 billion
2. Tunnelling $0.9 - $1.1 billion
3. Surface Connections $0.9 - $1.1 billion
4. Rail Systems $0.3 – $0.5 billion
TOTAL $4 - $5 billion
5.9.3 Total network projects
Over the 20-year period, a significant range of general rail network projects will be under construction; they approximately equal the value of the inner city projects over the same period. The total investment for all south-east Queensland rail network projects is estimated at between $21 billion and $28 billion: $10 billion to $13 billion for the two underground inner city projects, plus a further $0.5 billion to $1 billion of inner city investment. Table 5-10 shows the cost of both capacity and network extension projects for the period 2008–2026.

Inner City Rail Capacity Study Pre-Feasibility Report
86
The contents of this report do not represent Queensland Transport or State Government policy
Table 5-10: Expected cost of network projects 2008–2026
Cost ($m) Period Project location
Lower bound Upper bound
2008–2015 Inner city 6,210 8,020
Outer city 4,550 7,070
Total 10,760 15,090
2015–2022 Inner city 4,000 6,000
Outer city 3,950 5,700
Total 7,950 11,700
2022–2026 Inner city 150 200
Outer city 100 200
Total 250 400
Totals
2008–2026 Inner city 10,360 14,220
Outer city 8,600 12,970
Total 18,960 27,190
Network expansion projects that do not assist in system capacity comprise a significant proportion of the forecast expenditure, accounting for $5.2 billion to $7.3 billion of projects between 2008 and 2026.
Table 5-11: Most expensive network capacity projects
Darra to Ipswich triple tracking (2020) $800m–$1,000m
Fairfield to Banoon fourth track (2015) $400m–$600m
Northgate to Bowen Hills fifth track (2015) $350m–$550m
Park Road grade separation (2010–2015) $350m–$400m
Corinda grade separation (2026) $300m–$400m
5.10 Summary The three short-listed or preferred options (options 2, 4 and 7) all consist of two major project components — a 2016 component that joins the southern and northern corridors of the network, and a 2026 component that joins the western and northern corridors of the network. Each major project component of each short-listed option incorporates a new CBD station (i.e. one new CBD station in 2016 and a second one in 2026).
The desktop pre-feasibility assessment conducted in Stage 3 found all three short-listed options to be technically feasible. However, city-wide impact and investment

Inner City Rail Capacity Study Pre-Feasibility Report
87
The contents of this report do not represent Queensland Transport or State Government policy
determination of a preferred option will require further detailed analysis. This is beyond the scope of the current study.
Some adjustments in alignments and station locations were required in Stage 3 from the initial Stage 2 alignments, mostly to minimise the impacts of constraints (e.g. North–South Bypass Tunnel (NSBT) and the S1 sewer). However, the basic station locations and number of stations remained unchanged from Stage 2.
All options impact on the built environment at many points - particularly at station sites and at the locations where the tunnel systems surface.
All options are similar in scale and magnitude of infrastructure required. The dominant cost impact is the underground stations. Therefore, although the stations have been sited in response to anticipated land use and/or public transport demands, the need for each station must be carefully considered in future detailed planning.
Additional work was also performed to assess the feasibility of duplicating capacity at the Merivale Bridge to reduce the need for tunnelling and underground systems. Although the cost of this option was found to be up to 50% lower than short-listed Options 2, 4 and 7, the Merivale Bridge option was found to have very restricted ability to expand surface stations and the inability to create appropriate underground stations would affect the ultimate capacity of this option. The build constraints for this option were also considered severe and limit the flexibility of the route. Also, without a detailed survey and substantial design development work, its feasibility can’t be guaranteed.
An assessment was also performed on the feasibility of a 2016 alignment that travels through the Newstead/Fortitude Valley area rather than Spring Hill. This route appears to be possible but more detailed consideration may be required at the CBD, particularly in relation to subsurface constraints as a result of a very tight alignment in the CBD. If this alignment were chosen for 2016 substantial design development work would then be required to assess the issues associated with a 2026 via Spring Hill and the resultant final alignment and station locations.

Inner City Rail Capacity Study Pre-Feasibility Report
88
The contents of this report do not represent Queensland Transport or State Government policy
6. Network master plan
The Rail Network Master Plan identified the indicative projects, estimated costs, general staging and timing for future development options for the inner city rail network and the overall greater south-east Queensland network, based on high-level rail operational analysis and high-level engineering assessment.
The requirement and costs identified for these projects needs to be confirmed through more detailed rail operational and engineering assessment. Costs identified may not be consistent with those identified in SEQIPP, given the more advanced project planning and cost estimation for specific projects.
The master plan consists of rail system enhancement projects based upon:
� SEQIPP 2007 project listing
� public transport patronage modelling
� rail operations analysis based on forecast patronage demand through 2026 and specific train loading assumptions
An essential component of the master plan is service reliability and elimination of conflicting train moves.
The indicative timing of projects is as follows:
� rail projects: 2008–2015
� first new inner city projects: 2015
� rail projects: 2015–2022
� second new inner city projects: 2022
� rail projects: 2022–2026.
The master plan provides a full overview of the expected projects on the network and gives indicative cost ranges for projects, by corridor as well as for the inner city. It includes both network capacity projects and network expansion projects.
Business cases for the various projects will need to be developed.

Inner City Rail Capacity Study Pre-Feasibility Report
89
The contents of this report do not represent Queensland Transport or State Government policy
6.1 Master plan: projects and costs 2008 – 2026
2008 – 2015 Rail projects Cost
ALL Projects (Capacity Projects plus network extensions)
Lower Bound$ mil
Upper Bound$ mil
Inner City
Park Road Grade Separation 350 450
New connection Mayne Yard to Ferny Grove 10 20
New Tunnel: Park Road to Bowen Hills 5,500 7,000
Inner City Sub-Total 5,860 7,470
Supporting Approach Corridor Upgrade Projects
Beenleigh Line
4th track between Fairfield and Banoon 400 600
Ipswich Line
4th Track Corinda to Darra 30 50
North Coast Line
5th track between Northgate and Bowen Hills 350 550
Ferny Grove
Duplication: Keperra to Ferny Grove 50 100
Supporting Approach Corridor Upgrade Projects Sub-Total 830 1,300
Outer City Projects
Cleveland Line
Duplication of Cleveland to Ormiston 50 100
Additional Stabling Thorneside 10 20
Duplication of Wellington Point to Birkdale 50 100
Duplication Lota to Manly 50 100
Two additional Duplications 100 200
Remainder of Duplications 100 200
Cleveland Line Sub-Total 360 720
Beenleigh Line
4th platform: Kuraby 20 50
New platform at Beenleigh or stabling re-arrangement 10 20
Triplication: Kuraby to Kingston 200 300

Inner City Rail Capacity Study Pre-Feasibility Report
90
The contents of this report do not represent Queensland Transport or State Government policy
2008 – 2015 Rail projects Cost
Triplication: Kingston to Loganlea 50 100
Triplication: Loganlea to Bethania 50 100
Stabling at Clapham 20 30
Triplication: Bethania to Holmview 50 100
Beenleigh Line Sub-Total 400 700
Gold Coast Line
Duplication: Coomera to Helensvale 100 200
Varsity Lakes to Elanora (Robina to Varsity Lakes underway now) 800 1000
Additional stabling at Robina (included in work underway now) 0 0
Gold Coast Line Sub-Total 900 1,200
Ipswich Line New Spur Line - Darra to Richlands 300 400 New spur extension - Richlands to Springfield 300 400 Stabling at Ipswich or Rosewood 20 50 Stabling at Redbank 20 50 Ipswich Line Sub-Total 640 900
North Coast Line New turnback neck or stabling modifications at Caboolture 10 20 Additional stabling at Caboolture 10 20 Triplication: Lawnton to Petrie 50 100 Beerburrum to Landsborough duplication 200 300 Additional platform at Nambour 20 50 Additional stabling at Nambour 10 20 Additional stabling at Petrie 10 20 Beerwah to Caloundra Double Track 1000 1500 North Coast Line Sub-Total 1,310 2,030 Ferny Grove Ferny Grove Sub-Total 00 00 Shorncliffe Line Duplication: Sandgate to Shorncliffe 50 100 Stabling at Banyo 10 20 Shorncliffe Line Sub-Total 60 120 Total Inner City : 2008 - 2015 5,860 7,470Total Approach Corridor Upgrade Projects : 2008 - 2015 830 1,300Total Outer City : 2008 - 2015 3,670 5,670 TOTAL Network : 2008 - 2015 10,360 14,440

Inner City Rail Capacity Study Pre-Feasibility Report
91
The contents of this report do not represent Queensland Transport or State Government policy
NOTE*A The Park Road grade separation is given a range of possible years because there is the possibility to enable a northbound Cleveland train to cross a southbound Cleveland train at the Park Road junction and thus minimize the paths lost by conflicts on the Beenleigh/Gold Coast Line. However, that timetabling technique would depend on the existence of the doubling of tracks to Cleveland as identified in “Outer City Projects” below. Ultimately for reliability, it is better not to rely on such a tight timetable detail, so eventually both double track to Cleveland and Park Road grade separation will be required.
2016-2022 Rail Projects ALL Projects
ALL Projects Cost ($ million)
(Capacity Projects plus network extensions) Lower Bound
Upper Bound
Inner City
Inner City New Tunnel (Ipswich Line to North Coast Line) 4,000 6,000
Inner City Sub-Total 4,000 6,000
Supporting Approach Corridor Upgrade Projects
5th track between Corinda and Tennyson Loop for freight 10 20
Supporting Approach Corridor Upgrade Projects Sub-Total 10 20
Outer City Projects
Cleveland Line
Third Track Manly to Cannon Hill 100 200
Dual gauging and extension of Murarrie refuge loop 10 20
New refuge loop near Lytton Junction 10 20
Cleveland Line Sub-Total 120 240
Beenleigh Line
Triplication: Holmview to Beenleigh 50 100
Gold Coast Line
Extension Elanora to Coolangatta 800 1000
Ipswich Line
Triplication: Darra to Ipswich 800 1000
Corinda Stabling 10 20
Ipswich Line Sub-Total 810 1,020
North Coast Line
Triplication - Burpengary to Caboolture 100 200
Caloundra to Maroochydore Double Track 2,000 3,000
North Coast Line Sub-Total 2,100 3,200

Inner City Rail Capacity Study Pre-Feasibility Report
92
The contents of this report do not represent Queensland Transport or State Government policy
2016-2022 Rail Projects ALL Projects
Ferny Grove
New crossover beyond station for additional turnbacks 10 20
Shorncliffe Line (NIL Works) 0 0
Total Inner City: 2016 – 2022 4,000 6,000
Total Approach Corridor Upgrade Projects : 2016 – 2022 10 20
Total Outer City: 2016 – 2022 3,890 5,580
TOTAL Network: 2016 - 2022 7,900 11,600
2023-2026 Rail Projects ALL Projects
ALL Projects Cost ($ million)
(Capacity Projects plus network extensions) Lower Bound
Upper Bound
Inner City
5th track Milton-Roma Street (Exhibition loop) 150 200
3rd track in Exhibition loop 250 400
NOTE: The two Exhibition Loop projects above are required under the worst case scenario of 3-times current freight and short freight train lengths.
Inner City Sub-Total 400 600
Supporting Approach Corridor Upgrade Projects
Grade separation Yeerongpilly 150 200
Grade Separation Corinda 350 450
Additional refuge loop for freight in Tennyson Loop 10 20
Signalling Projects for 2-minute headways (not costed)
Cleveland Line Park Road to Cannon Hill nc nc
Gold Coast Line nc nc
Ipswich Line Darra to Roma St nc nc
Ferny Grove Line Alderley to Bowen Hills nc nc
Supporting Approach Corridor Upgrade Projects Sub-Total 510 670
Outer City Projects
North Coast Line
Triplication:Petrie to Narangba 100 200

Inner City Rail Capacity Study Pre-Feasibility Report
93
The contents of this report do not represent Queensland Transport or State Government policy
2023-2026 Rail Projects ALL Projects
Triplication:Narangba to Burpengary 50 100
Outer City Projects Sub-Total 150 200
Total Inner City: 2023-2026 400 600
Total Approach Corridor Upgrade Projects: 2023-2026 510 670
Total Outer City: 2023-2026 150 300
TOTAL Network: 2023 - 2026 1,060 1,570

Inner City Rail Capacity Study Pre-Feasibility Report
94
The contents of this report do not represent Queensland Transport or State Government policy
7. Issues and Conclusions
7.1 Stage 2 – Issues and Conclusions Over the next 20 years there will be significant growth in patronage on the SEQ rail network. This growth will result from population increases and changes in travel behaviour caused by factors such as increased petrol prices, traffic congestion, parking prices and environmental awareness. The resultant increase in rail traffic on the rail network will be felt most keenly on the inner city network. Capacity constraints on this part of the network mean that one new two track corridor will be required by 2016 and another two-track corridor by 2026.
Construction of these new corridors provides a ‘city building opportunity’ because of the impact the rail network can have on the land use pattern in the inner city.
The demand modelling and the rail operations analysis confirmed that two additional corridors/river crossings (or four additional tracks) are required by 2026. This includes one corridor (or two additional tracks) from the south by 2016, and another corridor (or two additional tracks) from the west by 2026. If QR’s existing 6-car set operations continue, the modelling forecasts a tripling of today’s inner city train numbers; where peak hour trains are expected to climb from 52 trains per hour to 141 trains per hour.
The ‘base case’ and ‘options’ modelling assumed fuel prices would remain constant in real terms. Sensitivity testing using the multi-modal transport model included the impact of fuel price increases. It demonstrated that public transport patronage would increase by about 30% under a scenario where fuel prices increased by 100% in real terms; hence any significant increase in fuel price (e.g. continued fuel price increases associated with ‘peak oil’) will place additional demand for rail rollingstock and network capacity.
In addition, the ICRCS study team examined the role and hierarchy of heavy rail in Brisbane and south-east Queensland. We concluded that heavy rail primarily provides for suburban and regional journeys to and from the CBD. In the AM and PM peaks, these journeys are predominantly commuter journeys to and from work. The system is not a mass transit system like Hong Kong or London, and this will not change over the next 20 years as the existing and planned distribution of population and jobs will maintain strong demand for an excellent suburban rail network to meet continued long journey demand.
In terms of a future possible metro, the team concluded that such a system is not necessary to fulfil the primary objective of this study, namely, to resolve the capacity constraints of the heavy rail system through the inner city. The network concept options are needed to provide additional train paths through the inner city by 2016 and 2026 for commuters across south-east Queensland, like those at the

Inner City Rail Capacity Study Pre-Feasibility Report
95
The contents of this report do not represent Queensland Transport or State Government policy
Gold Coast, Ipswich and northern suburbs, and less so to distribute commuters across the CBD and frame.
The approach taken to options development and selection adopted in this study involved: identifying numerous possible network concepts; selecting ’10 preferred’ options for further assessment against agreed criteria, elimination of these ‘10’ options to ‘6’ options for detailed assessment, and finally the identification of a short-list of ‘3’ options to be recommended for detailed technical feasibility assessment in Stage 3.
The report details the assessment and evaluation framework and the evaluation criteria adopted for the study – which were refined and improved for both relevancy and appropriateness as the project developed. These evaluation criteria were developed based on the Stage 1 report, review of previous studies, workshops with stakeholders, and detailed technical review by the team. These evaluation criteria were then used to progressively short-list the options to a final ‘3’ options.
For the assessment of options, a multi-criteria assessment (MCA) was conducted for both the ’10 to 6 options’ elimination phase and the assessment of ‘6 options’. The MCA was applied across the disciplines of land use, transport planning, rail operations, engineering, environment and finance/economics with associated criteria. Each of the detailed weightings, MCA scores and ranks of options, as well as sensitivity tests conducted, are described in the respective chapters for each of the option evaluation phases.
All ‘10 preferred’ options which progressed through the Stage 2 process addressed the following:
� Connection to significant land use and transit oriented development (TOD) opportunities in locations like a new CBD station (southern end), Fortitude Valley, Spring Hill, Woolloongabba, etc.
� Integrate and improve public transport connectivity with station integration at such existing rail and busway stations as Bowen Hills, Park Road, Milton, Woolloongabba, South Brisbane and Central station.
� Meet engineering requirements for constructability, QR system requirements (rollingstock, gradients, curvature, station lengths, etc), integration with existing network conditions, etc.
� Achieve rail capacity network addition requirements for significant growth in expected patronage into the inner city and particularly growth from the southern corridor (Beenleigh, Gold Coast), western corridor (Ipswich) and northern corridor (Caboolture, Sunshine Coast) to achieve required capacity additions for 2026.
� Environmental standards for new major infrastructure including no unacceptable impacts.

Inner City Rail Capacity Study Pre-Feasibility Report
96
The contents of this report do not represent Queensland Transport or State Government policy
7.1.1 Key Findings for Stage 2
There are four new tracks in two new corridors required to meet the approximate 170% forecast growth in rail capacity demand to 2026 (from 52 trains in 2006 to 141 trains forecast for 2026).
After detailed options development and evaluation, servicing the inner city and achieving integrated land use, public transport and viable engineering options produced some excellent but relatively limited number of options, partially due to a number of constraints including:
� the relatively small footprint area of Brisbane’s CBD (relative to other major cities)
� the significant impact of the river on crossing points, required tunnel depth and station/ land use development opportunities
� rail engineering (vertical and horizontal) alignment standards
� the desire to integrate rail network additions to significantly enhance Brisbane’s future public transport system.
The major addition of rail network corridors envisioned in this study is a ‘city transforming’ exercise and presents significant opportunity for Brisbane to become a world class city in its provision of a fully integrated public transport network. The multi-billion dollar investment required to meet forecast rail capacity demand is clearly a challenge but also presents tremendous opportunity for Brisbane’s future.
Overall, the three recommended options for Stage 3 technical pre-feasibility review (Options 2, 4 and 7) all have one southern corridor approach via a new ‘south’ CBD station and continue north to connect at Bowen Hills, with a second western corridor approach via the inner city and also connecting at Bowen Hills. There are differing alignments for each of these options. All three recommended options include reasonably deep tunnels under the Brisbane river (and associated new underground inner city stations).
The Stage 2 analysis raises a number of important issues (and associated recommendations) including:
� Scale of the infrastructure required – patronage modelling forecasts significant demand on the rail network over the next 20 years. Given the scale of demand and the scale, cost and timeframe of the infrastructure required to respond to it, the need to find cost effective ‘lead up’ projects to delay this investment is considered to be of critical importance.
� Time for infrastructure required – operational solutions and initiatives should be considered to delay the timing of the required delivery of the major new corridor(s), for example, dwell time management at stations.
� Cost of infrastructure required – the report recommends that due to the multi-billion dollar investment a perceived ‘lower cost’ option for a bridge (and tunnel) adjacent to the Merivale bridge should be further assessed from an engineering perspective to determine technical feasibility and an estimated (order of magnitude) cost.
Inner City Rail Capacity Study Pre-Feasibility Report
97
The contents of this report do not represent Queensland Transport or State Government policy
� Government risk on preferred options – to address the possible risk that viable and valid options might be discarded too early, the report recommends further exploration of an alignment which services Fortitude Valley/Newstead in 2016 (as all three short-listed options do not service Fortitude Valley until 2026).
� TOD opportunities and ‘low station loadings’ – from the transport modelling work conducted in Stage 2, there were reasonably low forecast station loadings for many of the new identified ICRCS stations when compared to existing station patronage. Further investigation of possible increases in land development were explored to gain further insight into potential improvements and TOD opportunities to these low station patronage levels. The results are presented below in section 7.2.5.
� Other government studies – there are a number of government bodies and agency studies which are either about to begin, currently underway, or recently completed for transport and land use in the inner city. The team recommends improved integration and engagement between relevant government studies and the ICRCS study, including the BACIC study and the ULDA site development planning.
� Financial and Economic analysis – the findings of the financial and economic assessment indicate an estimated overall preliminary project NPV of approximately $35b.
7.2 Stage 3 – Issues and Conclusions
7.2.1 Basis for definition of infrastructure
It is important to understand the basis for the ICRCS Stage 3 assessment. The scope and timing of the infrastructure works is based on today’s above rail track “operational paradigm” of train operations including existing train sizes and system performance characteristics, as per agreed project scope. The scope of the infrastructure forecast for ICRCS Stage 2 and 3 over the next 20 years thus relies and is based upon this key assumption of current “operational paradigm”. In reality a combination of above rail and below rail enhancements will lead to overall capacity improvements over the next 20 years.
The scope of the infrastructure presented in Stage 3 could therefore be considered a worst case scenario for infrastructure requirements to meet forecast patronage demand.
For example, the timing of all projects are based on six-car train set operation and assume no discrete improvement in capacity or reliability as a result of any above rail initiatives such as dwell time improvements at stations. Greater passenger numbers will put more pressure on dwell times. Numerous system improvements could be pursued to reduce dwell times and improve network capacity (station design, rollingstock design, platform management and driver management, etc). Therefore as an example, there would appear to be potential for alternative operational improvements which could/would improve system capacity.
Inner City Rail Capacity Study Pre-Feasibility Report
98
The contents of this report do not represent Queensland Transport or State Government policy
The timing of required capacity increases including the major new inner city corridor projects will be influenced by the above assumptions.
7.2.2 Summary of short-listed options
During the concept development phase, new rail corridors were forecast as being required in 2016 and 2026.
The three short-listed options were all found to be technically feasible based on the desktop Pre-Feasibility assessment conducted in Stage 3. It is important to note that the objective of Stages 2 and 3 of the ICRCS are not to determine a preferred option or to have carried out sufficient detailed investigations to allow this to occur. As would be expected in a study of this magnitude, city wide impact and investment determination of a preferred option will require further detailed analysis beyond the scope of this current study.
Some adjustments in alignments and station locations were required in Stage 3 from the initial Stage 2 alignments; most of these adjustments were made to minimise the impacts of constraints (eg North South Bypass Tunnel (NSBT) or the S1 Sewer). However, the basic station locations and number of stations remained unchanged from Stage 2.
All estimates for project works between 2008 and 2026 are in 2008 dollars with no allowance for escalation. The lower and upper bound cost estimates quoted for all project works are generally +/- 50% accuracy.
The most expensive option – Option 2, is the longest and provides for six additional underground stations in 2026. The ‘cheapest’ option – Option 7, provides five new stations in 2026. However in 2026, Option 7 provides no new land use development, PT opportunities or any new servicing of the rail network into the CBD.
In terms of impact on the built environment there are many points of impact at all station sites and at the locations where the tunnel systems surface.
The dominant cost impact of all options is the underground stations and it is recommended that the need for each of these stations needs to be carefully considered in subsequent detailed planning. The stations have been sited in response to anticipated land use and/or PT demands.
The ICRCS did not undertake an assessment of the provision of additional underground stations subsequent to commissioning of the underground system.
7.2.3 Other network projects
Over the “20 year period” there is a significant range of other network projects.
The other network projects are based on two key criteria:
1. The projects required to meet capacity requirements as determined by demand modelling and rail operations modelling and

Inner City Rail Capacity Study Pre-Feasibility Report
99
The contents of this report do not represent Queensland Transport or State Government policy
2. The SEQIPP 2007 plan of rail projects with approximate timeframes for commissioning.
These general network-wide projects are approximately equal in investment to the Inner City Projects over this period. The total investment for all SEQ rail network projects is estimated at between $21 and $28 billion of which $10 - $13 billion are the two underground inner city projects with a further $0.5 - $1 billion of inner city investment.
7.2.4 Overview of investigations of additional inner city options
7.2.4.1 Merivale Bridge/Tunnel Option
This option was assessed as a potential lower cost option, and to address the perception that a bridge duplication would address capacity requirements.
Further preliminary concept engineering review was undertaken for this option as a potential lower cost cross river option for 2016. The concept engineering determined a potential option that consisted of a tunnel on the north-side of the river and surface railway on the south-side. The north-side design for the project has identified numerous substantial constraints. Although preliminary findings appear to present a possibly feasible alignment, without detailed survey in all areas on the north-side the design is not a guaranteed solution. There are extremely tight clearances in and around the Inner Northern Busway and Countess Street areas that can only be confirmed by detailed survey and substantial design development work.
Particular key technical aspects of the project include underground stations of limited size at Roma Street and Central that could be considered sub-standard as CBD stations and reduced platform widths at South Brisbane and South Bank when the stations have been expanded to four platform stations.
Property impacts are significant for this option on both sides of the river – particularly the north-side. In addition, no environmental assessment has been made of this option.
The order of magnitude of cost for this option is believed to be $3.5 - $4 billion, which is approximately 50 – 67% of the cost of the other major 2016 tunnel options. A key caveat on this option is its inability to provide a major bus-rail interchange node on the south-side of the river (i.e. there is no connection at Woolloongabba as with the other preferred short-listed options). The significance of this shortfall needs to be considered against other options. In addition, as outlined in Stage 2, a Merivale bridge duplication option does not have any additional land use development or value capture opportunities.
7.2.4.2 Option via Newstead/Fortitude Valley Station in 2016
There is a desire to ascertain if there is a feasible option for 2016 to Newstead/Fortitude Valley. The reason this route was assessed was to mitigate the risk that only one 2016 route to Spring Hill was being assessed, given it was common to the three endorsed options as a result of Stage 2 work. To mitigate that

Inner City Rail Capacity Study Pre-Feasibility Report
100
The contents of this report do not represent Queensland Transport or State Government policy
risk, and given Option 3 was the fourth ranked option, it was decided to assess the Option 2016 route which was not common to the three endorsed options.
A technical pre-feasibility assessment has been undertaken for a 2016 tunnel option that goes via a North-South route from the CBD to a proposed Newstead/Valley Station. No such route was examined as part of the main short-listed three options assessment although it was identified at the end of Stage 2 that such a route may be desirable in 2016 to better meet development opportunities in Fortitude Valley as opposed to a Spring Hill alignment. The technical pre-feasibility assessment confirmed that the major constraint was at the CBD end of the alignment. The route through to Newstead/Valley beyond the CBD appears to be viable but some more detailed consideration may be required at the CBD, particularly for sub-surface (building) constraints.
In terms of a 2026 alignment – the Option 2 alignment to Spring Hill is compatible with this Newstead/Valley route alignment with a change to the northern section of the CBD route via Spring Hill. A deep skew station would result and this would need to be positioned to avoid particularly tall future building developments (i.e. � 40 storeys).
7.2.4.3 Exhibition Loop Daylighting
A technical pre-feasibility assessment has been undertaken for a 2016 tunnel option that goes via a North-South route from the CBD and surfaces south-west of Bowen Hills on the Exhibition Loop. The work considered built infrastructure constraints, connectivity issue/s to the existing network, and particularly the interface with the Albion – Northgate corridor. The main purpose of this assessment was to attempt to shorten the length of tunnelling in 2016. However this outcome was only possible if Spring Hill Station, Exhibition 2 Station and Bowen Hills Station were not to form part of the 2016 project. It is also important to re-iterate that the length of tunnelling does not dominate the project cost and therefore the actual overall project saving would not be significant in any event.
7.2.5 TOD Opportunities and low station loading
As a result of transport patronage modelling in Stage 2, a number of proposed stations showed relatively low boarding and alightings. As a means of investigating rail patronage changes at some of these stations, increases in Transit Oriented Development potential (employment and residential population) were estimated for seven station areas. The results of this TOD sensitivity test show reasonably significant outcomes:
� Significant increases in daily rail patronage (+5.6%) and slight decreases in bus patronage (-2.1%) with an overall increase in total public transport system patronage of 1.2%
� A number of the stations show significant increases in peak period rail boardings and alightings with the highest increases at Bowen Hills, Fortitude Valley, Gregory Terrace (RBH) and West End Riverside stations
� Some stations receive higher response in rail patronage with relative changes in employment and population.

Inner City Rail Capacity Study Pre-Feasibility Report
101
The contents of this report do not represent Queensland Transport or State Government policy
� Results suggest that Fortitude Valley, Woolloongabba and Gregory Terrace showed the most positive results in response to the TOD sensitivity test
As the project moves forward, there will be a need to determine the viability or “business-case” justification for investment in underground stations (and corridors), and land value capture and land development opportunity should form part of the investment “equation” to ensure maximum opportunity for rail patronage and TOD/station land development integration.
7.2.6 Integration with other government studies
A number of meetings and workshops, as well as general information sharing, have been conducted with other government studies to integrate understanding as well as assumptions where possible.
The ICRCS options are generally compatible with the outcomes of bus capacity studies both in terms of general interchange assumptions between the rail and bus systems (through shared transport modelling assumptions) and through common key inner city bus-rail interchange locations (e.g. Park Road, Woolloongabba and Bowen Hills).
With respect to the Bowen Hills ULDA area, the new underground rail station designs have been provided to ULDA to inform the master planning of the site; in addition results of the low station loadings exercise and subsequent workshops have also ensured maximum integration.
7.3 Overall corridor recommendations As a result of the complete study investigation to date, the MPB team would recommend that QT proceed with the next stage of corridor assessment and selection exploring three corridors for 2016 (A, B and C) and three complementary corridors for 2026 as outlined below (D, E and F).

Inner City Rail Capacity Study Pre-Feasibility Report
102
The contents of this report do not represent Queensland Transport or State Government policy
Table 7-1 Recommended corridors for further investigation
Option Name Timing and Corridor Direction
Brief route description Reference to Options comment
A 2016
(North South)
Park Rd – CBD – Spring Hill – Bowen Hills
The same as 2016 route for Options 2, 4, and 7
B
(via Newstead)
2016
(North South)
Park Rd – CBD – Newstead – Bowen Hills
Similar to Option 3
C
(via Merivale Bridge/ Tunnel)
2016
(North South)
Park Rd– Merivale Bridge – Bowen Hills
Lower cost option (Option 10)
D 2026
(East West)
Toowong – CBD – Newstead – Bowen Hills
Same as Option 2 for 2026
E 2026
(East West)
Toowong – CBD – Newstead – Bowen Hills
Same as Option 4 for 2026
F 2026
(East West)
Toowong – CBD – Newstead – Bowen Hills
Same as Option 7 for 2026
These are broadly shown in the maps below (see Figure 7-1 and Figure 7-2).

Inner City Rail Capacity Study Pre-Feasibility Report
103
The contents of this report do not represent Queensland Transport or State Government policy
Figure 7-1: 2016 Options A-B-C

Inner City Rail Capacity Study Pre-Feasibility Report
104
The contents of this report do not represent Queensland Transport or State Government policy
Figure 7-2: 2026 options D-E-F

Inner City Rail Capacity Study Pre-Feasibility Report
105
The contents of this report do not represent Queensland Transport or State Government policy
7.4 Project risks going forward
7.4.1 Patronage Modelling
Estimates of patronage and passenger flows, and hence demand for new rail infrastructure, has been based on outputs from the strategic Zenith transport model. While this model has been validated to a high degree on known 2006 data, the accuracy of the model in predicting future years relies heavily on a number of key assumptions about predicting human behaviour. If these assumptions do not remain true in the future, then there is the risk that the model may over or under predict future train patronage.
Three key assumptions were identified as risks for this project in terms of rail patronage findings:
� city shape (population and employment projections and distributions)
� fuel price changes
7.4.1.1 City shape and future development patterns
At the start of the ICRCS stage 2, extensive discussions took place with various stakeholders, including the Office of Urban Management (now part of Department of Infrastructure and Planning), to determine what would be the most appropriate ‘future case’ to assume for the size and shape of future SEQ. Following these discussions the decision was made to adopt future projections developed by PIFU and NIEIR (see section 3.1).
The question (and thus risk for the project) that this decision raises is, are there realistic alternative assumptions that could be taken for future demographic projections and land use growth, and if so, would this change the type, location or timing of the proposed new infrastructure (corridors and stations).
The results of this TOD sensitivity test show the following reasonably significant outcomes:
� significant increases in daily rail patronage (+5.6%) and slight decreases in bus patronage (-2.1%), with an overall increase in total public transport system patronage of 1.2%
� at a number of the stations, significant increases in peak period rail boardings and alightings, with the highest increases at Bowen Hills, Fortitude Valley, Gregory Terrace (RBH) and West End Riverside stations
� at some stations, higher response in rail patronage with relative changes in employment and population
� a small drop in patronage at CBD stations, reflecting decreased employment in those areas
These findings confirm that a moderate change to Brisbane CBD form to encourage less central and more fringe CBD development increases the demand

Inner City Rail Capacity Study Pre-Feasibility Report
106
The contents of this report do not represent Queensland Transport or State Government policy
for the proposed new stations, without significantly changing the need for CBD station capacity.
As the project moves forward, there will be a need to determine the viability or business-case justification for investment in underground stations (and corridors); land value capture and land development opportunity should form part of the investment equation to ensure maximum opportunity for rail patronage and TOD/station land development integration.
Overall city form
In Stage 1 workshops and at various stages through the project, discussions identified that Brisbane might develop in a very different pattern from what is planned in the SEQ Regional Plan, and different to what was forecast by NIEIR and PIFU. This might take place as a form of ‘nodes and corridors’ development, with very strong employment growth in locations such as Ipswich, Mount Gravatt and Chermside and considerably less growth in the traditional Brisbane CBD. Or conversely a more “sprawling” pattern of development could occur. This type of development could create a very different city shape and thus very different transport demands.
Although beyond the scope of this study, some sensitivity tests on more general SEQ wide land use development scenarios would be useful to determine the impact on demand for rail patronage and associated corridor need.
7.4.1.2 Fuel prices
The ICRCS assumes that petrol prices would remain constant in real terms. That is, this assumes that the cost of driving relative to the cost of taking public transport would remain the same through the forecast period.
Increases in fuel prices could have a reasonably dramatic impact on public passenger transport. To test the sensitivity of fuel price increases on passenger rail demand a fuel price increase of 50% to 2016 and 100% to 2026 in real terms was conducted.
The key findings of these tests are shown in Figure 7-3 below, and clearly indicate that the need for additional infrastructure would be brought forward by a number of years with higher fuel prices (note similar patronage levels forecast for the ‘base’ forecast for 2026 were achieved in the ‘fuel sensitivity’ case five years earlier or by about 2020).

Inner City Rail Capacity Study Pre-Feasibility Report
107
The contents of this report do not represent Queensland Transport or State Government policy
Figure 7-3: Impacts of fuel price rises on patronage
If high fuel prices were maintained for a long period of time, it is likely people would either move house or move jobs to decrease the cost of their travel. Further assessments may be warranted to test such scenarios in the future.
7.4.2 Engineering and operational feasibility
7.4.2.1 Engineering
The work done to date is almost entirely desk-top with some limited site visits at specific locations to examine engineering constraints. As such the work is completed at a Pre-Feasibility level. The engineering investigations have determined what appear to be viable tunnel routes, surface connection points and station locations. There are engineering scope risks associated with the project as outlined below:
� Built Infrastructure Constraints – No site investigations were undertaken and no detailed examination of individual building records was undertaken at this Pre-Feasibility level and there may be as yet undetermined constraints along the proposed project.
� Extent of Station Infrastructure – the full built environment constraints can only be accurately mapped after detailed station concept designs which will be undertaken in the next phases of the project.
� Geotechnical mapping has been based on available data and not specifically verified.

Inner City Rail Capacity Study Pre-Feasibility Report
108
The contents of this report do not represent Queensland Transport or State Government policy
� Track arrangements at surface connection points need detailed planning to ensure they can be implemented at the desired locations.
� Construction staging is a risk in terms of timing of the overall project.
7.4.2.2 Operational
The key operational risk is a drop in service quality, particularly on-time reliability (i.e. punctuality) due to factors such as disruption during construction. The construction of the projects throughout the network will affect the daily operations and will add more pressure, which in turn will result in disrupted rail service delivery if not properly managed.
7.4.3 Scale, timing and cost
The scale and timing of the identified corridor additions are based upon forecast patronage demand, which has some inherent risk considering the complexity of transport and land use modelling (refer section 7.4.1).
7.4.4 Environment
There was reasonably limited environmental assessment considered during this study due to the nature of the proposed infrastructure (generally tunnelling) and the strategic level planning required to date. Generally the environmental assessment focused on minimising significant impacts (eg no bridges through the Botanic Garden) and limited assessment of tunnel impacts (eg spoilage removal). As the project progresses significantly more work will be required for detailed environmental impacts.
Climate change will also be a significant issue to address. Because of infrastructure’s long life span, climate change is a significant risk to infrastructure owners, managers and operators. Without the implementation of appropriate adaptation strategies, it can be anticipated that the life expectancy of infrastructure will be reduced, maintenance costs will increase and there will be a higher risk of structural failure during extreme weather events.
The specific climate change impacts and consequently the adaptation strategies for the design, construction and operation of any new railway infrastructure will depend on the physical elements and final alignments of the infrastructure, including: tunnel sections, surface sections, ventilation stacks, stations and resulting influences across the rail and road networks.
The adaptation strategies adopted will vary depending on the level of risk exposure. This is best assessed through a detailed climate change risk evaluation, based purpose-built climate change projections and an assessment of the associated impacts. This process is preferable because adaptation strategies for any given location or infrastructure element will depend on the type and severity of the climate change impact to be avoided, mitigated or managed.

Inner City Rail Capacity Study Pre-Feasibility Report
109
The contents of this report do not represent Queensland Transport or State Government policy
8. Way forward
The scope of works post-ICRCS is generally suggested around the following potential phases with indicative timeframes leading to the first major river crossing project.
� Preferred option selection
� Preferred option detailed planning, reference design, environmental studies, consultation and business case
� Land acquisition
� Final pre-construction activities
� Construction and commissioning
There are a number of short term investigations recommended as refinements to finalising recommended options for the ICRCS Stage 2 and 3. They generally relate to refining existing analysis done to date and are considered critical toward ensuring a robust decision-making prior to pursuing selection of a preferred option. The key recommended investigations include:
i) Refined investigation of 2016 corridor options or sub options (including determining which of Newstead/Fortitude Valley or Spring Hill should be serviced first)
ii) Refinement of station selection criteria particularly considering the large portion of the overall project cost that stations comprise.
iii) Refined land value assessment and land value capture
iv) Refinement of station development including public realm opportunities and preliminary impacts (eg pedestrian modelling)
v) Station land use refinement and sensitivity testing
vi) Integrated public transport strategy – optimising rail and bus infrastructure investment
vii) Further investigation of impacts on rail patronage demand due to changes in land use, etc.
viii) Merivale Bridge/tunnel duplication further assessment
ix) Integration with results of the other transport and land use study findings
To determine selection of a Preferred Option a number of activities would need to progress including but not limited to:
i) Confirm number of corridors to further refine and assess (3 or 5)

Inner City Rail Capacity Study Pre-Feasibility Report
110
The contents of this report do not represent Queensland Transport or State Government policy
ii) Corridor selection would need to evaluate in further detail:
� Rail operations, including assessing detailed dwell time, station loading, corridor/line capacity and operating strategies
� 2016 preference for Fortitude Valley or Spring Hill
� land use uplift potential (value capture)
� PT integration with busways (SEQ optimisation)
� Confirmation of demand from south and west
� Engineering project scoping and cost estimate updates
� Other
iii) Risk proofing (“what if” testing)
iv) Initial option selection
v) Refined engineering, station design, and the like.
vi) Final option selection