INJURY TRENDS 1. Upon completion of this unit you will be able to identify injury trends in the...
21
INJURY TRENDS 1
-
Upload
ella-mcdaniel -
Category
Documents
-
view
214 -
download
0
Transcript of INJURY TRENDS 1. Upon completion of this unit you will be able to identify injury trends in the...
1
INJURY TRENDS
2
Upon completion of this unit you will be able to identify injury trends in the dairy industry and apply that knowledge to assessing hazards and making safety improvements on your dairy operation.
LEARNING OBJECTIVE
3
1. Describe major injury trends in the dairy industry.2. Identify areas of concern for potential employee injury that are present on the dairy operation.3. Understand the high risk areas in order to prioritize and focus more attention to those areas.4. Understand the relationship between injury and illnesses and the effect on profitability.
LEARNER OUTCOMES

4
Dairy farming is a high hazard occupation
Employee safety and health is integral to a successful operation
Losses from injuries and illnesses cut into profits
Continuous process improvement is key!
INJURY TRENDS:LOOKING AT THE NUMBERS
5
Assessment – first step in the process Identify areas of concern
What are your top 3 areas of safety and health concerns on your dairy operation?
ASSESSING THE RISK AND HAZARDS
6
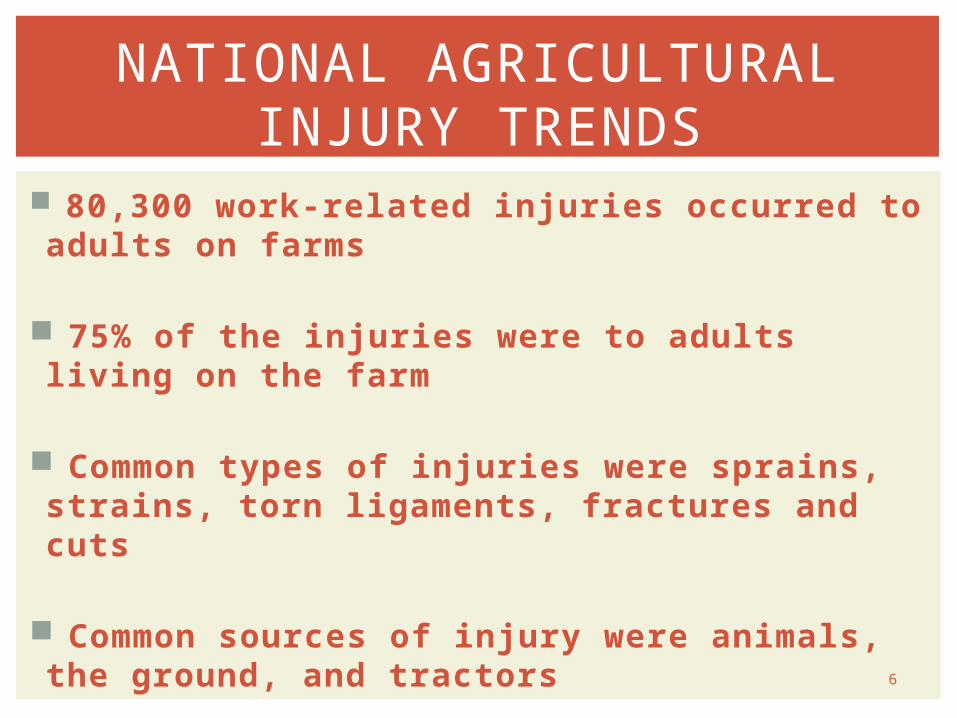
80,300 work-related injuries occurred to adults on farms
75% of the injuries were to adults living on the farm
Common types of injuries were sprains, strains, torn ligaments, fractures and cuts
Common sources of injury were animals, the ground, and tractors
NATIONAL AGRICULTURAL INJURY TRENDS
7
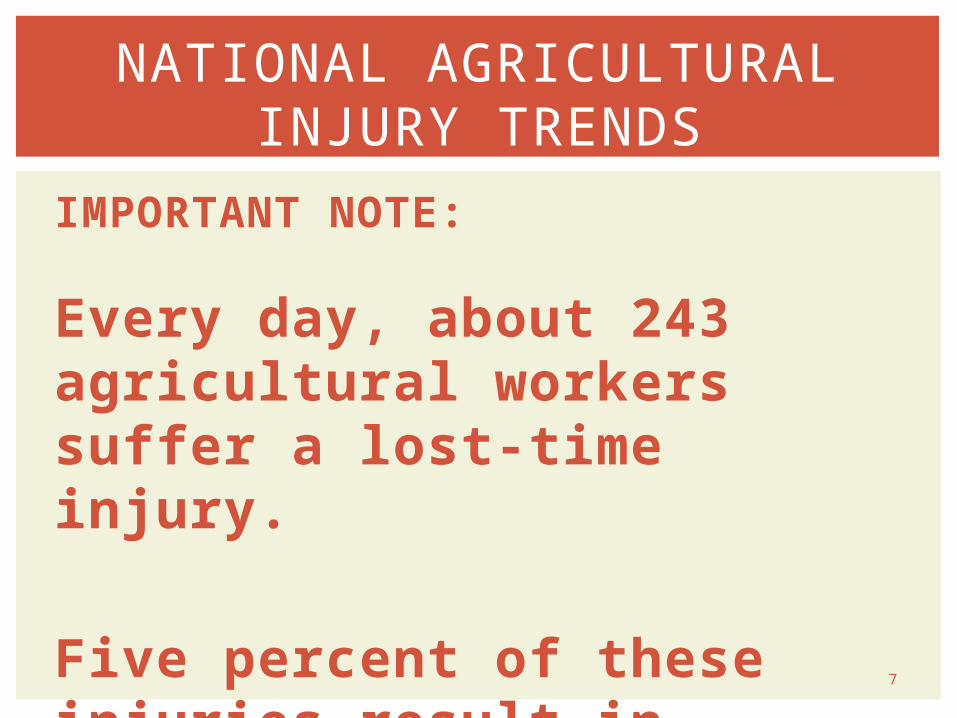
IMPORTANT NOTE:
Every day, about 243 agricultural workers suffer a lost-time injury.
Five percent of these injuries result in permanent impairment.
NATIONAL AGRICULTURAL INJURY TRENDS
8
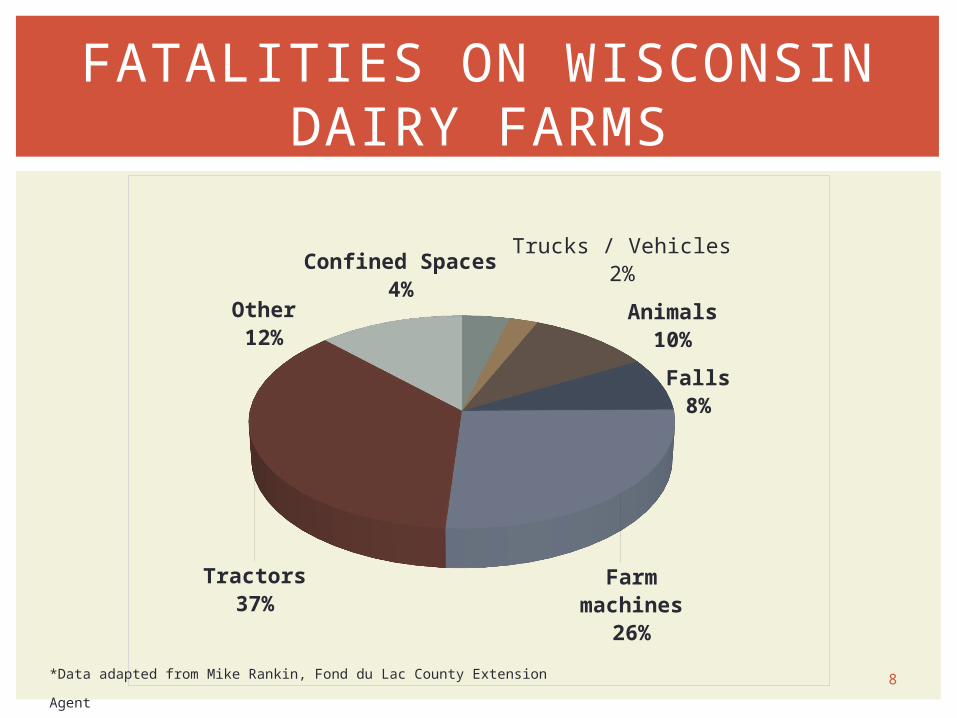
FATALITIES ON WISCONSIN DAIRY FARMS
Confined Spaces4%
Trucks / Vehicles2% An-
imals
10%Falls8%
Farm ma-
chines26%
Tractors37%
Other12%
*Data adapted from Mike Rankin, Fond du Lac County Extension Agent

9
COMMON CAUSES OF INJURIES
Rural Mutual Insurance provided information on 1,153 worker compensation insurance claims from January 1, 2007 to February 2, 2012. (There were no personal or farm identifiers)
We thank Rural Mutual Insurance very much for sharing this information!
Data was reviewed and coded based on Wisconsin Standard Coding for Worker Compensation Claims.

10
COMMON CAUSES OF INJURIES
The Top Three Common Causes of Injury:Category Total
NumberPercent
Animals (dairy cattle)
326 28%
Slips, trips and falls
216 19%
Struck by Object
148 13%

11
COMMON CAUSES OF INJURIES
Most Common Injuries Overall
.
Category Total Number Percent
Hand 124 11%
Fingers 105 9%
Low back 73 6%
Eye 72 6%
Shoulder 64 6%
Knee 54 5%
Other/undetermined
156 14%

12
COMMON CAUSES OF INJURIES
Animals: Most Common Causes of Injury within ‘Animal’ Code (n=326)
Category Total Number Percent
Being kicked, stepped on, thrown from, or struck by
274 84%
Scratched or mauled by
33 10%
Trampled or crushed 13 4%
Bitten or pecked 2 1%
Other 4 1%
13
COMMON CAUSES OF INJURIES
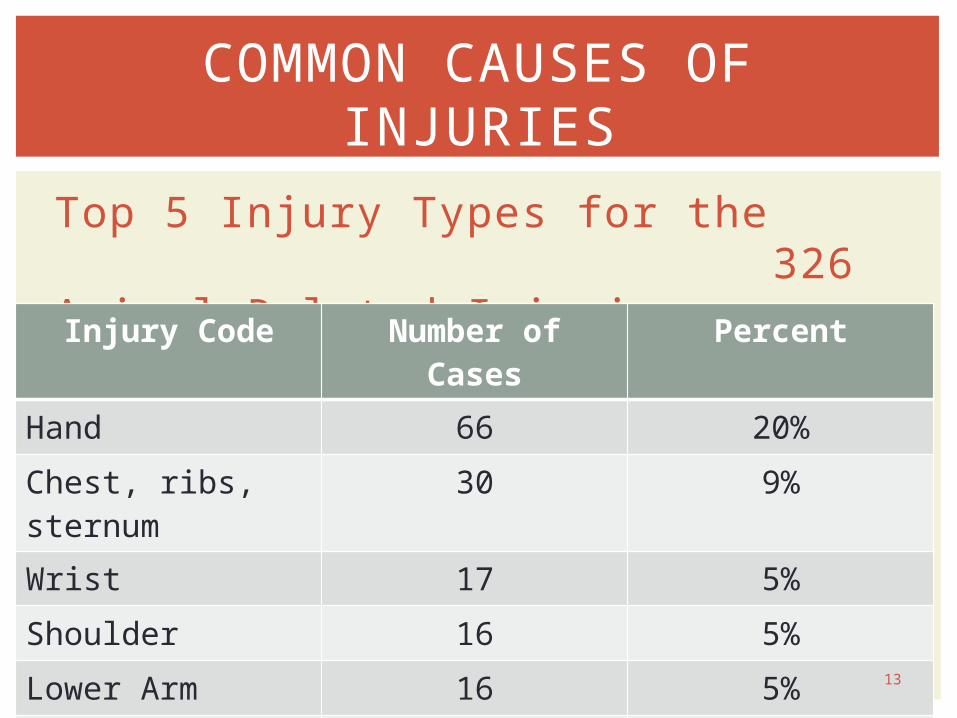
Top 5 Injury Types for the 326 Animal-Related InjuriesInjury Code Number of
CasesPercent
Hand 66 20%
Chest, ribs, sternum
30 9%
Wrist 17 5%
Shoulder 16 5%
Lower Arm 16 5%
Knee 15 5%
14
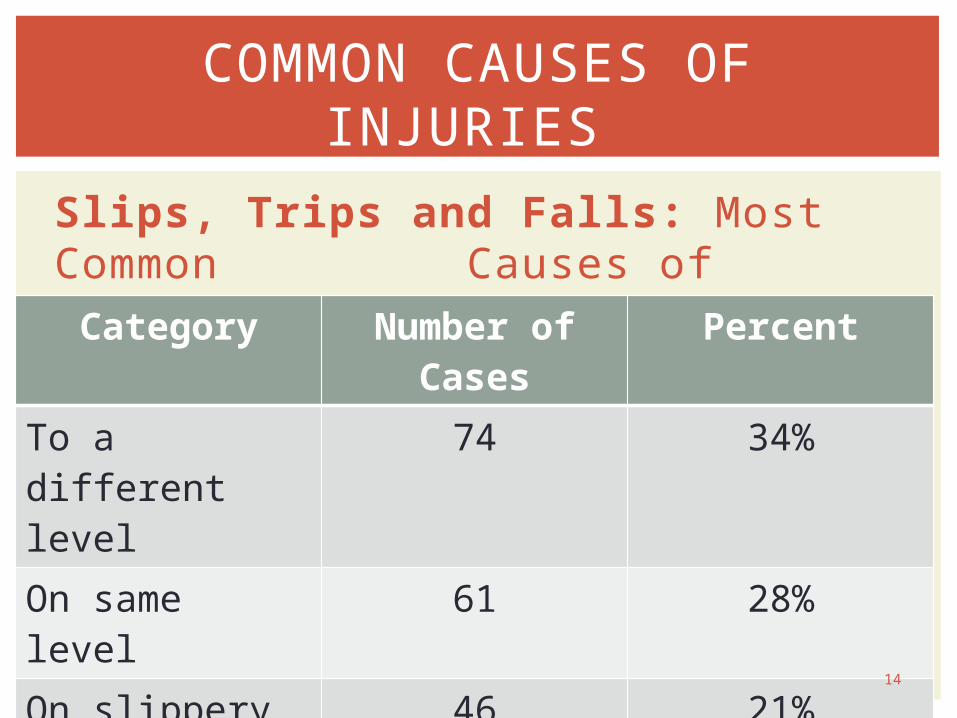
COMMON CAUSES OF INJURIES
Slips, Trips and Falls: Most Common Causes of Injuries (n=216)Category Number of
CasesPercent
To a different level
74 34%
On same level 61 28%
On slippery surface
46 21%
Stumble, no fall
35 16%
15
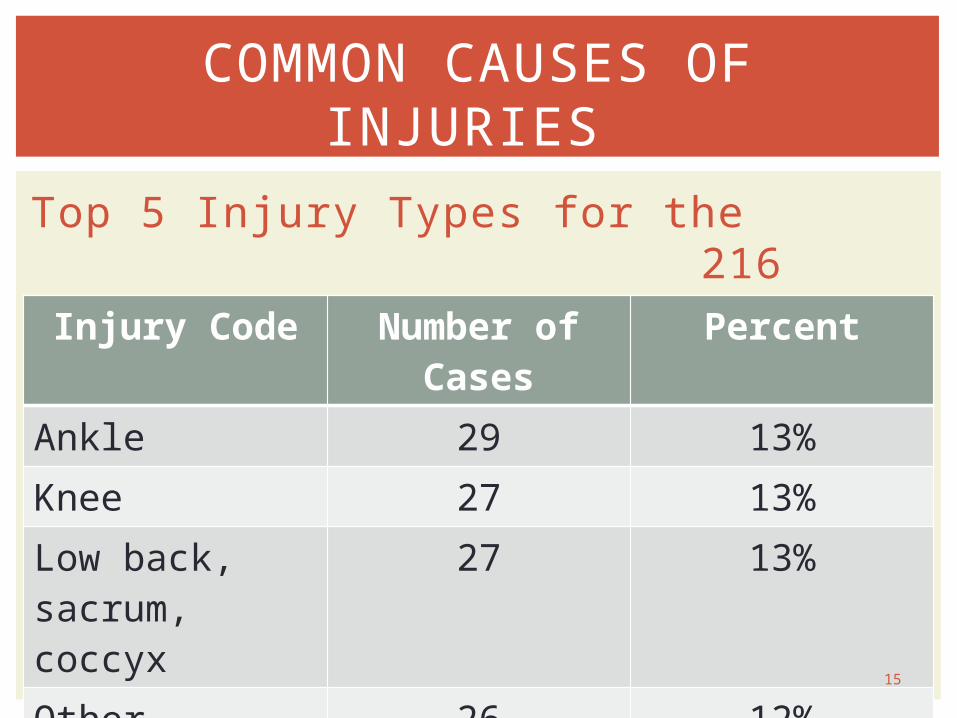
COMMON CAUSES OF INJURIES
Top 5 Injury Types for the 216 Fall-related InjuriesInjury Code Number of
CasesPercent
Ankle 29 13%Knee 27 13%Low back, sacrum, coccyx
27 13%
Other 26 12%Shoulder 14 6%

16
COMMON CAUSES OF INJURIES
Struck by Object: Most common Causes of Injury Within ‘Struck by Object’ Code (n=148)Category Number of Cases Percent
Being lifted, stationary object, falling object, tool, fan blade, etc.
81 55%
Caught in, under, or between an object being handled, earth slide, collapsing building
28 19%
Projectile 21 14%
Door 15 10%
Tree 3 2%

17
COMMON CAUSES OF INJURIES
Struck by Object: Top 5 Injury Types for the 148 ‘Struck by Object’ Related Injuries Injury Code Number of
CasesPercent
Fingers 44 30%
Other 15 10%
Hand 14 9%
Head 13 9%
Shoulder 9 6%

18
OSHA’s Safety Pays Program can be used to calculate loss of profitability to your operation.
Website:http://www.osha.gov/dcsp/smallbusiness/safetypays/index.html
IMPACT ON PROFITABILITY

19
For every $1.00 invested in an effective safety and health program, the return on investment (ROI) is $4.00 - $6.00.
Sound business practice: Having dollars to invest in your business rather than trying to recover from injury losses.
IMPACT ON PROFITABILITY
20
Have your top 3 areas of concern for health and safety on your farm changed after viewing this data? If yes, how?
Identify the top three causes of injury related to dairy farming.
How can you use this data to improve safety on your farm?
QUESTIONS FOR REVIEW

21
This material was produced under grant number SH-22318-11 from the Occupational Safety and Health Administration, U.S. Department of Labor. It does not necessarily reflect the views or policies of the U.S. Department of Labor, nor does mention of trade names, commercial products, or organizations imply endorsement by the U.S. Government.