
Injection Molded Thermoplastic Foams for Sound Insulation · ii Injection-Molded Thermoplastic...
187
Injection-Molded Thermoplastic Foams for Sound Insulation By Davoud Jahani A thesis submitted in conformity with the requirements for the degree of Doctor of Philosophy Department of Mechanical and Industrial Engineering University of Toronto © Copyright by Davoud Jahani 2015
Transcript of Injection Molded Thermoplastic Foams for Sound Insulation · ii Injection-Molded Thermoplastic...

Injection-Molded Thermoplastic
Foams for Sound Insulation
By
Davoud Jahani
A thesis submitted in conformity with the requirements
for the degree of Doctor of Philosophy
Department of Mechanical and Industrial Engineering
University of Toronto
© Copyright by Davoud Jahani 2015

ii
Injection-Molded Thermoplastic Foams for Sound
Insulation
Davoud Jahani
Degree of Doctor of Philosophy, 2015
Department of Mechanical and Industrial Engineering
University of Toronto
Abstract
Open-cell foam materials have many applications such as sound and thermal insulators, filter
and separation membranes, scaffolds, battery electrode supports, and printing heads. Commercial
open-cell polymeric foams have been almost exclusively manufactured with polyurethane
thermoset materials. While the production of thermoplastic open-cell foam has been studied in
batch foaming and extrusion systems, open-cell foaming with the injection molding process has
not received enough attention due to its inherent challenge to produce an open-cell structure.
However, despite that challenge, injection molding is one of the most cost-effective and widely
used polymer processing technologies. Thermoplastic polymeric open-cell foams that are
environmentally friendly and recyclable were developed for different applications including
sound insulation using the injection molding machine process. This thesis work combines the
conventional foam injection-molding process with mold opening and gas counter pressure
techniques to achieve highly-expanded open-cell foam structures with/without an air-gap for
sound insulation. Environmentally friendly and recyclable foams produced in this study showed
promising results for sound insulation and sound absorption.

iii
Table of Contents
Acknowledgments………………………………………………………………………………..iii
List of Tables…………………………………………………………………..…………..……..ix
List of Figures…..……………………………………………...…….............……………………x
List of Symbols………………………………….…………………...…….…..…………...…..xvi
Chapter 1: Introduction and Background…………………….…………….……...………….1
1.1. Preamble ……………………………………………………….............………………..1
1.2. Acoustic and Noise Control Engineering…………………………….....……………….2
1.3. Foam Materials ………………………………………………………..………...………3
1.4. Research Motivation ……………………………………………….……..……………..5
1.5. Problem Statement and Objectives ………………………….……………..……………6
1.6. Organization of the Thesis …………………………………..…………....……………..7
1.7. References……………………………………………..…..…….……………………….9
Chapter 2: Development and Simulation of Acoustic Foams…………..………….………..12
2.1. Fundamentals of Acoustics………………………………...…………………..……….12
2.1.1 Definition of Sound Wave…………………………..………..……….………12
2.1.2. Sound Wave Power……………………………..….…………...…………….14
2.2. Acoustic Materials…………………………………………………….………………..15
2.3. Acoustic Open Cell Foams…………………………….………...……………………..15

iv
2.4. Bulk Modulus and Characteristic Impedance of the Air………….…………….…..….16
2.5. Important Parameters in Sound Insulation …………….…………….....………..……..17
2.6. Characterization of Acoustic Foams…………………………...………..…..………….20
2.6.1. Cell Morphology…………...………………………...……………….………..20
2.6.2. Void Fraction and Expansion Ratio……………….…………….……………..21
2.6.3. Sound Insulation………………………………….………….…….………..….22
2.6.4.. Porosity……………………………………………..…………..………….…..24
2.6.5. Flow Resistivity…………………………...…………………..….….…………26
2.6.6. Tortuosity ………………………………………………………………..…….27
2.6.7. Viscous Characteristic Length ………………………………………….….….28
2.6.8. Thermal Characteristic Length……………………….……………….…..……28
2.7. Approaches in Modeling Acoustic Foams…………………………….……………….29
2.7.1. Analytical Model ……………………………………………………….……29
2.7.2. Empirical and Semi-Empirical………………………………………………..30
2.8. References………………………………………………………………………………33
Chapter 3: Design of Open Porous Acoustic Foams……………………….…………………35
3.1. Introduction……………………………………………………………………………..35
3.2. Experimental……………………………………………………………………...…….36
3.2.1. Materials……………………………………………….……………………..36
3.2.2. Strategy to Synthesize Open Porous Foams………………………………….36

v
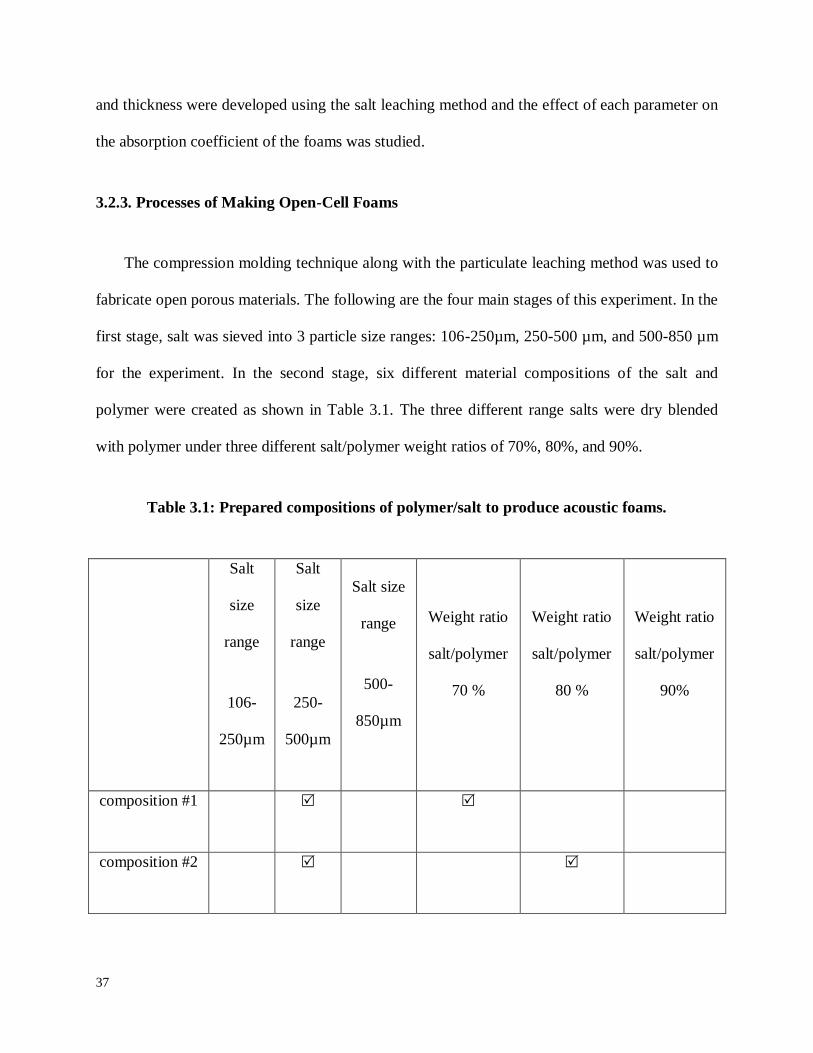
3.2.3. Processes of Making Open-Cell Foams………………………….……….…..37
3.3. Characterization…………………………………………………………….……..……38
3.4. Effect of Pore Size on Absorption Coefficient………….……………..…….…………40
3.5. Effect of Porosity on Absorption Coefficient………….…………………….…………41
3.6. Effect of Air-gap on Absorption Coefficient……………………………….……….….42
3.6.1. Samples with Different Porosities……………………………….…….……..42
3.6.1. Samples with Different Cell Size………………………………..……..……..44
3.7. References………………………………………………………….………..………….47
Chapter 4: Development of New Technology to Produce Open Porous Acoustic Foams for
Insulation……………………………………………………………………………....………..48
4.1. Introduction………………………………………………………………..….………..48
4.2. Experimental…………………………………………………...…..…………………..51
4.2.1 Materials Selection……………………………………………..……………..51
4.2.2. Sample Preparation …………………………………………...…..………….51
4.3. Characterization…………………………………………………….………...…..…….53
4.3.1. Foam Structure Characterization………………………………...…….……..54
4.3.2. Acoustic Property Characterization…………………………………………..55
4.3.3. Thermal Insulation Characterization…………………………………..……..56
4.3.4. Mechanical Property Characterization…………………….………………….57
4.4. Results and Discussion………………………………………………….……….……..58

vi
4.4.1. Foam Structure ………………………………….………….…………..…….58
4.4.2. Sound Insulation Properties…………………….………….…………………65
4.4.3. Thermal Insulation Properties………………..…….…………………………69
4.4.4. Flexural Properties………………………..…………………………………..71
4.5. Conclusion………………………………………………………………………..…….72
4.6. References ………………………………………………………….………….……….73
Chapter 5: Development of Air-Gap Integrated Acoustic Open-Cell Foams for
Absorption…………………………………………………………………………..…………..82
5.1. Introduction…………………………………………………….……………………….82
5.2. Experimental………………………………………………….……..………………….83
5.2.1. Sample Preparation – Foam Injection Molding…………………….….……..83
5.2.2. Foam Characterization …………………………………..……..…………….88
5.2.3. Perforation ………………………………………………….…………..…….88
5.2.4. Acoustic Property Characterization…………………………………………..89
5.3. Results and Discussion………………………………………………………...……….90
5.3.1. Structure and Cellular Morphology of Acoustic Foams ……………………..90
5.3.2. Pressure Profiles in the Mold Cavity…………………….………………….101
5.3.3. Acoustic Properties………………………………………………………….102
5.4. Conclusion………………………………………………………………………...…..108
5.5. References ……………………………………………………………….………….110
vii
Chapter 6: Development of Novel High-Performance Micro-Perforated Panels (MPPs) For
Low-Frequency Absorption…………………………………………………………………..115
6.1. Introduction………………………………………………………..…………………..115
6.2. Hypothesis…………………………………………………………………...………..116
6.3. Experimental Procedure…………………………………………….…………………119
6.3.1. Materials…………………………………………………………….………119
6.3.2. Sample Preparation………………………………………………...………..119
6.3.3. Foam Structure Characterization ………………………………………...…122
6.3.4. Acoustic Property Characterization……………………………...………….123
6.4. Results and Discussion………………………………………………………………..124
6.4.1 Foam Structure……………………………………………………………….124
6.4.2. Results and Discussions……………………………….…………….………128
6.5. Conclusion……………………………………………………….……………..……..133
6.6. References……………………………………………………………………………..134
Chapter 7: Prediction of the Transmission Loss for Injection Molded Acoustic
Foams….…………………………………………………………………………………...…..140
7.1. Introduction…………………………………………………………………..….…….140
7.2. Prediction of the Transmission Loss for Polycarbonate Foams………………………141
7.3. Prediction of the Transmission Loss for Polypropylene Foams…………………..….148
7.4. Effect of Material on Transmission Loss…………………………….……….………154
7.5. Conclusion……………………………………………………………….……………155

viii
7.6. References……………………………………………………………………….……156
Chapter 8: Conclusions and Recommendations……………………………….……………161
8.1. Summary of Major Contributions……………………………………………………..161
8.1.1. Introduction and Background……………………………………………….162
8.1.2. Development and Simulation of Acoustic Foams……………………..……162
8.1.3. Design of Open Porous Acoustic Foams ………………………….....……..162
8.1.4. Development of Technology to Produce Open Porous Acoustic Foams Using
Injection Molding for Insulation…………………………………………...………163
8.1.5. Development of Air-Gap Integrated Acoustic Open-cell Foams for
Absorption……………………………………………………………….…………163
8.1.6. Development of Novel High-Performance Micro-perforated Panels (MPPs) for
Low-Frequency Absorption………………………………………………………..164
8.1.7. Prediction of the Transmission Loss for Injection Molded Acoustic
Foams………………………………………………………………………………165
8.2. Summary of Major Contributions (Publications)……………………………………..165
8.3. Recommendation for Future Research………………………………………………..169

ix
List of Tables
Table 3.1: Prepared compositions of polymer/salt to produced acoustic foams……………..…..37
Table 3.2: Characterization results for developed acoustic foams………………………...…….39
Table 4.1: Fixed and varied parameters in the foam injection molding of PC…………..………52
Table 4.2: Degree of mold opening and the resultant set expansion ratio and relative density of
the injection-molded samples………………………………………….………………...………66
Table 5.1: Fixed and varied parameters in the injection molding of acoustic foams…….….…..86
Table 5.2: Sample number, degree of mold opening and final thickness of the injection-molded
acoustic foams…………………………………………………………………..…….….………90
Table 6.1: Fixed and variable parameters in the foam injection molding of polypropylene…...121
Table 7.1: Information of tested injection-molded polycarbonate parts…………………….….142
Table 7.2: The a, b, and c values for PC samples ……………………………………………...145
Table 7.3: Information of developed injection molded polypropylene foams…………….….149
Table 7.4: The a, b, and c values for PP samples (without a cavity)…. ……………………...150
Table 7.5: The a, b, and c values for PP samples (with a cavity) ……………………………..151

x
List of Figures
Figure 1.1: Audible sound and noise frequency ranges…………………………...………………2
Figure 1.2 A foam material with open-cell and closed-cell structures…………..…..…….……..3
Figure 2.1: Propagation of the sound wave in the air (longitudinal wave)…………..…..…..…..13
Figure 2.2: Ingoing and outgoing sound wave pressures while hitting a layer of material backed
with a rigid wall………………………………………………………………………….………18
Figure 2.3: Schematic of simple impedance tube used for sound insulation measurement……..23
Figure 2.4: Interface of two sound waves (a) constructive, (b) distractive……..……….………24
Figure 2.5: Schematic of flow resistivity measurement setup…………………………….……..26
Figure 3.1: Absorption coefficient of the samples with different pore size……………………..41
Figure 3.2: Absorption coefficient of the samples with different porosity…………….………..42
Figure 3.3: Absorption coefficient when they are backed with a 4mm, 8mm, and 12mm cavity
length for the samples with a porosity of (a) 106-250µm, (b) 250-500 µm, and (c) 500-850
µm……………………………………………………………………………………………..…44
Figure 3.4: Absorption coefficient when they are backed with a 4mm, 8mm, and 12mm cavity
length for the samples with a porosity of (a) 60.82%, (b) 75.25%, and (c) 79.96%. …………..46

xi
Figure 4.1: Transmission loss in an acoustic wall ..………………………………..…..………..56
Figure 4.2: Schematic of the transient plane source set up for thermal conductivity
measurement………………………………………………………………………...………..….57
Figure 4.3: (a) A schematic showing the overall structure of the foam injection-molded sample
using mold opening, and (b) Representative SEM micrographs, obtained at temperature of
300oC, showing the skin layer and the transition and core regions of the injection-molded
samples using mold opening……………………………………………..………………………59
Figure 4.4: (a) Variations of the set and actual expansion ratios with the degree of mold opening
(gas content: 0.3 wt.%, melt temperature: 300 °C), and (b) Variation of the open-cell content
with actual expansion ratio……………………………………………………..………………..62
Figure 4.5: SEM micrographs of injection-molded samples obtained at temperature of 300oC
with actual expansion ratios of (a) 4.2, (b) 6.0 , and (c) 7.2…………………………………….63
Figure 4.6: (a) Variations of the maximum achievable expansion ratio as a function of melt
temperature, and (b) variation of the open-cell content with melt temperature………..………..65
Figure 4.7: (a) Transmission loss versus frequency for the foam injection-molded samples with
various relative densities, and (b) area under transmission loss vs. frequency curves for foam
injection-molded samples with various relative densities………….………………………...….68

xii
Figure 4.8: Variations of thermal conductivity of foam injection-molded samples with relative
density. The lines are the least-square fits to the experimental data at high and low relative
density ranges…………………………………………………………………………………….71
Figure 4.9: Specific flexural modulus (a) and strength (b) of the injection-molded solid and
foamed samples with various relative densities. ………………………….…………………….72
Figure 5.1: (a) Designed cavity pressure profile for foam injection-molding, and (b) a schematic
drawing showing the locations of the pressure transducers in the mold cavity. The unit for all the
dimensions is in millimeter…………………………………………………………..…..………86
Figure 5.2: Developed mechanized perforating setup for injection-molded foams……….…..…89
Figure 5.3: SEM micrographs and schematic structures of acoustic foams made (a) without mold
opening (PP1) and (b) with 1.5 mm length of mold opening (PP2)……………………………..93
Figure 5.4: SEM micrographs of foam produced with 4.5mm mold opening length (PP3)……..95
Figure 5.5: Open-cell content and the expansion ratio of the acoustic foams without cavity...…96
Figure 5.6: A schematic representation of the creation of the cavity inside the injection-molded
foams using a mold opening technique: (a) foamed sample right after the injection, (b) crack
initiation while the mold was opening, and (c) the final cavity created in the core. ……..……..97

xiii
Figure 5.7: (a) A photograph of the PP5 sample showing the cross section of the overall structure
including the skin region, the foamed region, and the internal cavity, and (b) a SEM micrograph
of the PP5 sample showing the cellular morphology of the foamed region………………....…98
Figure 5.8: The average thickness of the cavity and the surrounding foamed region for cavity-
integrated acoustic foams in the PP4, PP5 and PP6 samples…………………………...………99
Figure 5.9: Average open-cell content and expansion ratio of the cavity-integrated acoustic
foams produced……………………………………………………………………..…………..100
Figure 5.10: A SEM micrograph and cell size distribution across the thickness of the PP5
sample………………………………………………………………………………..…..……..101
Figure 5.11: Recorded pressure profiles near the gate, the middle and the end of the mold
cavity……………………….……………………………………………….…..………………102
Figure 5.12: Absorption coefficient results for the acoustic foams. ……………….…….…….104
Figure 5.13: Improvement on the absorption coefficient because of the perforation for the sample
with different cavity length. ……………………………………………………………..……..106
Figure 5.14: (a) Transmission loss versus frequency and (b) the average transmission loss of the
acoustic foams…………………………………………………………………….……...……..108
Figure 6.1: Sound wave dissipation mechanism using Helmholtz resonators…………….……117
xiv
Figure 6.2: (a) A schematic of a currently available micro-perforated panel with solid thin plate,
and (b) the proposed MPP/air-gap system with a foam thin plate…………………….…….….118
Figure 6.3: Apparatus and method for advanced structural foam molding [27-28]……………121
Figure 6.4: Foam injection molded parts produced by using a high-temperature mold (80oC), (a)
With nucleating agent (talc), and (b) without nucleating agent (talc) ………………..………..126
Figure 6.5: Foam injection molded parts produced using a moderate temperature mold at 40oC:
(a) without nucleating agent and (b) and with nucleating agent……………….……………….127
Figure 6.6: SEM micrograph of the foam thin injection molded parts produced using a moderate
temperature mold and talc as the nucleating agent……………………….…………….………128
Figure 6.7: Measured absorption coefficient for MPPs constructed using solid (unfoamed)
polypropylene injection molded samples……………………………………….………………129
Figure 6.8: Measured absorption coefficient for MPPs constructed using solid (unfoamed)
polypropylene injection molded samples……………………………………………………….130
Figure 6.9: Measured absorption coefficient for the solid and foam polypropylene injection
molded samples……………………………………………………………….……….………..131
Figure 6.10: Improvement on the absorption coefficient when foam panel is used for constructing
MPPs in 50, 40, and 30 mm cavity lengths. This calculation has been made for the frequency
range of 400 Hz to the peak absorption frequency of the MPP with solid panels…………..….132

xv
Figure 6.11: Improvement on the absorption coefficient when foam panel is used for constructing
MPPs in 50, 40, and 30 mm cavity lengths for the frequency range of 400-1600 Hz…………133
Figure 7.1: Measured transmission loss for injection-molded parts……………………………144
Figure 7.2: Prediction and experimental results for transmission loss of the Sample#3, Sample#4,
and Sample#5……………………………….……………………..……………………………147
Figure 7.3: Prediction and experimental results for transmission loss of the Sample#1, and
Sample#2………………………………………………………………………………..………148
Figure 7.4: Measured transmission loss for injection molded polypropylene foams……….….149
Figure 7.5: Prediction and experimental results for transmission loss of the Sample#1, Sample#2,
and Sample#3………………………………………………………………...…………………153
Figure 7.6: Prediction and experimental results for transmission loss of the Sample#4, Sample#5,
and Sample#6…………………………………………………..….……………..…….………154

xvi
List of Symbols
A Area
Perforation area
B Prandtl number
BA Blowing agent
C Speed of sound wave propagation
Closed-cell content
Sound velocity
CO2 Carbone dioxide
GCP gas counter-pressure
Sound intensity before hitting the wall
Sound intensity after passing the wall
M Molecular weight
MPP Micro-perforated panels
Open-cell content
PC Polycarbonate
Prms Amplitude of pressure changes described by the root-mean-square amplitude
PM Maximum pressure amplitude
PP Polypropylene
R Reflection coefficient
Surface resistance
Ru Universal gas constant
SEM Scanning electron microscope
TC Temperature controller
Tk Temperature in kelvin
TL Transmission loss
Tm Temperature of the medium
TPS Transient plane source
Volume of the open and interconnected cells
Vc Volume of empty sample chamber
Volume of the backing cavity
Vr Volume of reference chamber
Vs Volume in sample chamber
Total volume of material
Impedance
Normal surface impedance
Characteristic impedance
Reflection impedance
Impedance of the fluid domain
Normal surface impedance
d Thickness
dB Sound power
Density of foam
xvii
Density of solid(unfoamed)
f Frequency
k Wave number
n Number of the cells
Pressure
Velocity Void fraction
s Perforation ratio
w Width
Numerical coefficient
E’ Incident energy flux
Tortuosity
Absorption coefficient
Added length
λ Wave length
λgas Conductivity of nitrogen gas
λmatrix Conductivity of matrix
υ Ratio of specific heats
( ) Displacement of a linear wave
Density
Angular frequency
Density of the solid unfoamed
Density of foam
Density of sound
Expansion ratio
Air flow resistivity
Viscous characteristic length
Thermal characteristic length
Viscosity of the air
Dynamic viscosity of the air
ξ Tortuosity factor

1
Chapter 1: Introduction and
Background
1.1. Preamble
Recently, sound insulation has received increasing interest due to the serious noise pollution
in our living environment. Various strategies and sound insulation systems have been developed,
but most of them are expensive due to either the complexity of the systems or material cost.
Open-cell (or porous) materials are commonly used for sound insulation, but most of the
materials used are not recyclable. An example is the use of polyurethane open-cell foams in the
sound insulation systems of automobiles. Due to economical foaming processes and lower
prices of polymer, new structures can be developed for industrial and also home usage. Polymer
based sound absorption structures are lower in weight and show reasonable acoustic properties,
which can replace many of the existing structures.

2
1.2. Acoustic and Noise Control Engineering
Acoustics is the art and science of understanding sound and its interaction with the physical
world. In acoustic and noise control engineering, the main goal is to reduce or eliminate the
noise power, whether outdoors or indoors. Noise control is an important aspect in transportation,
architectural design, urban planning, and so on. For instance, the use of hybrid vehicles not only
helps reduce air pollution and fuel consumption, but also decreases roadway noise significantly.
In architectural design, an example of good auditorium design will be able to reduce the
reverberation (echo) extensively to increase the quality of speech. The World Health
Organization (WHO) recently announced that every third person in the European region is
suffering from health-related issues due to noise pollution. The range of frequency humans can
hear is between 20 Hz and 20 KHz. The frequency range of the noise that people face in their
daily life is 50 Hz - 5000 Hz, as shown in Figure 1.1. Most of the noise produced from domestic
devices in everyday life are in the lower-end of the frequency range of 500-1500 Hz. This is the
main reason scientists are trying to develop high efficient insulating materials for low-frequency
spectrum noise.
Figure 1.1: Audible sound and noise frequency ranges.

3
1.3. Foam Materials
Foam materials can be open-cell or closed-cell and they are quite different in terms of their
manufacturing and applications. In a foam structure, if cells are interconnected and are open to
the surface of the structure, the structure is called porous or open-cell. Open cell structures
permit the flow of a liquid or gas medium through the interconnected cellular structure of the
foam without destroying the foam structure [1-2]. Figure 1.2 shows a foam material with open-
cell and closed-cell structures.
Figure 1.2 A foam material with open-cell and closed-cell structures [2].

4
Open-cell foams usually have a high expansion ratio and they are mostly flexible material.
One of the general applications is the packaging and shipping of fragile objects [3]. The
interconnection of the voids in open-cell foams and their low weight make these foams the most
suitable foam for some applications such as sound insulation, packaging, scaffolds, and printer
applications. Unlike open-cell foams, closed-cell foams are usually rigid. Most of the cells in the
closed-cell foams are not interconnected and fluid cannot penetrate through the structure.
Closed-cell foams can have a variety of hardness and density [4]. Sometimes, a physical rupture
of the closed cells can be considered as a viable method for opening the cells [5].
The choice of using open-cell or closed cell foams varies depending on their characteristics
and applications. As an example, both types of foam are commonly used in building
applications. Open-cell foams would usually not be used for thermal insulation in humid places
within a building where they could absorb water. The presence of the absorbed water would
significantly reduce the thermal performance because water is a poor insulator compared to air.
In contrast, closed-cell foams would be a good choice for thermal insulation in humid places.
The cell size, cell density, porosity (for open-cell foams), and expansion ratio are the main
structural properties that govern the performance of each foam, and hence, they have to be
studied prior to any applications.
Foam materials have revolutionized industry quite dramatically in recent years. The constant
increase in the usage of these materials in airplane construction is one example of the importance
of these materials in the replacement of other conventional materials. There are several reasons
for the importance of foam material in industry, and the following are a few examples [6-7].

5
I. Foams are lightweight, waterproof, strong, inexpensive, easy to maintain, durable, and
flexible.
II. It is possible for foam materials to be combined with conventional materials to make a
required composite or sandwiched material of desirable specifications.
III. It is easy to be machined using inexpensive tools.
IV. It is easy to be formed or shaped into complex geometries like airfoils.
V. It facilitates very large bulk manufacturing.
1.4. Research Motivation
Currently, most noise control materials available are not environmentally friendly or
recyclable. Polyurethane foams are commonly used as sound insulators [8–10]. But it is difficult
to treat polyurethane foam waste. These foams are not easy to recycle cost-effectively and their
incineration produces poisonous gas [11, 12]. Their low density and high volume means they
easily become landfill. Glass wool has also been used as a sound insulator but only in an
environment that is not regularly accessed by humans due to health concerns. Also, fiberglass is
not considered a reliable acoustic controller due to its relatively high density and low
processability [13]. Therefore, thermoplastic materials such as polypropylene would be a
promising alternative to the currently available sound insulating materials [14].
Open-cell foams have shown promise for sound insulation across a wide range of
frequencies [15, 16]. The interconnectivity of the cells allows air to flow through them. Air-flow

6
viscosity and the thermal conductivity of the foam are considered as the two main reasons for
sound wave attenuation [17]. Nevertheless, to absorb low-frequency sound with conventional
open-cell foams, a considerable foam thickness is required [18]. Multilayer acoustic foams [19,
20] constructed with an air gap are considered as promising solutions for low-frequency sound
absorption (400–1600 Hz). In some applications, the front panels of these multilayer foams were
perforated to enhance their acoustic behavior [21, 22]. The costs associated with multilayer
acoustic foams are relatively high and, in most cases, the open-cell foams used in such insulators
are not recyclable. It is thus of great value to develop cost-effective and recyclable alternatives to
these insulators.
Manufacturing open-cell foams using the foam injection molding process is of great interest
to industry. This is due to their reliability, availability and cost-effectiveness. Producing open-
cell injection-molded foams is, however, challenging and has received very little attention. Since
foaming takes place in an enclosed mold cavity, the range of achievable void fractions and cell
densities is limited in the foam injection-molding process [23, 24]. Therefore, foam injection-
molding strategies should be developed in order to achieve highly expanded open-cell foams.
1.5. Problem Statement and Objectives
The main objective of this thesis is to produce thermoplastic injection molded foams for
sound insulation. Currently, sound insulating materials are exclusively produced using thermoset
polyurethane materials. In this work, the development of environmentally friendly and recyclable
acoustic materials, which can replace current non-environment-friendly acoustic material, is
intended. Throughout this development, injection molding, which is commercially available for

7
the industry, was utilized to produce open-cell acoustic foams. In order to achieve this long-term
plan, efforts were made to achieve the following short-term goals:
I. Study the effect of manufacturing parameters of thermoplastic foams on their sound
insulation behavior.
II. Develop a methodology to produce environmentally friendly recyclable open-cell
acoustic foam using the injection molding process.
III. Apply available techniques such as integrating air-gaps and perforated panels with
thermoplastic foams for improving the sound insulation behavior.
1.6. Organization of Thesis
This thesis is organized into 8 chapters. Chapter 1 presents an introduction to foams,
acoustics, and noise control. It also includes the motivation, objective, and overview of the
thesis.
Chapter 2 presents the literature and theoretical background on the development and
simulation of acoustic foams. The fundamentals of acoustics, open-cell foam, characterization,
and modeling are discussed in this chapter. It also includes different models including analytical,
empirical, and semi-empirical models used in sound absorption prediction.
Chapter 3 explains the development of acoustic thermoplastic porous foams in batch
foaming. Also it describes the effect of pore size, porosity, and air-gap in the acoustic behavior
of batch foaming samples.

8
Chapter 4 presents a novel strategy for producing open-cell foam using the injection
molding process. The process and experimental setup for the development of highly expanded
foams are presented. Also, the results of acoustic, thermal, and mechanical characterization of
the developed foams are presented in this chapter.
In Chapter 5, the development of air-gap integrated acoustic foams for low frequency noise
insulation is demonstrated. The experimental setup and process that were developed for
producing 5-layer acoustic foams are explained. Furthermore, the effect of each layer of the
developed foam and skin layer perforation on the acoustic behavior of the developed foam is
studied.
A novel approach to the development of high-performance micro perforated panels (MPPs)
for low frequency absorption is presented in Chapter 6. Also, the inherent challenges for foaming
thin-walled injection parts are explained and strategies used for producing uniform foam thin-
walled injection molded parts are presented.
In Chapter 7, a formula is developed to estimate the transmission loss of injection molded
open-cell foams. The effect of material on the transmission loss of injection molded samples is
discussed. Finally, a summary and conclusion for the major contributions along with
recommendations for future research are presented in Chapter 8.
1.7. References
[1] Wang, X., Li, W., Kumar, V., Creating open-celled solid-state foams using ultrasound.
Journal of Cellular Plastic, 4: 353-369, 2009.

9
[2] Chu, R.K.M. Synthesis and characterization of rotational molded polymeric foams for
optimal acoustic absorption. M. Sc. Thesis, Department of Mechanical and Industrial
Engineering, University of Toronto, 2007.
[3] Fossey, D.J., Smith, C.H. Fabrication of open-cell polyethylene foam. Journal of Cellular
Plastic 6: 268-273, 1973.
[4] Mills, N.J., Zhu, H.X. The high strain compression of closed-cell polymer foams, J. Mech.
Phys. Solids 47(3): 669-695, 1999.
[5] Song, K., Lee, S., Lee, D. Influence of cell opener in high resilience molded polyurethane
foam, Journal of Cellular Plastic 38: 507-522, 2002.
[6] Claar, T., Yu, C, et al., Ultra-lightweight aluminum foam materials for automotive
applications, SAE international, paper #2000-01-0335, 2000.
[7] Park, C. B., Padareva, V., Lee, P.C., Naguib, H. Extruded open-celled ldpe-based foams
using non-homogeneous melt structure. Journal of Polymer Engineering 25(3): 239-260, 2005.
[8] Kino, N, Nakano G, et al. Non-acoustical and acoustical properties of reticulated and partially
reticulated polyurethane foams. Applied Acoustics 73(2):95–108, 2012.
[9] Xu, J., Buchholz, JM., et al. Application of multi-layered polyurethane foams for flat-walled
anechoic linings. Applied Acoustics 67(5):476–85, 2006.
10
[10] Gardner, G.C., O’Leary, M.E., et al. Neural networks for prediction of acoustical properties
of polyurethane foams. Apply Acoustic 64(2):229–42, 2003.
[11] Wright, W. Polymers in aerospace applications. Mater Des, 12(4):222–7, 1991.
[12] Yang, W, Dong, Q, et al. Recycling and disposal methods for polyurethane foam wastes.
Procedia Environ Sci, 16:167–75, 2012.
[13] Wang, TM, Hou, KH, et al. the preparation of slag fiber and its application in heat resistant
friction composites. Mater Des, 31(9):4296–301, 2010.
[14] Mcrae, JD, Naguib, HE, et al. Mechanical and acoustic performance of compression-molded
open-cell polypropylene foams. J Appl Polym Sci, 116(2):1106–1115, 2010.
[15] Takahashi, D, Tanaka, M. Flexural vibration of perforated plates and porous elastic
materials under acoustic loading. J Acoust Soc Am, 112(4):1456–64, 2002.
[16] Ren Y, Wang K, et al. Synthesis of zno micro-rods on the cell walls of open celled al foam
and their effect on the sound absorption behavior. Mater Lett, 91:242–4, 2013.
[17] Kohlhoff, D, Ohshima, M. Open cell microcellular foams of polylactic acid (pla)-based
blends with semi-interpenetrating polymer networks. Macromol Mater Eng. 296(8):770–7, 2011.
[18] Allard, JF, Atalla, N. Propagation of sound in porous media. France. Wiley; 2009.
[19] Zhang, CH, Hu, Z, et al. Damping behavior and acoustic performance of polyurethane/lead
zirconate titanate ceramic composites. Mater Des, 46:503–10, 2013.

11
[20] Hohe, J, Hardenacke, V, et al. Numerical and experimental design of graded cellular
sandwich cores for multi-functional aerospace applications. Mater Des, 39:20–32, 2012.
[21] Wang, B, Wu, L, et al. Experimental investigation of 3d sandwich structure with core
reinforced by composite columns. Mater Des, 31(1):158–65, 2010.
[22] Tasdemirci, A., Hall, I.W. Development of novel multilayer materials for impact
applications: a combined numerical and experimental approach. Mater Des. 30(5):1533–41,
2009.
[23] Lee, J., Turng, L.S., et al. A novel method for improving the surface quality of microcellular
injection molded parts. Polymer 52(6):1436–46, 2011.
[24] Lee, J.W.S., Wang, J., Yoon, J.D., Park C.B. Strategies to achieve a uniform cell structure
with a high void fraction in advanced structural foam molding. Ind Eng Chem Res,
47(23):9457–64, 2008.
12
Chapter 2: Development and
Simulation of Acoustic
Materials
2.1. Fundamentals of Acoustics
2.1.1 Definition of Sound Wave
Sound (or noise) is created when pressure variations or oscillations in an elastic medium
take place. The elastic medium can be a gaseous, liquid, or solid phase. In most cases for sound,
air is the elastic medium. Sound wave propagates in the air longitudinally by rarefactions and
compressions of the air molecules and it propagates until its power dissipate. Figure 2.1 shows
propagation of the sound wave in the air medium.

13
Figure 2.1: Propagation of a sound wave in air (longitudinal wave).
A sound wave is characterized by the amplitude of the pressure change, wavelength, and
frequency. The amplitude of the pressure changes is described by the root-mean-square
amplitude (Prms) in which the instantaneous sound pressures are squared, averaged and the
squared root of the average is taken. Sound pressure amplitude is also characterized in terms of
the maximum pressure amplitude (PM) in Pascal. Eq.2.1 shows the governing equation between
the maximum pressure amplitude and the root-mean-square amplitude for a sound wave.
(Prms)= 0.707 (PM) (2.1)
The speed of sound wave propagation, C in m/s, is related to the frequency in 1/s and wave
length (λ ) in m as

14
C=f λ (2.2)
By an increase in the temperature of the medium (Tms) in Celsius, the speed of the sound wave
also increases and Eq.2.3 can be used to calculate the speed of the sound wave in different
medium temperatures.
C= 332 + 0.6 Tme (2.3)
For gaseous phases, the velocity of the sound wave can be calculated using Eq.2.4 equation: in
which Tk is the temperature in kelvin, Ru is the universal gas constant in Joule/molK, is the ratio
of specific heats, and M is the molecular weight in kg/mol.
√
(2.4)
2.1.2. Sound Wave Power
Sound power is calculated using a reference sound pressure Pref = 20 µPa (see ISO 3744,
ISO 9614). This value is the root-mean-square amplitude of the minimum acoustic power audible
to a young and healthy human ear. The following is the expression used to calculate the sound
power (dB) using the reference pressure.
(2.5)
The median hearing threshold is about 5 dB (at 1 kHz). The pressure at which sound
becomes painful is called the pain threshold pressure. The pain threshold pressure for sound will
15
vary with frequency and is age-dependent. In the literature, sound above 120 dB is normally
considered the pain threshold pressure level of a typical adult.
2.2. Acoustic Materials
Acoustic materials, depending on their components, manufacturing process and properties,
are classified into four groups: fibrous materials, perforated panels, granular materials, and
polymer foam materials. Glass, mineral wools, and felts are considered fibrous material, which
are commonly used for sound insulation [1]. Perforated panels are constructed with a thin
perforated panel and an air cavity, and are used only when the absorption of sound energy is
required. In most architectural rooms, perforated panels are used to absorb the noise and
attenuate the reflected sound (echo). Granular or chip-type materials are used for sound
insulation. Conventional granular insulating materials consist of light-weight materials. Granular
materials have an average grain diameter of about 1.5 millimeters [1]. Finally, using foam
material for sound insulation is the most common insulating method in the industry. More
information about these sound insulating materials is given in the next section.
2.3. Acoustic Open Cell Foams
Unlike closed-cell foams, open-cell foams are commonly used for sound insulation. Air
molecules, which convey the energy of the sound wave, can easily penetrate inside the open-cell
foams. When air is passing through these porous materials, it faces resistance from the surface of
the pores because of friction. This friction generates heat and will be dissipated to the other parts
of the porous material and air. In the case that the intersection of the pores changes, air will
experience compression and decompression and this can be another reason for sound energy
16
attenuation while it passes through open porous materials. Viscosity and thermal conduction are
two main reasons for sound absorption in open-porous materials.
2.4. Bulk Modulus and Characteristic Impedance of the Air
Bulk modulus and characteristic impedance are the two primary parameters that are
discussed in sound insulation. Below, a brief explanation of these two parameters is provided.
The displacement of a linear wave in a compressible lossless fluid can be calculated using
the following equation
( )
( ) (2.6)
in which is the angular frequency in rad/second and k the wave number in 1/meter. The wave
number can be calculated by
(
) (2.7)
in which and are the density in kg/m3 and the bulk modulus of the air in Pa, respectively. The
bulk modulus of a substance measures the substance’s resistance to uniform compression. The
speed of sound in air and other gases, liquids, and solids is predicted by the density and elastic
properties of these medium (bulk modulus). If the fluid is perfectly elastic with no damping, k is
a real number.
For a planar sound wave, the pressure and the velocity are related by:

17
( )
( ) (2.8)
and
( ) . (2.9)
in which is the characteristic impedance of the fluid in Pam-1
S. Impedance is also defined as
the ratio of the pressure to the volume displacement at a given surface in a sound-transmitting
medium. For air at the temperature, pressure, and density of 18oC, 103.3kPa, and 1.213 kgm
-3
the characteristic impedance and bulk modulus are 415.1 Pam-1
S, and 1.42 x 10⁵Pa,
respectively. The impedance Z of a wave during traveling is decreased. The following equation
can be used to calculate the impedance of a wave after traveling having an impedance of Z1.
(2.10)
Furthermore, when a sound wave passes through a fluid with a thickness of d and reflectes back
after it hits an impervious wall, the impedance can be calculated using the following equation.
(2.11)
2.5. Important Parameters in Sound Insulation
Reflection coefficient, absorption coefficient, and acoustic impedance are three important
parameters in sound insulation. Below, a short explanation for each of these parameters is given.

18
Reflection coefficient(R): A sound wave will experience partial transmittance and partial
reflectance when the medium through which it travels suddenly changes. The sound reflection
coefficient of a material R is the ratio of outgoing sound wave pressure P’ to incoming sound
wave pressure P.
(2.12)
The measurement for the sound pressure while hitting a layer of material is performed with a
rigid plate, being placed on the back of the sample to block the transmission of the sound wave,
as shown in Figure 2.2.
Figure 2.2: Incoming and outgoing sound wave pressures while hitting a layer of material
backed with a rigid wall.
19
The equation for the reflection coefficient can be rewritten using the characteristic
impedance of air
(2.13)
in which and are the surface impedance and characteristic impedance of the air,
respectively. In case there is no change in the amplitude of incoming and outgoing waves, the
reflection is 1. Furthermore, when the amplitude of the impedance is equal to zero or infinite this
ratio would be 1 again.
Absorption coefficient (α): The absorption coefficient is a basic quantity used in calculating the
penetration of materials by quantum particles or other energy beams. It is a measure of
absorption. Absorption coefficient in acoustics is used for quantifying the ability of a material in
absorbing sound. Wallace Sabine was a pioneer in this concept. A unit named in his honor is
Sabine. A Sabine is defined as a fraction of acoustic power absorbed by a 1 metre square of open
window.
Absorption coefficient is related to reflection coefficient R as
. (2.14)
The absorption coefficient is often used in architectural acoustics and this equation can be
rewritten as
(2.15)

20
in which E’ and E are the incident and reflected energy flux to and from the acoustic material,
respectively.
Acoustic impedance (Z): Acoustic impedance is a frequency dependent parameter with the unit
of Rayls. It can be calculated using the following equation.
(2.16)
in which Z is acoustic impedance (Rayls), p is the sound pressure, v is particle velocity, and s is
the surface area, through which acoustic waves of particular frequency propagates. The results of
calculated acoustic impedance for a range of excitation frequencies are normally represented in
the form of an impedance curve.
2.6. Characterization of Acoustic Foams
2.6.1. Cell Morphology
The cell morphology for typical plastic foams can be characterized in terms of cell size, cell
density, and cell size distribution. In some occasions, information such as cell-wall thickness, the
structure of the cell-wall, interconnection of the cells are also studied. The cell morphology can
be examined by using a scanning electron microscope (SEM). SEM is a type of electron
microscope that produces images of a sample by scanning it with a focused beam of electrons.
The cell size can be measured from the SEM micrographs with the aid of image J utility
software. For the cell size characterization, the shortest and largest diagonals of the cell's circle

21
on SEMs, were averaged. The foam density (ρf) can be measured using the water-displacement
method (ASTM: D792-08 http://www.astm.org/Standards/D792.htm ). The cell density is
obtained by counting the number of cells per unit area and using,
f
sxAnN
2/3)/( (2.17)
where n is the number of cells in the defined area A, s is the density of the solid unfoamed
polymer and f is the density of the foamed polymer in kg/m3.
2.6.2. Void Fraction and Expansion Ratio
The void fraction of a foam structure is the ratio of the volume of void to the entire volume
of the foam. This can be calculated by measuring the density of material before and after
foaming. The following equation defines this relationship:
(2.18)
The expansion ratio of foam is inversely related to the void fraction and can be calculated using
this equation.
(2.19)
The bulk density of solid and closed-cell foams can be measured by water immersion and
observing water displacement. However, this technique may not be suitable for measuring the
22
foam density of open-cell foams because of its porous structure. One method to measure the
density of open porous foams is the sample cutting in a geometric shape so that its dimensions
can be easily measured for estimating its geometric volume.
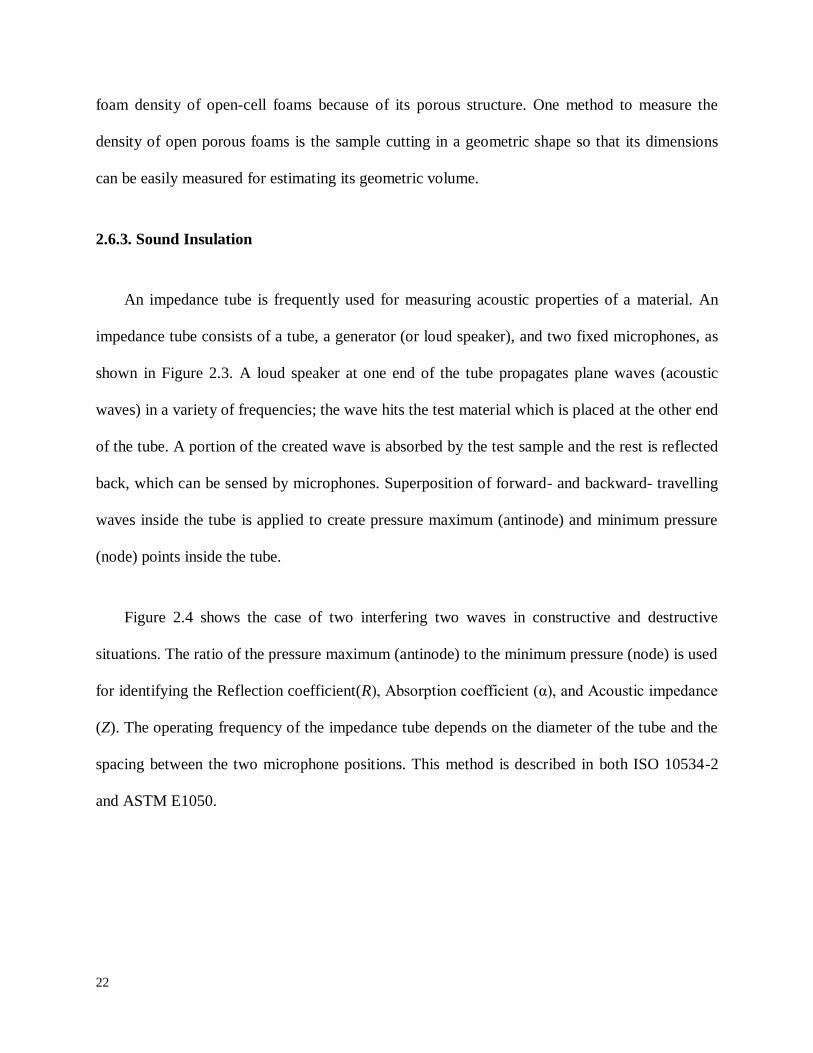
2.6.3. Sound Insulation
An impedance tube is frequently used for measuring acoustic properties of a material. An
impedance tube consists of a tube, a generator (or loud speaker), and two fixed microphones, as
shown in Figure 2.3. A loud speaker at one end of the tube propagates plane waves (acoustic
waves) in a variety of frequencies; the wave hits the test material which is placed at the other end
of the tube. A portion of the created wave is absorbed by the test sample and the rest is reflected
back, which can be sensed by microphones. Superposition of forward- and backward- travelling
waves inside the tube is applied to create pressure maximum (antinode) and minimum pressure
(node) points inside the tube.
Figure 2.4 shows the case of two interfering two waves in constructive and destructive
situations. The ratio of the pressure maximum (antinode) to the minimum pressure (node) is used
for identifying the Reflection coefficient(R), Absorption coefficient (α), and Acoustic impedance
(Z). The operating frequency of the impedance tube depends on the diameter of the tube and the
spacing between the two microphone positions. This method is described in both ISO 10534-2
and ASTM E1050.

23
Figure 2.3: Schematic of simple impedance tube used for sound insulation measurement.
(a)

24
(a)
Figure 2.4: Interface of two sound waves (a) constructive, (b) destructive.
2.6.4. Porosity
Porosity is one of the most important quantities for describing the structure of the cells and it
influences important physical and mechanical properties [1]. Various methods and standards
have been developed for testing and characterizing porous structures. ASTM D 6226 is a test
method for characterizing porosity, which is specialized for cellular plastic materials. Cells in
polymer foams may be interconnecting (open cell), non-connecting (closed cell), or any
combination of these types. To measure the porosity, the accessible cellular volume (i.e. the
open-cell volume) of a material is measured. The remaining volume is considered as volume
occupied by both the closed cells and cell walls. Open cell content (O.C.) of foam can be
estimated using the following equation in which and are actual and geometric volumes of
the foam respectively.
(
) (2.20)

25
Also, closed cell content (C.C.) can be calculated using this equation after knowing the open-cell
content (O.C.).
(2.21)
The porosity ( ) of a material containing open cells is obtained by the ratio of the volume of the
open and interconnected cells ( ) to the geometric volume of material ( ). Thus,
. (2.22)
In this equation, only the volume of air, which is not locked within the frame, must be considered
in . For most fibrous materials and thermoset polyurethane foams, the porosity values are
typically very close to 1. The method for measuring porosity is given in ASTM D 6226.
A gas pycnometer is a laboratory device used for measuring the actual density as well as the
porosity of different materials including porous foam materials. The gas pycnometer essentially
consists of two chambers, one to hold the sample and a second chamber, with known internal
volume, as the reference volume. There is a valved pathway connecting the two chambers.
Initially, gas which is usually nitrogen or helium flows to the sample chamber at a predetermined
pressure, as assigned in the ASTM standard. Opening the valve in the pathway permits the flow
of gas to the reference chamber, and after a short time, both chambers will have the same
pressure. Through measuring the initial pressure in the sample chamber and the final pressure in
both chambers, the volume occupied by the sample can be estimated. Below is the equation for
calculation.

26
(2.23)
In which Vs is the volume in a sample chamber, Vc is the volume of the empty sample chamber,
Vr is the volume of the reference chamber, P1 is the initial pressure in the sample chamber, and
P2 is the final pressure in both chambers.
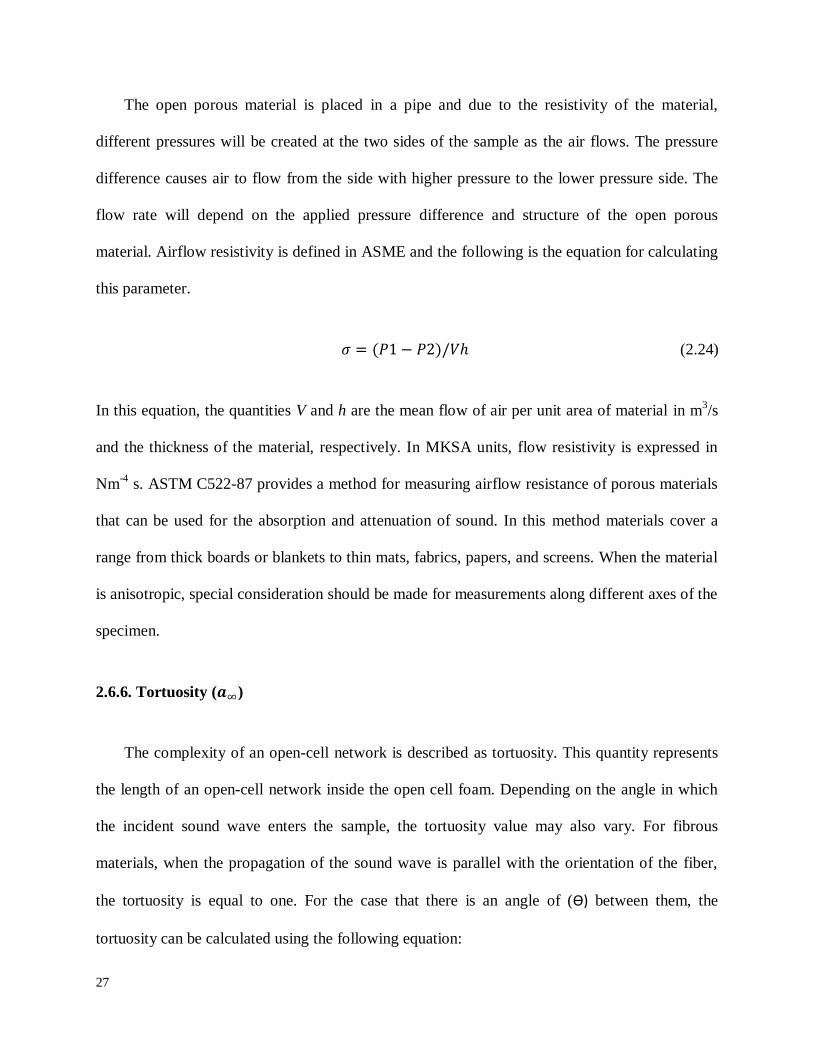
2.6.5. Flow Resistivity
Resistivity of a porous material to airflow has a strong relation to its ability in acoustic
absorption. This property is defined as the flow resistivity [1]. Figure 2.5 shows a schematic of
the setup for measurement of the flow resistivity of a porous material.
Figure 2.5: Schematic of flow resistivity measurement setup.
27
The open porous material is placed in a pipe and due to the resistivity of the material,
different pressures will be created at the two sides of the sample as the air flows. The pressure
difference causes air to flow from the side with higher pressure to the lower pressure side. The
flow rate will depend on the applied pressure difference and structure of the open porous
material. Airflow resistivity is defined in ASME and the following is the equation for calculating
this parameter.
( ) (2.24)
In this equation, the quantities V and h are the mean flow of air per unit area of material in m3/s
and the thickness of the material, respectively. In MKSA units, flow resistivity is expressed in
Nm-4
s. ASTM C522-87 provides a method for measuring airflow resistance of porous materials
that can be used for the absorption and attenuation of sound. In this method materials cover a
range from thick boards or blankets to thin mats, fabrics, papers, and screens. When the material
is anisotropic, special consideration should be made for measurements along different axes of the
specimen.
2.6.6. Tortuosity ( )
The complexity of an open-cell network is described as tortuosity. This quantity represents
the length of an open-cell network inside the open cell foam. Depending on the angle in which
the incident sound wave enters the sample, the tortuosity value may also vary. For fibrous
materials, when the propagation of the sound wave is parallel with the orientation of the fiber,
the tortuosity is equal to one. For the case that there is an angle of (ϴ) between them, the
tortuosity can be calculated using the following equation:

28
(2.25)
In the case that the porous material has a complex open-cell network, the tortuosity may
reach as high as 3.
2.6.7. Viscous Characteristic Length (Λ)
Viscous characteristic length refers to the cells’ microscopic dimensions and represents the
viscous loss of sound wave energy when the wave passes through the porous structure [2, 3].
Viscous characteristic length is more important in small cells. Viscous characteristic length is
equal to twice the volume-to-wet-surface ratio of the open-cell network while it is weighted by
the velocity in the volume and on the surface. The following is the equation to calculate viscous
characteristic length.
∫
∫
(2.26)
in which represents the velocity of the sound in m/s; A and V are the area in m2 and the
volume of the pores in m3 respectively. In practice, this parameter is measured indirectly using an
impedance tube.
2.6.8. Thermal Characteristic Length (Λ’)
The thermal characteristic length refers to the cells’ microscopic dimensions and represents
the thermal loss of sound wave energy when the wave passes through the porous structure [2, 4].
The thermal characteristic length is more important in large cells. This quantity is equal to twice
29
the volume-to-wet-surface ratio of the open-cells network and can be calculated using following
equation,
∫
∫
(2.27)
In practice, the thermal characteristic length is measured indirectly using an impedance tube.
2.7. Approaches in Modeling Acoustic Foams
Many researchers, in the last few decades, developed models for estimating acoustic
impedance of porous material, while others worked on improve model accuracy. In 1956, Biot
developed a model to calculate the impedance of rigid framed materials [5]. Another model by
Pride et al. was for attaining effective density and the simplified Lafarge model was for the bulk
modulus [6]. The approach to the development of these models can be classified into analytical,
and empirical (or semi-empirical).
2.7.1. Analytical Models
Craggs used a finite element method to estimate the acoustic impedance of porous materials
[7]. He considered the porous material as a rigid body and defined an eight-note iso-parametric
model for simulation. This approach was evaluated as a precise method for a one-dimensional
propagation. But Tsay et al [7] tried to use a finite element method for three-dimensional
propagation, but the estimation was far from the experimental results.

30
2.7.2. Empirical and Semi-Empirical Model for Impedance Simulation
Delany and Bazley [8] in 1970 presented semi-empirical formulations for estimating the
impedance of porous materials. They assumed the air inside the porous medium as equivalent to
a free fluid medium and tried to correlate the airflow resistivity of the porous material to the
characteristic impedance (Zc) and the wave-number (k) of the sound waves. The static airflow
resistivity of the porous material is measured experimentally, and then the impedance is
calculated. The following are the equations used in this model to calculate the impedance of
porous material for a wide range of frequencies [7].
( ) (2.28)
( ) (2.29)
(2.30)
In these formulations, and are the density in kg/m3 and sound velocity in m/s, respectively.
Further, , and represent the static airflow resistivity in Pa.s/m2, frequency in s
-1, and
angular frequency in rad/s. This method correlates only airflow resistivity to the impedance, and
airflow resistivity is a one-dimensional characteristic of the material while the sound wave
propagates three dimensionally. This created difficulties with estimating the impedance of
anisotropic materials such as fibrous material. Further, researchers discovered that there is more
than one parameter affecting the impedance.

31
As an example of later efforts to improve the accuracy of the impedance estimation by
considering additional relevant structural parameters of the materials, Johnson et al. (1987)
introduced the “tortuosity” parameter ( ) in his model. The effective density of the fluid in his
model is defined as:
(2.31)
in which is the tortuosity and is the density of the fluid. The minimum value for tortuosity
is one when the voids are straight cylindrical holes. For porous foam material, usually this
parameter is bigger than one.
Gardner [9] used artificial neural networks (ANN) in his empirical model to estimate the
impedance of acoustic materials with higher accuracy. In his model, the surface acoustic
impedance, normal incidence absorption coefficient, and the static flow resistivity of the foams
were measured, and this data was then used to estimate the acoustic impedance of the foams.
The Johnson-Allard model is one of the most adapted models currently used for the
estimation of sound insulating materials. This model was developed in 1994 and it describes the
impedance of the sound wave in a rigid frame air-saturated porous medium with five
macroscopic quantities: porosity ( ), airflow resistivity (σ), tortuosity ( ), and viscous and
thermal characteristic lengths (Λ and Λ’). This model correlates these five parameters to the
effective density and effective bulk modulus of the material [10-11].
The effective density and the bulk modulus can be written as,

32
( ) (2.32)
( )
(2.33)
The expression for and is defined as the following.
( )
(2.34)
( )
( 2.35)
in which B, and , are the Prandtl number and the viscosity of the air in m/s, respectively.
The viscous and thermal characteristic lengths can also be calculated using the following
equations.
(2.36)
(2.37)
in which is a numerical coefficient related to the geometry of the pore section.

33
2.8. References
[1] Cipin, J. New noise insulation material expanded polystyrene granules with heavy core.
Journal of Canadian Acoustics 25(3), 1997.
[2] Atalla, Y. and R. Panneton, Inverse acoustical characterization of open cell porous media
using impedance tube measurements., Canadian Acoustics 33(1), 11-24, 2005.
[3] Panneton, R. and Olny, X., Acoustical determination of the parameters governing viscous
dissipation in porous media, J. Acoust. Soc. Am. 119, 2027-40, 2006.
[4] Olny, X. and R., Panneton, Acoustical determination of the parameters governing thermal
dissipation in porous media, J. Acoust. Soc. Am. 123, 814-824, 2008.
[5] Biot, M. A. Theory of propagation of elastic waves in a fluid-saturated porous solid. J.
Acousti. Soc. Am. 28(2): 168-178, 1956.
[6] Pride, S. R. and J. G. Berryman, Linear dynamics of double-porosity dual-permeability
materials. i. governing equations and acoustic attenuation. Physical Review E - Statistical,
Nonlinear and Soft Matter Physics 68(3 2): 366031-3660310, 2003.
[7] Chu, R. K. M., Naguib, H. E., and Atalla, N., Synthesis and characterization of open-cell
foams for sound absorption with rotational molding method. Polymer Engineering and Science,
49(9): 1744-1754, 2009.

34
[8] Miki, Y. acooustical properties of porous materials-modifications of Delany-Basley models.
Acoust. Soc. Jpn 11(1), 1990.
[9] Gardner, G.C., Leary, M.E.O, et al. neural networks for prediction of acoustical properties of
polyurethane foams. Applied Acoustics 64(2): 229-242, 2003.
[10] Ghaffari M. S., Naguib, H., Park, C.B., development, characterization, and modeling of
environmentally friendly open-cell acoustic foams. Polymer Engineering and Science. DOI:
10.1002/pen.23443.
[11] Allard, J. F. and Atalla, N., Propagation of sound in porous media. France, Wiley, 2009.
35
Chapter 3: Design of Open
Porous Acoustic Foams
3.1. Introduction
Before developing any acoustic foam, it is necessary to investigate the important parameters
affecting the acoustic properties. Hence, a study on the effect of pore size, porosity, and
thickness was conducted in this work. The salt particle leaching method is known as one of the
most feasible strategies to produce open porous material while having close control on the cell
size, cell density, and thickness. This method has been used by many researchers and was used in
this chapter.

36
3.2. Experimental
3.2.1. Materials
Polypropylene (PP) grade number FP800-00 powder supplied by Equistar was used in this
study. This material has a melt flow index of 35 g/10 min (ASTM-D1238) and a density of 0.909
g/cc. This material was supplied in spherical powder size of 5-50 µm. This material has a high
index value and is an appropriate material for an injection molding process. Further, polymer
with a high flow index is less viscous and is easier to flow and sinter together in the salt leaching
method. The fine powder size of PP powder selected in this experiment allows for better material
mixing and sintering. Commercially available sodium chloride salt was used in this experiment.
The salt was sieved into 3 different ranges of particle sizes: 106-250 µm, 250-500 µm, and 500-
850 µm before it was used.
3.2.2. Strategy to Synthesize Open Porous Foams
Foams are initially closed-cell and an additional effort is usually needed to change it to
open-cell them. Many strategies have been developed for cell opening including: plasticizing of
the cell wall with secondary blow agents [1], maintaining a high temperature difference between
the surface and core of the foam extrudate [2], thinning of the cell wall by a high expansion ratio
[3], mechanically rupturing the cell walls, and producing non-homogeneity on the cell walls [4].
The particulate (salt) leaching method [5] is a feasible method and enables close control of the
cell morphology and the thickness of the foams. In order to extract the contribution of the cell
size, the porosity, and the thickness of the acoustic foams, the particulate leaching method was
selected to produce foam samples. In this study, foam materials with different cell size, porosity
37
and thickness were developed using the salt leaching method and the effect of each parameter on
the absorption coefficient of the foams was studied.
3.2.3. Processes of Making Open-Cell Foams
The compression molding technique along with the particulate leaching method was used to
fabricate open porous materials. The following are the four main stages of this experiment. In the
first stage, salt was sieved into 3 particle size ranges: 106-250µm, 250-500 µm, and 500-850 µm
for the experiment. In the second stage, six different material compositions of the salt and
polymer were created as shown in Table 3.1. The three different range salts were dry blended
with polymer under three different salt/polymer weight ratios of 70%, 80%, and 90%.
Table 3.1: Prepared compositions of polymer/salt to produce acoustic foams.
Salt
size
range
106-
250µm
Salt
size
range
250-
500µm
Salt size
range
500-
850µm
Weight ratio
salt/polymer
70 %
Weight ratio
salt/polymer
80 %
Weight ratio
salt/polymer
90%
composition #1
composition #2

38
composition #3
composition #4
composition #5
In the third stage, a compression-molding machine, which was heated up to 170oC, was used
to shape materials of different compositions using a mold. The mold had a 30mm hole which
was prepared for shaping of the materials in order to carry out the acoustic test. Materials were
introduced to the mold and were heated for 10 min in the mold and then they were compressed
under 1 Ton, 2 Tons, then 3 Tons, each for 5 minutes. Finally, the materials were collected from
the mold and their weights were measured. In the fourth stage, all of the prepared materials were
immersed in hot water (about 50 oC) for three days. Finally, samples were dried by keeping them
in a regular oven at 40 oC for 10 hours. A silver nitrate (AgNO3) solution was used to make sure
that the salt was completely leached out. A white residue would be generated with the presence
of Ag+ and cl- ions in the solution. When the white residue was observed by adding Silver
nitrate, the samples were kept in the hot water for a longer time, to make sure that all of the salt
had been removed from the samples. Five samples from each composition were prepared and
they were characterized.
3.3. Characterization

39
Two sets of the samples, one with the same pore sizes and the another with the same
porosity, were developed and all of the samples in both sets were characterized for porosity,
static flow resistivity, tortuosity, viscous length, and thermal length. Of the five macroscopic
properties identified in the Johnson-Allard formulation that models the propagation of sound in a
porous material, the porosity and air flow resistivity of the samples were measured directly. The
other three properties were obtained using the acoustical characterization technique proposed by
Atalla and Panneton [6]. Table 3.2 summarizes the obtained values for the porosity, static flow
resistivity, tortuosity, viscous length, and thermal length for the developed samples.
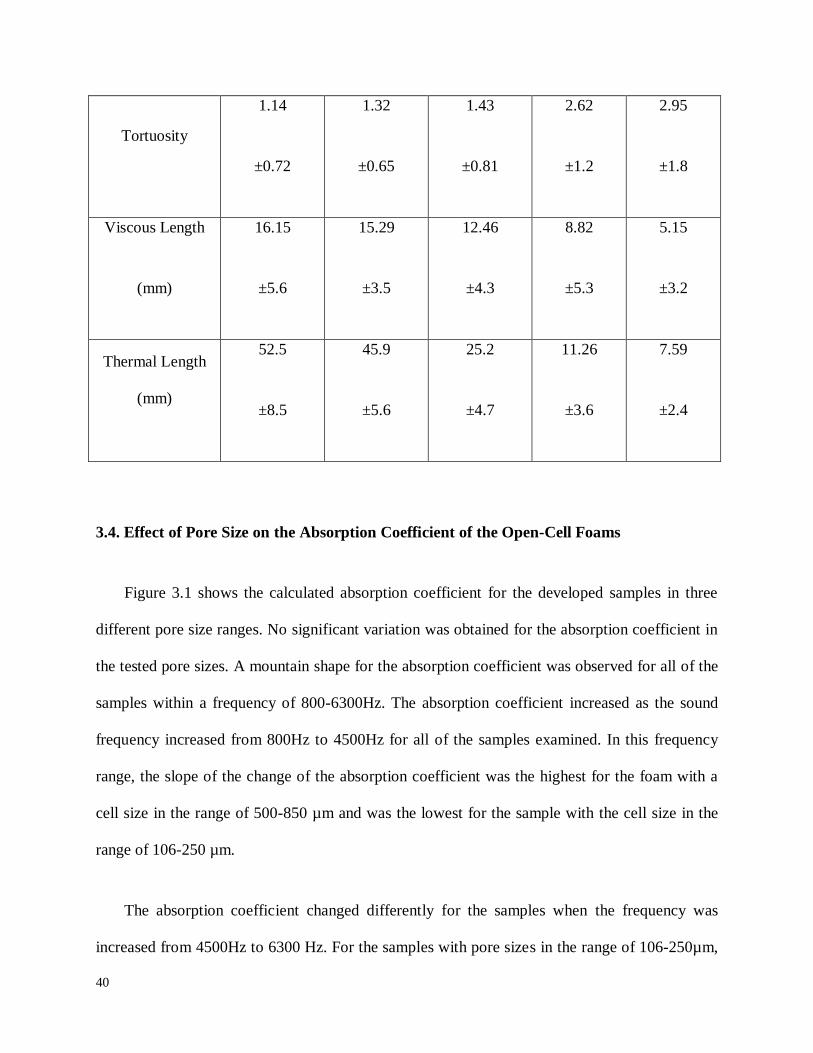
Table 3.2: Characterization results for developed acoustic foams.
Sample # 1 2 3 4 5
Mass Ratio: 9:1 9:1 9:1 7:1 5:1
Salt Particle Size 500-850µm 250-500µm 106-250µm 106-250µm 106-250µm
Porosity
81.2%
±1.2
80.63%
±1.5
79.96%
±2.5
75.25%
±1.9
60.82%
±3.4
Static Flow
Resistivity
(Pa.s/ m2)
1.05E5
±2207
1.17E5
±2050
1.21E5
±2352
1.30E5
±3319
3.9E5
±4072
40
Tortuosity
1.14
±0.72
1.32
±0.65
1.43
±0.81
2.62
±1.2
2.95
±1.8
Viscous Length
(mm)
16.15
±5.6
15.29
±3.5
12.46
±4.3
8.82
±5.3
5.15
±3.2
Thermal Length
(mm)
52.5
±8.5
45.9
±5.6
25.2
±4.7
11.26
±3.6
7.59
±2.4
3.4. Effect of Pore Size on the Absorption Coefficient of the Open-Cell Foams
Figure 3.1 shows the calculated absorption coefficient for the developed samples in three
different pore size ranges. No significant variation was obtained for the absorption coefficient in
the tested pore sizes. A mountain shape for the absorption coefficient was observed for all of the
samples within a frequency of 800-6300Hz. The absorption coefficient increased as the sound
frequency increased from 800Hz to 4500Hz for all of the samples examined. In this frequency
range, the slope of the change of the absorption coefficient was the highest for the foam with a
cell size in the range of 500-850 µm and was the lowest for the sample with the cell size in the
range of 106-250 µm.
The absorption coefficient changed differently for the samples when the frequency was
increased from 4500Hz to 6300 Hz. For the samples with pore sizes in the range of 106-250µm,

41
250-500 µm, and 500-850 µm, peak absorption of 0.98, 0.92, and 0.91were observed at
frequencies of 5850, 5500, and 5200 Hz respectively.
Figure 3.1: Absorption coefficient of the samples with different pore sizes.
3.5. Effect of Porosity on the Absorption Coefficient of the Open-Cell Foams
Figure 3.2 shows the calculated absorption coefficient for the developed samples in three
different porosities having a pore size in the range of 106-250 µm. For frequencies up to around
3500 Hz, no significant variation was obtained for the absorption coefficient when the porosity
was varied from 75.25% to 79.96%. However, a significantly lower absorption coefficient was
observed for the sample with a porosity of 60.82% at a frequency of >3500Hz. For the samples
with 79.96%, 75.25%, and 60.82% porosity, peaks of 0.98, 0.96, and 0.71 at frequencies of 5800,
5800, and 6300 Hz were observed, respectively. For the frequency range of 800 to 3400Hz, a
sample with 60.82% showed a slightly higher absorption coefficient among the samples.

42
Figure 3.2: Absorption coefficient of the samples with different porosity.
3.6. Effect of Air-Gap on the Absorption Coefficient of the Open-Cell Foams
3.6.1. Samples with Different Porosities
Figure 3.3 shows the absorption coefficient of the samples with different pore sizes (106-
250µm, 250-500 µm, and 500-850 µm) when they are backed with a 4mm, 8mm, and 12mm air
cavity. The absorption coefficient curves for all samples exhibited a mountain shape when they
are backed with a cavity. The peak of the mountain-shaped curves moved towards a low
frequency when the thickness of the air cavity had been increased.

43
(a)
(b)

44
(c)
Figure 3.3: Absorption coefficient when they are backed with a 4mm, 8mm, and 12mm
cavity length for the samples with a pore size of (a) 106-250µm, (b) 250-500 µm, and (c)
500-850 µm.
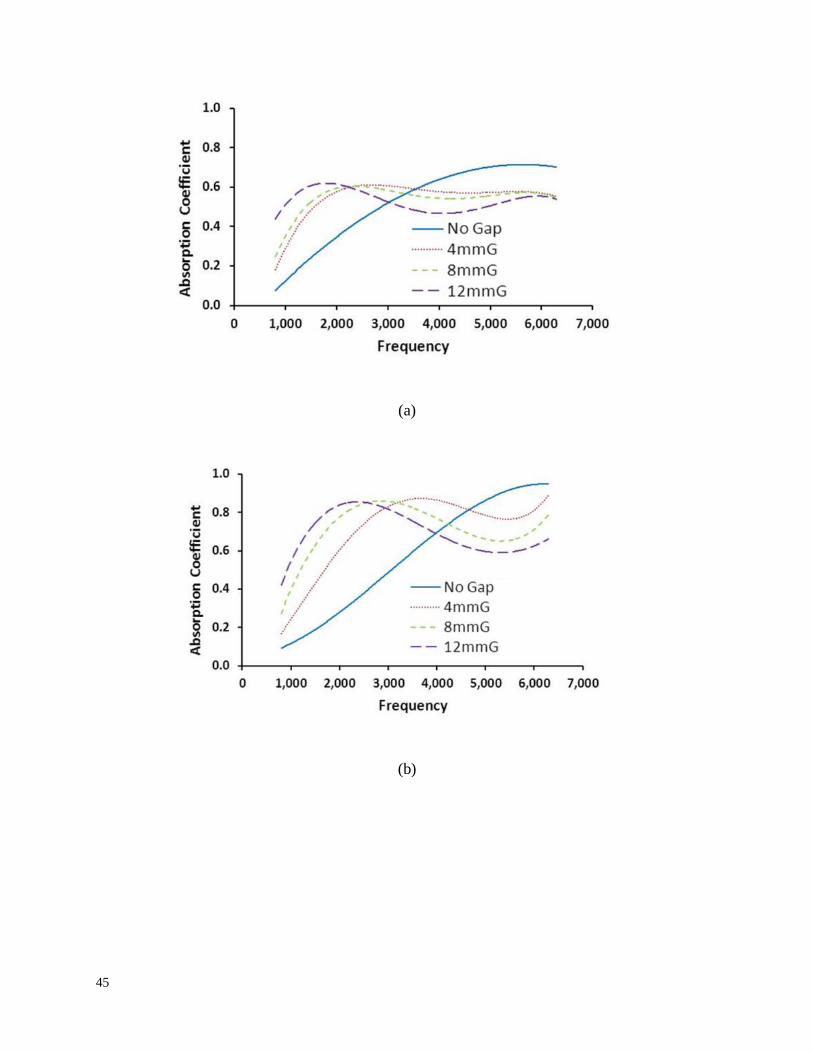
3.6.1. Samples with Different Cell Size
Figure 3.4 shows the absorption coefficient of the samples with different porosities (60.82%,
75.25%, and 79.96%) when they are backed with a 4mm, 8mm, and 12mm cavity. In all of the
samples, the obtained mountain shape curves for the absorption coefficient did not vary much
when they were backed with a cavity. The peak frequency moved towards a low frequency by
increasing the air-cavity thickness.
45
(a)
(b)

46
(c)
Figure 3.4: Absorption coefficient when they are backed with a 4mm, 8mm, and 12mm
cavity length for the samples with a porosity of (a) 60.82%, (b) 75.25%, and (c) 79.96%.

47
3.7. References
[1] Lee, P. C., Naguib, H.E., Park, C.B., Increase of open-cell content by plasticizing soft regions
with secondary blowing agent. Polymer Engineering and Science 45(10): 1445-1451, 2005.
[2] Lee, P. C., Li, G., Lee, J.W.S., Park, C.B., Improvement of cell opening by maintaining a
high temperature difference in the surface and core of a foam extrudate. Cellular Plastics 43(6):
431-444, 2007.
[3] Jahani, D., Ameli, A, Jung, P., Barzegari, M.R., Park, C.B., and Naguib, H., Open-cell
cavity-integrated injection-molded acoustic polypropylene foams. Materials and Design 53: 20-
28, 2014.
[4] Park, C.B., Padareva, V., Lee, P.C., Naguib, H. Extruded open-celled ldpe-based foams using
non-homogeneous melt structure. Journal of Polymer Engineering 25(3), 239-260, 2005.
[5] Kramschuster, A. and Turng, L. S., An injection molding process for manufacturing highly
porous and interconnected biodegradable polymer matrices for use as tissue engineering
scaffolds. Journal of Biomedical Materials Research - Part B Applied Biomaterials 92(2): 366-
376, 2010.
[6] Atalla, Y. and R. Panneton, Inverse acoustical characterization of open cell porous media
using impedance tube measurements. Canadian Acoustics 33(1), 11-24, 2005.
48
Chapter 4: Development of
New Technology to Produce
Open Porous Acoustic Foams
Using Injection Molding for
Sound Insulation
4.1. Introduction
Open-cell foam materials have many applications such as sound and thermal insulators [1-
4], filter and separation membranes [5,6], scaffolds [7-9], battery electrode supports [10, 11], and
as in printing [11]. Polymeric open-cell foams can be developed for such applications. However,
commercial open-cell polymeric foams have been almost exclusively manufactured with
polyurethane thermoset materials [12-19], and the manufacturing technologies for open-cell

49
thermoplastic foams have not been extensively developed [20]. Some effort has been focused to
create open-cell thermoplastic foams using different methods [11, 21-26]. These methods include
soluble particulate leaching from a polymer matrix [9, 27-29], inter-polymer blending [21],
polymer resin grafting [22], soft blowing agent blending [11], mechanical punching of foams
with fine needles [23], stretching mineral-filled polymers [24], changing core and skin
temperatures of polymer/gas mixtures [25], and reduction of the cell wall thickness [26].
However, most of these approaches have been tried on a batch scale.
A few people have tried to use processing technologies such as extrusion [1, 30, 31] and
rotational molding [28] to create open-cell thermoplastic foams. Lee et al. used a non-
homogenous melt structure of low-density polyethylene (LDPE) to create open-cell foams in
extrusion [30]. Further, they used two different semicrystalline polymer blends (i.e.
polypropylene (PP)/metallocene polyethylene (mPE) and linear PP/low-density PE (LDPE) with
different crystallization temperatures to produce open-cell foams [1, 30]. Chu et al. combined
rotational foam molding and particulate leaching to produce foams with open-cell networks for
acoustic applications. They successfully fabricated foams with about 85% of open-cell content
[28].
Injection molding is one of the most cost-effective and widely used thermoplastic processing
technologies. It has also been frequently used in the production of high-density foams [32-35].
Since foaming takes place in an enclosed mold cavity, the range of achievable void fractions and
cell densities is limited in the regular foam injection-molding process [36-38]. Therefore, it is
challenging to produce an open-cell structure using the regular foam injection-molding process,
and new strategies need to be developed to achieve highly expanded foams with an open-cell
structure. To create an open-cell structure in injection-molded samples, introducing a high void

50
fraction and shearing the expanded cells in polypropylene foams [38] have been tried. Recently,
Kramschuster et al. [9] and Chi et al. [39] produced highly porous and interconnected material
for tissue engineering scaffolds by using material combinations, supercritical fluid processing,
and particulate leaching techniques in injection molding. Very recently, Wu et al. also produced
open porous thermoplastic polyurethane scaffolds using supercritical CO2 in the regular foam
injection-molding process [40]. They used a relatively high volume of supercritical CO2, i.e., 6
wt.% and achieved injection-molded foams with a maximum open-cell content of 71%.
To achieve significantly higher void fractions, along with a uniform cell morphology and a
good surface quality, the foam injection-molding process can be practiced using the mold
opening and GCP techniques [38, 41-48]. In this process, the mold cavity is first pressurized, and
then the polymer/gas mixture is injected to fully fill the pressurized cavity. Subsequently, while
the gas is being depressurized in the cavity, the mold is opened in the thickness direction to
achieve the desired final thickness and the resultant high void fraction. The pressure drop due to
cavity depressurization and mold opening causes cell nucleation, and growth occur uniformly in
the entire injection-molded sample [38, 41-48]. However, this technology has been mostly used
to produce a closed-cell structure. In our previous work, we demonstrated how this technology
can be used to create cavity-integrated polypropylene (PP) foams with enhanced acoustic
properties [38]. But cavity-integrated foams have poor mechanical properties due to the
existence of gap in the core of the sample. To broaden their applications, such foams’ acoustic
properties should be enhanced while maintaining their high mechanical properties by eliminating
this problem.
Our current work combines the regular foam injection-molding process with mold opening
and GCP to achieve highly-expanded pure PC foams with an open-cell structure. We propose

51
that the closed-cell foam structure can be effectively converted to an open-cell structure. This
could be achieved by introducing a sufficient degree of one-dimensional expansion and by
regulating the mold opening during cell growth. To investigate the feasibility of the proposed
technique, several degrees of one-dimensional expansion (that is, mold opening), along with
varying injection flow rates and melt temperatures, were investigated. The microstructure, the
degree of open-cell content, the sound and thermal insulation behaviors, and the mechanical
properties of the foams were characterized.
4.2. Experimental
4.2.1 Materials Selection
Because of its high industrial value and its wide range of applications at specifically high-
temperature service conditions, PC was used in this study. The commercially available injection
molding grade of PC, Lexan Resin HF1110 from Sabic was used. It was provided in a pellet
form and has a specific gravity of 1.2 g.cm-3
, a melt flow index of 25 dg/min. (190°C/2.16 kg),
and a glass transition temperature of 147 °C. The pellets were dried at 120 °C for 4 hours before
injection molding, as recommended by the manufacturer. Nitrogen (N2) was supplied by Linde
Gas, Canada and was injected into the barrel in the supercritical fluid state as the physical
blowing agent. It was also used for the GCP.
4.2.2. Sample Preparation
A 50-ton Arburg Allrounder 270/320 C injection molding machine (Lossburg, Germany)
with a 30-mm diameter screw and equipped with MuCell® Technology (Trexel, Inc., Woburn,
Massachusetts) and GCP [30-32] module (Caropreso Associates, MA, US) was used to conduct

52
the experiments. A GCP module in injection molding inserts high pressure gas to the cavity of
the mold right before melt injection, holds the pressure in the cavity, and finally releases the gas
from the cavity right after melt injection. The mold contained a rectangular cavity (135 mm ×
111 mm × 3.2 mm) with a fan gate at one end. More details about the mold can be found in [38].
The mold cavity was first pressurized at about 6 MPa. Then, the polymer/gas mixture was
injected into it while the GCP was maintained. The mold cavity was completely filled by a full
shot, and the foam expansion was achieved by opening the mold [34, 36-37]. The mold cavity
pressures were measured at three different locations, i.e., near the gate, in the middle of the
cavity, and near the end of the cavity during the entire injection cycle, using three PT462E
Dynisco pressure transducers and a DAQ board (Compact DAQ Kit, National Instruments).
Table 4.1 summarizes the fixed and varied foam injection-molding parameters. The
optimum values for the fixed parameters were determined by a series of trial and error
experiments. The degree of mold opening, the melt temperature, and the injection flow rate were
determined as the most influential parameters on the final structure of the expanded samples.
Thus, they were varied to investigate their effects on the foam structure and the open-cell
content. In all of the experiments, the other parameters remained unchanged. . It should be noted
that foams samples with three flow rates: 100, 50, and 25cm3/s were examined. However foams
produced with flow rate of 50 and 25 cm3/s had significant non-uniformity due to slow filling of
the cavity and temperature gradient on the polymer melt. Hence only foams produced in100
cm3/s were studied.
Table 4.1: Fixed and varied parameters in the foam injection molding of PC.

53
Shot size (cm3) Full, 52
Barrel pressure (MPa) 19
Gas injection pressure (MPa) 24
Screw speed (rpm) 200
Metering time (s) 10
Gas counter-pressure (MPa) 6 MPa
Delay in mold opening (s) 2
Mold temperature (ºC) 35
N2 content (wt. %) 0.3
Injection flow rate (cm3/s), variable 100
Degree of mold opening (mm), variable 0,2.6,5.7,9.1,12.8
Melt temperature (ºC), variable 280, 300, 320
4.3. Characterization

54
4.3.1. Foam Structure Characterization
The foam density was measured either geometrically or by using the water-displacement
method (ASTM: D792-08). The expansion ratio ( ) was calculated using Equation 1.
f
s
d
d (4.1)
where ds and df are the density of the unfoamed solid material and foamed sample, respectively.
To study their microstructure, the samples were freeze-fractured and then coated with platinum
using a sputter coater. The microstructures were then examined using scanning electron
microscopy (SEM), JEOL JSM-6060. The thickness of the coating was 200-300nm, and the
acceleration voltage was 20 volts. The cell density was calculated using Equation 2.
2
3
_
A
nDensityCell (4.2)
where n is the number of cells in the micrograph; A is the area of the micrograph. The open cell
content (O.C.) of the foams was calculated using Equation 3.
%100)1(.. xV
VCO
g
a (4.3)
where Va and Vg are the actual volume and the geometric volume of the foam, respectively.

55
4.3.2. Acoustic Property Characterization
The injection-molded samples were evaluated for their acoustic behavior, that is, the sound
wave transmission loss, which represents the energy that the sound wave loses when it passes
through the acoustic fence (see Figure 4.1). Based on the concept of acoustic attenuation, this
refers to the decibels of sound wave power that are lost when the wave passes through the
sample. The transmission loss (TL) for an acoustic wall can be calculated using Equation 4.
1
210I
ILogTL (4.4)
where I1 and I2 are the sound intensity before sound waves hits the acoustic wall and the intensity
of the sound wave right after it passes through the wall.
TL can vary from 0 to any value. Samples were cut into 100 mm of diameter, and their
transmission loss was measured using an impedance tube and the Tube-XTM
utilities package in
accordance with the ASTM: E1050-12 standard. The package was able to account for the effects
of the temperature, the barometric pressure, and the attenuation of the measured quantities [15].
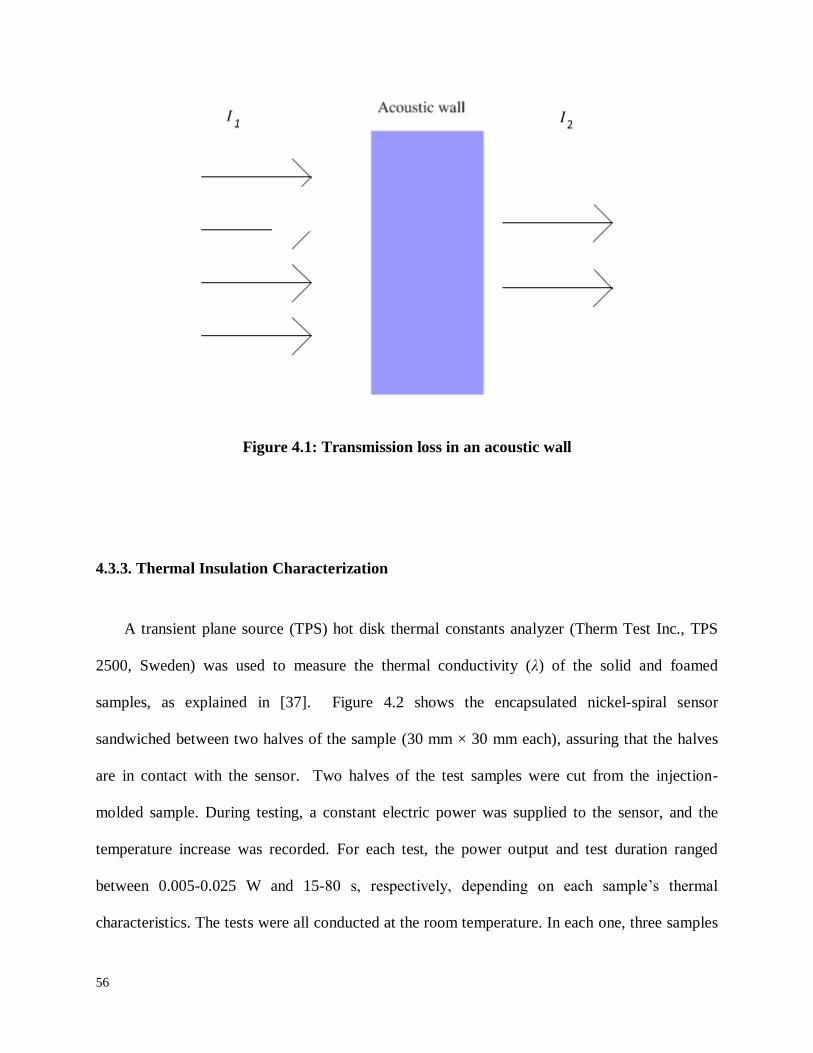
56
Figure 4.1: Transmission loss in an acoustic wall
4.3.3. Thermal Insulation Characterization
A transient plane source (TPS) hot disk thermal constants analyzer (Therm Test Inc., TPS
2500, Sweden) was used to measure the thermal conductivity (λ) of the solid and foamed
samples, as explained in [37]. Figure 4.2 shows the encapsulated nickel-spiral sensor
sandwiched between two halves of the sample (30 mm × 30 mm each), assuring that the halves
are in contact with the sensor. Two halves of the test samples were cut from the injection-
molded sample. During testing, a constant electric power was supplied to the sensor, and the
temperature increase was recorded. For each test, the power output and test duration ranged
between 0.005-0.025 W and 15-80 s, respectively, depending on each sample’s thermal
characteristics. The tests were all conducted at the room temperature. In each one, three samples

57
were tested with at least three measurement replications, and the grand average values were
reported.
Figure 4.2: Schematic of the transient plane source set up for thermal conductivity
measurement.
4.3.4. Mechanical Property Characterization
The ASTM D790 standard was adopted for the flexural three-point bending test of solid and
foam samples. The specimens were cut from the injection-molded parts. All of the specimens
had a width (w) of 12.7 mm and a span length (L) of 80 mm. Depending on the specimen’s
thickness, the crosshead speed varied between 0.5-1.5 mm/min., assuring that the strain rate at its
outer surface did not deviate from 0.01 mm/mm/min. [39]. A computer-controlled Instron
mechanical testing system was used to carry out the bending tests, and five specimens were
tested for each case.

58
4.4. Results and Discussion
4.4.1. Foam Structure
Figure 4.3a schematically illustrates the foam injection-molded sample structure and Figure
4.3b shows representative SEM micrographs from various locations of the samples. Three
distinct regions were observed in the morphology: the skin layer, the transition region, and the
core region. As expected, the skin layer presented a solid (unfoamed) structure that was about
0.5-0.7 mm thick. Both the transition and core regions had a cellular structure, but with different
cell morphologies. As Figure 4.3b shows, the transition region formed a closed-cell region (0.2-
0.4 mm) immediately next to the skin layer, and followed by another region (0.8-1.1mm) that
had severely elongated cells in the thickness direction.
(a)

59
(b)
Figure 4.3: (a) A schematic showing the overall structure of the foam injection-molded
sample using mold opening, and (b) Representative SEM micrographs, obtained at
temperature of 300oC, showing the skin layer and the transition and core regions of the
injection-molded samples using mold opening.
In the core region, which was the major part of the injection-molded samples, the cells were
relatively uniform in size and in distribution, and they were interconnected with an open-cell
structure in most cases. The differences between the cell morphology in the core and transition
regions originated from the temperature differences. The sample started to solidify from the skin
layer. Consequently, the growth of the cells in the transition region was hindered sooner, and this
resulted in the formation of smaller-sized cells with a closed structure. Some of these closed cells
adjacent to the core region were elongated in the thickness direction due to the stretching caused
by the mold opening in that direction. The following is the explanation for the formation of the
open-cell structures in the core region.
The opening of the mold could enable excessive cell growth, and extremely thin cell walls
[32, 35]. Because of the limitation of the equipment used in this study, unfortunately it was not

60
practical to have a close control on the opening speed. Pinholes on the cell walls could be created
as a result of the induced biaxial stretching from expansion and polymer shrinkage of the thin
walls during the solidification [40-43]. Furthermore, opening of the mold caused the melt to flow
one-dimensionally, causing the cells to grow further in the thickness direction and to experience
additional shear and extensional stresses. Especially, the low melt strength of linear
polycarbonate used in our study can cause cell wall rupturing and opening easily.
Figure 4.4a shows the variations of the set ratio and the actual expansion ratio, as a function
of the degree of mold opening. The mold-opening length of 0, 2.5, 5, 9, and 10.6 mm in this
figure represents samples with 3.2, 5.7, 8.3, 12.2, and 13.8 mm in thickness, respectively. Due to
the existence of the solid skin layer and the transition region, the actual expansion ratio in the
core region was different from the set expansion ratio. The actual expansion ratio was higher
than the set ratio. Both increased proportionally with increased mold-opening length. To
evaluate its uniformity across the thickness of the core, the actual expansion ratio was measured
at two different locations in the core region, namely in Core I and Core II (Figure 4.3a). In each
case, the expansion ratios measured at the Core I and II locations were very similar. This
indicated that a uniform degree of expansion ratio could be achieved across the entire thickness
of the core region. It was observed that opening of the mold up to 10.6 mm caused further
expansion. At the set processing parameters, when the degree of mold opening was increased,
more space was provided for the growing cells in the sample’s thickness direction. Thus, the
cells could grow further because of the decreased pressure and the increased space. But we noted
that further opening of the mold more than 10.6 mm did not result in any additional expansion.

61
(a)
(b)

62
Figure 4.4: (a) Variations of the set and actual expansion ratios with the degree of mold
opening (gas content: 0.3 wt.%, melt temperature: 300 °C), and (b) Variation of the open-
cell content with actual expansion ratio.
Figure 4.4b shows the open-cell content variations with the actual expansion ratio in the
Core I and II regions. The open-cell content increased with the expansion ratio at two different
rates. As the expansion ratio was increased from 1 to 4, the open-cell content did not increase
much. Further increase of the expansion ratio, however, significantly increased the open-cell
content. It seems that the cell walls were relatively thick at the very low expansion ratios and, as
the expansion ratio was increased, the cell wall thickness started to decrease due to cell growth
[44]. It may be assumed that there was a critical expansion ratio at which cell wall thinning
could have occurred sufficiently to facilitate the pin hole development in most of the cell walls.
As Figure 4.4b shows, at least a four-fold expansion was required to effectively interconnect the
cells. At an expansion ratio of 7.2, a structure with open-cell content close to 79% could be
successfully produced. Further, for both Core I and II regions, the open-cell content was similar,
indicating a uniform degree of cell opening across the entire core region. To study more on cell
opening and possible cell coalescence during cell growth, the cell density was calculated. The
samples with expansion ratios of 4.2, 6.0, and 7.2 exhibited the cell density of 8.2E6/cm3,
2.2E6/cm3, and 1.5E6 cells/cm
3, respectively. This indicates that cell coalescence took place
actively during cell growth especially between expansion ratios of 4.2 and 6.0. The SEM
micrographs of injection-molded samples with actual expansion ratios of 4.2, 6, and 7.2 are
shown in Figure 4.5. An average cell size of 58 µm, 107 µm, and 132 µm was respectively
observed.
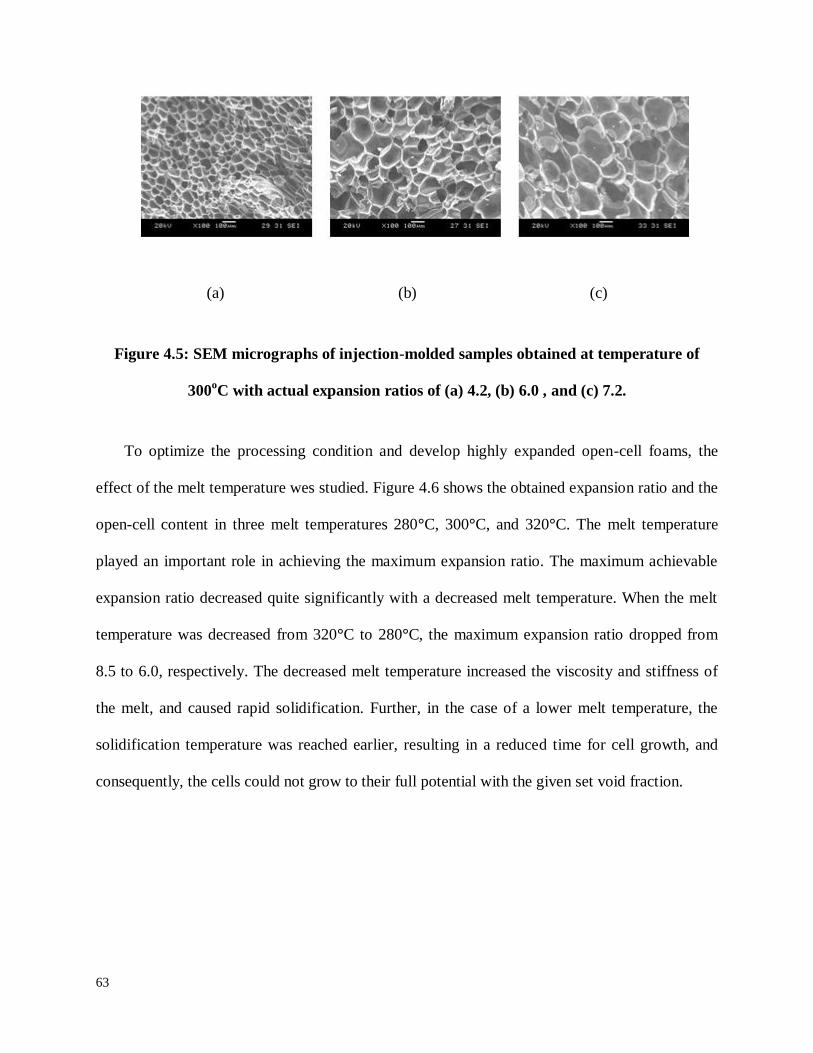
63
(a) (b) (c)
Figure 4.5: SEM micrographs of injection-molded samples obtained at temperature of
300oC with actual expansion ratios of (a) 4.2, (b) 6.0 , and (c) 7.2.
To optimize the processing condition and develop highly expanded open-cell foams, the
effect of the melt temperature wes studied. Figure 4.6 shows the obtained expansion ratio and the
open-cell content in three melt temperatures 280°C, 300°C, and 320°C. The melt temperature
played an important role in achieving the maximum expansion ratio. The maximum achievable
expansion ratio decreased quite significantly with a decreased melt temperature. When the melt
temperature was decreased from 320°C to 280°C, the maximum expansion ratio dropped from
8.5 to 6.0, respectively. The decreased melt temperature increased the viscosity and stiffness of
the melt, and caused rapid solidification. Further, in the case of a lower melt temperature, the
solidification temperature was reached earlier, resulting in a reduced time for cell growth, and
consequently, the cells could not grow to their full potential with the given set void fraction.

64
(a)
5.0
5.5
6.0
6.5
7.0
7.5
8.0
8.5
9.0
280 °C 300 °C 320 °C
Exp
ensi
on
rat
io(-
)
Melt temperature
Core I Core II
50.0
55.0
60.0
65.0
70.0
75.0
80.0
85.0
90.0
280 °C 300 °C 320 °C
Op
en-c
ell C
on
ten
t(%
)
Melt temperature
Core I Core II
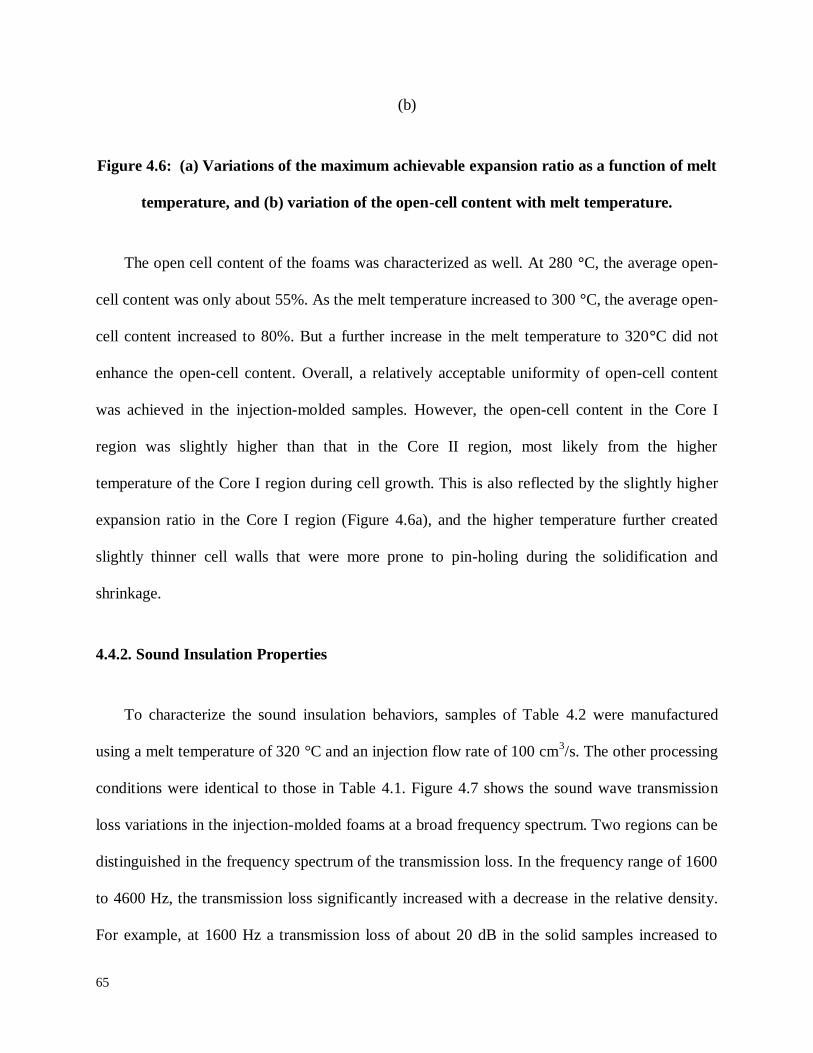
65
(b)
Figure 4.6: (a) Variations of the maximum achievable expansion ratio as a function of melt
temperature, and (b) variation of the open-cell content with melt temperature.
The open cell content of the foams was characterized as well. At 280 °C, the average open-
cell content was only about 55%. As the melt temperature increased to 300 °C, the average open-
cell content increased to 80%. But a further increase in the melt temperature to 320°C did not
enhance the open-cell content. Overall, a relatively acceptable uniformity of open-cell content
was achieved in the injection-molded samples. However, the open-cell content in the Core I
region was slightly higher than that in the Core II region, most likely from the higher
temperature of the Core I region during cell growth. This is also reflected by the slightly higher
expansion ratio in the Core I region (Figure 4.6a), and the higher temperature further created
slightly thinner cell walls that were more prone to pin-holing during the solidification and
shrinkage.
4.4.2. Sound Insulation Properties
To characterize the sound insulation behaviors, samples of Table 4.2 were manufactured
using a melt temperature of 320 °C and an injection flow rate of 100 cm3/s. The other processing
conditions were identical to those in Table 4.1. Figure 4.7 shows the sound wave transmission
loss variations in the injection-molded foams at a broad frequency spectrum. Two regions can be
distinguished in the frequency spectrum of the transmission loss. In the frequency range of 1600
to 4600 Hz, the transmission loss significantly increased with a decrease in the relative density.
For example, at 1600 Hz a transmission loss of about 20 dB in the solid samples increased to

66
more than 55 dB when the relative density was decreased to 0.2. At higher frequencies, however,
the transmission loss in all of the samples converged to a lower value, independent of their
relative density. In panel-type sound absorbers, the resistance of the front panel for fast shaping
attenuates the energy of the sound wave [45]. This attenuation depends strongly on the mass of
the panel. It has been shown that each time the panel mass is doubled, its transmission loss is
improved by 6 dB. Therefore, the small expansion of the foam in the transition region close to
the skin layer (Figure 4.3) is an advantage as it maintains a relatively dense front layer [45]. On
the other hand, an open-cell structure in the core region would improve the sound wave
absorption [15, 45].
Table 4.2: Degree of mold opening and the resultant set expansion ratio and relative
density of the injection-molded samples.
Sample
#
Open-cell
content
Degree of
mold
opening
(mm)
Set
expansion
ratio (-)
Relative
density (-)
Average
cell size
(µm)
Average
cell density
(Cells/cm3)
1 0 0.0 1.0 1.00 - -
2 3 2.6 1.8 0.55 42 1.3E7
3 10 5.7 2.8 0.36 63 9.3E6

67
4 77 9.1 3.8 0.26 115 2.7E6
5 82.5 12.8 5.0 0.20 163 8.2E5
(a)

68
(b)
Figure 4.7: (a) Transmission loss versus frequency for the foam injection-molded samples
with various relative densities, and (b) area under transmission loss vs. frequency curves
for foam injection-molded samples with various relative densities.
Further, the transmission loss spectrum of all the samples presented a minimum value,
which corresponded to the transmission loss at their natural frequency [45]. It was seen that the
natural frequency of the samples increased with a decreased density. In other words, the
minimum transmission loss occurred at higher frequencies as the expansion ratio increased. This,
in turn, widened the frequency range at which the transmission loss was higher, implying that
such highly expanded samples can be used in a variety of environments with various noise
frequencies. In addition, the minimum transmission loss corresponding to the natural frequency
slightly increased as the expansion ratio increased.
To assess the overall performance of the samples in a wide frequency range, the area under
0.E+00
2.E+04
4.E+04
6.E+04
8.E+04
1.E+05
1.E+05
1.E+05
2.E+05
2.E+05
2.E+05
1.00 0.55 0.36 0.26 0.20
Are
a u
nd
er t
he
tran
smis
sio
n lo
ss
vs fr
equ
ency
(db
.Hz)
Relative density

69
the transmission loss vs. the frequency curve was calculated and is shown in Figure 4.7b as a
function of the relative density. Clearly, the area increased with a decreased relative density. The
improvement of the transmission loss by the introduction of foaming (for the same mass) was
achieved by three different mechanisms: 1) the increased thickness of the foam between the two
skin layers [46]; 2) the increase in the structural damping, which was higher in the more
expanded foam due to the skin layer’s resonant bending mode acting as a front panel [47]; and
3) an increased open-cell content obtained at a lower density [23, 48] that damped the energy of
air molecules traveling from one cell to another via thermal conductivity and viscosity [49].
4.4.3. Thermal Insulation Properties
Figure 4.8 shows the variations of the thermal conductivity of injection-molded foam
samples with relative density. Overall, as expected, the thermal conductivity decreased with
decreased relative density. By introducing a relative density of 0.2, the thermal conductivity of
the PC solid samples reduced from 0.20 W/m.K to about 0.04 W/m.K, i.e., more than fivefold.
At higher relative densities (that is, at lower expansion ratios), the thermal conductivity increased
at a greater rate with an increased relative density. However, at a relative density lower than
0.36, the rate of change of the conductivity was not high. The theoretical thermal conductivity of
the high-density foams can be predicted using the following equation [50]:
matrixmatrixgasgastheo VV (4.5)
where λgas and λmatrix are the conductivity of nitrogen gas or air (0.026 W/m.K) [49] and
conductivity of the PC matrix, respectively. ξ is the tortuosity factor, a parameter directly related
to the inherent irregularity of foam, which implicitly considers the effect of cellular structure
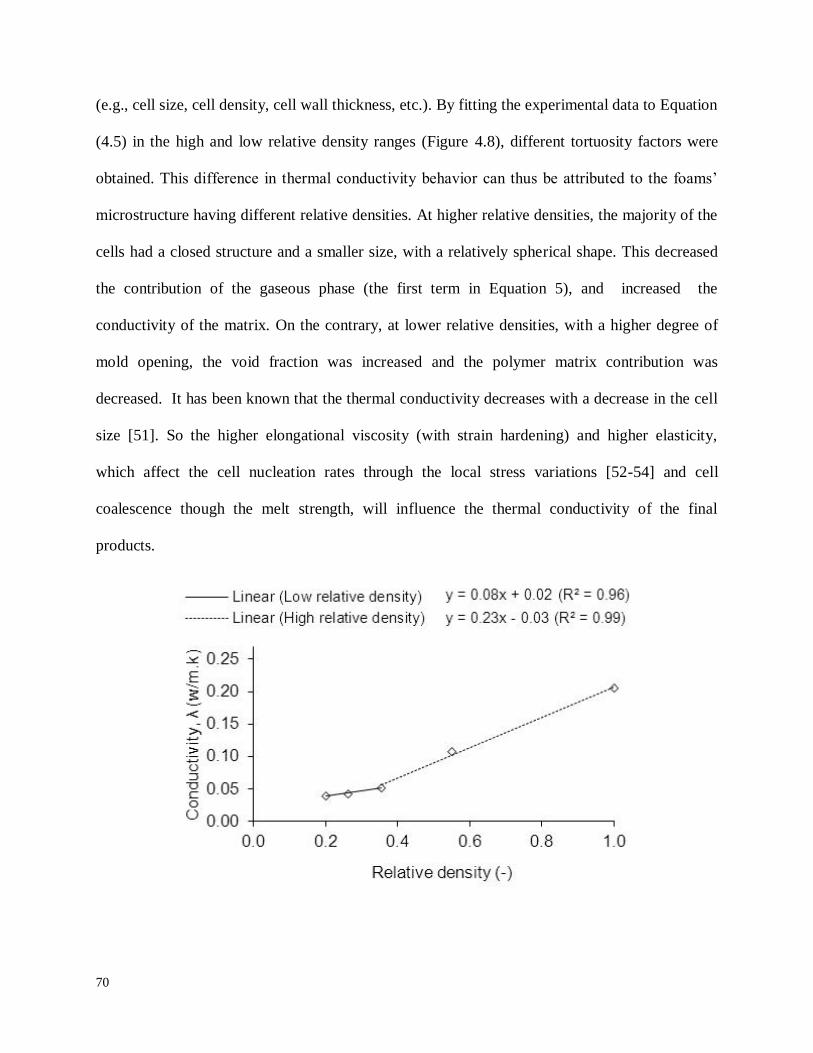
70
(e.g., cell size, cell density, cell wall thickness, etc.). By fitting the experimental data to Equation
(4.5) in the high and low relative density ranges (Figure 4.8), different tortuosity factors were
obtained. This difference in thermal conductivity behavior can thus be attributed to the foams’
microstructure having different relative densities. At higher relative densities, the majority of the
cells had a closed structure and a smaller size, with a relatively spherical shape. This decreased
the contribution of the gaseous phase (the first term in Equation 5), and increased the
conductivity of the matrix. On the contrary, at lower relative densities, with a higher degree of
mold opening, the void fraction was increased and the polymer matrix contribution was
decreased. It has been known that the thermal conductivity decreases with a decrease in the cell
size [51]. So the higher elongational viscosity (with strain hardening) and higher elasticity,
which affect the cell nucleation rates through the local stress variations [52-54] and cell
coalescence though the melt strength, will influence the thermal conductivity of the final
products.

71
Figure 4.8: Variations of thermal conductivity of foam injection-molded samples with
relative density. The lines are the least-square fits to the experimental data at high and low
relative density ranges.
4.4.4. Flexural Properties
Figure 4.9 shows the specific flexural modulus and the strength of the injection-molded solid
and foamed samples with various relative densities. Specific values of the modulus and the
strength were obtained by dividing the actual values by the density of the tested samples. The
variations of the flexural properties with relative density were not monotonic. At higher relative
densities, the introduction of foaming did not significantly decrease the specific flexural modulus
and strength. For example, at a relative density of 0.36, these values decreased by only 14% and
5%, respectively, compared with their corresponding solid values. With a further decrease in the
relative density, the specific modulus and strength of the foams sharply decreased. At the lowest
relative density, their values came to 18% and 55%, respectively, of their corresponding solid
values. The sharp decrease in flexural properties at lower relative densities must have been
related to the creation of the open-cell structure with thin cell walls. This was in contrast to the
relatively smaller-sized closed cells in the foams with high relative densities.
0
500
1000
1500
2000
2500
1.00 0.55 0.36 0.26 0.20
Specific
modulu
s
(MP
a.c
m3.g
-1)
Relative density (-)
(a)
0
20
40
60
80
1.00 0.55 0.36 0.26 0.20
Specific
str
ength
(M
Pa.c
m3.g
-1)
Relative density (-)
(b)

72
Figure 4.9: Specific flexural modulus (a) and strength (b) of the injection-molded solid and
foamed samples with various relative densities.
4.5. Conclusion
Highly expanded rigid polycarbonate (PC) foams with a uniformly distributed open-cell
structure were developed using injection-molding process equipped with a mold opening
technique and gas counter-pressure (GCP). The cellular structure, sound and thermal insulation,
and mechanical performance of the foams were also evaluated.
PC foams with expansion ratios of as high as eightfold and open-cell contents of as high as
85% were successfully fabricated by tuning the foam injection-molding processing parameters. It
was found that the degree of mold opening, the melt temperature, and the injection flow rate
were the most influential parameters in creating a cellular structure with a high open-cell content.
The introduction of high expansion with a high open-cell content to the solid PC samples
increased the sound wave transmission loss up to 2.5 times and decreased the thermal
conductivity by more than fivefold, while maintaining more than 50% of the specific flexural
strength. This research discloses that highly-expanded rigid open-cell PC foams can be
effectively used in the sound and thermal insulation applications.

73
4.6. References
[1] Mergler, Y. J., Kampen, R. J. v., Nauta, W.J., Schaake, R.P., Raas, B., Grinesven, J.G.H.,
Meesters, C.J.M., Influence of yield strength and toughness on friction and wear of
polycarbonate, Wear 258(5–6): 915-923, 2005.
[2] Ashby, M. F., Chapter 15 - Materials and the environment. materials selection in mechanical
design, fourth edition (Oxford, Butterworth-Heinemann): 437-459, 2011.
[3] Collias, D. I., Baird D. G., Impact toughening of polycarbonate by microcellular foaming.
Polymer 35(18): 3978-3983, 1994.
[4] Li, X., Hristov, H. A., Yee, A., Gidley, D. Influence of cyclic fatigue on the mechanical
properties of amorphous polycarbonate. Polymer 36(4): 759-765, 1995.
[5] Mikroyannidis, J. A., Physical, Thermal and mechanical properties of phenolphthalein
polycarbonate. European Polymer Journal 22(2): 125-128, 1986.
[6] Weller, J. E., Kumar, V., Solid-state microcellular polycarbonate foams. ii. The effect of cell
size on tensile properties. Polymer Engineering and Science 50(11): 2170-2175, 2010.
[7] Bledzki, A. K., Rohleder, M., Kirschling, K., Chate A., Microcellular polycarbonate with
improved notched impact strength produced by injection moulding with physical blowing agent.
Cellular Polymers 27(6): 327-345, 2008.

74
[8] Bledzki, A. K., Kirschling, H., Rohleder, M., Chate, A., Correlation between injection
moulding processing parameters and mechanical properties of microcellular polycarbonate.
Journal of Cellular Plastics 48(4): 301-340, 2012.
[9] Bledzki, A. K., M. Rohleder, Kirschling, H., Chate, A., Correlation between morphology and
notched impact strength of microcellular foamed polycarbonate. Journal of Cellular Plastics
46(5): 415-440, 2010.
[10] Soto, P. F., Herráez, M., González, A., De Saja, J.A., Acoustic impedance and absorption
coefficient measurements of porous materials used in the automotive industry. Polymer Testing
13(1): 77-88, 1994.
[11] Navacerrada, M. A., Fernández, P., Díaz, C., Pedrero, A., Thermal and acoustic properties
of aluminium foams manufactured by the infiltration process. Applied Acoustics 74(4): 496-501,
2013.
[12] Li, K. M., Tao, H., On the asymptotic solution of sound penetration into a rigid porous half-
plane: a modified saddle point method. Journal of Sound and Vibration 332(19): 4584-4596,
2013.
[13] Gourdon, E., Seppi, M., On the use of porous inclusions to improve the acoustical response
of porous materials: analytical model and experimental verification. Applied Acoustics 71(4):
283-298, 2010.
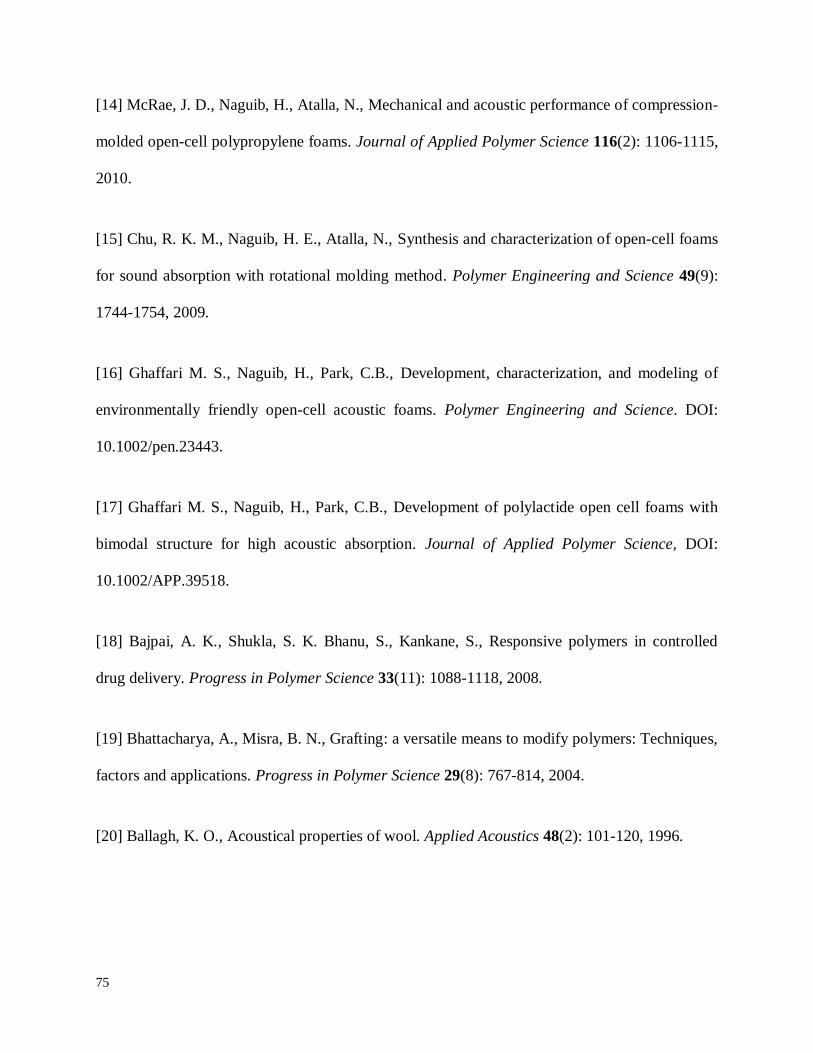
75
[14] McRae, J. D., Naguib, H., Atalla, N., Mechanical and acoustic performance of compression-
molded open-cell polypropylene foams. Journal of Applied Polymer Science 116(2): 1106-1115,
2010.
[15] Chu, R. K. M., Naguib, H. E., Atalla, N., Synthesis and characterization of open-cell foams
for sound absorption with rotational molding method. Polymer Engineering and Science 49(9):
1744-1754, 2009.
[16] Ghaffari M. S., Naguib, H., Park, C.B., Development, characterization, and modeling of
environmentally friendly open-cell acoustic foams. Polymer Engineering and Science. DOI:
10.1002/pen.23443.
[17] Ghaffari M. S., Naguib, H., Park, C.B., Development of polylactide open cell foams with
bimodal structure for high acoustic absorption. Journal of Applied Polymer Science, DOI:
10.1002/APP.39518.
[18] Bajpai, A. K., Shukla, S. K. Bhanu, S., Kankane, S., Responsive polymers in controlled
drug delivery. Progress in Polymer Science 33(11): 1088-1118, 2008.
[19] Bhattacharya, A., Misra, B. N., Grafting: a versatile means to modify polymers: Techniques,
factors and applications. Progress in Polymer Science 29(8): 767-814, 2004.
[20] Ballagh, K. O., Acoustical properties of wool. Applied Acoustics 48(2): 101-120, 1996.

76
[21] Li, N., Xiao, C., Mei, S., Zhang, S., The multi-pore-structure of polymer–silicon hollow
fiber membranes fabricated via thermally induced phase separation combining with stretching.
Desalination 274(1–3): 284-291, 2011.
[22] Kohlhoff, D., Ohshima, M., Open cell microcellular foams of polylactic acid (PLA)-based
blends with semi-interpenetrating polymer networks. Macromolecular Materials and
Engineering 296(8): 770-777, 2011.
[23] Park, C. B., Padareva, V., Lee, P.C., Naguib, H. Extruded open-celled LDPE-based foams
using non-homogeneous melt structure. Journal of Polymer Engineering 25(3), 239-260, 2005.
[24] Lee, P. C., Wang, J., Park, C.B., Extruded open-cell foams using two semicrystalline
polymers with different crystallization temperatures. Industrial and Engineering Chemistry
Research 45(1): 175-181, 2006.
[25] Lee, P.C., Wang, J., Park, C.B., Extrusion of microcellular open-cell LDPE-based sheet
foams. Journal of Applied Polymer Science 102, 3376-3384, 2006.
[26] Lee, P. C., Naguib, H. E., Park, C. B., Increase of open-cell content by plasticizing soft
regions with secondary blowing agent. Polymer Engineering and Science 45(10): 1445-1451,
2005.
[27] Lee, P. C., Li, G., Lee, J.W.S., Park, C. B., Improvement of cell opening by maintaining a
high temperature difference in the surface and core of a foam extrudate. Cellular Plastics 43(6):
431-444, 2007.
77
[28] Kramschuster, A. and Turng, L. S., An injection molding process for manufacturing highly
porous and interconnected biodegradable polymer matrices for use as tissue engineering
scaffolds. Journal of Biomedical Materials Research - Part B Applied Biomaterials 92(2): 366-
376, 2010.
[29] Cui. Z., Nelson, B., Peng, Y., Li, K., Pilla, S., Li, W., Turng, L., Shen, C. Fabrication and
characterization of injection molded poly (ε-caprolactone) and poly (ε-
caprolactone)/hydroxyapatite scaffolds for tissue engineering. Materials Science and
Engineering: C 32(6): 1674-1681, 2012.
[30] Cui, Z., Zhao, H., Peng, Y., Kaland, M., Turng, L. S., and Shen, C., Morphology and
properties of porous and interconnected poly(ε -caprolactone) matrices using solid and
microcellular injection molding. Journal of Biobased Materials and Bioenergy 6(3): 259-268,
2012.
[31] Cui, Z., Peng, Y., Li, K., Peng, J., Pilla, S., Li, W-J., Turng, L-S., Shen, C., A study on the
in-vitro degradation rate of polyanhydride (poly(sebacic acid), diacetoxy terminated, psadt) for
potential drug delivery and tissue engineering scaffold applications. Journal of Wuhan
University of Technology-Materials Science Edition, 28(4):793-797, 2013.
[32] Jahani, D., Ameli, A, Jung, P., Barzegari, M.R., Park, C.B., and Naguib, H., Open-cell
cavity-integrated injection-molded acoustic polypropylene foams. Materials and Design 53: 20-
28, 2014.

78
[33] Zhang, C., Li, J., Hu, Z., Zhu, F., Huang, Y., Correlation between the acoustic and porous
cell morphology of polyurethane foam: Effect of interconnected porosity. Materials & Design
41(0): 319-325, 2012.
[34] Ishikawa, T., Taki, K., Ohshima, M., Visual observation and numerical studies of N2 vs.
CO2 foaming behavior in core-back foam injection molding. Polymer Engineering and Science
52, 875-883, 2012.
[35] Ameli, A., Jahani, D. Jung, P., Park, C.B., Processing and characterization of solid and
foamed injection-molded polylactide with talc. Journal of Cellular Plastics 49(4): 351-375,
2013.
[36] Bledzki, A., Kuhn, J., Kirschling, H., Pitscheneder,W., Microcellular injection molding of
PP and PC/ABS with precision mold opening and gas counterpressure. Cellular Polymers 27,
91-100, 2008.
[37] Ameli, A., Jahani, D., Nofar, M., Jung, P., Park, C.B., Development of high void fraction
polylactide composite foams using injection molding: mechanical and thermal insulation
properties. Composite Science and Technology 90: 88-95, 2014.
[38] Lee, J. W. S., Wang, J., Yoon, J.D., and Park, C.B., Strategies to achieve a uniform cell
structure with a high void fraction in advanced structural foam molding. Industrial and
Engineering Chemistry Research 47(23): 9457-9464, 2008.
[39] Lee, J., Turng, L. S., Dougherty, E., Gorton, P. A novel method for improving the surface
quality of microcellular injection molded parts. Polymer 52(6): 1436-1446, 2011.
79
[40] Naguib, H.E., Park, C.B., Reichelt, N. Fundamental foaming mechanisms governing volume
expansion of extruded PP foams. Journal of Applied Polymer Science 91(4): 2661- 2668, 2004.
[41] Park, C.B., Behravesh, A.H., Venter, R.D., Low-density, microcellular foam processing in
extrusion using CO2. Polymer Engineering and Science 38(11): 1812-1823, 1998.
[42] Zhai, W.T., Kuboki, T., Wang, L., Park, C.B., Lee, E.K., and Naguib, H.E., Cell structure
evolution and the crystallization behavior of polypropylene/clay nanocomposites foams blown in
continuous extrusion. Industrial & Engineering Chemistry Research 49 (20): 9834-9845, 2010.
[43] Mihai, M., Huneault, M., Favis, B.D., Crystallinity development in cellular poly(lactic acid)
in the presence of supercritical carbon dioxide. Journal of Applied Polymer Science 113(5):
2920-2932, 2009.
[44] Park, C.B., Padareva, V., Lee, P.C. and Naguib, H.E., Extruded open-celled LDPE and
LDPE/PS foams using non-homogeneous melt structure, Journal of Polymer Engineering 25:
239–260, 2005.
[45] Sgard, F.C., Atalla, N., Nicolas, J., A numerical model for the low frequency diffuse field
sound transmission loss of double-wall sound barriers with elastic porous linings. Acoustic
Society of America 108(6): 2865–72, 2000.
[46] Tayong, R., Dupont, T., Philippe, L., Experimental investigation of holes interaction effect
on the sound absorption coefficient of micro-perforated panels under high and medium sound
levels. Applied Acoustics 72(10): 777-784, 2011.

80
[47] Toyoda, M., Sakagami, K., Daiji, T., Masayuki, M., Effect of a honeycomb on the sound
absorption characteristics of panel-type absorbers. Applied Acoustics 72(12): 943-948, 2011.
[48] Lee, P.C., Naguib, H.E., Park, C.B., Wang, J., Increase of open-cell Content by plasticizing
soft regions with secondary blowing agent. Polymer engineering and science 45(10) : 1445-
1451, 2005.
[49] Atalla, Y., Fu, J., Atalla, N., Naguib, H., Study of the effects of processing parameters on
the sound absorption of open-cell microcellular polymeric foams. Noise Control Engineering
58(1):18-26, 2010.
[50] Antunes, M., Realinho, V., Solórzano, E., Rodríguez-Pérez, M.A., de Saja, J.A., Velasco,
J.I., Thermal conductivity of carbon nanofibre-polypropylene composite. Defect and Diffusion
Forum 297: 996-1001, 2010.
[51] Glicksman,L. R. Low density cellular plastics: physical basis of behaviour (Eds: N.C.
Hilyard, A. Cunningham), Chapman and Hall, London , Ch. 5, 1994.
[52] Leung, S.N., Wong, A., Wang, L.C., Park, C.B, Mechanism of extensional stress-induced
cell formation in polymeric foaming processes with the presence of nucleating agents. Journal of
Supercritical Fluids, 63: 187-198, 2012.
[53] Wong, A., Guo, Y., Park, C.B., Fundamental mechanisms of cell nucleation in
polypropylene foaming with supercritical carbon dioxide - effects of extensional stresses and
crystals. Journal of Supercritical Fluids, 79: 142–151, 2013.

81
[54] Wong, A., Wijnands, S.F.L., Kuboki, T., Park, C.B., Mechanisms of nanoclay-enhanced
plastic foaming processes – effects of nanoclay intercalation and exfoliation. Journal of
Nanoparticle Research, 15 (8) :1815-1829, 2013.

82
Chapter 5: Development of
Air-Gap Integrated Acoustic
Open-Cell Foams for Sound
Absorption
5.1. Introduction
In chapter 3, simulation results proved that with considering an air-gap, the peak absorption
coefficient of open-cell foams may decrease significantly. It was absorbed that for low-frequency
sound insulation with conventional open-cell foams, a considerable foam thickness is required
[1]. Multi-layer acoustic foams [2-3] constructed with a front panel, open-cell foam, and an air-
gap promise to provide alternative solutions for low-frequency sound absorption (400Hz to

83
1600Hz). In some applications, the front panels were perforated to enhance their acoustic
behavior [4-5]. The costs associated with multi-layer acoustic foams are relatively high and, in
most cases, the open-cell foams used in such insulators are not recyclable. It is thus of great
value to develop cost-effective and recyclable alternatives to these resonators. In this study, the
conventional foam injection-molding process equipped with mold opening and gas counter-
pressure techniques was used to produce multilayer sound insulation foams. It successfully
produced relatively low-density open-cell foams and created air-gap integrated acoustic foams. A
mechanized perforating apparatus was also developed to assess the effects of perforation on the
structure’s acoustic behavior. The sample structure, cell morphology, and acoustic behavior of
the foams were then thoroughly investigated.
5.2. Experimental
5.2.1. Sample Preparation – Foam Injection Molding
To achieve an effective acoustic foam using the injection-molding process, the three
requirements should be met: (i) capability to produce foams with relatively high void fractions;
(ii) to interconnect the cells to increase the open-cell content; and (iii) to create cavity inside the
foams to enhance their acoustic behavior. The opening of the mold enabled the melt to flow one-
dimensionally in the sample thickness direction, causing the cells to grow further in that
direction and to experience additional shear and extensional stresses. The temperature of the
polymer melt was tuned to obtain optimum melt strength and thus enhanced the cell growth
capacity while preventing the cells from collapsing [6-7]. Excessive cell growth resulted in
extremely thin cell walls and thus pinholes on the cell walls could be created as a result of the
induced biaxial stretching from expansion and polymer shrinkage of the thin walls during the

84
solidification [7-8]. Especially, the low melt strength of linear polypropylene used in our study
can cause cell wall rupturing and opening easily [9]. After the cells were expanded and
solidified, a further opening of the mold in a timely manner initiated a crack in the foam core as a
result of residual stress on the foam. Eventually, an opening in the mold caused a full-length
crack in the foam core and a cavity was developed in the middle of the foam. The mold was kept
cold (i.e., at room temperature) to enable rapid solidification of the foam and to create a residual
stress in the foam core. The length of the mold opening was adjusted to produce a foamed
structure without a cavity and also cavity-integrated acoustic foams of different thicknesses.
The commercially available injection-molding grade of polypropylene (PP), Certene PHM35
was used. It was provided in a pellet form and had a specific gravity of 0.903 g/cm3, a melt flow
index of 35 g/min, and a Vicat softening temperature of 152 °C. Nitrogen (N2) was supplied by
Linde Gas, and used as the physical blowing agent. A 50-ton Arburg Allrounder 270/320 C
injection-molding machine (Lossburg, Germany), with a 30-mm diameter screw equipped with
MuCell® technology (Trexel, Inc., Woburn, Massachusetts), and a gas counter-pressure module
(Caropreso Associates, MA, US) were used to conduct the injection-molding experiments. The
mold contained a rectangular cavity with a fan gate at one end. The cavity dimensions were 135
mm × 111 mm × 3.2 mm. More details about the mold can be found in [10-11]. The mold cavity
was first pressurized at about 6 MPa, and then the polymer/gas mixture was injected into it while
the gas counter-pressure was maintained to avoid premature cell nucleation and growth during
filling. The mold cavity was filled partially by injection (i.e., 75% of the full shot) and foaming
was induced later by releasing the gas from the mold cavity and mold opening. Figure 5.1(a)
shows the sequences of the steps for a full injection cycle and the level of the desired cavity
pressures. As Figure 5.1b shows, mold cavity pressures were also measured at three different
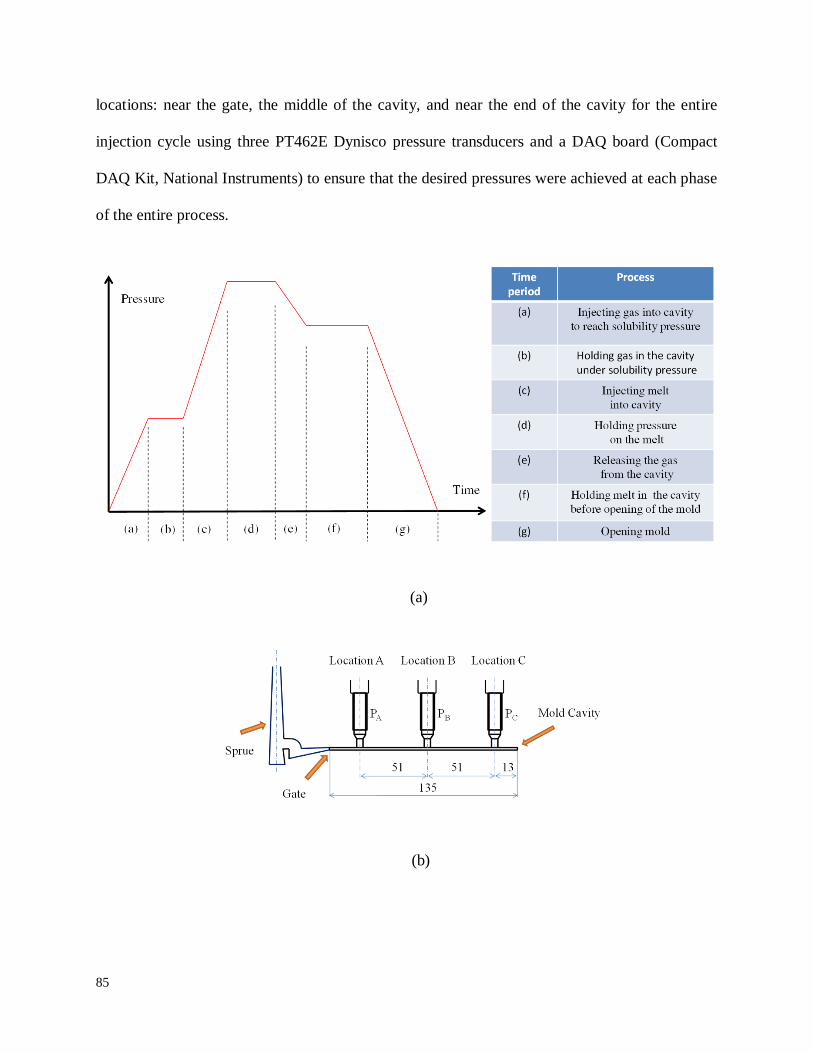
85
locations: near the gate, the middle of the cavity, and near the end of the cavity for the entire
injection cycle using three PT462E Dynisco pressure transducers and a DAQ board (Compact
DAQ Kit, National Instruments) to ensure that the desired pressures were achieved at each phase
of the entire process.
(a)
(b)

86
Figure 5.1: (a) Designed cavity pressure profile for foam injection-molding, and (b) a
schematic drawing showing the locations of the pressure transducers in the mold cavity.
The unit for all the dimensions is in millimeter.
Table 5.1 summarizes the fixed and varied foam injection-molding parameters. The
optimum values for the fixed parameters were first determined by a series of trial and error
experiments. With a short delay (about 2s) after the polymer melt was injected into the cavity,
the mold was opened enabling the cells to grow. An optimized delay was intended to allow the
skin of the injection-molded part to be solidified before opening the mold to maintain structural
integrity. Avoiding or shortening the delay time resulted in non-flatness of the skin of the
injection-molded parts. Longer delays produced a thicker solidified skin, which was not suitable
for obtaining high expansion ratio foams and creating foam cavities.
Table 5.1: Fixed and varied parameters in the injection molding of acoustic foams.
Shot size (cm3) 39 (75% of full shot)
Barrel pressure (MPa) 19
Gas injection pressure (MPa) 24
Screw speed (rpm) 300
Metering time (s) 8
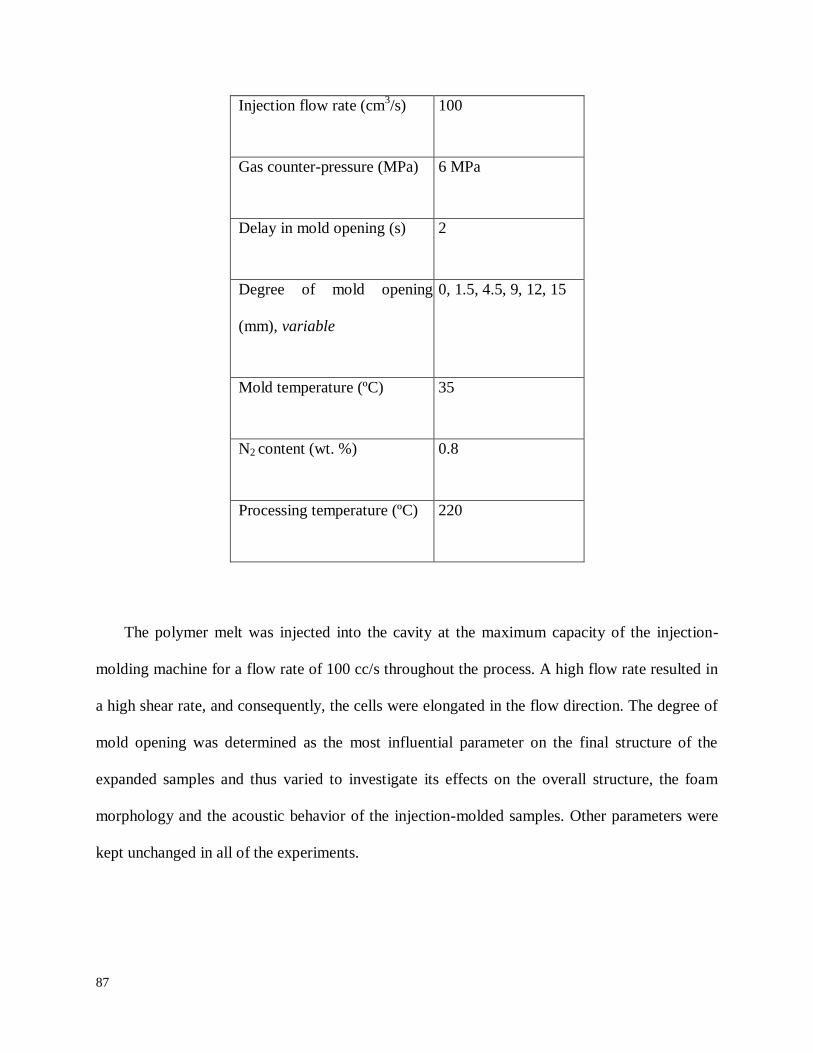
87
Injection flow rate (cm3/s) 100
Gas counter-pressure (MPa) 6 MPa
Delay in mold opening (s) 2
Degree of mold opening
(mm), variable
0, 1.5, 4.5, 9, 12, 15
Mold temperature (ºC) 35
N2 content (wt. %) 0.8
Processing temperature (ºC) 220
The polymer melt was injected into the cavity at the maximum capacity of the injection-
molding machine for a flow rate of 100 cc/s throughout the process. A high flow rate resulted in
a high shear rate, and consequently, the cells were elongated in the flow direction. The degree of
mold opening was determined as the most influential parameter on the final structure of the
expanded samples and thus varied to investigate its effects on the overall structure, the foam
morphology and the acoustic behavior of the injection-molded samples. Other parameters were
kept unchanged in all of the experiments.

88
5.2.2. Foam Characterization
The foam density (ρf) was measured using the water-displacement method (ASTM: D792-
08 http://www.astm.org/Standards/D792.htm ), and the relative density (ρN) or expansion ratio
was calculated as the ratio of the measured density of the foam sample (ρf) and the density of the
corresponding unfoamed material (ρs). To measure cell size and density, the samples were
freeze-fractured and then coated with platinum using a sputter coater. The microstructures were
then examined using a scanning electron microscope (SEM), JEOL JSM-6060. The image
processing was carried out using ImageJ software, developed by the National Institutes of
Health, US. The cell density was calculated from a micrograph and using the equation
(5.1)
where n is the number of voids in the micrograph, A is the area of the micrograph, and M is the
magnification factor of the micrograph. The open-cell content of foams was measured using a
gas pycnometer (Quantachrome Instrument UltraFoam 1000) in accordance with the ASTM
D6226-10 http://www.astm.org/Standards/D6226.htm .
5.2.3. Perforation
Figure 5.2 shows the developed mechanized perforating apparatus used with injection-
molded foams. An oven was heated by an embedded electrical element, which was connected to
a programmable temperature controller (TC). The perforator was rotated by a DC motor
equipped with a rotational speed controller. The oven was heated to the melt temperature of the
polymer, and the sample was placed between the roller and the mechanical perforator. The

89
proper perforation of the samples was carried out by tuning the rotational speed, the temperature
and the gap between the roller and the perforator by nub screws.
Figure 5.2: Developed mechanized perforating setup for injection-molded foams
5.2.4. Acoustic Property Characterization
The injection-molded acoustic foams were evaluated for their acoustic behaviors, i.e., the
absorption coefficient and the transmission loss. The absorption coefficient represents the
amount of absorption that a sound wave has when it hits the acoustic fence. The transmission
loss represents the energy that the sound wave loses when it passes through the acoustic fence.
According to the concept of acoustic attenuation, the absorption coefficient refers to a fraction of
the sound wave that may be observed when the sound wave hits the sample, and it varies from 0
(no attenuation) to 1 (100% attenuation). The term “transmission loss” also refers to the lost

90
decibels of sound wave power when the wave passes through the sample, and it can vary from 0
to any value.
The transmission loss and absorption coefficient of the samples were measured using an
impedance tube and the Tube-XTM
utilities package in accordance with the ASTM E1050 – 12
http://www.astm.org/Standards/E1050.htm . The Tube-XTM
utilities package was able to account
for the effects of the temperature, the barometric pressure, and the attenuation of the measured
quantities [12].
5.3. Results and Discussion
5.3.1. Structure and Cellular Morphology of Acoustic Foams
Table 5.2 gives the sample number, the mold opening length, and the final thickness of the
injection-molded acoustic foams. Two different types of structures were made in the acoustic
foams. The PP1, PP2 and PP3 samples were made without an internal cavity, but a cavity was
introduced in the middle of the PP4, PP5 and PP6 samples. The cell morphology, the expansion
ratio, the open-cell content, and the acoustic properties of these two types of acoustic foams are
discussed in the next sections.
Table 5.2: Sample number, degree of mold opening and final thickness of the injection-
molded acoustic foams
Sample Mold opening Final thickness

91
number length (mm) (mm)
Acoustic foams without internal cavity
PP1 0 3.2
PP2 1.5 4.7
PP3 4.5 7.7
Acoustic foams with internal cavity
PP4 9.0 12.2
PP5 12.0 15.2
PP6 15.0 16.5
5.3.1.1. Acoustic Foams without Cavity
PP1, PP2 and PP3 samples were fabricated by filling 75% of the pressurized cavity during
the injection cycle and the full-length samples were created by expansion during foaming. Figure
5.3 shows the SEM micrographs and schematic structures of the PP1 and PP2 acoustic foams.
Three distinguishable regions were identified across the thicknesses of the PP1 and PP2 samples,
namely the skin layer, the transition layer, and the core region. As expected, the skin layer had a

92
non-foamed solid structure due to the very rapid solidification of polymer in this region. Both the
transition and core regions were foamed but with different cellular morphologies. As the inserts
of Figure 5.3a show, the core region of the PP1 sample had relatively uniform spherical cells
while the cells in the transition layer were highly elongated. Ameli et al. observed similarly
constructed layers with different cellular morphologies in polylactide samples that were
injection-molded at a high flow rate [13]. It is believed that close to the skin the polymer melt
had a lower temperature than at the core and that this lower temperature, coupled with a high
injection flow rate, induced greater shear stresses in the transition region. This resulted in more
elongated cells in this area.
When the injection of the melt/gas mixture into the mold cavity was followed by a timely
mold opening, the cells were provided an opportunity to grow further, specifically in the sample
thickness direction and this resulted in the acoustic foams with larger cells. Figure 5.3b shows
the SEM micrographs and a schematic structure of the PP2 foam made with 1.5 mm of mold
opening. Similar to the PP1 sample, three distinct layers of skin, transition, and core were also
observed in the PP2 sample. However, cells in the PP2 sample were further expanded in the
thickness direction and thus the severity of their elongation in the machine direction was
decreased.
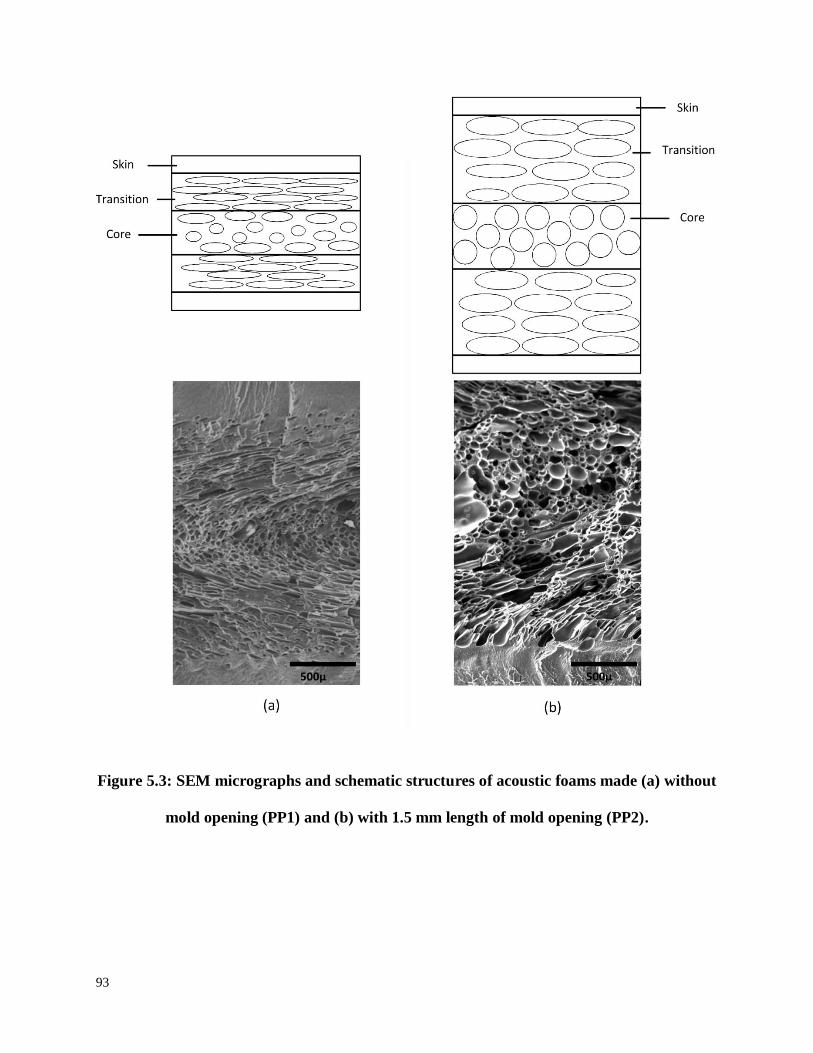
93
Figure 5.3: SEM micrographs and schematic structures of acoustic foams made (a) without
mold opening (PP1) and (b) with 1.5 mm length of mold opening (PP2).
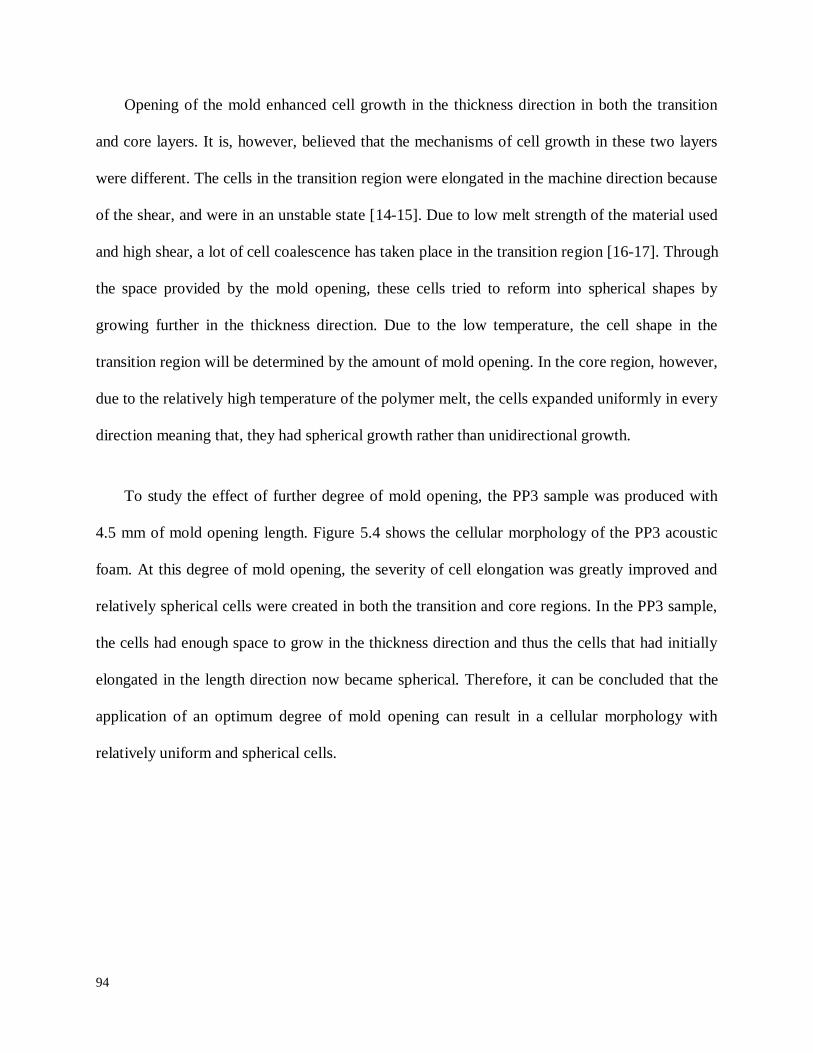
94
Opening of the mold enhanced cell growth in the thickness direction in both the transition
and core layers. It is, however, believed that the mechanisms of cell growth in these two layers
were different. The cells in the transition region were elongated in the machine direction because
of the shear, and were in an unstable state [14-15]. Due to low melt strength of the material used
and high shear, a lot of cell coalescence has taken place in the transition region [16-17]. Through
the space provided by the mold opening, these cells tried to reform into spherical shapes by
growing further in the thickness direction. Due to the low temperature, the cell shape in the
transition region will be determined by the amount of mold opening. In the core region, however,
due to the relatively high temperature of the polymer melt, the cells expanded uniformly in every
direction meaning that, they had spherical growth rather than unidirectional growth.
To study the effect of further degree of mold opening, the PP3 sample was produced with
4.5 mm of mold opening length. Figure 5.4 shows the cellular morphology of the PP3 acoustic
foam. At this degree of mold opening, the severity of cell elongation was greatly improved and
relatively spherical cells were created in both the transition and core regions. In the PP3 sample,
the cells had enough space to grow in the thickness direction and thus the cells that had initially
elongated in the length direction now became spherical. Therefore, it can be concluded that the
application of an optimum degree of mold opening can result in a cellular morphology with
relatively uniform and spherical cells.

95
Figure 5.4: SEM micrographs of foam produced with 4.5mm mold opening length
(PP3).
Figure 5.5 shows the expansion ratio and open-cell content of the PP1, PP2 and PP3
samples. While cells in the PP1 sample expanded due to the partial filling of the mold cavity
(i.e., 75% of full shot) and to the polymer shrinkage that occurred during cooling, in the PP2 and
PP3 samples the cells expanded additionally as a consequence of the mold opening. The
expansion ratio for the PP2 and PP3 samples was proportional to the mold opening length.
Almost no open cells were observed in the PP1 foam. This was due to the low expansion ratio,
the thick cell walls, and the small cell size [18-19]. In the PP2 foam, with three times the
expansion ratio, only 12% of the cells were interconnected. However, in the PP3 foam, many
cells were interconnected and an open-cell content of about 67% was obtained. SEM
micrographs of PP3 (Figure 5.4) revealed that the interconnection of the cells in this foam was
through the creation of the pin holes. And these were caused by the induced shear on the cell
walls as well as by the shrinkage of the cell walls that occurred due to solidification during the
mold opening. McRae [20] showed that foam with an open-cell content of about 70% may

96
contribute significantly to acoustic properties in a frequency range of 500-5500 Hz. Chi et al.
[21] recently fabricated poly (ethylene oxide) PEO/NaCl/hydroxyapatite (HA) composite porous
material using injection molding with an open-cell content of 67%. However, such a high content
of cell-opening has not yet been reported for neat polypropylene.
Figure 5.5: Open-cell content and the expansion ratio of the acoustic foams without
cavity.
5.3.1.2. Cavity-integrated acoustic foams
Figure 5.6 shows the procedure of fabricating cavity-integrated acoustic foams using the
foam injection-molding process equipped with a mold opening technique and mold cavity gas
counter-pressure. The cells were nucleated during the injection and filling stages. When the mold
was opened, the cells grew up to a certain degree of the mold opening, beyond which a crack was
initiated inside the hot core of the foams, which created the cavity. It is believed that crack
initiation strongly depends on the speed of the mold-opening. While fast mold-opening facilitates
00.511.522.533.544.55
0
10
20
30
40
50
60
70
80
PP1 PP2 PP3
Op
en-c
ell
con
ten
t(%
)
Exp
ansi
on
rat
io (
-)
Sample number
Open-cell content
Expansion ratio
97
early crack initiation, slow mold-opening postpone or even prevent from crack initiation. In
addition, it is believed that crack initiation depends on the cell nuclei density, the amount of gas,
the resin kind, the additive kind, the melt temperature, the mold temperature, and etc. This
matter is not easy to be modeled since it has complicated phenomena including the heat transfer,
the mass transfer, the bubble nucleation and growth, crack nucleation and growth, etc.
Figure 5.6: A schematic representation of the creation of the cavity inside the injection-
molded foams using a mold opening technique: (a) foamed sample right after the injection,
(b) crack initiation while the mold was opening, and (c) the final cavity created in the core.
Figure 5.7a shows the cross section of the overall structure of the cavity-integrated acoustic
foam PP5 sample, including the skin region, the foamed region, and the internal cavity. Figure
5.7b also depicts the cellular morphology of the PP5 sample. Similar structures, but with
different cavity depths, were observed for the PP4 and PP6 samples as they were fabricated using
a different mold opening length. Figure 5.8 shows the thickness of the cavity and the surrounding
foamed regions. The cavity depth increased significantly with an increased mold opening length.
However, the thickness of the foamed region on both sides of the cavity increased only slightly

98
with increases in the opening lengths of the PP4, PP5 and PP6 samples. At the instant that the
crack was initiated in the middle of the foamed region, the foam expansion was terminated and
the cavity depth increased.
Figure 5.7: (a) A photograph of the PP5 sample showing the cross section of the overall
structure including the skin region, the foamed region, and the internal cavity, and (b) a
SEM micrograph of the PP5 sample showing the cellular morphology of the foamed region.

99
Figure 5.8: The average thickness of the cavity and the surrounding foamed region for
cavity-integrated acoustic foams in the PP4, PP5 and PP6 samples.
Figure 5.9 shows the open-cell content and the expansion ratio of the cavity-integrated
acoustic foams in the PP4, PP5 and PP6 samples. All of the samples had an average expansion
ratio and an open-cell content of about 70% and 4.5, respectively. All other foam injection-
molding parameters were kept the same for these three foams, and only the mold opening length
was varied. It is plausible to assume that after the crack initiation in the middle of the foams
during the mold opening, no further cell growth or pinholes occurred in the foamed regions.
Consequently, the foamed regions of all three samples presented relatively similar expansion
ratios and open-cell content.
0
2
4
6
8
10
12
0
1
2
3
4
5
6
7
8
PP4 PP5 PP6
Ave
rage
cav
ity
thic
knes
s(m
m)
Ave
rage
foa
m t
hic
knes
s (m
m)
Sample number
Average foam thickness
Average cavity thickness

100
Figure 5.9: Average open-cell content and expansion ratio of the cavity-integrated
acoustic foams produced.
The SEM micrographs of the samples with cavity (i.e., PP4, PP5, and PP6) showed that the
cells close to the skin layer were much smaller than other cells. This was due to the fact that the
early solidification of the melt in the regions close to the skin layer hindered cell growth. The
cells in areas farther from the skin were all well expanded and their cell walls became thin. Most
of these cells were interconnected by pinholes. Figure 5.10 shows a SEM micrograph and the
cell size distribution for the PP5 sample. Similar trends were observed for the PP4 and PP6
samples. While cells near the skin layer were about 20 μm, all the cells located at a distance of
more than one mm from the skin layer had an average size of about 130 μm. It was difficult to
measure the variation of the expansion ratio of the foams across the thickness. However, it is
believed that a trend similar to that of the cell size would also exist for the expansion ratio.
0
1
2
3
4
5
6
7
0
10
20
30
40
50
60
70
80
PP4 PP5 PP6
Op
en-c
ell
con
ten
t(%
)
Exp
ansi
on
rat
io (
-)
Sample number
Open-cell content
Expansion ratio

101
Figure 5.10: A SEM micrograph and cell size distribution across the thickness of the
PP5 sample.
5.3.2. Pressure Profiles in the Mold Cavity
The pressure profile (Figure 5.1) for the mold cavity was designed to maintain the required
pressure on the melt to avoid premature cell nucleation and growth during the injection and
filling stages. It was also intended to enforce uniform pressure of the melt in the entire cavity. A
uniform pressure profile within the entire cavity is a necessary requirement in order to ensure
uniform pressure drop and pressure drop rate and thus to achieve a fairly uniform cell nucleation
and growth and consequently a uniform cell morphology within the entire sample [22]. Using
three pressure gages, the pressure of the melt was recorded in three different cavity locations: (A)
near the gate, (B) in the middle, and (C) near the end of the cavity, as Figure 5.1a shows. The
recorded pressures at these three locations are noted in Figure 5.11. It is seen that nearly identical
pressure profiles could be imposed on each of these locations.
0
50
100
150
200
0.2 0.6 1 1.4 1.8 2.2
Aver
age
cell
size
(µm
)
Distance from skin(mm)

102
Figure 5.11: Recorded pressure profiles near the gate, the middle and the end of the mold
cavity.
5.3.3. Acoustic Properties
In panel-type sound absorbers, the resistance of the front panel for fast shaping attenuates
the energy of the sound wave. This attenuation depends strongly on the mass of the panel. It has
been shown that each time the panel mass is doubled its transmission loss improves by 6dB.
Thus, the small expansion of the foam close to the skin layer area would increase the skin layer
mass and result in a higher transmission loss [23]. On the other hand, an open-cell structure with
a relatively large cell size in other foam areas would improve the absorption coefficient of the
foams [23]. In addition, the existence of an air-gap in the middle of the samples would further
improve the transmission loss and absorption coefficient of the samples [24]. Therefore, the
0
500
1000
1500
2000
2500
3000
3500
0 1 2 3 4 5 6 7 8
Pre
ssu
re (
psi
)
Time (second)
Pressure in A
Pressure in B
Pressure in C

103
structural pattern of cavity-integrated acoustic foams that included the following features would
be an effective design for efficient sound insulation: (i) a solid and dense skin layer, (ii) a foamed
region with a gradually increasing cell size and an expansion ratio from the skin layer toward the
core (i.e., decreasing density) along with the creation of open cells, and (iii) a cavity in the
middle of the sample.
Figure 5.12 shows the absorption coefficient of the acoustic foams in a frequency spectrum
of 400-1600 Hz. The acoustic foams without cavity (i.e., PP1, PP2 and PP3 samples) showed no
wave attenuation. However, the cavity-integrated foams (i.e., PP4, PP5 and PP6 samples)
demonstrated a high absorption capacity in the tested frequencies spectrum. The absorption
coefficient for the PP1 and PP2 samples was quite minor, even though some fluctuation was
observed. It is believed that zero absorption coefficients occurred for two reasons: First, because
the PP1 and PP2 samples lacked open-cell foam; and second, because their foam structure was
solid due to low foam expansion. Fluctuations in the absorption coefficient around zero was an
artifact of the noise and cannot be considered a result of wave absorption. The PP3 sample
showed an absorption coefficient of about 0.3 at a frequency of 800 Hz, which should have
resulted from the higher expansion ratio of the foam and the higher open-cell content of the PP3
sample, compared with the PP1 and PP2 samples.

104
Figure 5.12: Absorption coefficient results for the acoustic foams.
Compared to the acoustic foams without cavity, the absorption coefficients of the cavity-
integrated foams, i.e., PP3, PP4, and PP5 samples, were significantly higher. The improved
sound insulation behavior that resulted is attributed to the cavity created inside these samples.
Peak frequency absorption for some sound absorbers is critical [23-24]. Many devices are
generating a high amount noise in a relatively short range of frequencies, and for designed
absorbers for these devices dissipating their noise in their peak frequency noise is a big
requirement [1]. As the cavity depth increased from the PP4 to the PP6 samples, the absorption
coefficient, as well as the corresponding peak frequency, increased. Peak absorptions of around
0.65, 0.83 and 0.95 were observed for the PP4, PP5 and PP6 samples, respectively, with the
corresponding peak frequencies of 950 Hz for PP4, 1040 Hz for PP5 and 1180 Hz for PP6. The
significance of these results relates not only to obtaining high peak absorption, but also to the
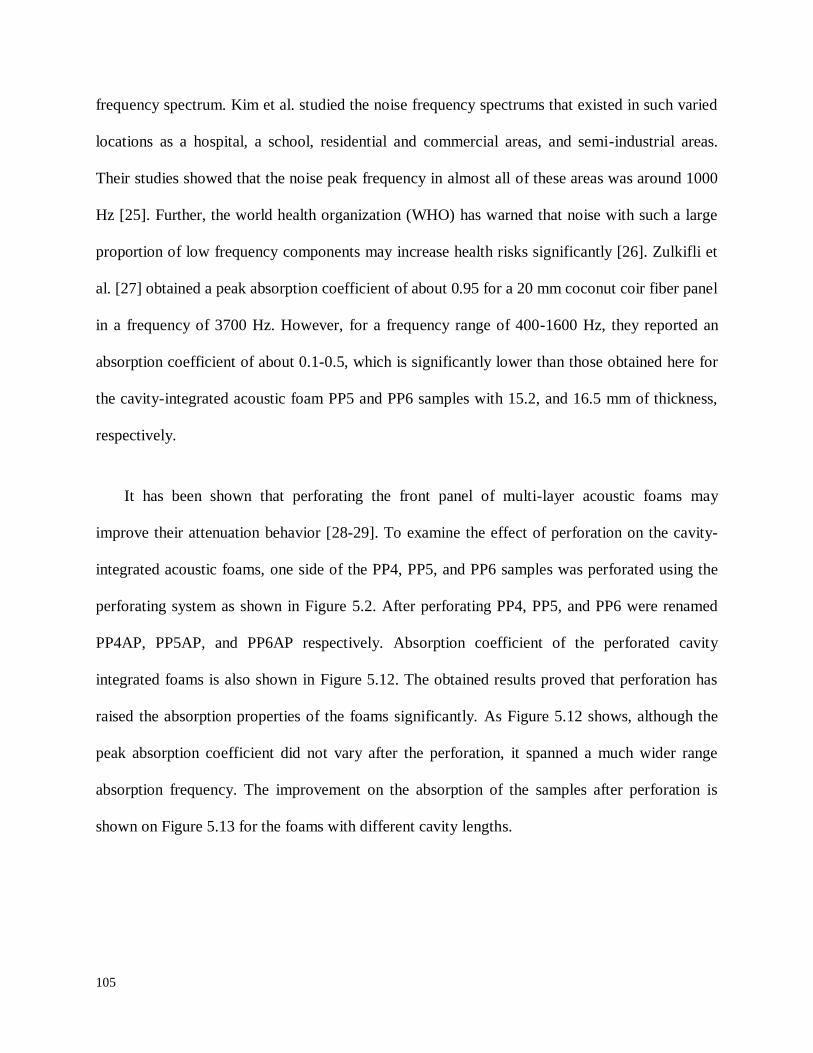
105
frequency spectrum. Kim et al. studied the noise frequency spectrums that existed in such varied
locations as a hospital, a school, residential and commercial areas, and semi-industrial areas.
Their studies showed that the noise peak frequency in almost all of these areas was around 1000
Hz [25]. Further, the world health organization (WHO) has warned that noise with such a large
proportion of low frequency components may increase health risks significantly [26]. Zulkifli et
al. [27] obtained a peak absorption coefficient of about 0.95 for a 20 mm coconut coir fiber panel
in a frequency of 3700 Hz. However, for a frequency range of 400-1600 Hz, they reported an
absorption coefficient of about 0.1-0.5, which is significantly lower than those obtained here for
the cavity-integrated acoustic foam PP5 and PP6 samples with 15.2, and 16.5 mm of thickness,
respectively.
It has been shown that perforating the front panel of multi-layer acoustic foams may
improve their attenuation behavior [28-29]. To examine the effect of perforation on the cavity-
integrated acoustic foams, one side of the PP4, PP5, and PP6 samples was perforated using the
perforating system as shown in Figure 5.2. After perforating PP4, PP5, and PP6 were renamed
PP4AP, PP5AP, and PP6AP respectively. Absorption coefficient of the perforated cavity
integrated foams is also shown in Figure 5.12. The obtained results proved that perforation has
raised the absorption properties of the foams significantly. As Figure 5.12 shows, although the
peak absorption coefficient did not vary after the perforation, it spanned a much wider range
absorption frequency. The improvement on the absorption of the samples after perforation is
shown on Figure 5.13 for the foams with different cavity lengths.

106
Figure 5.13: Improvement on the absorption coefficient because of the perforation for the
sample with different cavity length.
Figure 5.14a shows the variations of transmission loss in the injection-molded acoustic
foams and their frequencies. Overall, all the samples presented similar trends with respect to
frequency. The transmission loss first decreased with the frequency increasing up to about 550
Hz. Then the transmission loss started to gradually increase with frequency. The low peak
transmission loss for the samples around 550Hz represents their mass-air-mass resonance
frequency [30-31]. The increase in transmission loss with increased frequency is due to the mass
and frequency effect [30-31]. Figure 5.14b shows the average transmission loss of the samples in
a frequency range of 600-1600 Hz. It was observed that the thicker samples had a higher
transmission loss. While an average transmission loss of 28.1 dB was observed for the PP6
sample, an average transmission loss of 16.1 dB was recorded for the PP1 sample.

107
An average transmission loss of 16.7 dB and 18.7 dB was observed for the PP2 and PP3
samples, respectively. While there was only a 0.6 dB increase in the transmission loss when the
mold was opened 1.5 mm in the PP2 sample, the increased transmission loss was 2 dB when an
additional 3 mm of mold opening was introduced to fabricate the PP3 sample. We surmise that
the significant increase in the transmission loss for the PP3 sample was due to its high open-cell
content (Figure 5.5). Figure 5.14b also shows that the transmission loss significantly increased
with the cavity depth in the cavity-integrated foams. The average transmission loss was
measured to be 21.6 dB, 24.3 dB, and 28.1 dB for the PP4 (6 mm cavity depth), the PP5 (8.4 mm
cavity depth), and the PP6 (9.3 mm cavity depth) samples, respectively. Since similar cell
morphology was obtained for all of these samples, the attenuation improvement was attributed to
the existence and size of the air cavity.
(a)

108
(b)
Figure 5.14: (a) Transmission loss versus frequency and (b) the average transmission loss
of the acoustic foams.
5.4. Conclusions
A novel strategy was developed to produce cavity-integrated acoustic foams. A mold
opening technique with a tuned foam injection-molding processing condition was used in which
cells were highly expanded and their walls became thinned. High shear stresses were applied to
the cells during cell growth and elongation. The cell walls also experienced additional shear
stress when they started to solidify. By applying a high shear to the thinned cell walls, pinholes
were created in them, which interconnected the cells and produced an open-cell structure. A
maximum expansion ratio and an open-cell content of 4.6 and 67%, respectively, were obtained
for the injection-molded acoustic foams.
109
By opening the mold further followed by initiating a crack, cavities were successfully
created inside the foams. The cavities significantly enhanced the absorption coefficient of the
acoustic foams and the absorption coefficient was increased by the increased cavity depth.
Cavity-integrated foams presented a peak absorption coefficient of 0.65 to 0.95 in a frequency
range of 950-1200 Hz. The effect of perforation on the absorption coefficient was also studied
using a mechanized perforating system. The perforation widened the frequency range of the
maximum absorption coefficient. The transmission loss of the injection-molded acoustic foams
was also measured, and it was found that the transmission loss was proportional to the thickness
of the samples. While a maximum transmission loss of about 41 dB was observed for the sample
with 16.5 mm of thickness (PP6), a transmission loss of 26 dB was obtained for the sample with
3.2 mm of thickness (PP1). This investigation revealed that cavity-integrated multi-layer acoustic
foams with efficient sound insulation can be fabricated in a cost-effective manner, and that this
can be done through a foam injection-molding process that uses mold opening.
110
5.5. References
[1] Allard, J. F. and Atalla, N., Propagation of sound in porous media France, Wiley, 2009.
[2] Zhang, C. H., Hu, Z., et al. Damping behavior and acoustic performance of polyurethane/lead
zirconate titanate ceramic composites. Materials & Design 46(0): 503-510, 2013.
[3] Hohe, J., Hardenacke, V., et al. Numerical and experimental design of graded cellular
sandwich cores for multi-functional aerospace applications. Materials & Design 39(0): 20-32,
2012.
[4] Wang, B., Wu, L., et al. Experimental investigation of 3D sandwich structure with core
reinforced by composite columns. Materials & Design 31(1): 158-165, 2010.
[5] Tasdemirci, A. and Hall, I. W. Development of novel multilayer materials for impact
applications: A combined numerical and experimental approach. Materials & Design 30(5):
1533-1541, 2009.
[6] Naguib, H.E., Park, C.B., Reichelt, N. Fundamental foaming mechanisms governing volume
expansion of extruded PP foams. Journal of Applied Polymer Science 91(4): 2661- 2668, 2004.
[7] Xu, X. and Park, C.B. Effects of the die geometry on expansion of PS foams blown with CO2
Journal of Applied Polymer Science 109(5): 3329-3336, 2008.
[8] Park, C.B., Behravesh, A.H. and Venter, R.D., Low-density, microcellular foam processing
in extrusion using CO2, Polymer Engineering and Science, 38(11): 1812-1823, 1998.
111
[9] Naguib, H.E., Park, C.B., et al., Strategies for achieving Ultra low-density PP foams,
Polymer Engineering and Science, 42(7): 1481-1492,2002.
[10] Jahani D., Chu R.K.M, et al. Development of thin thermoplastic foam structures for sound
absorption Polymer Processing Society American Conference, Niagara Falls, ON, May 21-25,
2012.
[11] Jahani D., Jung P., et al. The influences of processing temperatures and nucleating agent in
foaming of a thin-walled injection molded part Society of Plastics Engineers, Annual Technical
Conference, Technical Papers, Orlando, FL, April 1-4, 2012.
[12] Chu, R. K. M., Naguib, H. E., et al. Synthesis and characterization of open-cell foams
forsound absorption with rotational molding method. Polymer Engineering and Science 49(9):
1744-1754, 2009.
[13] Ameli, A., Jahani, D. et al. Microcellular injection molding of polylactide with talc. Journal
of Cellular Plastics, Manuscript ID: JCP-12-0034, 2013 (in press).
[14] Leung, S., Park, C.B. et al., Numerical simulation of polymeric foaming processes using a
modified nucleation theory plastics, rubber and composites. Macromolecular Engineering 35:
93-100, 2006.
[15] Ameli, A, Jung, P., and Park, C.B., Through-plane electrical conductivity of injection-
molded polypropylene/carbon fiber composite foams. Composites Science and Technology
76(4):37-44, 2013.

112
[16] Wong, S., Lee, J. W. S., Naguib, H. E., and Park, C. B. Effect of processing parameters on
the mechanical properties of injection molded thermoplastic polyolefin (TPO) cellular foams.
Macromolecular Materials and Engineering 293(7): 605-613, 2008.
[17] Ladin, D., Park, C.B., Park, S.S., Naguib, H.E. and Cha, S.W., Study of shear and
extensional viscosities of biodegradable PBS/CO2 Solutions, Journal of Cellular Plastics, Vol.
37, No. 2, pp. 109-148, 2001
[18] Park, C. B., Padareva, V., et al. Extruded open-celled LDPE-based foams using non-
homogeneous melt structure Journal of Polymer Engineering, 25(3), 239-260, 2005.
[19] Lee, P. C., Li, G., et al. Improvement of cell opening by maintaining a high temperature
difference in the surface and core of a foam extrudate. Journal of Cellular Plastics 43(6): 431-
444, 2007.
[20] Mcrae, J. D., Naguib, H. E., et al., Mechanical and acoustic performance of compression-
molded open-cell polypropylene foams. Journal of Applied Polymer Science 116(2): 1106-1115,
2010.
[21] Cui, Z., Nelson, B. et al. Fabrication and characterization of injection molded poly (ε-
caprolactone) and poly (ε-caprolactone)/hydroxyapatite scaffolds for tissue engineering.
Materials Science and Engineering: C 32(6): 1674-1681, 2012.

113
[22] Mihai, M., Huneault, M., et al., Crystallinity development in cellular poly(lactic acid) in the
presence of supercritical carbon dioxide. Journal of Applied Polymer Science , 113(5): 2920-
2932, 2009.
[23] Sgard, F.C., and Atalla N., et al., A numerical model for the low frequency diffuse field
sound transmission loss of double-wall sound barriers with elastic porous linings. Acoustic
Society of America 108(6):2865–72, 2000.
[24] Xin, F. X. and Lu, T. J. Analytical modeling of sound transmission through clamped triple-
panel partition separated by enclosed air cavities. European Journal of Mechanics - A/Solids
30(6): 770-782, 2011.
[25] Kim, K.H., Ho, D. X., et al. Some insights into the relationship between urban air pollution
and noise levels. Science of the Total Environment 424(0): 271-279, 2012.
[26] Ross, Z., Kheirbek, I., et al. Noise, air pollutants and traffic: Continuous measurement and
correlation at a high-traffic location in New York City. Environmental Research 111(8): 1054-
1063, 2011.
[27] Zulkifli, R., Zulkarnain, et al. Noise control using coconut coir fiber sound absorber with
porous layer backing and perforated panel. American Journal of Applied Sciences 7(2): 260-264,
2010.
[28] Wang, X. Theory of resonant sound transmission through small apertures on periodically
perforated slabs. Journal of Applied Physics 108 (064903), 2010.

114
[29] Sakagami, K., Morimoto, M. et al. A note on the relationship between the sound absorption
by microperforated panels and panel/membrane-type absorbers. Applied Acoustics 70(8): 1131-
1136, 2009.
[30] Kaiser, O. E., Pietrzko, S. J. et al. Feedback control of sound transmission through a double
glazed window. Journal of Sound and Vibration 263(4): 775-795, 2003.
[31] Gerretsen, E. Calculation of the sound transmission between dwellings by partitions and
flanking structures Applied Acoustics 12(6): 413-433, 1979.

115
Chapter 6: Development of
High-Performance Micro-
Perforated Panels (MPPs) for
Low-Frequency Sound
Absorption
6.1. Introduction
While technology development has accelerated in the last two decades, the development of
sound insulation has not been considerable [1-2]. Research has shown that elevated sound levels
may cause hearing impairment, hypertension, ischemic heart disease, irritability, and sleep
disturbances [3-4]. While the frequency spectrum of most noise ranges from 400 Hz to 1500 Hz
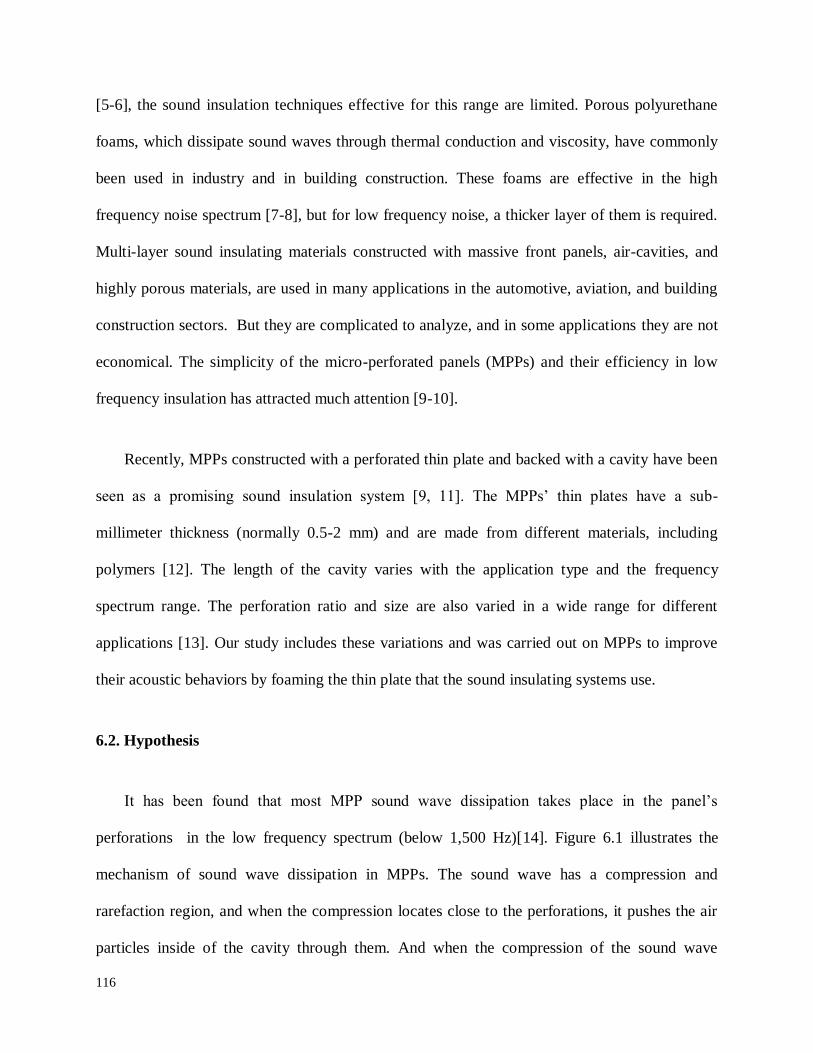
116
[5-6], the sound insulation techniques effective for this range are limited. Porous polyurethane
foams, which dissipate sound waves through thermal conduction and viscosity, have commonly
been used in industry and in building construction. These foams are effective in the high
frequency noise spectrum [7-8], but for low frequency noise, a thicker layer of them is required.
Multi-layer sound insulating materials constructed with massive front panels, air-cavities, and
highly porous materials, are used in many applications in the automotive, aviation, and building
construction sectors. But they are complicated to analyze, and in some applications they are not
economical. The simplicity of the micro-perforated panels (MPPs) and their efficiency in low
frequency insulation has attracted much attention [9-10].
Recently, MPPs constructed with a perforated thin plate and backed with a cavity have been
seen as a promising sound insulation system [9, 11]. The MPPs’ thin plates have a sub-
millimeter thickness (normally 0.5-2 mm) and are made from different materials, including
polymers [12]. The length of the cavity varies with the application type and the frequency
spectrum range. The perforation ratio and size are also varied in a wide range for different
applications [13]. Our study includes these variations and was carried out on MPPs to improve
their acoustic behaviors by foaming the thin plate that the sound insulating systems use.
6.2. Hypothesis
It has been found that most MPP sound wave dissipation takes place in the panel’s
perforations in the low frequency spectrum (below 1,500 Hz)[14]. Figure 6.1 illustrates the
mechanism of sound wave dissipation in MPPs. The sound wave has a compression and
rarefaction region, and when the compression locates close to the perforations, it pushes the air
particles inside of the cavity through them. And when the compression of the sound wave

117
replaces with the rarefaction, air particles are pushed out from the cavity. The air particles have a
moment of inertia that helps to stabilize the pressure fluctuations, and this causes a longer
displacement of the air particles. The movement and vibration of the air particles in the
perforation is repeated with the magnitude of the sound wave frequency. And each time that the
air particles go out or in, they experience some resistance from the perforations’ walls. The
vibration of the air particles in the perforations along with the resistance from the perforations’
walls dissipate the sound energy.
Figure 6.1: Sound wave dissipation mechanism using Helmholtz resonators.
The solid thin plate used in the conventional MPPs was replaced with a foam thin plate to
try to improve its acoustic behavior. Figure 6.2 shows the mechanism for improvement of its
acoustic behavior by foaming. Figure 6.2(a) shows a schematic of currently available MPPs with
a solid thin plate and Figure 6.2(b) shows the proposed MPP system with a foam thin plate. In
the proposed system, the thin plate is uniformly foamed. The perforations that result have some
roughness on the cell walls, unlike those using the solid thin plate. This roughness can resist the
flow of the sound wave and possibly result in larger sound wave dissipation than those using the

118
thin plate. Further, the number of air particles vibrating in the perforations of a MPP with foam
thin plate is larger than those in the solid plate because of existence of voids in foam plate. And
this is another reason for sound wave dissipation using proposed system. The intention of our
study was to achieve a foam with a cell size significantly smaller than the perforation size. We
also aimed for, a higher cell density to provide a higher and smoothly flowing resistance to
sound waves.
Figure 6.2: (a) A schematic of a currently available MPP with solid thin plate, and (b) the
proposed MPP system with a foam thin plate.

119
6.3. Experimental Procedure
6.3.1. Materials
The commercially available injection molding grade of polypropylene (PP), Certene PHM35
was used. It was provided in a pellet form and had a specific gravity of 0.903 g/cm3, a melt flow
index of 35 g/min., and a Vicat softening temperature of 152 °C. The nucleating agent, talc
(grade Cimpact CB710), was provided by Luzenac. It had a density of 2.8 g/cm3 and an average
particle size of 1.7 µm. Carbon dioxide (CO2) was supplied by Linde Gas, Canada and was used
as the physical blowing agent.
6.3.2. Sample Preparation
It is challenging to foam a thin injection-molded part. Compared with thick parts, a limited
void fraction and cell density are obtainable because of the limited cavity space for cell growth in
the thin parts. A narrow window of processing temperature, gas content, residence time, and
pressure drop rate would result in a favorable foam cell morphology. Since polymer melt
solidifies relatively fast, the complete filling of the mold cavity would require a higher melt
temperature, a higher injection flow rate, and/or a high injection pressure [15-17]. However, each
of these actions can cause undesirable conditions during the molding process. A high injection
flow rate causes an undesirable melt fracture in the polymer. Excessively high melt temperatures
can result in thermal degradation of the polymer and in excessive shrinkage and warpage. These,
in turn, affect the dimension stability, the cell morphology and the mechanical properties of the
molded parts [18-19].

120
Very few studies have been reported on the foaming of thin injection molded parts. But the
microcellular foaming of thick (that is, more than 3 mm) injection molded parts has been
extensively studied in the last few years. For thick parts, it was found that a finer cell structure
and a more uniform cell size distribution could be achieved by controlling the absolute pressure
and pressure gradient at the mold gate [20, 21]. Microcellular and relatively fine-cell structures
have been successfully produced for thick injection molded parts [22-23]. However, Swett [24],
Loar [25] and Wang [26] are the only researchers who have discussed foaming thin parts.
Regrettably, with the exception of Wang’s work, their achievements were empirically limited.
Wang studied the effects of two different fan gates and two different edge gates in foaming 1
mm injection molded parts. He determined that a 1 mm fan gate enhanced the complete filling of
the cavity due to the low flow resistance of this gate. Further, he concluded that a 1 mm fan gate
provided better cell morphology in terms of cell density and a fine-cell size because it provided a
more equal pressure distribution throughout the cavity. However, Wang did not study the cell
morphology and uniformity of produced foams, and his published SEM pictures illustrated a 50-
100µm cell size. In this work, a study was conducted for the uniform foaming of thin plates, and
a cell size of 15 µm was intended. Foam thin plates were micro-perforated and used to construct
MPPs. Finally, the acoustic behavior of MPPs was observed.
An advanced foam injection molding machine, shown in Figure 6.3, was used to produce
both solid and foam 1 mm-thick polypropylene injection molded parts. It was modified from an
80-ton piggy-back injection molding machine produced by Sodick Plustech Inc. The introduction
of a gear pump between the accumulator and the plasticizing barrel, which is responsible for
continuously generating the single phase polymer/blowing agent (BA) solution, enabled a close
monitoring of the pressure of the single phase melt mixture after the barrel and before injection.

121
The mold contained a rectangular cavity with a fan gate at one end. The cavity dimensions were
135 mm × 111 mm × 3.2 mm.
Figure 6.3: Apparatus and method for advanced structural foam molding [27-28].
Table 6.1 summarizes the fixed and varied foam injection molding parameters. The optimum
values for the fixed parameters were determined by a series of trial and error experiments. The
mold and the melt temperatures and the injection flow rate were determined as the most
influential parameters on the final structure of the expanded samples. Thus, they were varied to
investigate their effects on the foam structure. In all of the experiments, the other parameters
remained unchanged.
Table 6.1: Fixed and variable parameters in the foam injection molding of polypropylene.

122
Shot size (cm3) 75%
Barrel pressure (MPa) 20
CO2 content (wt. %) 5
Mold temperature 40 oC, and 80
oC
Melt temperature , variable 190oC, 210
oC, and 230
oC
Injection flow rate (cm3/s), 400
Talc (wt. %), variable 0, 5
6.3.3. Foam Structure Characterization
The foam density was measured either geometrically or by using the water-displacement
method (ASTM: D792-08). The expansion ratio ( ) was calculated using Equation 1.
f
s
d
d (6.1)
where ds and df are the density of the unfoamed solid material and foamed sample, respectively.

123
To study their microstructure, the samples were freeze-fractured and then coated with platinum
using a sputter coater. The microstructures were then examined using scanning electron
microscopy (SEM), the JEOL JSM-6060. The cell density was calculated using Equation 2.
2
3
_
A
nDensityCell (6.2)
where n is the number of cells in the micrograph; A is the area of the micrograph. The open cell
content (O.C.) of the foams was calculated using Equation 3.
%100)1(.. xV
VCO
g
a (6.3)
where Va and Vg are the actual volume and the geometric volume of the foam, respectively.
6.3.4. Acoustic Property Characterization
Sound absorption coefficient is defined as the ratio of the sound energy absorbed by a
surface to the sound energy incident upon that surface [29]. Accordingly, it may take on all
numerical values between 0 and 1. In practice, the absorption coefficient at normal incidence
is calculated using the normal surface impedance
|
| | | (6.4)
with the impedance of the fluid domain defined as

124
(6.5)
in which and are the sound speed in m/s and density of the fluid domain in kg/m3,
respectively [30]. Sound absorption is computed if the excitation is plane wave. is normal
surface impedance defined as the ratio of surface acoustic pressure to associated particle
velocity. This definition makes sense when the surface acoustic pressure is fixed on the surface
of the multi-layer elastic materials and the normal particle velocity is constant. Where these two
parameters are not fixed, their average values are considered in the calculation.
MPPs using solid and foam injection molded parts were evaluated for their acoustic
behavior (i. e. their absorption coefficient) using an impedance tube and the Tube-XTM utilities
package in accordance with the ASTM E1050 – 12. The Tube-XTM utilities package was able to
account for the effects of the temperature, the barometric pressure, and the attenuation of the
measured quantities [31-32].
6.4. Results and Discussion
6.4.1 Foam Structure
To circumvent problems associated with the rapid solidification of the melt in the mold
cavity, the mold was heated up to 80oC, and the polymer melt was injected into the cavity at the
maximum capacity of the machine (i. e. 400cc/c). Figure 6.4 shows the resultant foam samples at
three processing temperatures, both with and without a nucleating agent. Even though the
increased mold temperature helped to completely fill the cavity, it did not produce thin injection
molded parts with a uniform foam structure. While the center of the injection molded parts had

125
been foamed, the tip area and the area right after the gate were not uniform. Our hypothesis is
that at the area close to the gate, the melt temperature was relatively high. This would have
lowered the melt strength of the polymer, resulting in cell coalescence and large voids [33-34].
Further, at all processing temperatures, some non-uniformity was observed in the samples’ tip
area. This non-uniformity began some distance before the end of the part and continued on to the
end. We believe that by the time polymer/gas mixture reached the end of the cavity that gas had
escaped from the mixture. This commonly happens when the aspect ratio of the thin plate is too
large and the presser on the melt is not uniform throughout the cavity. The width of this non-
uniformity was increased by raising the processing temperature. This can be understood as the
polymer melt strength’s dependency on temperature [35-36]. Finally, as Figure 6.4 clearly
shows, the nucleating agent did not help to foam the thin injection molded parts that used a hot
mold.

126
Figure 6.4: Foam injection molded parts produced by using a high-temperature mold
(80oC), (a) With nucleating agent (talc), and (b) without nucleating agent (talc) .
In an attempt to improve the uniformity of the foam thin injection molded part we tried
using a moderate mold temperature. Figure 6.5 shows the foams produced using a moderate
temperature mold at 40oC. It was clear that foam produced without a nucleating agent lacked
uniformity. However, foam produced with a nucleating agent significantly improved foaming
[37].

127
Figure 6.5: Foam injection molded parts produced using a moderate temperature mold
at 40oC: (a) without nucleating agent and (b) and with nucleating agent.
To study the foams produced by using a nucleating agent in more detail, SEM micrographs
of the samples were prepared in three locations: right after the gate, in the center, and at the tip of
the samples, as Figure 6.6 shows. This confirms that in this processing condition the foams
obtained were relatively uniform. However, this uniformity seemed more promising at a lower
processing temperature.
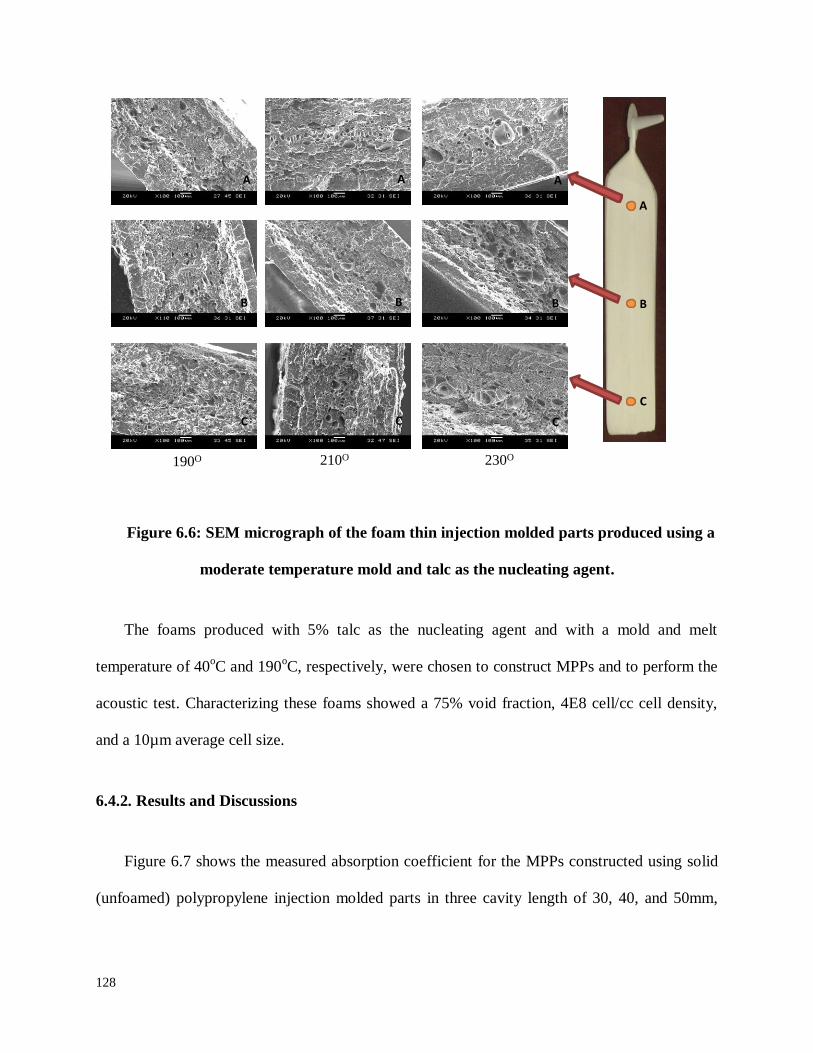
128
Figure 6.6: SEM micrograph of the foam thin injection molded parts produced using a
moderate temperature mold and talc as the nucleating agent.
The foams produced with 5% talc as the nucleating agent and with a mold and melt
temperature of 40oC and 190
oC, respectively, were chosen to construct MPPs and to perform the
acoustic test. Characterizing these foams showed a 75% void fraction, 4E8 cell/cc cell density,
and a 10µm average cell size.
6.4.2. Results and Discussions
Figure 6.7 shows the measured absorption coefficient for the MPPs constructed using solid
(unfoamed) polypropylene injection molded parts in three cavity length of 30, 40, and 50mm,
190O 210O 230O
AAA
BBB
CCC
A
B
C

129
while the perforations size is 200µm. In this figure “S” represents MPPs constructed using solid
(unfoamed) parts. Also a number followed these two letters represents the cavity length.
Figure 6.7: Measured absorption coefficient for MPPs constructed using solid (unfoamed)
polypropylene injection molded samples.
Following is the observation from absorption coefficient verses frequency curves for the
three MPPs constructed using three different cavity lengths. 1) The absorption coefficient verses
frequency curve for all the three MPPs has a mountain shape. 2) The peak absorption frequency
for MPPs with 50mm, 40mm, and 30mm is 795, 915, 1005 Hz respectively. The peak absorption
frequency decreased in increase of the cavity length. 3) MPP with a larger cavity length, showed
higher absorption coefficient in 400Hz and lower at 1600 Hz. Hence, cavity length can be
adjusted to bring the absorption frequency range to the favorite one as the requirement of an
application.
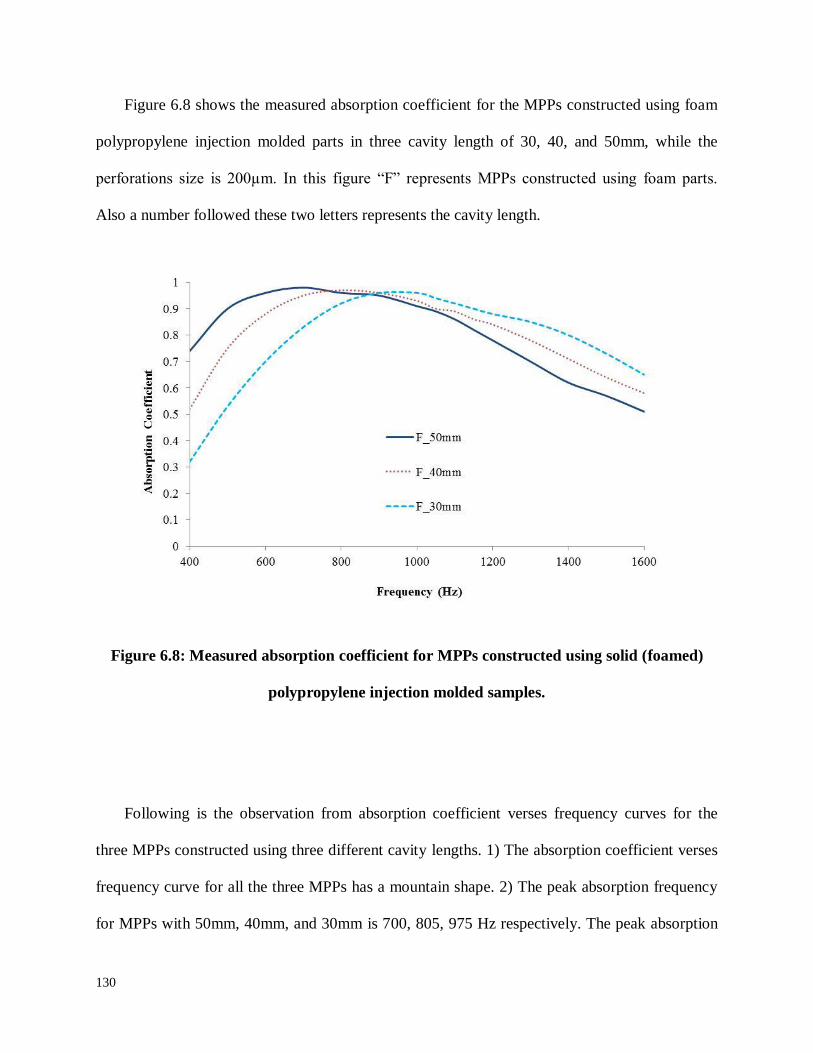
130
Figure 6.8 shows the measured absorption coefficient for the MPPs constructed using foam
polypropylene injection molded parts in three cavity length of 30, 40, and 50mm, while the
perforations size is 200µm. In this figure “F” represents MPPs constructed using foam parts.
Also a number followed these two letters represents the cavity length.
Figure 6.8: Measured absorption coefficient for MPPs constructed using solid (foamed)
polypropylene injection molded samples.
Following is the observation from absorption coefficient verses frequency curves for the
three MPPs constructed using three different cavity lengths. 1) The absorption coefficient verses
frequency curve for all the three MPPs has a mountain shape. 2) The peak absorption frequency
for MPPs with 50mm, 40mm, and 30mm is 700, 805, 975 Hz respectively. The peak absorption
131
frequency decreased in increase of the cavity length. 3) MPP with a larger cavity length, showed
higher absorption coefficient in 400Hz and lower at 1600 Hz. Hence, for MPPs constructed with
foam panel, the cavity length can be adjusted to bring the absorption frequency range to the
favorite one as the requirement of an application.
Figure 6.9 shows the measured absorption coefficient for the MPPs constructed using foam
and solid polypropylene injection molded parts in three cavity length of 30, 40, and 50mm, while
the perforations size is 200µm.
Figure 6.9: Measured absorption coefficient for the solid and foam polypropylene injection
molded samples.
Following is the observation when we compare the results for MPPs constructed with foam
and solid panels. 1) The figures for foam and solid have the same shape and the trend of change
on the absorption when frequency is changing is the same. 2) With foaming of the panel the peak

132
frequency of the absorption coefficient is moved toward lower frequency. 3) The value for the
absorption coefficient at 400 Hz is significantly higher for the MPPs constructed with foam
panel, however it is some lower at 1600 Hz. As absorption in lower frequency is usually more
favorable for the industry, the improvement on absorption at low frequency by foaming of the
panel in MPPs is considered a big advantage for foam MPPs. Figure 6.10 shows the
improvement on the absorption coefficient when foam panel is used for constructing MPPs in 50,
40, and 30 mm cavity lengths. This calculation has been made for the frequency range of 400 Hz
to the peak absorption frequency of the MPP with solid panels. Figure 6.11 shows the
improvement when whole the test frequency (400-1600 Hz) is considered.
Figure 6.10: Improvement on the absorption coefficient when foam panel is used for
constructing MPPs in 50, 40, and 30 mm cavity lengths. This calculation has been made for
the frequency range of 400 Hz to the peak absorption frequency of the MPP with solid
panels.
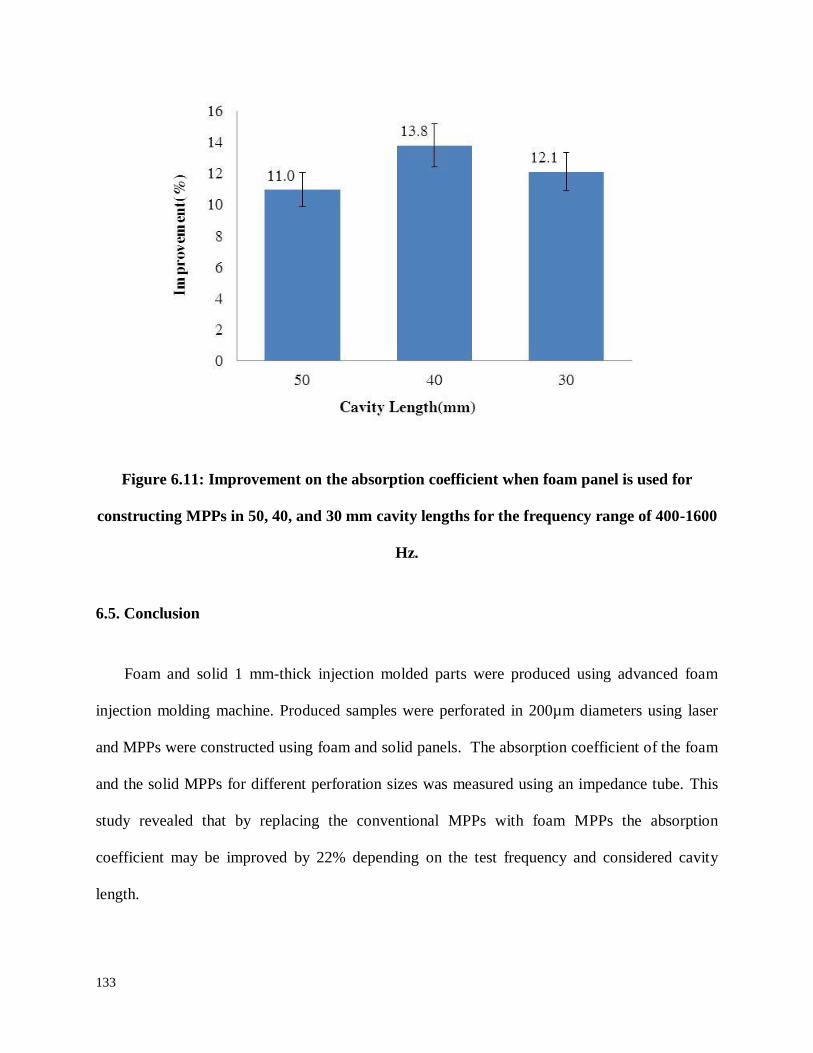
133
Figure 6.11: Improvement on the absorption coefficient when foam panel is used for
constructing MPPs in 50, 40, and 30 mm cavity lengths for the frequency range of 400-1600
Hz.
6.5. Conclusion
Foam and solid 1 mm-thick injection molded parts were produced using advanced foam
injection molding machine. Produced samples were perforated in 200µm diameters using laser
and MPPs were constructed using foam and solid panels. The absorption coefficient of the foam
and the solid MPPs for different perforation sizes was measured using an impedance tube. This
study revealed that by replacing the conventional MPPs with foam MPPs the absorption
coefficient may be improved by 22% depending on the test frequency and considered cavity
length.
134
6.6. References
[1] Zulkifli, R., Jailani, Z., Jailani, M. Noise control using coconut coir fiber sound absorber with
porous layer backing and perforated panel. American Journal of Applied Sciences, 7(2): 260-264,
2010.
[2] Ross, Z., Kheirbek, I., Clougherty, J.E., Ito, K., Matte, T., Markowitz , S., Eisl, H. Noise, air
pollutants and traffic: Continuous measurement and correlation at a high-traffic location in New
York City. Environmental Research, 111(8): 1054-1063, 2011.
[3] Clark, C., Head, J., Stansfeld, S. Longitudinal effects of aircraft noise exposure on children's
health and cognition: A six-year follow-up of the UK RANCH cohort. Journal of Environmental
Psychology, 35(0): 1-9, 2013.
[4] Passchier-Vermeer, W., and Passchier, WF. Noise exposure and public health. Environmental
Health Perspectives, Volume 108: 123–31, 2000.
[5] Zhang, C., Li, J., Hua, Z., Zhua, F. and Huanga, Y. Correlation between the acoustic and
porous cell morphology of polyurethane foam: Effect of interconnected porosity. Materials &
Design, 41(0): 319-325, 2012.
[6] Jahani, D., Ameli, A, Jung, P., Barzegari, M.R., Park, C.B., and Naguib, H. Open-cell cavity-
integrated injection-molded acoustic polypropylene foams. Materials and Design, Volume 53:
20-28, 2014.

135
[7] Ghaffari, M. S., Naguib, H., and Park, C.B. Development, characterization, and modeling of
environmentally friendly open-cell acoustic foams. Polymer Engineering and Science. 53(9):
1979-1989 , 2013.
[8] Ghaffari, M. S., Naguib, H., and Park, C.B. Development of polylactide open cell foams with
bimodal structure for high acoustic absorption. Journal of Applied Polymer Science, 131(7):10-
20, 2014.
[9] Park, S.-H. Acoustic properties of micro-perforated panel absorbers backed by Helmholtz
resonators for the improvement of low-frequency sound absorption. Journal of Sound and
Vibration, 332(20): 4895-4911, 2013.
[10] Tayong, R., Dupont, T., and Philippe, L. Experimental investigation of holes interaction
effect on the sound absorption coefficient of micro-perforated panels under high and medium
sound levels. Applied Acoustics, 72(10): 777-784, 2011.
[11] Sakagami, K., Morimoto, M., Koike, W. A numerical study of double-leaf microperforated
panel absorbers. Applied Acoustics, 67(7): 609-619, 2006.
[12] Sakagami, K., Nakamori, T.., Morimoto, M., and Yairi M. Double-leaf microperforated
panel space absorbers: A revised theory and detailed analysis. Applied Acoustics, Volume 70:
703–709, 2009.
[13]Maa, D.-Y. Potential of microperforated panel absorber. Acoustic Society of America.
104(5): 4350-4355, 1998.

136
[14] Sakagami, K., Morimoto, M., and Yairi, M. A note on the relationship between the sound
absorption by microperforated panels and panel/membrane-type absorbers. Applied Acoustics,
70(8): 1131–1136, 2009.
[15] Park, K., Kim, B., and Yao, D. Numerical simulation for injection molding with a rapidly
heated mold, Part I: Flow simulation for thin wall parts. Polymer - Plastics Technology and
Engineering, 45(8): 897-902, 2006.
[16] Barrows, D. Thin wall molding: achieving longer flowlengths and decreased internal stress
with injection-compression molding. SPE, ANTEC, Technical Papers, Paper # PENG-03-625,
Nashville, Tennessee, May 4-8, 2003.
[17] Yao, D. and Kim. B. Simulation of the filling process in micro channels for polymeric
materials. Journal of Micromechanics and Microengineering 12(5): 604-610, 2002.
[18] Bledzki, A. K., and Kühn, J. Microcellular injection molding of PP and PC/ABS with
precision mold opening and gas counterpressure. Cellular Polymers, 27(2): 91-100, 2008.
[19] Naguib, H. E., and Park, C., B. A study on the onset surface melt fracture of polypropylene
materials with foaming additives. Journal of Applied Polymer Science, 109(6), 3571–3577, 2008.
[20] Ameli, A., Jung, P. U., Park, C. B. Electrical properties and electromagnetic interference
shielding effectiveness of polypropylene/carbon fiber composite foams. Carbon, 60(0): 379-391,
2013.
137
[21] Cui. Z., Nelson, B., Peng, Y., Li, K., Pilla, S., Li, W., Turng, L., and Shen, C. Fabrication
and characterization of injection molded poly (ε-caprolactone) and poly (ε-
caprolactone)/hydroxyapatite scaffolds for tissue engineering. Materials Science and
Engineering: C, 32(6): 1674-1681, 2012.
[22] Ameli, A, Jung, P., and Park, C.B., Through-plane electrical conductivity of injection-
molded polypropylene/carbon fiber composite foams. Composites Science and Technology,
76(4):37-44, 2013.
[23] Barzegari, M. R., and Rodrigue, D. The effect of injection molding conditions on the
morphology of polymer structural foams. Polymer Engineering and Science, 49(5): 949-959,
2009.
[24] Swett, R. M. Polymer performance in thin wall structural foam molding. Structural Foam
Molding Conference, San Francisco, CA, USA, SPI, 1984.
[25] Loar, D. Thin wall structural foam: more options for designers. Plastics world, 42(2): 40-41,
1984.
[26] Wang, J., Lee, J.W.S., Yoon, J.D., and Park, C.B. Challenge to the foaming of a thin-walled
injection molded part- influence of injection speed and gate geometry. SPE, ANTEC, Technical
Papers, Paper #0538, Milwaulkee, WI, May 4-6, 2008.
[27] Xu, X., Park, C. B., Lee, J. W. S., and Zhu, X. Advanced structural foam molding using a
continuous polymer/gas melt flow stream. Journal of Applied Polymer Science, 109(5): 2855-
2861, 2008.

138
[28] Lee, J. W. S., Wang, J., Yoon, J.D., and Park, C.B. Strategies to achieve a uniform cell
structure with a high void fraction in advanced structural foam molding. Industrial and
Engineering Chemistry Research, 47(23): 9457-9464, 2008.
[29] Benedetto, G. and Spagnolo, R. Evaluation of sound absorbing coefficients in a reverberant
room by computer-ray simulation. Applied Acoustics, 17(5): 365-378, 1984.
[30] Allard J. F., and Atalla N. Propagation of sound in porous media. Wiley, 2009.
[31] Chu, R. K. M., Naguib, H. E., and Atalla, N., Synthesis and characterization of open-cell
foams for sound absorption with rotational molding method. Polymer Engineering and Science,
49(9): 1744-1754, 2009.
[32] Brouard, B., Lafarge, D., and Allard, J.F. A general method of modeling sound propagation
in layered media. Sound Vibration, 183 (1): 129-142, 1995.
[33] Lee, P. C., Wang, J., Park, C.B., Extruded open-cell foams using two semicrystalline
polymers with different crystallization temperatures. Industrial and Engineering Chemistry
Research , 45(1): 175-181, 2006.
[34] Lee, P. C., Li, G., Lee, J.W.S., Park, C. B., Improvement of cell opening by maintaining a
high temperature difference in the surface and core of a foam extrudate. Cellular Plastics, 43(6):
431-444, 2007.
139
[35] Ishikawa, T. Ohshima, M. Visual observation and numerical studies of polymer foaming
behavior of polypropylene/carbon dioxide system in a core-back injection molding process.
Polymer Engineering and Science, 51: 1617-1625, 2011.
[36] Park, C.B., Cheung, L.K. and Song, S-W. The effect of talc on cell nucleation in extrusion
foam processing of polypropylene with CO2 and isopentane, Cellular Polymers, 17(4): 221-251,
1998.
[37] Kaewmesri, W., Lee, P.C., Park, C.B. and Pumchusak, J. Effects of CO2 and talc contents
on foaming behavior of recyclable high-melt-strength PP. Journal of Cellular Plastics, 42(5):
405-428, 2006.

140
Chapter 7: Prediction of the
Transmission Loss for
Injection Molded Acoustic
Foams
7.1. Introduction
Injection molding is considered to be a reliable and feasible process and many parts for
automotive, airspace, and medicine applications are produced using this process [1-3]. Foaming
of injection molded parts not only lowers their weight significantly, but also gives them a unique
mechanical and insulating property [4-6]. Our findings, presented in Chapters 4 and 5, has
demonstrated that injection molded foams can be effectively used as sound insulating materials
[7-9]. Novel methodologies to produce both three layer and five layer cavity integrated acoustic
141
foams were also presented. To provide relevant insights to the future development of the
injection molded multilayer foams for sound insulation, this chapter presents a study on the
prediction of acoustic property of the injection molded foams, which has not been done before.
The structure of multilayer acoustic foams produced by the injection molding process is
different from others in many ways; hence, the methodology used for the prediction of the
regular multilayer insulating materials [10-12] will not be suitable for the foams produced with
the injection molding process presented in this thesis. For the injection molded foams produced
in this thesis, there is always a skin layer, about 1mm in thickness, which covers the entire foam
structure [13-14]. Although solid front panels have been used in multilayer structures to attenuate
the sound wave, these front layers are typically made of rigid, high-density metallic materials,
instead of plastics [15-17]. In addition, the cell morphology of the injection molded foams varies
across the thickness direction, with cells close to the skin that are smaller than the cells in the
core of the part [18-19]. This variation on the cell morphology is due to their inherent variation
of the processing condition during the process. Another important difference in the structure of
the multilayer acoustic foams developed by the injection molding process and other process is
that in the injection molded parts, there is no physical interface between layers [20-21]. The
interface effect in foams will be different. Any attempt to mechanically separate these layers for
the evaluation of their acoustic properties may result in physical damage of the structure. Hence,
it is of great interest to develop an empirical formula to model the sound insulation behaviors of
the foams produced by the injection molding process.
7.2. Prediction of the Transmission Loss for Polycarbonate Foams

142
In Chapter 4, a novel methodology was developed to produce open-cell polycarbonate
foams. Using the developed methodology, different polycarbonate foams were produced and
they were characterized for sound insulation property. Injection molded open-cell foams may
vary on open-cell content, thickness, density, cell size, and cell density [7-8, 22]. The structural
tenability of injection molded open-cell foams conveys a huge potential for these foams to adapt
them to specific applications including sound insulation. The insulation behavior of these foams
can be optimized for a specific frequency range through close control of their cell morphology
and thickness. In this thesis, the insulation behavior of 5 selected injection-molded polycarbonate
parts were studied and Table 1 summarizes the information of the studied injection molded parts.
As illustrated from Table 1, it is feasible to manufacture polycarbonate foams with different
open-cell content and thickness through the injection molding process examined in this thesis.
Table 7.1: Information of tested injection-molded parts
Average
open-cell
content
(%)
Thickness
(mm)
Relative
density
Average
cell size
(µm)
Average
cell
density
(Cells/cm3)
Sample#1 0 3.2 1 - -
Sample#2 3 5.8 0.55 42 1.3E7
Sample#3 10 8.9 0.36 63 9.3E6
Sample#4 77 12.3 0.26 115 2.7E6
Sample#5 82.5 16 0.2 163 8.2E5
Thickness of the material is considered one of the dominant factors in controlling sound
insulation [23-26]. The thicker the materials are, the easier they are able to block the
transmission of sound energy. Also, open-cell content of the foam is considered as a dominating
factor in sound absorption [27-29]. Air particle (molecule) movement, by which sound wave
energy is being conveyed, is resisted as particles propagate through the porous structure of the
143
materials. According to the results shown in Figure 7.1, Sample#5 has a transmission loss value
of 55db at 1600 Hz, while the Sample#1 has a transmission loss value of 23.1db as the thickness
and open-cell content of the foams were reduced from 16 to 3.2 mm and from 82.5 to 0%,
respectively. Hence, it is of interest to develop a methodology to estimate the transmission loss
of these foams based on their open-cell content and thickness.
In this thesis, we approached modeling the transmission loss of the polycarbonate foams by
correlating it with the morphological structure of the foams. Equation 1 shows the empirical
formula used for estimating the transmission loss (TL) for injection molded polycarbonate
foams.
( ) ( ) ( ) ( ) (7.1)
In this formula, T, and OC represent the thickness, and open-cell content of the foams,
respectively and f represents the frequency of the sound wave. The parameters, a, b, and c, are
the coefficients associated with the thickness and open-cell content contributing in the
transmission loss of the samples. They were considered to be frequency dependent, as the
transmission loss of the developed samples were found to be considerably dependent on the
sound frequency as shown in Figure 7.1.

144
Figure 7.1: Measured transmission loss for injection-molded parts.
There are three unknown parameters: a, b, and c in this equation that have to be defined.
Equation (7.1) can be rewritten in the following matrix format.
[
] [
] [
] [
] [
] (7.2)
(7.3)
while
[
] (7.4)

145
[
] (7.5)
[ ] (7.6)
Three test samples were required to calculate three unknown parameters, a, b, and c.
Sample#3, Sample#4, and Sample#5 were selected for this calculation. The main reason for the
selection of these three samples was their high capability in transmission loss attenuation due to
their high open-cell contents and thicknesses. The other two samples, Sample#1 and Sample#2,
which possess an open-cell content <3% were not considered for the modeling.
Table 7.2 summarizes the calculated values for a, b and c. After calculating the absolute
values for a, b, and c, the best fitting curve was obtained for a, b, and c values and the following
are the obtained fitting curve equations. The R-squared of the fitting curves for a, b, and c are
0.8925, 0.8515, and 0.8932 respectively.
a(f)= 9E-19 f 6 - 2E-14 f
5 + 2E-10 f
4 - 8E-07 f
3 + 0.0019 f
2 - 2.2929 f + 1119 (7.7)
b(f) = -8E-18 f 6 + 2E-13 f
5 - 1E-09 f
4 + 6E-06 f
3 - 0.0132 f
2 + 15.515 f - 7248.4 (7.8)
c(f) = 6E-19 f 6 - 1E-14 f
5 + 8E-11 f
4 - 3E-07 f
3 + 0.0005 f
2 - 0.5015 f + 188.25 (7.9)
Table 7.2: The a, b, and c values for PC samples
Frequency (Hz)
a b c

146
1600 13.74 50.54 -13.36
1800 12.93 61.97 -15.05
2000 14.46 56.31 -15.97
2200 16.12 47.75 -16.46
2400 16.80 42.71 -16.55
2600 16.18 42.35 -16.08
2800 14.49 44.76 -14.90
3000 12.22 46.74 -12.93
3200 9.93 45.18 -10.22
3400 8.16 38.10 -6.98
3600 7.26 25.21 -3.61
3800 7.36 8.20 -0.63
4000 8.33 -9.48 1.35
4200 9.83 -23.14 1.74
4400 11.38 -27.79 0.09
4600 12.43 -19.48 -3.74
4800 12.55 2.97 -9.40
5000 11.63 35.91 -15.85
5200 10.11 68.30 -21.05
5400 9.27 78.87 -21.74
5600 11.54 32.82 -13.08
The transmission loss for the PC samples was calculated using equations (7.7), (7.8), and
(7.9). Figure 7.2 shows the simulated and experimental results for Sample#3, Sample#4, and
Sample#5. The estimation error for Sample#3, Sample#4, and Sample#5 was 0.25%, 0.26%, and
0.40%, respectively. As it is shown in the Figure 7.2, the simulated results match relatively well
with the experimental results for Sample#3, Sample#4, and Sample#5 as anticipated, with minor
variations between the simulated and measured transmission loss values. Figure 7.3 shows the
simulated and experimental results for Sample#2, and Sample#1. The estimation error for
Sample#1 and Sample#2, was 85.4% and 17.7%, respectively. For the Sample #1, the
discrepancies between the simulated and experimental results are larger, which could be due to
the fact that this sample was not a foam sample and its open-cell content was zero. For

147
Sample#2, the simulated transmission loss values were far from the experimental results. This
could be due to the very low porosity of the foams.
Figure 7.2: Prediction and experimental results for transmission loss of the Sample#3,
Sample#4, and Sample#5.

148
Figure 7.3: Prediction and experimental results for transmission loss of the Sample#1, and
Sample#2.
Even though the sample#2 has only 3% open-cell content, the simulated transmission loss is
relatively close to the experimental results. This suggests that the defined equation is suitable for
estimating the transmission loss of injection molded PC foams in this thesis.
7.3. Prediction of the Transmission Loss for Polypropylene Foams
Figure 7.4 shows the transmission loss for 6 injection molded polypropylene foams
manufactured in this thesis. As described in Chapter 5, these polypropylene foams can be sub-
divided into two groups: Sample#1, Sample#2, and Sample#3 are three regular (without cavity)
open-cells injection molded foams; Sample#4, Sample#5, and Sample#6 possess a cavity in the
middle of the foams. Information of these foams is listed in Table 7.3.

149
Figure 7.4: Measured transmission loss for injection molded polypropylene foams
Table 7.3: Information of developed injection molded polypropylene foams
Sample
Number
Thickness
(mm)
Open-cell
Content (%)
Cavity Length
(mm)
Sample#1 3.2 0 0
Sample#2 4.7 0.09 0
Sample#3 7.7 0.65 0
Sample#4 12.2 0.73 6.0
Sample#5 15.2 0.70 8.4

150
Sample#6 16.5 0.72 9.3
As explained in Chapter 7.2., the open-cell content and thickness of the foams are the most
dominant factors in determining the transmission loss. Hence the open-cell content and thickness
of the foams were considered for the prediction of the transmission loss. Using Equation (7.1),
the three unknown coefficients: a, b, and c were calculated. After calculating the values for a, b
and c the best fitting curves for them were obtained. The a, b, and c values for PP samples
without a cavity and with a cavity are summarized in Table 7.4 and Table 7.5 respectively.
Table 7.4: The a, b, and c values for PP samples (without a cavity)
Frequency (Hz)
a b c
400 13.25 -116.42 38.11
450 10.82 -104.10 34.13
500 9.88 -100.56 33.37
550 9.87 -102.00 34.28
600 10.40 -105.66 35.79
650 11.18 -109.73 37.22
700 12.03 -113.14 38.19
750 12.84 -115.41 38.57
800 13.55 -116.51 38.42
850 14.15 -116.75 37.91
900 14.66 -116.64 37.30
950 15.10 -116.78 36.85
1000 15.50 -117.79 36.82
1050 15.89 -120.20 37.43
1100 16.30 -124.40 38.81
1150 16.72 -130.56 41.01
1200 17.17 -138.58 43.95
1250 17.63 -148.06 47.44
1300 18.09 -158.27 51.18
1350 18.52 -168.14 54.73
1400 18.92 -176.23 57.55

151
1450 19.30 -180.77 59.01
1500 19.70 -179.66 58.39
1550 20.21 -170.50 54.95
1600 20.98 -150.63 47.92
Table 7.5: The a, b, and c values for PP samples (with a cavity)
Frequency (Hz)
a b c
400 26.87 -4.02 -4.02
450 9.68 14.61 14.61
500 -7.03 16.67 16.67
550 -20.10 10.69 10.69
600 -28.07 2.38 2.38
650 -30.72 -4.78 -4.78
700 -28.70 -9.07 -9.07
750 -23.20 -10.01 -10.01
800 -15.68 -8.00 -8.00
850 -7.60 -3.96 -3.96
900 -0.27 0.99 0.99
950 5.29 5.74 5.74
1000 8.49 9.35 9.35
1050 9.16 11.25 11.25
1100 7.54 11.22 11.22
1150 4.29 9.47 9.47
1200 0.33 6.55 6.55
1250 -3.31 3.29 3.29
1300 -5.65 0.61 0.61
1350 -6.02 -0.69 -0.69
1400 -4.38 -0.16 -0.16
1450 -1.62 1.94 1.94
1500 0.03 4.25 4.25
1550 -3.46 3.90 3.90
1600 -18.38 -3.97 -3.97

152
For the PP sample without a cavity, equations for the best fitting curve for a, b, and c are as
following. The R-squared of the fitting curves for a, b, and c are 0.9758, 0.5839, and 0.4682
respectively.
a(f) = y = 2E-16 f 6 - 1E-12 f 5
+ 3E-09 f 4 - 5E-06 f 3
+ 0.0036 f 2 - 1.3988 f + 223.17 (7.10)
b(f) = -1E-15 f 6 + 8E-12 f 5
- 2E-08 f 4 + 3E-05 f 3
- 0.0252 f 2 + 9.5223 f - 1505.7 (7.11)
c(f) = 5E-16 f 6 - 4E-12 f
5 + 1E-08 f
4 - 2E-05 f
3 + 0.011 f
2 - 3.9959 f + 603.32 (7.12)
For the PP sample with a cavity, equations for the best fitting curve for a, b, and c are as
following. The R-squared value of the fitting curves for a, b, and c are 0.6329, 0.5827, and
0.6063 respectively.
a(f) = -4E-15 f 6 + 2E-11 f
5 - 6E-08 f
4 + 7E-05 f
3 - 0.0394 f
2 + 11.272 f - 1171.4 (7.13)
b(f) = -5E-15 f 6 + 3E-11 f
5 - 8E-08 f
4 + 1E-04 f
3 - 0.0684 f
2 + 23.802 f - 3256.2 (7.14)
c(f) = 7E-15 f 6 - 4E-11 f
5 + 1E-07 f
4 - 0.0001 f
3 + 0.0745 f
2 - 22.617 f + 2599.7 (7.15)
The transmission loss for all 6 injection molded polypropylene foams were simulated using the
obtained values for a, b, and c and using Equation (7.1). The experimental and estimated results
for the samples without a cavity are shown in Figure 7.5 and for the samples with a cavity are
shown in Figure 7.6. For the samples without cavity errors of 3.9%, 1.2%, and 0.9% were
observed for sample #1, sample #2, and sample #3, respectively. For the samples with a cavity:
sample #4, sample #5, and sample #6 the error was 4.5%, 1.7%, and 4.8% , respectively. As it is

153
shown in Figures 7.5 and 7.6, estimated results fit the measured values relatively well. Hence,
the results suggests that the obtained values for a, b, and c can be used to estimate the
transmission loss of polypropylene foams with/without cavity manufactured from the injection
molding process examined in this thesis.
Figure 7.5: Prediction and experimental results for transmission loss of the Sample#1,
Sample#2, and Sample#3.

154
Figure 7.6: Prediction and experimental results for transmission loss of the Sample#4,
Sample#5, and Sample#6.
7.4. Effect of Materials on Transmission Loss
In this thesis, two matrix materials, polycarbonate and polypropylene, were examined in the
manufacturing of multilayer acoustic foams with injection molding. It was interesting to examine
the effect of the matrix materials on the transmission loss of the foam samples. Both PC and PP
foams without a cavity, and similar structure of skin layer/foam/skin layer were observed; and
any variation of the obtained values for a, b, and c may be considered as an indication on the
material effect of transmission loss. Through comparing the obtained values of a, b, and c for PC
foams, the following conclusions can be made for the results.

155
1) The coefficient “a”, which corresponds to the thickness contribution of the samples for the
transmission loss of the foams for polycarbonate and polypropylene foams, is relatively constant
across the span of the sound frequency that was examined. This suggests that the sample
thickness has a linear contribution to the transmission loss of both foams regardless of the test
frequency. This is an interesting finding because the thickness can be used as an independent
parameter for improving the transmission loss of the injection molded open-cell foams.
2) The obtained value for coefficient “b” varies with the sound frequency for both PC and PP
foams. This observation may suggest that for both PC and PP foams, the influence of open-cell
content on transmission loss is dependent on the sound wave frequency.
7.5. Conclusion
The process of foam injection molding is a very versatile tool to produce open-cell foams
when it is equipped with a mold opening technique. A formula was developed for estimating the
transmission loss of the injection molded open-cell foams (with/without cavity). Two of the most
dominant properties of the open-cell foams, open-cell content and thickness of the foams were
used to estimate the transmission loss. The results of the predictions were found to be feasible
and promising.

156
7.6. References
[1] Kramschuster, A.,Turng, L.S., An injection molding process for manufacturing highly porous
and interconnected biodegradable polymer matrices for use as tissue engineering scaffolds.
Journal of Biomedical Materials Research - Part B Applied Biomaterials 92(2): 366-376, 2010.
[2] Cui. Z., Nelson, B., Peng, Y., Li, K., Pilla, S., Li, W., Turng, L., Shen, C. Fabrication and
characterization of injection molded poly (ε-caprolactone) and poly (ε-
caprolactone)/hydroxyapatite scaffolds for tissue engineering. Materials Science and
Engineering: C 32(6): 1674-1681, 2012.
[3] Cui, Z., Zhao, H., Peng, Y., Kaland, M., Turng, L.S., and Shen, C., Morphology and
properties of porous and interconnected poly(ε -caprolactone) matrices using solid and
microcellular injection molding. Journal of Biobased Materials and Bioenergy 6(3): 259-268,
2012.
[4] Bledzki, A.K., Rohleder, M., Kirschling, K., Chate A., Microcellular polycarbonate with
improved notched impact strength produced by injection moulding with physical blowing agent.
Cellular Polymers 27(6): 327-345, 2008.
[5] Bledzki, A.K., Kirschling, H., Rohleder, M., Chate, A. Correlation between injection
moulding processing parameters and mechanical properties of microcellular polycarbonate.
Journal of Cellular Plastics 48(4): 301-340, 2012.

157
[6] Navacerrada, M.A., Fernández, P., Díaz, C., Pedrero, A. Thermal and acoustic properties of
aluminium foams manufactured by the infiltration process Applied Acoustics 74(4): 496-501,
2013.
[7] Jahani, D., Ameli, A, Jung, P., Barzegari, M.R., Park, C.B., and Naguib, H., Open-cell
cavity-integrated injection-molded acoustic polypropylene foams. Materials and Design 53: 20-
28, 2014.
[8] Jahani, D., Ameli, A, Saniei, M., Ding, W., Park, C.B., and Naguib, H.E., Characterization
of the structure, acoustic property, thermal conductivity, and mechanical property of highly
expanded open-cell polycarbonate foams Macromolecular Materials and Engineering DOI:
10.1002/mame.201400125, accepted July 1, 2014.
[9] Jahani, D., Chu, R.K.M., Park, C.B., Naguib, H.E., Development of thin thermoplastic foam
structures for sound absorption, Polymer Processing Society American Conference, Niagara
Falls, ON, May 21-25, 2012.
[10] Allard, J. F. and Atalla, N., Propagation of sound in porous media France, Wiley, 2009.
[11] Zhou, J., Bhaskar , A., Zhang, X. The effect of external mean flow on sound transmission
through double-walled cylindrical shells lined with poroelastic material. Journal of Sound and
Vibration 333(7): 1972-1990, 2014.
[12] Sakagami, K., Morimoto, M. Yairi, M. A note on the relationship between the sound
absorption by microperforated panels and panel/membrane-type absorbers, Applied Acoustics
70(8): 1131-1136, 2009.

158
[13] Ameli, A, Jung, P., and Park, C.B., Through-plane electrical conductivity of injection-
molded polypropylene/carbon fiber composite foams. Composites Science and Technology
76(4):37-44, 2013.
[14] Wong, S., Lee, J. W. S., Naguib, H. E., and Park, C. B. Effect of processing parameters on
the mechanical properties of injection molded thermoplastic polyolefin (TPO) cellular foams.
Macromolecular Materials and Engineering 293(7): 605-613, 2008.
[15] Lim, M.K.A Sound intensity technique for determining structural damping of a panel
exposed to noise, Applied Acoustics 32(4): 311-319, 1991.
[16] Toyoda, M., Sakagami, K., Takahshi, D. Effect of a honeycomb on the sound absorption
characteristics of panel-type absorbers. Applied Acoustics 72(12): 943-948, 2011.
[17] Narayanan, S. and Shanbhag, R. L. Sound transmission through a damped sandwich panel.
Journal of Sound and Vibration 80(3): 315-327, 1982.
[18] Ameli, A., Nofar, M., Jahani, D., Rizvi, G.P., Jung, P.U. and Park, C.B. Development of
High Void Fraction Polylactide Composite Foams Using Injection Molding: Crystallization and
Foaming Behaviors. Chemical Engineering Journal, Manuscript ID: CEJ-D-14-00115, submitted
December 2013.
[19] Ameli, A, Jahani, D., Nofar, M., Jung, P., and Park, C.B. Processing and characterization of
solid and foamed injection-molded polylactide with talc. Journal of Cellular Plastics, 49(4):
351-374, 2013.
159
[20] Jahani D., Jung, P.U., Ameli A., Saniei M., Park C.B. and Naguib H.E. Cavity-integrated
injection molded acoustic foams. Society of Plastics Engineers, Annual Technical Conference,
Technical Papers, Paper # 1591565, Cincinnati, Ohio, April 21-24, 2013.
[21] Jahani D., Ameli A., Cofreros A., Park C.B., and Naguib H.E. Injection foam molding of
highly expanded polycarbonate with open-cell structure using mold opening. Society of Plastics
Engineers, Annual Technical Conference, Technical Papers, Paper # 1591517, Cincinnati, Ohio,
April 21-24, 2013.
[22] Chu, R.K.M, Mark, L.H., Jahani D., and Park, C.B. Estimation of the foaming temperature
of mold-opening foam injection molding process. Journal of Cellular Plastics, Manuscript ID:
JCP-14-0018, submitted March 2014.
[23] Sgard, F.C., Atalla, N., Nicolas, J., A numerical model for the low frequency diffuse field
sound transmission loss of double-wall sound barriers with elastic porous linings. Acoustic
Society of America 2000, 108(6): 2865–72.
[24] Dunn, I. P. and Davern, W. A. Calculation of acoustic impedance of multi-layer absorbers.
Applied Acoustics 19(5): 321-334, 1986.
[25] Cipin, J. New noise insulation material expanded polystyrene granules with heavy core,
Canadian acoustics 25(3), 1997.
[26] Duval, A., Rondeau,J.-F., Bischoff, L., Deshayes, G., Dejaeger, L., Generalized Light-
Weight Concepts: Improving the Acoustic Performance of Less than 2500 g/m2 Insulators, SAE
International, USA, 2009.
160
[27] McRae, J.D., Naguib, H., Atalla, N. Mechanical and acoustic performance of compression-
molded open-cell polypropylene foams. Journal of Applied Polymer Science 116(2): 1106-1115,
2010.
[28] Chu, R.K.M., Naguib, H.E., Atalla, N., Synthesis and characterization of open-cell foams
for sound absorption with rotational molding method. Polymer Engineering and Science 49(9):
1744-1754, 2009.
[29] Ghaffari M. S., Naguib, H., Park, C.B., Development, characterization, and modeling of
environmentally friendly open-cell acoustic foams, Polymer Engineering and Science. DOI:
10.1002/pen.23443.

161
Chapter 8: Conclusions and
Recommendations
8.1. Summary of Major Contributions
In this thesis, we studied the acoustic properties of open porous foams and highlighted
important parameters which affect the acoustic properties. We enhanced the injection molding
process to develop open-cell foams and successfully manufactured injection molded open-cell
foams. Their properties were tailored to produce highly insulation and absorption foams. A novel
strategy was introduced to improve the acoustic behavior of MPPs.

162
8.1.1. Introduction and Background
Acoustic and noise control engineering along with foam materials was explained. Research
motivation was presented. Current difficulties with developing acoustic foams and their
environmental issues were explained. Furthermore, the objective of this thesis work was
explained. And finally, the organization of the thesis was illustrated.
8.1.2. Development and Simulation of Acoustic Foams
Available methods for developing open porous material were presented. Also a summary of
available methods on predicting absorption coefficient of open porous foams was given. Finally
the performance of MPPs for absorption was explained and predicting the acoustic behavior of
these systems was also presented.
8.1.3. Design of Open Porous Acoustic Foams
In order to understand the effect of the parameters on the acoustic properties of the open
porous materials, open-cell foams in different porosity and different pore sizes were
manufactured and analyzed. The absorption coefficients of the samples with different porosity
and pore sizes were calculated. It was found that porosity has a dominant effect on the acoustic
properties. Further, the effects of air-gap and thickness on the acoustic behavior were studied. It
was found that the air-gap has a significant effect on lowering the absorption coefficient.

163
8.1.4. Development of Technology to Produce Open Porous Acoustic Foams Using Injection
Molding for Insulation
A novel strategy was developed to produce highly expanded rigid polycarbonate (PC) foams
with an open-cell structure. The foam injection-molding process was enhanced using a mold
opening technique to achieve high expansion ratios. The cavity gas counter-pressure (GCP)
method was also applied to improve the cell morphology and uniformity of the injection-molded
foams. Their structure and expansion ratio were controlled by varying the degree of the mold
opening. The structure, cell morphology, sound and thermal insulation behaviors, and
mechanical properties of the foams were studied. The effects of several processing parameters on
the foam structure were investigated, and the results showed that the degree of mold opening,
melt temperature and injection flow rate were the most influential processing parameters in
creating a cellular structure with a high open-cell content. A foam injection-molding process
equipped with the mold opening and the GCP, together with tuned processing parameters, was
able to successfully produce PC foams with expansion ratios as high as eightfold and open-cell
contents of as high as 85%. The highly expanded foams increased the sound wave transmission
loss by about 2.5 times and decreased the thermal conductivity by more than sixfold. This
research shows that the foam injection-molding process can be effectively used in developing
lightweight rigid foams for sound and thermal insulation applications.
8.1.5. Development of Air-Gap Integrated Acoustic Open-cell Foams for Absorption
A commercially available foam injection-molding machine was enhanced with a mold
opening technique to produce polypropylene open-cell acoustic foams. Gas counter-pressure was
used to improve the cell morphology and uniformity of the injection-molded foams. Their

164
structure and thickness were controlled by applying different degrees of mold opening. The
sample structure, cell morphology, and acoustic behavior of the foams were characterized. A
foamed structure with an open-cell content of 67% and an expansion ratio of 4.6 was obtained
when the mold was opened by 4.5 mm. Although further opening of the mold did not
significantly increase the open-cell content, it triggered crack creation in the middle of the foams,
where the creation of cavities was also facilitated. The injection-molded foams with a cavity and
a high open-cell content, presented remarkable acoustic properties: a peak absorption coefficient
of 0.95 was observed for foam with a 73% open-cell content and a 9 mm cavity. An automated
system was also developed to perforate the acoustic foams and the acoustic properties of foams
both with and without perforation were studied. While perforating the foams widened their
absorption coefficient frequency spectrum, it did not improve their transmission loss.
8.1.6. Development of a High-Performance MPP for Low-Frequency Absorption
MPPs that are constructed with a perforated panel and that are backed with a cavity are a
promising sound insulation material for low frequency spectrum noise (i. e. below 1,600 Hz). In
MPPs, vibration of the air in the perforations is the main reason for their acoustic damping. This
work presents an innovative approach on improving the acoustic damping of the MPPs by
foaming the perforated panel. In spite of the challenges inherent in foaming thin materials, 1
mm-thick polypropylene injection-molded foams were successfully produced using an advanced
structural foam injection molding machine. A relatively uniform cell morphology resulted when
the polymer melt was injected with relatively high pressure and a high flow rate. MPPs with a
foam thin plate, showed a peak of 35% improvement on the sound absorption coefficient.
165
8.1.7. Estimation of the Transmission Loss for Injection Molded Acoustic Foams
A formula was developed for estimating the transmission loss of the injection molded open-
cell foams (with/without foams). Two of the most dominant properties of open-cell foams, open-
cell content and thickness of the foams were used to estimate the transmission loss. The results
of the estimations were found to be feasible and promising. The developed formula can be used
for optimizing acoustic properties of injection molded acoustic foams.
8.2. Summary of Major Contributions (Publications)
Invention Disclosure:
1. Park, C.B., Mohammadalizadeh,D., Jung, P.U., Chu, R.K.M, Air Gap Integrated Multi-
Layer Sound Insulation System Using Thermoplastic Based Porous Materials for
Industrial Application, Registered at University of Toronto, Invention Office,
Registration # 10002208, Jan 20, 2011.
Refereed Journal Publications:
1. Jahani, D., Ameli, A., Saniei, M., Ding, W., Park, C.B., and Naguib, H.E.
Characterization of the Structure, Acoustic Property, Thermal Conductivity, and
Mechanical Property of Highly Expanded Open-Cell Polycarbonate Foams.
Macromolecular Materials and Engineering, DOI: 10.1002/mame.201400125, accepted
July 1, 2014.

166
2. Jahani, D., Ameli, A, Jung, P., Barzegari, M.R., Park, C.B., and Naguib, H.E. Open-Cell
Cavity-Integrated Injection-Molded Acoustic Polypropylene Foams. Materials and
Design, Volume 53, available online 2013, Pages 20-28.
3. Ameli, A., Nofar, M., Jahani, D., Rizvi, G.P., Jung, P.U. and Park, C.B. Development of
High Void Fraction Polylactide Composite Foams Using Injection Molding:
Crystallization and Foaming Behaviors. Chemical Engineering Journal, Manuscript ID:
CEJ-D-14-00115, submitted Dec., 2013.
4. Chu, R.K.M, Mark, L.H., Jahani D., and Park, C.B. Estimation Of The Foaming
Temperature Of Mold-Opening Foam Injection Molding Process, Journal of Cellular
Plastics, Manuscript ID: JCP-14-0018, submitted March 2014.
5. Ameli, A., Jahani, D., Nofar, M., Jung, P., Jung, P.U. and Park, C.B. Development of
High Void Fraction Polylactide Composite Foams Using Injection Molding: Mechanical
and Thermal Insulation Properties. Composite Science and Technology, Vol 90, 88-95,
2014.
6. Ameli, A, Jahani, D., Nofar, M., Jung, P., and Park, C.B. Processing and
Characterization of Solid and Foamed Injection-Molded Polylactide with Talc. Journal of
Cellular Plastics, 49(4): 351-374, 2013.
Refereed Conference papers:
1. Jahani D., Ameli A., Mark L.H., Hossieny N., Park C.B., and Naguib H., A Study on the
Acoustic Behavior Of Micro Perforated Panels: Experiment And Modeling. Society of

167
Plastics Engineers, Annual Technical Conference, Technical Papers, submitted (ID:
1886656), Las Vegas, Nevada, April 28-30, 2014.
2. Jahani D., Ameli A., Chu R.K.M, Saniei, M., Park C.B., and Naguib H., Utilizing the
Sound Absorption Of Polymer Based Open-Cell Materials For Low Frequencies By
Considering Air-Gap. Society of Plastics Engineers, Annual Technical Conference,
Technical Papers, submitted (ID: 1886633), Las Vegas, Nevada, April 28-30, 2014.
3. Jahani D., Jung, P.U., Ameli A., Saniei M., Park C.B. and Naguib H.E. Cavity-
Integrated Injection Molded Acoustic Foams. Society of Plastics Engineers, Annual
Technical Conference, Technical Papers, Paper # 1591565, Cincinnati, Ohio, April 21-
24, 2013.
4. Jahani D., Ameli A., Cofreros A., Park C.B., and Naguib H.E. Injection Foam Molding
Of Highly Expanded Polycarbonate With Open-Cell Structure Using Mold Opening.
Society of Plastics Engineers, Annual Technical Conference, Technical Papers, Paper #
1591517, Cincinnati, Ohio, April 21-24, 2013.
5. Jahani, D., Jung, P.U., Ameli, A., Saniei, M., Park, C.B. and Naguib, H.E. The
Influences of Processing Temperatures and Nucleating Agent in Foaming of a Thin-
walled Injection Molded Part. Society of Plastics Engineers, Annual Technical
Conference, Technical Papers, Paper # PENG-12-60066, Orlando, FL, April 1-4, 2012.
6. Jahani D., Chu R.K.M, Park C. B., and Naguib H.E. Development of Thin
Thermoplastic Foam Structures for Sound Absorption. Polymer Processing Society
American Conference, Niagara Falls, ON, May 21-25, 2012.
7. Ameli, A., Jahani, D., Saniei, M., Park, C.B., Pötschke, P. and G. Rizvi, Lightweight
polypropylene-carbon nanotube foams with low filler content, high permittivity and low
168
dielectric loss for charge storage applications. Society of Plastics Engineering, SPE-
ANTEC 2014, Las Vegas, Nevada, US, April 28-30, 2014.
8. Ameli, A., Hossieny, N., Jahani, D., Park, C.B., and P., Pötschke, An innovative method
to increase the charge storage capability of polymer nanocomposites. Society of Plastics
Engineering, SPE-ANTEC 2014, Las Vegas, Nevada, US, April 28-30, 2014.
9. Chu R.K.M, Mark, L.H., Jahani D., and Park, C.B. Injection Molding of Highly-Porous
Polypropylene Foams. Society of Plastics Engineers, Annual Technical Conference,
Technical Papers, submitted (ID: 1886472), Las Vegas, Nevada, April 28-30, 2014.
10. Mark L.H., Chu R.K.M, Jahani D., Park C.B. Gas-Assist Injection Molding of PLA for
Foaming Applications. Society of Plastics Engineers, Annual Technical Conference,
Technical Papers, submitted (ID: 1886669), Las Vegas, Nevada, April 28-30, 2014.
11. Hossieny N., Ameli A., Saniei M, Jahani D. and Park C.B. Feasibility of Double Melting
Peak Generation for Expanded Hermoplastic Polyurethane Bead Foams. Society of
Plastics Engineers, Annual Technical Conference, Technical Papers, submitted (ID:
1886699), Las Vegas, Nevada, April 28-30, 2014.
12. Saniei, M., Ameli, A., Hosseiny, N. J., Jahani, D., Park, C.B. One-Step Nanocellular
Foaming of Clarified Polypropylene Using Supercritical CO2. Society of Plastics
Engineers, Annual Technical Conference, Technical Papers, Paper 1886713, Las Vegas,
Nevada, April 28-30, 2014.
13. Ameli, M. Nofar, D. Jahani, M. Saniei, and Park, C.B. Foaming and Crystallization
Behaviors of Highly Expanded Injection-Molded Polylactide Composite Foams.
Biofoams, Paper # 181. Toronto, ON, August 27-29, 2013.
169
14. Ameli, A., Jahani, D., Jung, P.U. and Park, C.B. Microcellular Injection Molding of
Polylactide with Talc. Society of Plastics Engineers, Annual Technical Conference,
Technical Papers. Paper # PENG-12-60123, Orlando, FL, April 1-4, 2012.
15. Ameli, A., Saniei, M., Jahani, D. and Park, C.B. Electrical Properties of Polypropylene
Composite Foams Reinforced with Long Stainless Steel Fibers. Society of Plastics
Engineers, Annual Technical Conference, Technical Papers, Paper # 1591763,
Cincinnati, Ohio, April 21-24, 2013.
16. Saniei, M., Hossieny, N.J., Ameli, A., Jahani, D. and Park, C.B. Solid-State Batch
Processing and Structure of Nano-cellular Thermoplastic Polyurethane Foams. Society of
Plastics Engineers, Annual Technical Conference, Technical Papers, Paper # 1591737,
Cincinnati, Ohio, April 21-24, 2013
17. Ameli, A., Jahani, D., Jung, P.U., and Park, C.B. Tailored Uniform Foamability and
Mechanical Properties of Injection Molded Polylactide with High Void Fraction. Blowing
Agents and Foaming Processes, Berlin, Germany, May 8-9, 2012.
8.3. Recommendation for Future Research
For the future of this research work, the following is recommended.
1) The model presented in this work to estimate the transmission loss of injection molding parts
is suggested to be developed further to help explaining the acoustic behavior of injection molded
open cell foams. This model can be used to optimize processing conditions in injection molding
and improve the acoustic behaviors of multilayer injection molded acoustic foams.

170
2) Cell opening mechanisms and cell morphologies in the foam injection molding process are
suggested to be investigated further. This will enable scientists to have closer control over the
cell morphology and cell interconnections. Using a rapid heating and cooling mold could be very
helpful in this study. It is believed that by optimizing the cell interconnections and the cell
morphology, the acoustic properties of the injection molded parts could be improved
significantly.
3) The multi-layer injection molded parts, the correlations between the properties of each layer
(i.e. density, cell morphology, and thickness) and acoustic properties could be investigated
further.
4) With the knowledge obtained in this work for the foaming of a thin plate and for developing
foam micro-perforated panels systems, it is possible to conduct further research and development
to improve the acoustic properties of these innovative materials. For example, the mechanism of
absorption in foamed micro-perforated systems could be further investigated, and if possible a
model for predicting sound absorption of these foamed micro-perforated panels could be
developed.


![Journal of Thermoplastic Composite Materials - DSKPDFugcdskpdf.unipune.ac.in/Journal/uploads/CH/CH080046-A-3.pdf · Quadrini and Squeo [14] fabricated an injection molded bush made](https://static.fdocuments.net/doc/165x107/5ccdc1a188c993803c8bf758/journal-of-thermoplastic-composite-materials-quadrini-and-squeo-14-fabricated.jpg)


