Injectable, Cellular-Scale Optoelectronics with...
49
DOI: 10.1126/science.1232437 , 211 (2013); 340 Science et al. Tae-il Kim Wireless Optogenetics Injectable, Cellular-Scale Optoelectronics with Applications for This copy is for your personal, non-commercial use only. clicking here. colleagues, clients, or customers by , you can order high-quality copies for your If you wish to distribute this article to others here. following the guidelines can be obtained by Permission to republish or repurpose articles or portions of articles ): April 12, 2013 www.sciencemag.org (this information is current as of The following resources related to this article are available online at http://www.sciencemag.org/content/340/6129/211.full.html version of this article at: including high-resolution figures, can be found in the online Updated information and services, http://www.sciencemag.org/content/suppl/2013/04/10/340.6129.211.DC1.html can be found at: Supporting Online Material http://www.sciencemag.org/content/340/6129/211.full.html#related found at: can be related to this article A list of selected additional articles on the Science Web sites http://www.sciencemag.org/content/340/6129/211.full.html#ref-list-1 , 11 of which can be accessed free: cites 41 articles This article http://www.sciencemag.org/cgi/collection/app_physics Physics, Applied http://www.sciencemag.org/cgi/collection/neuroscience Neuroscience subject collections: This article appears in the following registered trademark of AAAS. is a Science 2013 by the American Association for the Advancement of Science; all rights reserved. The title Copyright American Association for the Advancement of Science, 1200 New York Avenue NW, Washington, DC 20005. (print ISSN 0036-8075; online ISSN 1095-9203) is published weekly, except the last week in December, by the Science on April 12, 2013 www.sciencemag.org Downloaded from
Transcript of Injectable, Cellular-Scale Optoelectronics with...

DOI: 10.1126/science.1232437, 211 (2013);340 Science
et al.Tae-il KimWireless OptogeneticsInjectable, Cellular-Scale Optoelectronics with Applications for
This copy is for your personal, non-commercial use only.
clicking here.colleagues, clients, or customers by , you can order high-quality copies for yourIf you wish to distribute this article to others
here.following the guidelines
can be obtained byPermission to republish or repurpose articles or portions of articles
): April 12, 2013 www.sciencemag.org (this information is current as of
The following resources related to this article are available online at
http://www.sciencemag.org/content/340/6129/211.full.htmlversion of this article at:
including high-resolution figures, can be found in the onlineUpdated information and services,
http://www.sciencemag.org/content/suppl/2013/04/10/340.6129.211.DC1.html can be found at: Supporting Online Material
http://www.sciencemag.org/content/340/6129/211.full.html#relatedfound at:
can berelated to this article A list of selected additional articles on the Science Web sites
http://www.sciencemag.org/content/340/6129/211.full.html#ref-list-1, 11 of which can be accessed free:cites 41 articlesThis article
http://www.sciencemag.org/cgi/collection/app_physicsPhysics, Applied
http://www.sciencemag.org/cgi/collection/neuroscienceNeuroscience
subject collections:This article appears in the following
registered trademark of AAAS. is aScience2013 by the American Association for the Advancement of Science; all rights reserved. The title
CopyrightAmerican Association for the Advancement of Science, 1200 New York Avenue NW, Washington, DC 20005. (print ISSN 0036-8075; online ISSN 1095-9203) is published weekly, except the last week in December, by theScience
on
Apr
il 12
, 201
3w
ww
.sci
ence
mag
.org
Dow
nloa
ded
from
immune regulators, lymphoid disorganization, andvirus persistence. IFN-I has pleiotropic effects onmultiple cellular processes. Aside from antiviraleffects (25), IFN-I signaling influences cell dif-ferentiation, proliferation, and apoptosis (26).Further, multiple pro-inflammatory mediators aredownstream of IFN-I signaling; thus, IFN-I canregulate multiple physiological processes. De-spite discovery of IFN-I over 50 years ago (27),its mechanisms of action with respect to immunemodulation (25) or antiviral activity (28, 29) re-main unsettled.
Chronic immune activation after HIV in-fection is documented, and suppression of thishyperactivated state may alleviate pathologiesassociated with HIV infection (7). Disease afterexperimental simian immunodeficiency virus(SIV) infection in rhesus macaques correlateswith elevated IFN-I and inflammatory signatures(30, 31). In contrast, SIV infection in sooty man-gabeys and African green monkeys, which de-velop modest pathology despite similar viralloads as macaques, correlates with reduced IFN-Iand inflammatory signatures (32). Similar corre-lationswith respect to reduced immune activationexist in HIV-infected elite controllers, althoughwhether reduced immune activation follows bet-ter control of virus infection is debatable (33, 34).Moreover, an elevated interferon signature is ob-served in HCV-infected patients despite limitedcontrol of virus replication and development ofliver pathology (35, 36). Thus, the IFN-I signal-ing pathway may be a viable target to controlpersistent viral infections.
References and Notes1. D. G. Brooks et al., Nat. Med. 12, 1301 (2006).2. D. L. Barber et al., Nature 439, 682 (2006).3. J. S. Yi, M. A. Cox, A. J. Zajac, Immunology 129, 474
(2010).4. A. J. Zajac et al., J. Exp. Med. 188, 2205 (1998).5. V. Appay, D. Sauce, J. Pathol. 214, 231 (2008).6. J. J. Chang, M. Altfeld, J. Infect. Dis. 202 (suppl. 2),
S297 (2010).7. G. d’Ettorre, M. Paiardini, G. Ceccarelli, G. Silvestri,
V. Vullo, AIDS Res. Hum. Retroviruses 27, 355(2011).
8. N. Sevilla et al., J. Exp. Med. 192, 1249 (2000).9. R. Ahmed, A. Salmi, L. D. Butler, J. M. Chiller,
M. B. Oldstone, J. Exp. Med. 160, 521 (1984).10. M. Salvato, P. Borrow, E. Shimomaye, M. B. Oldstone,
J. Virol. 65, 1863 (1991).11. C. F. Evans, P. Borrow, J. C. de la Torre, M. B. Oldstone,
J. Virol. 68, 7367 (1994).12. B. M. Sullivan et al., Proc. Natl. Acad. Sci. U.S.A. 108,
2969 (2011).13. A. Bergthaler et al., Proc. Natl. Acad. Sci. U.S.A. 107,
21641 (2010).14. S. Scheu, P. Dresing, R. M. Locksley, Proc. Natl. Acad.
Sci. U.S.A. 105, 20416 (2008).15. M. Macal et al., Cell Host Microbe 11, 617 (2012).16. K. C. Sheehan et al., J. Interferon Cytokine Res. 26,
804 (2006).17. N. Sevilla, D. B. McGavern, C. Teng, S. Kunz,
M. B. Oldstone, J. Clin. Invest. 113, 737 (2004).18. M. B. Oldstone, K. P. Campbell, Virology 411, 170
(2011).19. S. Müller et al., J. Virol. 76, 2375 (2002).20. D. P. Berger et al., Virology 260, 136 (1999).21. M. Suresh et al., J. Virol. 76, 3943 (2002).22. M. Zeng et al., J. Clin. Invest. 121, 998 (2011).23. M. Zeng et al., PLoS Pathog. 8, e1002437
(2012).24. B. Hahm, M. J. Trifilo, E. I. Zuniga, M. B. Oldstone,
Immunity 22, 247 (2005).25. D. B. Stetson, R. Medzhitov, Immunity 25, 373
(2006).
26. L. C. Platanias, Nat. Rev. Immunol. 5, 375 (2005).27. A. Isaacs, J. Lindenmann, Proc. R. Soc. Lond. B Biol. Sci.
147, 258 (1957).28. J. W. Schoggins, C. M. Rice, Curr. Opin. Virol. 1, 519
(2011).29. J. W. Schoggins et al., Nature 472, 481 (2011).30. O. Manches, N. Bhardwaj, J. Clin. Invest. 119, 3512
(2009).31. B. Jacquelin et al., J. Clin. Invest. 119, 3544 (2009).32. S. E. Bosinger et al., J. Clin. Invest. 119, 3556
(2009).33. S. G. Deeks, B. D. Walker, Immunity 27, 406 (2007).34. A. Sáez-Cirión, G. Pancino, M. Sinet, A. Venet,
O. Lambotte, Trends Immunol. 28, 532 (2007).35. A. I. Su et al., Proc. Natl. Acad. Sci. U.S.A. 99, 15669
(2002).36. L. G. Guidotti, F. V. Chisari, Annu. Rev. Pathol. 1, 23
(2006).
Acknowledgments: The authors thank D. Fremgen,C. Cubitt, N. Ngo, and S. Rice for technical excellence.Data reported in the manuscript are tabulated in themain paper and in the supplementary materials. Thisresearch was supported by NIH grant AI09484 (M.B.A.O.);National Cancer Institute grants NCI CA43059 (R.D.S.)and U54AI057160 to the Midwest Regional Center ofExcellence for Biodefense and Emerging Infectious DiseasesResearch (MRCE) (R.D.S. and M.B.A.O.); grants AI077719and AI047140 ( J.C.d.l.T.), postdoctoral training grantsAI007354; and American Heart fellowships 11POST7430106( J.R.T.), HL007195 (C.N.), and NS041219 (B.M.S.).
Supplementary Materialswww.sciencemag.org/cgi/content/full/340/6129/207/DC1Materials and MethodsFigs. S1 to S6Reference (37)
15 January 2013; accepted 28 February 201310.1126/science.1235214
Injectable, Cellular-ScaleOptoelectronics with Applicationsfor Wireless OptogeneticsTae-il Kim,1,2* Jordan G. McCall,3,4,5,6* Yei Hwan Jung,1† Xian Huang,1 Edward R. Siuda,3,4,5,6Yuhang Li,7 Jizhou Song,8 Young Min Song,1 Hsuan An Pao,1 Rak-Hwan Kim,1Chaofeng Lu,9 Sung Dan Lee,10 Il-Sun Song,11 Gunchul Shin,1 Ream Al-Hasani,3,4,5Stanley Kim,1 Meng Peun Tan,10 Yonggang Huang,7 Fiorenzo G. Omenetto,12,13John A. Rogers,1,10,11,14*‡ Michael R. Bruchas3,4,5,6*‡
Successful integration of advanced semiconductor devices with biological systems willaccelerate basic scientific discoveries and their translation into clinical technologies. Inneuroscience generally, and in optogenetics in particular, the ability to insert lightsources, detectors, sensors, and other components into precise locations of the deepbrain yields versatile and important capabilities. Here, we introduce an injectable classof cellular-scale optoelectronics that offers such features, with examples of unmatchedoperational modes in optogenetics, including completely wireless and programmed complexbehavioral control over freely moving animals. The ability of these ultrathin, mechanicallycompliant, biocompatible devices to afford minimally invasive operation in the soft tissuesof the mammalian brain foreshadow applications in other organ systems, with potentialfor broad utility in biomedical science and engineering.
Electronic systems that integrate with thebody provide powerful diagnostic andtherapeutic capabilities for basic research
and clinical medicine. Recent research estab-lishes materials and mechanical constructs forelectronic circuits, light-emitting diodes (LEDs),
sensors, and other components that can wrapthe soft, external surfaces of the brain, skin, andheart, for diverse functions in analytical mea-surement, stimulation, and intervention (1–10).A significant constraint in operating these de-vices, however, follows from their surface-mounted configurations and inability to providedirect interaction into the volumetric depths ofthe tissues. Passive penetrating electrodes oroptical fibers with interconnections to exter-nally located electronic control and/or acquisi-tion systems or light sources can be valuablein many contexts, particularly in neuroscience,engineering, and surgery (7, 10–14). Direct bio-logical integration is limited by challenges fromtissue lesions during insertion, persistent ir-ritation, and engineering difficulties in thermalmanagement, encapsulation, scalable inter-connection, power delivery, and external con-trol. Many of these issues constrain attemptsto insert conventional, bulk LEDs into brain tis-sue (15) and to use semiconductor nanowiredevices as cellular probes or active, in vitro tis-sue scaffolds (3, 16). In optogenetics, engineer-ing limitations of conventional, tethered fiberoptic devices restrict opportunities for in vivouse and widespread biological application. Asa solution, we developed mechanically compliant,ultrathin multifunctional optoelectronic systems
www.sciencemag.org SCIENCE VOL 340 12 APRIL 2013 211
REPORTS
on
Apr
il 12
, 201
3w
ww
.sci
ence
mag
.org
Dow
nloa
ded
from
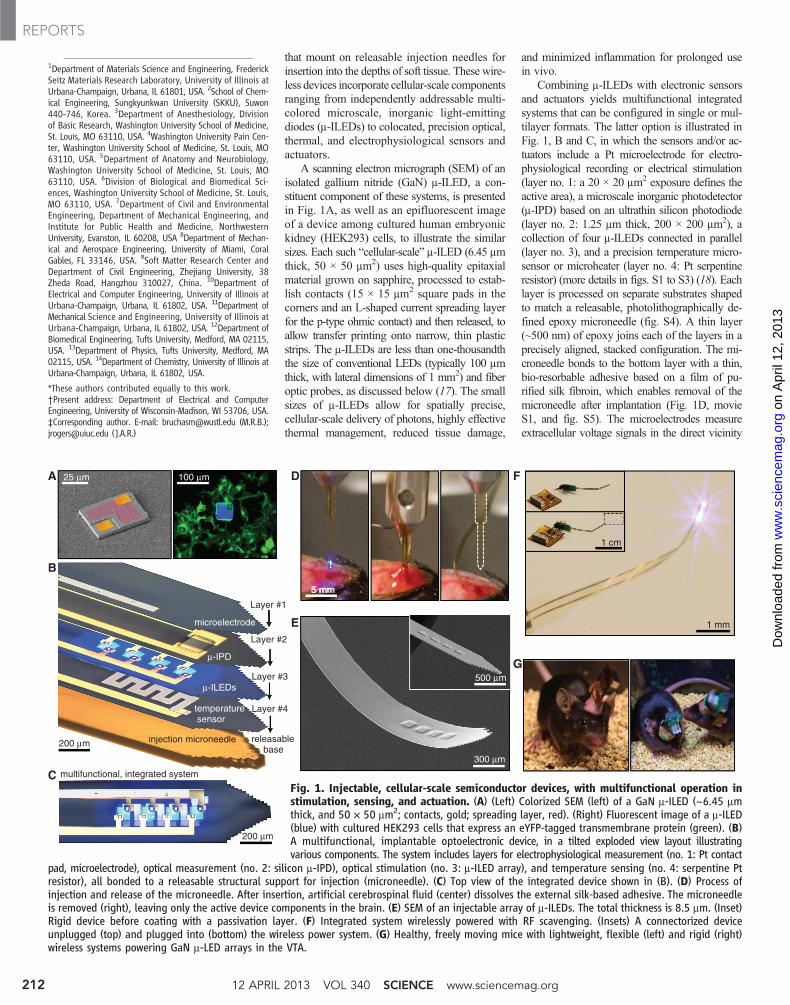
that mount on releasable injection needles forinsertion into the depths of soft tissue. These wire-less devices incorporate cellular-scale componentsranging from independently addressable multi-colored microscale, inorganic light-emittingdiodes (m-ILEDs) to colocated, precision optical,thermal, and electrophysiological sensors andactuators.
A scanning electron micrograph (SEM) of anisolated gallium nitride (GaN) m-ILED, a con-stituent component of these systems, is presentedin Fig. 1A, as well as an epifluorescent imageof a device among cultured human embryonickidney (HEK293) cells, to illustrate the similarsizes. Each such “cellular-scale” m-ILED (6.45 mmthick, 50 × 50 mm2) uses high-quality epitaxialmaterial grown on sapphire, processed to estab-lish contacts (15 × 15 mm2 square pads in thecorners and an L-shaped current spreading layerfor the p-type ohmic contact) and then released, toallow transfer printing onto narrow, thin plasticstrips. The m-ILEDs are less than one-thousandththe size of conventional LEDs (typically 100 mmthick, with lateral dimensions of 1 mm2) and fiberoptic probes, as discussed below (17). The smallsizes of m-ILEDs allow for spatially precise,cellular-scale delivery of photons, highly effectivethermal management, reduced tissue damage,
and minimized inflammation for prolonged usein vivo.
Combining m-ILEDs with electronic sensorsand actuators yields multifunctional integratedsystems that can be configured in single or mul-tilayer formats. The latter option is illustrated inFig. 1, B and C, in which the sensors and/or ac-tuators include a Pt microelectrode for electro-physiological recording or electrical stimulation(layer no. 1: a 20 × 20 mm2 exposure defines theactive area), a microscale inorganic photodetector(m-IPD) based on an ultrathin silicon photodiode(layer no. 2: 1.25 mm thick, 200 × 200 mm2), acollection of four m-ILEDs connected in parallel(layer no. 3), and a precision temperature micro-sensor or microheater (layer no. 4: Pt serpentineresistor) (more details in figs. S1 to S3) (18). Eachlayer is processed on separate substrates shapedto match a releasable, photolithographically de-fined epoxy microneedle (fig. S4). A thin layer(~500 nm) of epoxy joins each of the layers in aprecisely aligned, stacked configuration. The mi-croneedle bonds to the bottom layer with a thin,bio-resorbable adhesive based on a film of pu-rified silk fibroin, which enables removal of themicroneedle after implantation (Fig. 1D, movieS1, and fig. S5). The microelectrodes measureextracellular voltage signals in the direct vicinity
A
B
C
D
multifunctional, integrated system
microelectrode
µ-ILEDs
temperature sensor
injection microneedle
Layer #1
Layer #2
releasablebase
Layer #4
200 µm
5 mm
200 µm
Layer #3
µ-IPD
25 µm 100 µm F
G
300 µm
1 mm
500 µm
E
5 mm
1 cm
Fig. 1. Injectable, cellular-scale semiconductor devices, with multifunctional operation instimulation, sensing, and actuation. (A) (Left) Colorized SEM (left) of a GaN m-ILED (~6.45 mmthick, and 50 × 50 mm2; contacts, gold; spreading layer, red). (Right) Fluorescent image of a m-ILED(blue) with cultured HEK293 cells that express an eYFP-tagged transmembrane protein (green). (B)A multifunctional, implantable optoelectronic device, in a tilted exploded view layout illustratingvarious components. The system includes layers for electrophysiological measurement (no. 1: Pt contact
pad, microelectrode), optical measurement (no. 2: silicon m-IPD), optical stimulation (no. 3: m-ILED array), and temperature sensing (no. 4: serpentine Ptresistor), all bonded to a releasable structural support for injection (microneedle). (C) Top view of the integrated device shown in (B). (D) Process ofinjection and release of the microneedle. After insertion, artificial cerebrospinal fluid (center) dissolves the external silk-based adhesive. The microneedleis removed (right), leaving only the active device components in the brain. (E) SEM of an injectable array of m-ILEDs. The total thickness is 8.5 mm. (Inset)Rigid device before coating with a passivation layer. (F) Integrated system wirelessly powered with RF scavenging. (Insets) A connectorized deviceunplugged (top) and plugged into (bottom) the wireless power system. (G) Healthy, freely moving mice with lightweight, flexible (left) and rigid (right)wireless systems powering GaN m-LED arrays in the VTA.
1Department of Materials Science and Engineering, FrederickSeitz Materials Research Laboratory, University of Illinois atUrbana-Champaign, Urbana, IL 61801, USA. 2School of Chem-ical Engineering, Sungkyunkwan University (SKKU), Suwon440-746, Korea. 3Department of Anesthesiology, Divisionof Basic Research, Washington University School of Medicine,St. Louis, MO 63110, USA. 4Washington University Pain Cen-ter, Washington University School of Medicine, St. Louis, MO63110, USA. 5Department of Anatomy and Neurobiology,Washington University School of Medicine, St. Louis, MO63110, USA. 6Division of Biological and Biomedical Sci-ences, Washington University School of Medicine, St. Louis,MO 63110, USA. 7Department of Civil and EnvironmentalEngineering, Department of Mechanical Engineering, andInstitute for Public Health and Medicine, NorthwesternUniversity, Evanston, IL 60208, USA 8Department of Mechan-ical and Aerospace Engineering, University of Miami, CoralGables, FL 33146, USA. 9Soft Matter Research Center andDepartment of Civil Engineering, Zhejiang University, 38Zheda Road, Hangzhou 310027, China. 10Department ofElectrical and Computer Engineering, University of Illinois atUrbana-Champaign, Urbana, IL 61802, USA. 11Department ofMechanical Science and Engineering, University of Illinois atUrbana-Champaign, Urbana, IL 61802, USA. 12Department ofBiomedical Engineering, Tufts University, Medford, MA 02115,USA. 13Department of Physics, Tufts University, Medford, MA02115, USA. 14Department of Chemistry, University of Illinois atUrbana-Champaign, Urbana, IL 61802, USA.
*These authors contributed equally to this work.†Present address: Department of Electrical and ComputerEngineering, University of Wisconsin-Madison, WI 53706, USA.‡Corresponding author. E-mail: [email protected] (M.R.B.);[email protected] (J.A.R.)
12 APRIL 2013 VOL 340 SCIENCE www.sciencemag.org212
REPORTS
on
Apr
il 12
, 201
3w
ww
.sci
ence
mag
.org
Dow
nloa
ded
from
of illumination and can also be used for stimu-lation (Fig. 2H). The temperature sensors deter-mine the degree of local heating, with a precisionapproaching ~1 mK, and can also be used as mi-croheaters. The m-IPD can measure the intensityof light from the m-ILEDs while implanted deepin brain tissue and/or can enable basic spectro-scopic evaluations such as absorption, fluo-rescence, and diffuse scattering (for details, seefigs. S6 and S7) (18).
Injection of such flexible devices into thebrain follows steps shown in Fig. 1D and movieS1. The injected multifunctional optoelectronicsystems have a total thickness of ~20 mm. Thisexceptionally thin geometry, low bending rigid-ity, and high degree of mechanical flexibility(Fig. 1, E and F) allow for minimally invasiveoperation. Wired control schemes use standardtransistor-transistor logic (TTL) and are there-fore compatible with any readily available elec-trical commutator. Details on wired poweringstrategies and demonstration of wired opto-
genetic functionality in rodent behavioral as-says are presented in figs. S8, S9, and S10 (18).Implementation of a wireless power modulebased on radiofrequency (RF) scavenging isshown in Fig. 1F. A custom flexible polyimidefilm–based lightweight (~0.7 g) power scav-enger or a rigid printed circuit board–basedscavenger (~2.0 g) (Fig. 1G and fig. S11) can betemporarily mounted on freely moving animalsfor short-term experimentation without con-straint in natural animal behavior (Fig. 1G). Theentire system consists of a wireless power trans-mitter and RF signal generator; an RF source(910 MHz, power output between 0.02 and0.1 mW); a power supply; an RF power am-plifier (gain of 49 dB at 910 MHz, power out-put between 1.6 and 7.9 W); and a panel antenna(gain of 13 dBi), as in fig. S11 and fig. S12. Thelow-frequency signal generator provides user-controlled amplitude modulation for programmedoperation. The RF power that reaches the ani-mals, under normal operating conditions at a dis-
tance of ~1 m, is between 0.15 and 0.77 mW/cm2,which is substantially smaller than the maximumpermissible exposure limits (3.03 mW/cm2) forhumans in controlled environments (19). Wire-less control allows access to complex and etho-logically relevant models in diverse environmentalsettings, including social interactions, home cagebehaviors, wheel running, complex maze naviga-tion tasks, and other behavioral outputs (Fig. 1Gand fig. S13).
The electrical, optical, and thermal character-istics of the devices when operated in biologicalenvironments are important for optogenetics andother biomedical applications. The total opticalpower density of the four m-ILEDs in this deviceas a function of electrical input power is shownin Fig. 2A (more details in figs. S14 and S15)(18). This performance is comparable to sim-ilarly designed, state-of-the-art conventional GaNLEDs (17). Many optogenetic constructs can beactivated with ~1 mW/mm2, at wavelengths near450 nm (13). These conditions are well matched
E
G
H I
offoff offoff5 Hz3 Hz 20 Hz10 Hz
40 oC37 3938
37.17 37.22 37.31 37.46
5 mm
C
D
37.20 37.34 37.68 38.37
3 Hz 5 Hz 10 Hz 20 HzB
1 mm
20 Hz
10 Hz
5 Hz
3 Hz
Fon off
56 60 64 68
0.00
0.04
0.08
0.12
Time (s)
onoffoff
0 10 20 30 400
10
20
30
40
Electrical input power (mW)
(mW
/mm
2 )
A
20 mW3 mW 40 mW
Opt
ical
pow
er d
ensi
ty
0 2 4 6 8
-1500
-1000
-500
0
Time (s)
Cur
rent
(nA
)
21.9 mW/mm216.2 mW/mm25.0 mW/mm2
0 5 10 15 2035
40
45
50
Frequency (Hz)
Tiss
uete
mpe
ratu
re(°
C) 2 mm
1 mm
0.3 mm
DC
23.5 mW/mm2
17.7 mW/mm2
23.5 mW/mm2
17.7 mW/mm2
23.5 mW/mm2
17.7 mW/mm2
50 100 150 200 250
0.00
0.04
0.08
0.12
Time (s)
Tem
pera
t ure
( °C
)
500 ms180
µV
PC1
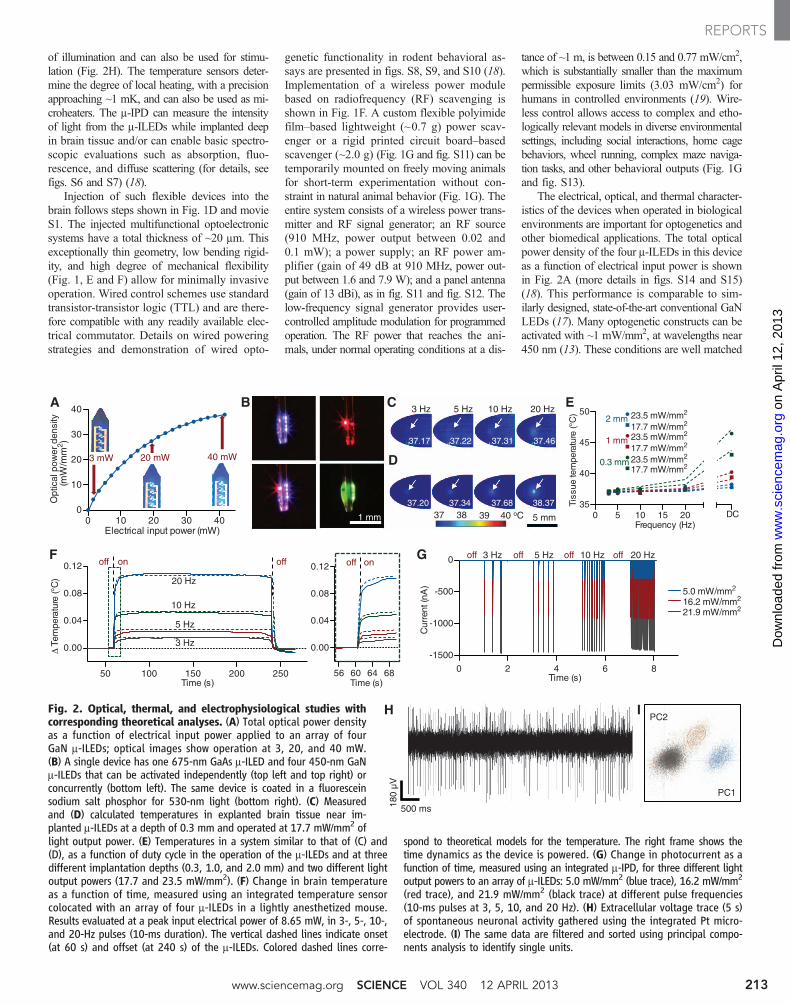
PC2Fig. 2. Optical, thermal, and electrophysiological studies withcorresponding theoretical analyses. (A) Total optical power densityas a function of electrical input power applied to an array of fourGaN m-ILEDs; optical images show operation at 3, 20, and 40 mW.(B) A single device has one 675-nm GaAs m-ILED and four 450-nm GaNm-ILEDs that can be activated independently (top left and top right) orconcurrently (bottom left). The same device is coated in a fluoresceinsodium salt phosphor for 530-nm light (bottom right). (C) Measuredand (D) calculated temperatures in explanted brain tissue near im-planted m-ILEDs at a depth of 0.3 mm and operated at 17.7 mW/mm2 oflight output power. (E) Temperatures in a system similar to that of (C) and(D), as a function of duty cycle in the operation of the m-ILEDs and at threedifferent implantation depths (0.3, 1.0, and 2.0 mm) and two different lightoutput powers (17.7 and 23.5 mW/mm2). (F) Change in brain temperatureas a function of time, measured using an integrated temperature sensorcolocated with an array of four m-ILEDs in a lightly anesthetized mouse.Results evaluated at a peak input electrical power of 8.65 mW, in 3-, 5-, 10-,and 20-Hz pulses (10-ms duration). The vertical dashed lines indicate onset(at 60 s) and offset (at 240 s) of the m-ILEDs. Colored dashed lines corre-
spond to theoretical models for the temperature. The right frame shows thetime dynamics as the device is powered. (G) Change in photocurrent as afunction of time, measured using an integrated m-IPD, for three different lightoutput powers to an array of m-ILEDs: 5.0 mW/mm2 (blue trace), 16.2 mW/mm2
(red trace), and 21.9 mW/mm2 (black trace) at different pulse frequencies(10-ms pulses at 3, 5, 10, and 20 Hz). (H) Extracellular voltage trace (5 s)of spontaneous neuronal activity gathered using the integrated Pt micro-electrode. (I) The same data are filtered and sorted using principal compo-nents analysis to identify single units.
www.sciencemag.org SCIENCE VOL 340 12 APRIL 2013 213
REPORTS
on
Apr
il 12
, 201
3w
ww
.sci
ence
mag
.org
Dow
nloa
ded
from
to the output of the GaN m-ILEDs. Input powerof ~1.0 to 1.5 mW (Fig. 2A) is sufficient forboth activation of the channelrhodopsin-2 [ChR2(H134)] ion channel and precise control of intra-cellular signaling [adenosine 3′,5′-monophosphate(cAMP) and extracellular signal–regulated ki-nase (ERK 1/2)] via an optically sensitive seven-transmembrane domain receptor (OPTO-b2) (20)(Fig. 3, C and D, and figs. S16 and S17). Wire-lessly, at a distance of 1 m, the RF scavengerproduces 4.08 mW of electrical power result-ing in a 7 mW/mm2 optical power density. Otherwavelengths are possible using different typesof m-ILEDs, either in multicolored or uniformarrays. An example of the latter, with blue andred (GaAs) m-ILEDs, and the former, with greendevices (produced using fluorescein sodium saltphosphor on a blue GaN m-ILED), are shownin Fig. 2B.
m-ILED–induced changes in temperature de-termined by infrared imaging and by analyticalcalculation, respectively, are shown in Fig. 2, Cand D. The m-ILEDs were implanted 0.3 mminto an explanted piece of brain tissue held at37°C. The time-averaged temperatures measuredat light-pulse (10-ms) frequencies of 3, 5, 10, and20 Hz with peak light output of 17.7 mW/mm2
are 37.17°, 37.22°, 37.31°, and 37.46°C, respec-tively. These results are similar to calculated time-averaged temperatures of 37.20°, 37.34°, 37.68°,and 38.37°C, respectively. Note that the inputpower used in these tests is 10 times what is nec-essary to activate many optogenetic constructs(13). The cellular-scale dimensions of the m-ILEDsenable high rates of passive thermal spreading,and the brain tissue itself operates as an efficientheat sink. The latter is apparent in studies of thedependence of operating temperature on tissuethickness, operating power, and frequency (Fig.2E). As in Fig. 2D, the experiment and theoryagree remarkably well in spite of the indirectcorrelation between infrared imaging resultsand temperature at the location of the devices(details appear in figs. S18 and S19) (18). Per-fusion in living tissue further increases the ef-ficacy of these biological heat sinks. Changes intemperature measured in vivo using an integratedtemperature sensor (fig. S6) compared withcalculated results are shown in Fig. 2F. Collect-ively, these results indicate that changes in tem-perature associated with operation of m-ILEDscan be less than 0.10°C for pulse frequenciesless than 20 Hz, typical of many neuronal firingrates. These values are much lower than those that
occur in human deep brain stimulation (DBS)regulation, ~2°C (21). Furthermore, in wirelessoperation, there is no appreciable change in tem-perature associated with operation at the headstage antenna or the skull (fig. S20).
Other components of this multifunctionalplatform exhibit similarly good characteristics.To demonstrate operation of the silicon m-IPD,Fig. 2G shows photocurrents generated by dif-ferent intensities of light from m-ILEDs at differ-ent pulse frequencies. Finally, the Pt microelectrodehas a 400 mm2 exposure site with ~1.0 MW im-pedance at 1 kHz capable of measuring extracel-lular potentials on the microvolt scale necessaryto distinguish individual action potentials (Fig.2H), as demonstrated with clear clustering inthe principal component analysis of spike data(Fig. 2I).
For use in optogenetics, such devices elimi-nate the need for lasers, bulk LEDs, fiber couplingsystems, tethers, and optomechanical hardwareused in conventional approaches (fig. S8). Fur-thermore, the fundamental optics of m-ILEDsare very different from typical fiber optic im-plants. Absorbing and reflecting structures aroundthe emissive areas of the m-ILEDs enable pre-cise delivery of light to cellular subregions. The
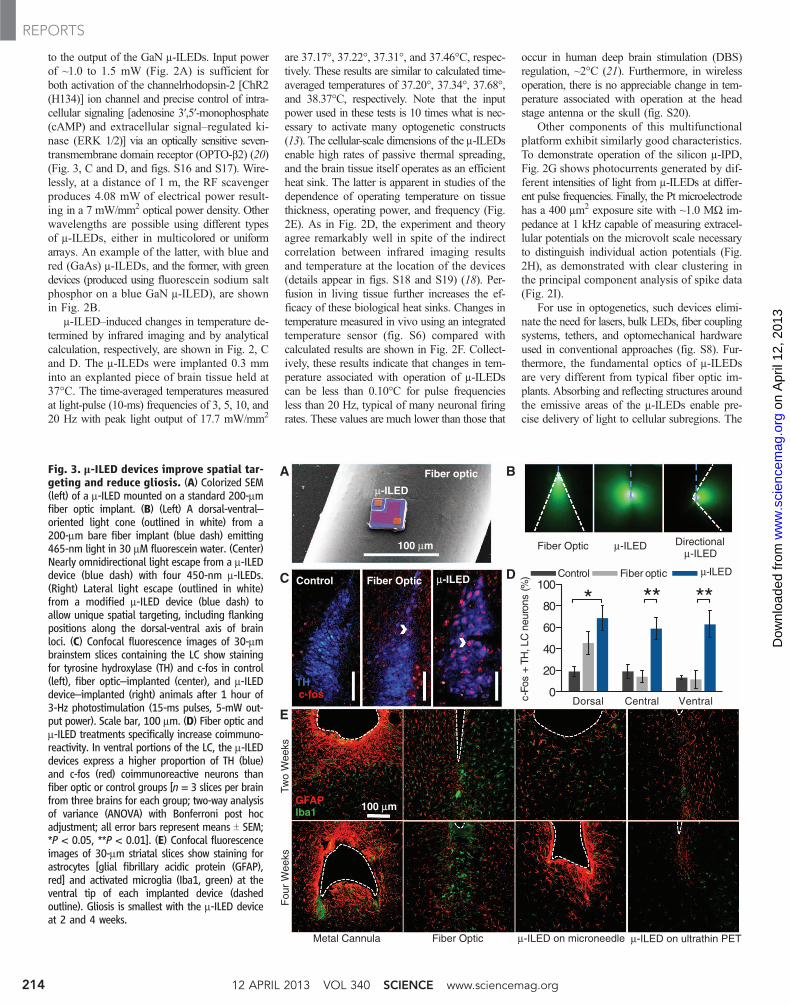
Fig. 3. m-ILED devices improve spatial tar-geting and reduce gliosis. (A) Colorized SEM(left) of a m-ILED mounted on a standard 200-mmfiber optic implant. (B) (Left) A dorsal-ventral–oriented light cone (outlined in white) from a200-mm bare fiber implant (blue dash) emitting465-nm light in 30 mM fluorescein water. (Center)Nearly omnidirectional light escape from a m-ILEDdevice (blue dash) with four 450-nm m-ILEDs.(Right) Lateral light escape (outlined in white)from a modified m-ILED device (blue dash) toallow unique spatial targeting, including flankingpositions along the dorsal-ventral axis of brainloci. (C) Confocal fluorescence images of 30-mmbrainstem slices containing the LC show stainingfor tyrosine hydroxylase (TH) and c-fos in control(left), fiber optic–implanted (center), and m-ILEDdevice–implanted (right) animals after 1 hour of3-Hz photostimulation (15-ms pulses, 5-mW out-put power). Scale bar, 100 mm. (D) Fiber optic andm-ILED treatments specifically increase coimmuno-reactivity. In ventral portions of the LC, the m-ILEDdevices express a higher proportion of TH (blue)and c-fos (red) coimmunoreactive neurons thanfiber optic or control groups [n = 3 slices per brainfrom three brains for each group; two-way analysisof variance (ANOVA) with Bonferroni post hocadjustment; all error bars represent means T SEM;*P < 0.05, **P < 0.01]. (E) Confocal fluorescenceimages of 30-mm striatal slices show staining forastrocytes [glial fibrillary acidic protein (GFAP),red] and activated microglia (Iba1, green) at theventral tip of each implanted device (dashedoutline). Gliosis is smallest with the m-ILED deviceat 2 and 4 weeks.
D
µ-ILED on microneedle µ-ILED on ultrathin PETFiber OpticMetal Cannula
Two
Wee
ksF
our
Wee
ks
GFAPIba1 100 µm
TH c-fos
Control Fiber Optic µ-ILEDC
E
Fiber Optic µ-ILED Directional µ-ILED
BA
100 µm
Fiber optic
µ-ILED
Dorsal Central Ventral0
20
40
60
80
100
c-Fo
s +
TH, L
C n
euro
n s (%
)
*** **Control Fiber optic µ-ILED
12 APRIL 2013 VOL 340 SCIENCE www.sciencemag.org214
REPORTS
on
Apr
il 12
, 201
3w
ww
.sci
ence
mag
.org
Dow
nloa
ded
from
relative size and the different patterns of lightemission from m-ILEDs to fiber optic probes areshown in Fig. 3, A and B. Fiber optics typicallyapproach brain structures dorsally. This approachpreferentially illuminates cells in the dorsal por-tion of the targeted region with greater lightintensity near the point of light escape (22) (Fig.3B, left, and fig. S21). Targeting ventral cellbodies or terminals requires lesion of dorsal re-gions or the use of substantially greater, and po-tentially phototoxic (23), amounts of light tothe site of interest. Neither option protects theintact architecture of a complete brain locus. Al-though recent advances have spatially restrictedlight from implanted fiber optics (24, 25), theseapproaches require the use of invasive metalcannulae (Fig. 3E) or rely on sophisticated andsensitive optomechanical engineering that maylimit their use in awake, behaving animals. Thearchitecture of the m-ILEDs enables light de-livery medial or lateral to the intended targetbrain region. Native light escape from m-ILEDsis nearly omnidirectional (Fig. 3B, center) butcan be restricted to a wide range of angles withabsorbing or reflective structures on the device(Fig. 3B, right).
We implanted both m-ILEDs and fiber opticsinto animals expressing ChR2(H134)-eYFP (taggedwith enhanced yellow fluorescent protein) in thelocus coeruleus (LC) (fig. S21). One hour of
output-matched photostimulation induced c-fosexpression (26), a biochemical marker of neu-ronal activation, in both groups of ChR2(H134)-eYFP–expressing mice that was not seen in greenfluorescent protein (GFP)–expressing controls (Fig.3, C and D). The spatial distribution of c-fos ex-pression, however, differed markedly betweenthe fiber optic and m-ILED groups. m-ILED de-vices produced significantly greater activation inthe ventral LC (Fig. 3D).
The physical sizes and mechanical proper-ties of the m-ILED systems reduce lesioning,neuronal loss, gliosis, and immunoreactivity.Glial responses are biphasic with an early phasefeaturing widespread activation of astrocytesand microglia and a late, prolonged phase hall-marked by restriction of the gliosis to the areaclosest to the implanted substrate (27). Them-ILED devices produced substantially lessglial activation and caused smaller lesions thanmetal cannulae and fiber optics, at both early(2 weeks) and late (4 weeks) phases (Fig. 3E).Furthermore, the brain tolerates the thin, flexibledevices better than rigid structures (Fig. 3E), con-sistent with reports on passive electrode devices(28). Finally, we examined the chronic function-ality of the devices and demonstrated that theyare well tolerated in freely moving animals withencapsulated sensors and m-ILEDs, which main-tain function over several months (fig. S22).
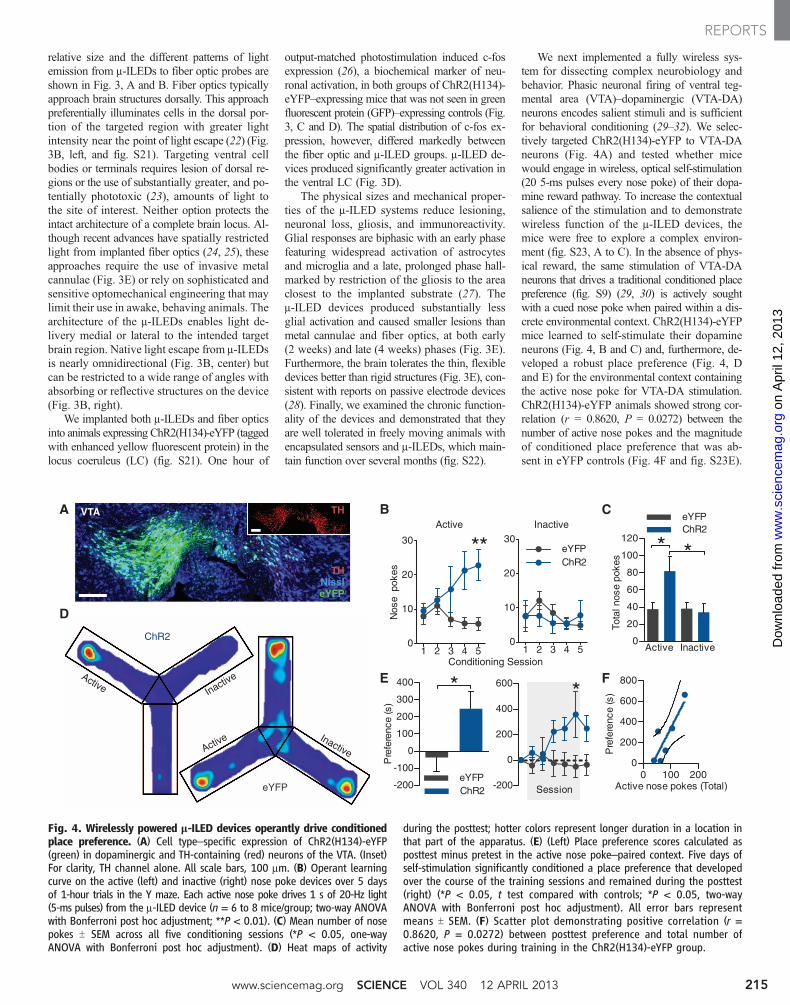
We next implemented a fully wireless sys-tem for dissecting complex neurobiology andbehavior. Phasic neuronal firing of ventral teg-mental area (VTA)–dopaminergic (VTA-DA)neurons encodes salient stimuli and is sufficientfor behavioral conditioning (29–32). We selec-tively targeted ChR2(H134)-eYFP to VTA-DAneurons (Fig. 4A) and tested whether micewould engage in wireless, optical self-stimulation(20 5-ms pulses every nose poke) of their dopa-mine reward pathway. To increase the contextualsalience of the stimulation and to demonstratewireless function of the m-ILED devices, themice were free to explore a complex environ-ment (fig. S23, A to C). In the absence of phys-ical reward, the same stimulation of VTA-DAneurons that drives a traditional conditioned placepreference (fig. S9) (29, 30) is actively soughtwith a cued nose poke when paired within a dis-crete environmental context. ChR2(H134)-eYFPmice learned to self-stimulate their dopamineneurons (Fig. 4, B and C) and, furthermore, de-veloped a robust place preference (Fig. 4, Dand E) for the environmental context containingthe active nose poke for VTA-DA stimulation.ChR2(H134)-eYFP animals showed strong cor-relation (r = 0.8620, P = 0.0272) between thenumber of active nose pokes and the magnitudeof conditioned place preference that was ab-sent in eYFP controls (Fig. 4F and fig. S23E).
Active Inactive
Conditioning Session
B C
E F
D
ChR2
eYFP
1 2 3 4 50
10
20
30eYFPChR2
1 2 3 4 50
10
20
30
Nos
e p
oke s
**
-200
-100
0
100
200
300
400
Pre
fere
nce
(s)
*
eYFPChR2
A
-200
0
200
400
600
Session
*
VTA TH
THNissleYFP
0 100 2000
200
400
600
800
Active nose pokes (Total)
Pre
fere
nce
( s)
0
20
40
60
80
100
120
Tota
l nos
e po
kes
Active Inactive
* *
eYFPChR2
Fig. 4. Wirelessly powered m-ILED devices operantly drive conditionedplace preference. (A) Cell type–specific expression of ChR2(H134)-eYFP(green) in dopaminergic and TH-containing (red) neurons of the VTA. (Inset)For clarity, TH channel alone. All scale bars, 100 mm. (B) Operant learningcurve on the active (left) and inactive (right) nose poke devices over 5 daysof 1-hour trials in the Y maze. Each active nose poke drives 1 s of 20-Hz light(5-ms pulses) from the m-ILED device (n = 6 to 8 mice/group; two-way ANOVAwith Bonferroni post hoc adjustment; **P < 0.01). (C) Mean number of nosepokes T SEM across all five conditioning sessions (*P < 0.05, one-wayANOVA with Bonferroni post hoc adjustment). (D) Heat maps of activity
during the posttest; hotter colors represent longer duration in a location inthat part of the apparatus. (E) (Left) Place preference scores calculated asposttest minus pretest in the active nose poke–paired context. Five days ofself-stimulation significantly conditioned a place preference that developedover the course of the training sessions and remained during the posttest(right) (*P < 0.05, t test compared with controls; *P < 0.05, two-wayANOVA with Bonferroni post hoc adjustment). All error bars representmeans T SEM. (F) Scatter plot demonstrating positive correlation (r =0.8620, P = 0.0272) between posttest preference and total number ofactive nose pokes during training in the ChR2(H134)-eYFP group.
www.sciencemag.org SCIENCE VOL 340 12 APRIL 2013 215
REPORTS
on
Apr
il 12
, 201
3w
ww
.sci
ence
mag
.org
Dow
nloa
ded
from

In addition, we examined the effects of wire-less tonic stimulation of VTA-DA neurons onanxiety-like behavior. Tonic stimulation at 5 Hzreduced anxiety-like behavior, whereas phasicactivation of VTA-DA neurons did not have aneffect on anxiety-like behavior (fig. S24). Thesefindings are consistent with the anxiolytic actionsof nicotine on VTA-DA neurons, as well as thebehavioral phenotypes seen in the ClockD19mice that have increased tonic firing of VTA-DAneurons (33, 34), and further establish the utilityof wireless optogenetic control in multiple envi-ronmental contexts.
These experiments demonstrate that thesedevices can be readily implemented in opto-genetic experiments. Future possible uses arein closed-loop operation, where actuators (e.g.,heat, light, and electrical) operate in tandem withsensors (e.g., temperature, light, and potential)for altering light stimulation in response to phys-iological parameters, such as single-unit activity,pH, blood oxygen or glucose levels, or neuro-chemical changes associated with neurotrans-mitter release. Many of the device attributes thatmake them useful in optogenetics suggest strongpotential for broader utility in biology and me-dicine. The demonstrated compatibility of sili-con technology in these injectable, cellular-scaleplatforms foreshadows sophisticated capabil-ities in electronic processing and biological in-terfaces. Biocompatible deep-tissue injection ofsemiconductor devices and integrated systems,such as those reported here, will accelerate pro-gress in both basic science and translationaltechnologies.
References and Notes1. D.-H. Kim et al., Nat. Mater. 9, 511 (2010).2. J. Viventi et al., Sci. Transl. Med. 2, 24ra22
(2010).3. B. Tian et al., Science 329, 830 (2010).4. D.-H. Kim et al., Science 333, 838 (2011).5. Q. Qing et al., Proc. Natl. Acad. Sci. U.S.A. 107, 1882
(2010).6. T. Sekitani, T. Someya, MRS Bull. 37, 236
(2012).7. J. Ordonez, M. Schuettler, C. Boehler, T. Boretius,
T. Stieglitz, MRS Bull. 37, 590 (2012).8. S. C. B. Mannsfeld et al., Nat. Mater. 9, 859
(2010).9. T. Sekitani et al., Science 326, 1516 (2009).
10. S. Takeuchi, T. Suzuki, K. Mabuchi, H. Fujita, J. Micromech.Microeng. 14, 104 (2004).
11. E. Stark, T. Koos, G. Buzsáki, J. Neurophysiol. 108, 349(2012).
12. Y.-T. Kim, M. I. Romero-Ortega, MRS Bull. 37, 573(2012).
13. J. Mattis et al., Nat. Methods 18, 159 (2011).14. P. Anikeeva et al., Nat. Neurosci. 15, 163 (2011).15. H. Cao, L. Gu, S. K. Mohanty, J.-C. Chiao, IEEE Trans.
Biomed. Eng. 60, 225 (2013).16. B. Tian et al., Nat. Mater. 11, 986 (2012).17. T.-I. Kim et al., Small 8, 1643 (2012).18. Materials and methods are available as supplementary
materials on Science Online.19. Federal Communications Commission (FCC), Guidelines
for Evaluating the Environmental Effects of RadiofrequencyRadiation (FCC publication docket no. 93-62, 1996);http://transition.fcc.gov/Bureaus/Engineering_Technology/Orders/1996/fcc96326.txt.
20. R. D. Airan, K. R. Thompson, L. E. Fenno, H. Bernstein,K. Deisseroth, Nature 458, 1025 (2009).
21. M. M. Elwassif, Q. Kong, M. Vazquez, M. Bikson, J. NeuralEng. 3, 306 (2006).
22. A. M. Aravanis et al., J. Neural Eng. 4, S143(2007).
23. O. Yizhar, L. E. Fenno, T. J. Davidson, M. Mogri,K. Deisseroth, Neuron 71, 9 (2011).
24. K. M. Tye et al., Nature 471, 358 (2011).25. A. N. Zorzos, J. Scholvin, E. S. Boyden, C. G. Fonstad,
Opt. Lett. 37, 4841 (2012).26. M. E. Carter et al., Nat. Neurosci. 13, 1526 (2010).27. D. H. Szarowski et al., Brain Res. 983, 23
(2003).28. T. D. Y. Kozai, D. R. Kipke, J. Neurosci. Methods 184, 199
(2009).29. H. C. Tsai et al., Science 324, 1080 (2009).30. A. R. Adamantidis et al., J. Neurosci. 31, 10829
(2011).31. I. B. Witten et al., Neuron 72, 721 (2011).32. K. M. Kim et al., PLoS ONE 7, e33612 (2012).33. T. M. McGranahan, N. E. Patzlaff, S. R. Grady,
S. F. Heinemann, T. K. Booker, J. Neurosci. 31,10891 (2011).
34. L. Coque et al., Neuropsychopharmacology 36, 1478(2011).
Acknowledgments: This work is supported by the NIHCommon Fund; National Institute of Neurological Disordersand Stroke, NIH, R01NS081707 (M.R.B., J.A.R.); NationalInstitute on Drug Abuse, NIH, R00DA025182 (M.R.B.);
McDonnell Center for Systems Neuroscience (M.R.B.);National Security Science and Engineering FacultyFellowship of Energy ( J.A.R.); Division of MaterialsSciences, U.S. Department of Energy, under awardno. DE-FG02-07ER46471 ( J.A.R.), and the MaterialsResearch Laboratory and Center for Microanalysis ofMaterials (DE-FG02-07ER46453) ( J.A.R.); and the Divisionof Biology and Biomedical Sciences, Washington Universityin St. Louis (WUSTL) ( J.G.M.). We thank H. Tao (TuftsUniversity) and S. Hwang (University of Illinois atUrbana-Champaign) for their help in preparation of silksolution and valuable discussions; the Bruchas laboratoryand the laboratories of R. W. Gereau IV (WUSTL) andG. D. Stuber (University of North Carolina at Chapel Hill)for helpful discussions; K. Deisseroth (Stanford University)for the channelrhodopsin-2 (H134) and OPTO-b2 constructs;G. D. Stuber for the TH-IRES-Cre mice; the WUSTL BakewellNeuroimaging Laboratory Core; and the WUSTL HopeCenter Viral Vector Core.
Supplementary Materialswww.sciencemag.org/cgi/content/full/340/6129/211/DC1Materials and MethodsFigs. S1 to S24Table S1References (35–48)Movie S1
6 November 2012; accepted 18 February 201310.1126/science.1232437
Interactions Between the NucleusAccumbens and Auditory CorticesPredict Music Reward ValueValorie N. Salimpoor,1,2,3* Iris van den Bosch,4 Natasa Kovacevic,2 Anthony Randal McIntosh,2Alain Dagher,1 Robert J. Zatorre1,3
We used functional magnetic resonance imaging to investigate neural processes when musicgains reward value the first time it is heard. The degree of activity in the mesolimbic striatalregions, especially the nucleus accumbens, during music listening was the best predictor of theamount listeners were willing to spend on previously unheard music in an auction paradigm.Importantly, the auditory cortices, amygdala, and ventromedial prefrontal regions showedincreased activity during listening conditions requiring valuation, but did not predict rewardvalue, which was instead predicted by increasing functional connectivity of these regions withthe nucleus accumbens as the reward value increased. Thus, aesthetic rewards arise from theinteraction between mesolimbic reward circuitry and cortical networks involved in perceptualanalysis and valuation.
Music is a potent phenomenon, existingin all cultures from prehistory onward(1). How sounds that have no intrinsic
reward value can become highly pleasurable re-mains largely unknown. Prior studies demon-strate that listening to music engages not only the
auditory cortices, but also emotion regions andreward-related mesolimbic circuits (2, 3); studieshave also shown that dopamine mediates thisresponse in the striatum (4). These reward cir-cuits reinforce biologically adaptive behaviors,including eating and sex (5, 6), and are shared bymost vertebrates. However, appreciation of mu-sic is complex and seemingly distinct to humansand is dependent on sociocultural factors, expe-rience, and memory, suggesting an integrativerole for cortical processes in interaction withdopamine-reinforcement circuits. Dopamine isinvolved in incentive salience and reward pre-diction, leading to expectation and anticipation
1Montreal Neurological Institute, McGill University, Montreal,Quebec H3A2B4, Canada. 2The Rotman Research Institute,Toronto, Ontario M6A2E1, Canada. 3BRAMS InternationalLaboratory for Brain, Music and Sound Research, Mon-treal, Quebec, Canada. 4Utrecht University, 3508 TC Utrecht,Netherlands.
*Corresponding author. E-mail: [email protected]
12 APRIL 2013 VOL 340 SCIENCE www.sciencemag.org216
REPORTS
on
Apr
il 12
, 201
3w
ww
.sci
ence
mag
.org
Dow
nloa
ded
from

www.sciencemag.org/cgi/content/full/340/6129/211/DC1
Supplementary Materials for
Injectable, Cellular-Scale Optoelectronics with Applications for Wireless Optogenetics
Tae-il Kim, Jordan G. McCall, Yei Hwan Jung, Xian Huang, Edward R. Siuda, Yuhang Li, Jizhou Song, Young Min Song, Hsuan An Pao, Rak-Hwan Kim, Chaofeng Lu, Sung Dan Lee, Il-Sun Song, Gunchul Shin, Ream Al-Hasani, Stanley Kim, Meng Peun Tan,
Yonggang Huang, Fiorenzo G. Omenetto, John A. Rogers,* Michael R. Bruchas*
*Corresponding author. E-mail: [email protected] (M.R.B.); [email protected] (J.A.R.)
Published 12 April 2013, Science 340, 211 (2013) DOI: 10.1126/science.1232437
This PDF file includes
Materials and Methods Figs. S1 to S24 Table S1 Full References
Other Supplementary Material for this manuscript includes the following: (available at www.sciencemag.org/cgi/content/full/340/6129/211/DC1)
Movie S1

1
Materials and Methods Preparation of μ-ILEDs
The fabrication began with epitaxially grown GaN on a sapphire wafer (500 μm thick double polished sapphire with 2” diameter, Cermet Inc.). The GaN stack layers consisted of undoped GaN (3.8 μm), n-type GaN (2 μm), spacer (0.4 μm), MQW (0.14 μm), and p-type GaN (0.2 μm). Residual metal ions and GaN oxide on the surface were removed by rinsing with diluted HCl (33 %). L-shaped current spreading layers of Ni (15 nm) and Au (15 nm) were formed by sputter deposition (AJA ATC 2000), followed by annealing at 500 oC for 5 min in an oxygen and nitrogen atmosphere to form an ohmic contact. After exposing n-type regions defined using photolithography (40 x 40 μm2 recessive square with thick AZ 2035, Microchem Inc) and etched using chorine based-inductively coupled plasma reactive ion etching (ICP RIE, Plasmatherm, SLR-770), both n- and p- contact pads, each 25 x25 μm2 in dimension, of 15 nm of Cr and 300 nm of Au were deposited by electron beam evaporation (Temescal, FC-1800). To define the lateral dimensions of the devices (100x100 μm2), chorine based ICP RIE was used to remove GaN down to the sapphire substrate, with negative tone photoresist as an etching mask (AZ 2070, Micorchem Inc).
After deposition of a passivation layer of SiNx (200 nm) by plasma enhanced chemical vapor deposition (PECVD; STS, Mesc Multiple) the processed substrate was bonded to a silicon wafer using a layer of palladium (Pd)-indium (In) chemical alloy, followed by laser lift off (KrF, intensity,~0.9 J/cm2) to remove the sapphire from the μ-ILEDs. Here, the laser light triggered thermal decomposition at the GaN-sapphire interface, allowing easy mechanical removal of sapphire substrate upon heating to 70 oC on a hotplate. Wet etching with 5 wt% diluted HCl selectively removed the underlying unalloyed In layer, leaving residual porous structures of In-Pd alloy that served as anchors to tether the μ-ILEDs to the silicon wafer. In this configuration, the devices were easily lifted onto the surfaces of microstructured (3 μm in diameter, 1.2 μm in height, and 5 μm in space) slabs of poly(dimethylsiloxane) (PDMS; Sylgard 184, Dow Corning) via the action of van der Waals forces. Etching the exposed unalloyed Pd and passivation layer (SiNx) removed all of residual metal on the μ-ILEDs. The result was an array of μ-ILEDs on microstructured PDMS, suitable for manipulation by transfer printing, for integration onto microneedles.
Fabrication of releasable, injection microneedles
To fabricate penetrating polymeric microneedles, suitable shapes were first defined in layers of Cr (15 nm) and Au (300 nm) deposited on a glass slide (5 x 3.5 cm2) by photolithography and wet etching. Photo-curable epoxy (SU-8 100, Microchem Inc) was then spin cast (1100 rpm for 250 μm and 1800 rpm for 150 μm thickness) on the slide, and ultraviolet light was passed (380 mJ/cm2) through the backside to define a pattern of exposure in the epoxy, with the geometry of the microneedle. Developing away the unexposed regions followed by thermal annealing (150 oC for 10 min) defined and fully cured the epoxy to complete the fabrication of microneedles, typically in array geometries. Poor adhesion between the glass and the epoxy allowed easy mechanical removal of the microneedles, with tweezers, stamps or other implements. The left image of Fig S5 shows an array of epoxy microneedles on glass. The left and right three microneedles were removed before this image was collected.
To fabricate 6 μm thick (or 2.5 μm thick for μ-ILED) polyester device substrates (Mylar® film, Chemplex® industries) with similar microneedle layouts, the films were first laminated on a
2
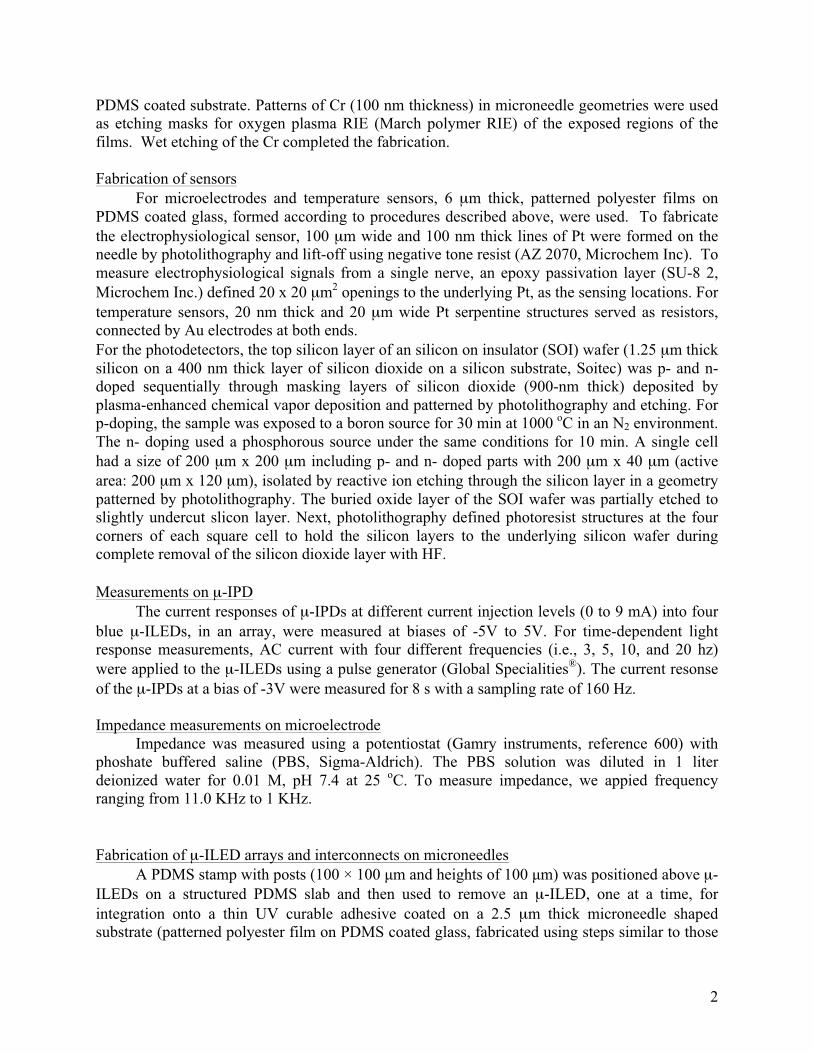
PDMS coated substrate. Patterns of Cr (100 nm thickness) in microneedle geometries were used as etching masks for oxygen plasma RIE (March polymer RIE) of the exposed regions of the films. Wet etching of the Cr completed the fabrication. Fabrication of sensors
For microelectrodes and temperature sensors, 6 μm thick, patterned polyester films on PDMS coated glass, formed according to procedures described above, were used. To fabricate the electrophysiological sensor, 100 μm wide and 100 nm thick lines of Pt were formed on the needle by photolithography and lift-off using negative tone resist (AZ 2070, Microchem Inc). To measure electrophysiological signals from a single nerve, an epoxy passivation layer (SU-8 2, Microchem Inc.) defined 20 x 20 μm2 openings to the underlying Pt, as the sensing locations. For temperature sensors, 20 nm thick and 20 μm wide Pt serpentine structures served as resistors, connected by Au electrodes at both ends. For the photodetectors, the top silicon layer of an silicon on insulator (SOI) wafer (1.25 μm thick silicon on a 400 nm thick layer of silicon dioxide on a silicon substrate, Soitec) was p- and n- doped sequentially through masking layers of silicon dioxide (900-nm thick) deposited by plasma-enhanced chemical vapor deposition and patterned by photolithography and etching. For p-doping, the sample was exposed to a boron source for 30 min at 1000 oC in an N2 environment. The n- doping used a phosphorous source under the same conditions for 10 min. A single cell had a size of 200 μm x 200 μm including p- and n- doped parts with 200 μm x 40 μm (active area: 200 μm x 120 μm), isolated by reactive ion etching through the silicon layer in a geometry patterned by photolithography. The buried oxide layer of the SOI wafer was partially etched to slightly undercut slicon layer. Next, photolithography defined photoresist structures at the four corners of each square cell to hold the silicon layers to the underlying silicon wafer during complete removal of the silicon dioxide layer with HF.
Measurements on μ-IPD
The current responses of μ-IPDs at different current injection levels (0 to 9 mA) into four blue μ-ILEDs, in an array, were measured at biases of -5V to 5V. For time-dependent light response measurements, AC current with four different frequencies (i.e., 3, 5, 10, and 20 hz) were applied to the μ-ILEDs using a pulse generator (Global Specialities®). The current resonse of the μ-IPDs at a bias of -3V were measured for 8 s with a sampling rate of 160 Hz.
Impedance measurements on microelectrode
Impedance was measured using a potentiostat (Gamry instruments, reference 600) with phoshate buffered saline (PBS, Sigma-Aldrich). The PBS solution was diluted in 1 liter deionized water for 0.01 M, pH 7.4 at 25 oC. To measure impedance, we appied frequency ranging from 11.0 KHz to 1 KHz.
Fabrication of μ-ILED arrays and interconnects on microneedles
A PDMS stamp with posts (100 × 100 μm and heights of 100 μm) was positioned above μ-ILEDs on a structured PDMS slab and then used to remove an μ-ILED, one at a time, for integration onto a thin UV curable adhesive coated on a 2.5 μm thick microneedle shaped substrate (patterned polyester film on PDMS coated glass, fabricated using steps similar to those

3
described above for the sensors). The printing was performed using a modified mask aligner (Karl Suss, MJB). To form interconnected arrays of μ-ILEDs, the SiNx passivation layer was first removed by reactive ion etching (RIE; Plasmatherm 790). Coating with an adhesion promoter (Dow, AP3000) and then a layer of photosensitive benzocyclobutene (6 μm thick; BCB) prepared the devices for backside exposure to ultraviolet light, through the transparent substrate. This light exposed the BCB in all regions except those above the opaque n-, and p- contact pads. Developing away the unexposed BCB (Advanced Developer, DS2100) and blowing with a stream of N2 removed the residual developer, to complete the patterning process for via holes. After fully curing the BCB in an Ar atomosphere in a glove box at 210 oC for 3 hr, remaining BCB residues on the contacts were removed by oxygen RIE. To form metallization lines to the contacts, 15 nm of Cr and 300 nm of Au were sputter deposited, and then wet etched through a photopatterned layer of photoresist. Finally, an epoxy layer (2 μm thick, SU-8 2 Microchem) was spin cast and cured to form insulating coatings on the electrodes. Forming multi-functional μ-ILED systems on releasable injection microneedles
Separately fabricated thermal and electrophysiological sensors and printed μ-ILEDs, each on polyester thin film substrates, were stacked in an aligned configuration on a penetrating epoxy microneedle substrate using a modified mask aligner (Karl Suss, MJB). A thin layer of UV curable epoxy (SU-8 2) served as an adhesive for bonding the sensors and the μ-ILEDs. For bonding the entire stack to the penetrating microneedle, a thin layer of purified silk (7 wt%) was used, to allow release of after implantation. After curing or drying, the adhesives in all cases have thicknesses of a few hundred nanometers. Characterization of optical and thermal properties
Optical measurements of the emission spectra and light output were obtained with a spectrometer (HR4000 and FOIS-1 fiber optics integrating sphere, Ocean Optics). Thermal measurements were performed using a MWIR-based InDb thermal imager (InfraScope, GFI) with a base temperature of 37oC. Wired powering
μ-ILED devices were connected to a function generator (AMPI, Master-9 or Tektronix, AFG3022B) and TTL modulation (low 0V, high 4V) was used to power the µ-ILEDs at the stated frequencies and pulse widths. Wireless powering and RF powering scavenger
The wireless power transmitter includes a low-frequency signal generator, an RF signal generator, a power supply, a RF power amplifier, and a panel antenna. The low-frequency signal generator outputs an amplitude modulation signal to modulate the RF power generator. The RF power amplifier that is powered by the power supply enlarges the modulated RF signal from the RF signal generator. The RF power is then transmitted from the panel antenna on 75 μm thick polyimide layer or commercialized PCB board.. The RF signal generator has a power output from -10 to -17 dBm at 910 MHz, which corresponds to a power ranging from 0.1 mW to 0.02 mW. The power amplifier has a gain of 49 dB, thus the power output from the power amplifier is from 1.6 to 7.9 W. Under an antenna gain of 13 dBi and at a distance that is approximately 1 meter away from the antenna, the RF power that reaches the mice is approximately 4 mW, given

4
an exposure area of the mice of ~32 cm2. Mice with chronically implanted μ-ILED devices were acutely connected to the headstage antenna immediately prior to any wireless photostimulation. Numerical modeling of temperature in the μ-ILEDs
A three dimensional (3D) model was established to study the temperature distributions in the system in the pulsed mode and DC mode. Eight-node, hexahedral brick elements in the finite element software ABAQUS were used to discretize the geometry. The μ-ILEDs are modeled as heat sources. The bottom surface of device was set as a constant temperature, while the other surfaces are free heat convection boundary with the convection heat transfer coefficient 25 W/(m2·K). The initial temperature of the device was set as the environmental temperature
. The dimensions and layout of the device can be found in the main text. The microelectrodes and the sensors were neglected in the finite element simulations due to their small thickness (~300 nm) compared to that of other layer (~6 μm). The thermal conductivity, density and thermal capacity are 317 W/(m·K), 19300 kg/m3 and 130 J/(kg·K) (35) for Au, 0.2 W/(m·K), 1190 kg/m3 and 1200 J/(kg·K) for epoxy (36), 0.15 W/(m·K), 1050 kg/m3 and 1270 J/(kg·K) for polyester (37, 38), 230 W/(m·K), 2330 kg/m3 and 700 J/(kg·K) for μ-ILEDs (17, 39), and 0.29 W/(m·K), 1050 kg/m3 and 2180 J/(kg·K) for BCB (40).
Figure S16 (A) shows the time-average temperature of μ-ILEDs operated in pulsed modes (3, 10, and 20 Hz) and DC mode at 5, 10, 15 and 20 mW input power when the background temperature is = 37 oC. The finite element results (line) agree well with the experimental measurements (dot). Figure S16 (B) and (C) show the surface temperature distribution from experiments and finite element simulations. They agree reasonably well with each other and the discrepancy is due to the assumption of heat source only for μ-ILEDs since other parts (e.g., Au interconnect) may also serve as heat sources.
Analytical modeling of temperature in the tissue
An analytical model was established to obtain the steady temperature in the tissue when the device is inserted into the mouse brain tissue. The μ-ILED is modeled as a disk heat source with a radius r0= corresponding to the same area of μ-ILED (L×L) and a heat generation of Q(t). Since the thickness of tissue (~4 mm) is much larger than that of device (~100 μm), we ignore the device structure in the analytical modeling. Once we have the temperature due to a single μ-ILED, the temperature due to four μ-ILEDs can be obtained by the superposition theorem.
The heat transfer equation in cylindrical coordinate with the origin as the center of μ-ILED is
(1)
where k is thermal conductivity of tissue, is density of tissue, c is specific heat capacity of tissue. The thermal diffusivity of tissue is . By setting , where is the remote temperature, the above equation becomes
(2)
T∞
T∞
L π
2 2
2 2
1 0T T T c Tr r r z k t
ρ∂ ∂ ∂ ∂+ + − =
∂ ∂ ∂ ∂ρ
/ ( )k cα ρ= T Tθ ∞= − T∞
2 2
2 2
1r r r z tθ θ θ θ
α∂ ∂ ∂ ∂
+ + =∂ ∂ ∂ ∂

5
Boundary conditions involve the adiabatic condition on the top surface (z=-h0) and a constant temperature = 37 oC on the bottom surface (z=h1). At the μ-ILED interface (z=0), discontinuous heat flow Q(t) is assumed as a means to introduce the input pulsed power. Let’s consider a unit pulsed power P(t) for time between 0 an t0 with a period T, which can be expanded into Fourier Series
(3)
where . For each cos(nwt) [or sin(nwt)] in the power expression of Eq. (3), we can assume the solution of Eq. (2) to be . Equation (2) then becomes
(4)
where . Equation (4) can be solved by applying the Hankel transformation. For
, we obtain the solution as
, (5)
where .
The temperature increase due to the power of cos(nwt) [or sin(nwt)] is then equal to
[or ] where . The temperature due to the power P(t) in Eq. (3) is given by
(6)
The temperature due to the four μ-ILEDs with total power Q(t)=Q0*P(t)/4 can then be given by
(7)
In vitro experiments, the thermal conductivity k of the issue is 0.6 W/(m·K), the density is 1040 Kg/m3, the specific heat c is 3650 J/(kg·K)(21). The predicted surface temperature (z=-h0) agrees well with experimental measurement as shown in Fig. S17, and Fig. 2(D) and (E). In vivo experiments, there is a heat loss due to blood flow and we fit an effective power to be 0.62 mW at 3Hz. Then the predicted the time-averaged temperature at the location of temperature sensor (z=-6 μm) agrees very well with that in experiments at other frequencies with ~5% error. To further verify the analytical solution in Eq. (7), a full 3D finite element model for the device/tissue system is also established. The time history of average temperature in Fig. 2(F) shows a good agreement between finite element simulation and experimental measurement. Preparation of phantom skin and IR measurement of RF scavenger The potential localized heating effect of RF power is characterized using a phantom skin sample that is placed in the RF field. The phantom skin (41, 42 ) is a gelatin-based material that is made of the combination of water, agar, polyethylene, sodium chloride, sodium azide (Sigma-Aldrich
T∞
00
1 10
1 0( ) cos sin
0 n nn n
t tP t a a n t b n t
t t Tω ω
∞ ∞
= =
< ≤⎧= = + +⎨
< ≤⎩∑ ∑
( ) ( )0 0 0 02 / , / , 2sin / ( ), 2[1 cos( )] /n nT a t T a n t n T b n t n Tω π ω ω ω ω= = = = −
( , , ) ( , )exp( )r z t r z n tiθ ψ ω=2 2
22 2
1 0qr r r zψ ψ ψ
ψ∂ ∂ ∂
+ + − =∂ ∂ ∂
2 n iq ωα
=
0 0h z− ≤ ≤
( )2 2 2 2 2 20 0 00
( , ; ) exp( ) exp( 2 )r z n A z s q z s q h s q J sr sdsψ ω+∞ ⎡ ⎤= + + − + − +
⎣ ⎦∫( ) 2 2
0 1 0 10 2 2 2 2 2 2
0 1
1 exp( 2 )
2 1 exp( 2 2 )s
r J sr h s qA
k s s q h s q h s q− − +
=+ + − + − +
( )( , ; ) cos nr z n n tψ ω ω β+ ( )( , ; ) sin nr z n n tψ ω ω β+ tan( ) Im( ) / Re( )nβ ψ ψ=
( ) ( )01 1
( , , ) ( , ;0) ( , ; ) cos ( , ; ) sinn n n nn n
r z t a r z a r z n n t b r z n n tψ ψ ψ ω ω β ψ ω ω β∞ ∞
= =
= + + + +∑ ∑
40
1( , , ) ( , , )
4tot ii
Qr z t r z tψ ψ=
= ∑ρ
6
Co.), and TX 151 (Oil Center Research), and has similar electrical properties as animal skin at the RF range. The thermal imaging is taken using an infrared camera (A655sc, FLIR Systems, Inc.), which has high resolution and a measurement accuracy at ±2% of the reading value. Experimental subjects
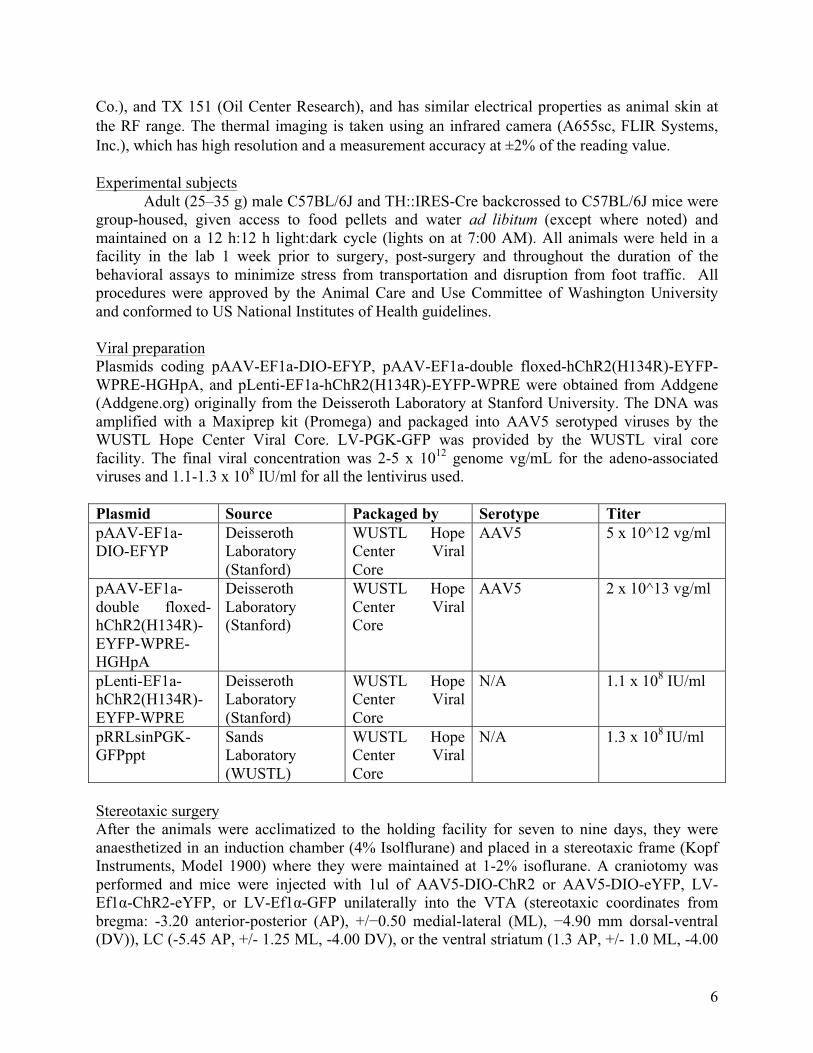
Adult (25–35 g) male C57BL/6J and TH::IRES-Cre backcrossed to C57BL/6J mice were group-housed, given access to food pellets and water ad libitum (except where noted) and maintained on a 12 h:12 h light:dark cycle (lights on at 7:00 AM). All animals were held in a facility in the lab 1 week prior to surgery, post-surgery and throughout the duration of the behavioral assays to minimize stress from transportation and disruption from foot traffic. All procedures were approved by the Animal Care and Use Committee of Washington University and conformed to US National Institutes of Health guidelines. Viral preparation Plasmids coding pAAV-EF1a-DIO-EFYP, pAAV-EF1a-double floxed-hChR2(H134R)-EYFP-WPRE-HGHpA, and pLenti-EF1a-hChR2(H134R)-EYFP-WPRE were obtained from Addgene (Addgene.org) originally from the Deisseroth Laboratory at Stanford University. The DNA was amplified with a Maxiprep kit (Promega) and packaged into AAV5 serotyped viruses by the WUSTL Hope Center Viral Core. LV-PGK-GFP was provided by the WUSTL viral core facility. The final viral concentration was 2-5 x 10¹² genome vg/mL for the adeno-associated viruses and 1.1-1.3 x 10⁸ IU/ml for all the lentivirus used. Plasmid Source Packaged by Serotype Titer pAAV-EF1a-DIO-EFYP
Deisseroth Laboratory (Stanford)
WUSTL Hope Center Viral Core
AAV5 5 x 10^12 vg/ml
pAAV-EF1a-double floxed-hChR2(H134R)-EYFP-WPRE-HGHpA
Deisseroth Laboratory (Stanford)
WUSTL Hope Center Viral Core
AAV5 2 x 10^13 vg/ml
pLenti-EF1a-hChR2(H134R)-EYFP-WPRE
Deisseroth Laboratory (Stanford)
WUSTL Hope Center Viral Core
N/A 1.1 x 10⁸ IU/ml
pRRLsinPGK-GFPppt
Sands Laboratory (WUSTL)
WUSTL Hope Center Viral Core
N/A 1.3 x 10⁸ IU/ml
Stereotaxic surgery After the animals were acclimatized to the holding facility for seven to nine days, they were anaesthetized in an induction chamber (4% Isolflurane) and placed in a stereotaxic frame (Kopf Instruments, Model 1900) where they were maintained at 1-2% isoflurane. A craniotomy was performed and mice were injected with 1ul of AAV5-DIO-ChR2 or AAV5-DIO-eYFP, LV-Ef1α-ChR2-eYFP, or LV-Ef1α-GFP unilaterally into the VTA (stereotaxic coordinates from bregma: -3.20 anterior-posterior (AP), +/−0.50 medial-lateral (ML), −4.90 mm dorsal-ventral (DV)), LC (-5.45 AP, +/- 1.25 ML, -4.00 DV), or the ventral striatum (1.3 AP, +/- 1.0 ML, -4.00

7
DV). Mice were then implanted with metal cannula (PlasticsOne; coordinates adjusted from viral injection 0.00 AP, +/- 0.25 ML, +1.00 DV), fiber optic implants (coordinates adjusted from viral injection 0.00 AP, +/- 0.25 ML, +1.00 DV)(43), or a µ-ILED device (same coordinates as viral injection). Custom adapters (WUSTL Instrument Machine Shop) for the Kopf cannula holder (Model 1966) were used to implant the fiber optics and the µ-ILED devices. For biodissolvable samples, the device was implanted at the desired target, ACSF was applied to the portion of the device that remained outside of the skull to facilitate dissolution of the adhesive, and then the epoxy needle was removed after a delay of 15 minutes. The implants were secured using two bone screws (CMA, 743102) and affixed with TitanBond (Horizon Dental Products) and dental cement (Lang Dental). Mice were allowed to recover for 3-5 weeks prior to behavioral testing; this interval also permitted optimal AAV expression and Cre recombinase activity. Immunohistochemistry Immunohistochemistry was performed as described (44) Briefly, mice were anesthetized with pentobarbital and intracardially perfused with ice-cold 4% paraformaldehyde in phosphate buffer (PB). Brains were dissected, post-fixed for 24 hr at 4 ºC and cryoprotected with solution of 30% sucrose in 0.1M PB at 4ºC for at least 24 hr, cut into 30 µm sections and processed for immunostaining. 30 µm brain sections were washed three times in PBS and blocked in PBS containing 0.5% Triton X-100 and 5 % normal goat serum. Sections were then incubated for ~16 hr at room temperature in rabbit anti c-fos antibody (1:20000, Millipore), guinea pig anti-GFAP (1:500, Synaptic Systems), rabbit anti-Iba1 (1:300, Wako Chemicals) and/or chicken anti-TH (1:2000, Aves Labs). Following incubation, sections were washed three times in PBS and then incubated for 2 hr at room temperature in Alexa Fluor 488 goat anti-mouse IgG (1:500, Invitrogen), Alexa Fluor 594 goat anti-rabbit IgG (1:500, Invitrogen-), goat anti-chicken Alexa Fluor 633(1:500, Invitrogen) and/or goat anti-guinea pig Alexa Fluor 546(1:500, Invitrogen) were then washed three times in PBS and followed by three 10-min rinses in PB and mounted on glass slides with Vectashield (Vector Labs) and sealed with nail polish for microscopy. All sections were imaged on both epifluorescent (Olympus BX61) and confocal (Olympus Fluoview 500) microscopes. Gain and exposure time were constant throughout, and all image groups were processed in parallel using Adobe Photoshop CS5 (Adobe Systems). Antibody Species Dilution Source GFAP Guinea Pig 1:500 Synaptic Systems Iba1 Rabbit 1:300 Wako Chemicals TH Chicken 1:2000 Aves Labs c-fos Rabbit 1:20,000 Millipore Alexa Fluor 488 anti-mouse IgG
Goat 1:500 Invitrogen
Alexa Fluor 594 anti-rabbit IgG
Goat 1:500 Invitrogen
Alexa Fluor 633 anti-chicken IgG
Goat 1:500 Invitrogen
Alexa Fluor 546 anti-guinea pig IgG
Goat 1:500 Invitrogen
Alexa Fluor 594 anti-chicken IgG
Goat 1:500 Invitrogen

8
Cell culture and transfection of NOPR-YFP expressing, HEK293 Cells A single 50 x 50 x 6.45 µm µ-ILED was printed onto a standard glass coverslip (Fisherbrand, 12-545-80). The glass was coated with Poly-L-lysine (Sigma-Aldrich, P4707) to facilitate cell adhesion. Stable HEK293 cells expressing pcDNA3 containing nociceptin opioid peptide receptor-YFP (NOPR-YFP) were generated as previously described (45). The NOPR-YFP expressing cells were grown on the coverslip in a 24-well plate and placed in a 37 °C 5% CO2 incubator. Cells were washed three times with PBS and then fixed in 4% paraformaldehyde for 20 min, washed in PBS, washed in 0.1 M PB, and mounted using VECTASHIELD (Vector Laboratories) and sealed with clear nail polish. Images were captured using Metamorph 7.6 (Molecular Devices) and processed with ImageJ 1.44o (NIH). cAMP Assay HEK293 cells were co-transfected with Optoβ2 (20 and pGloSensor-22F cAMP plasmid (Promega E2301) in 96-well format. Using a SynergyMx microplate reader (BioTek; VT, USA), baseline luminescence recordings were taken. In the presence of 9-cis retinal (1µM), cells were exposed to µ-ILED light (450 nm, 5 sec, 0.5 W/cm2 pulse) and relative luminescent units taken every 2 sec using GloSensor cAMP Assay (Promega). Relative luminescent units were normalized to an initial 1 min recording of baseline. Data are expressed as ± S.E.M. Immunoblotting Western blots for phospho-MAPKs were performed as described previously (45. Briefly, Optoβ2 expressing HEK293 cells were serum-starved 4-6 h prior to treatment. Cells were light treated (450 nm, 1 min, 0.5 W/cm2 pulse), lysed in 70 μl of lysis buffer (50 mM Tris-HCl, 300 mM NaCl, 1 mM EDTA, 1 mM Na3VO4, 1 mM NaF, 10% glycerol, 1% Nonidet P-40, 1:100 of phosphatase inhibitor mixture set 1 (Calbiochem), and 1:100 of protease inhibitor mixture set 1 (Calbiochem)), sonicated for 20 s, centrifuged for 15 min (14000 x g, 4 °C). 50 μg of total protein was loaded onto non-denaturing 10% bisacrylamide precast gels (Invitrogen) and run at 150 V for 1.5 h. Blots were transferred to nitrocellulose (Whatman, Middlesex, UK) for 1.5 h at 30 mV, blocked in TBS/5% bovine serum albumin for 1 hr, incubated overnight at 4 °C with a 1:1000 dilution of goat-anti- rabbit phospho-ERK 1/2 (Thr-202/Tyr-204) antibody (Cell Signaling) and mouse actin (1:20,000, AbCam). Following overnight incubation, membranes were washed 4 x 15 min in TBST (Tris- buffered saline, 1% Tween 20) and then incubated with IRDye 800- and 700 conjugated affinity-purified anti-rabbit or anti-mouse IgG at a dilution of 1:5000 (pERK) or 1:20,000 (actin) in a 1:1 mixture of 5% milk/TBS and Li-Cor blocking buffer (Li-Cor Biosciences, Lincoln, NE) for 1 h at room temperature, washed 3 x 10 min in TBST, 1 x 10 min in TBS and analyzed using the Odyssey infrared imaging system (Li-Cor Biosciences). Band intensity was measured using Odyssey software following background subtraction and integrated band density in high-resolution pixels calculated. All subtypes of ERK (1 and 2) were quantified together. All pERK bands were normalized to actin, as an equal protein loading control and plotted using GraphPad (GraphPad Prism 5.0) software. Statistical significance was taken as * p < 0.05 as determined by unpaired two-tailed t-test.
9
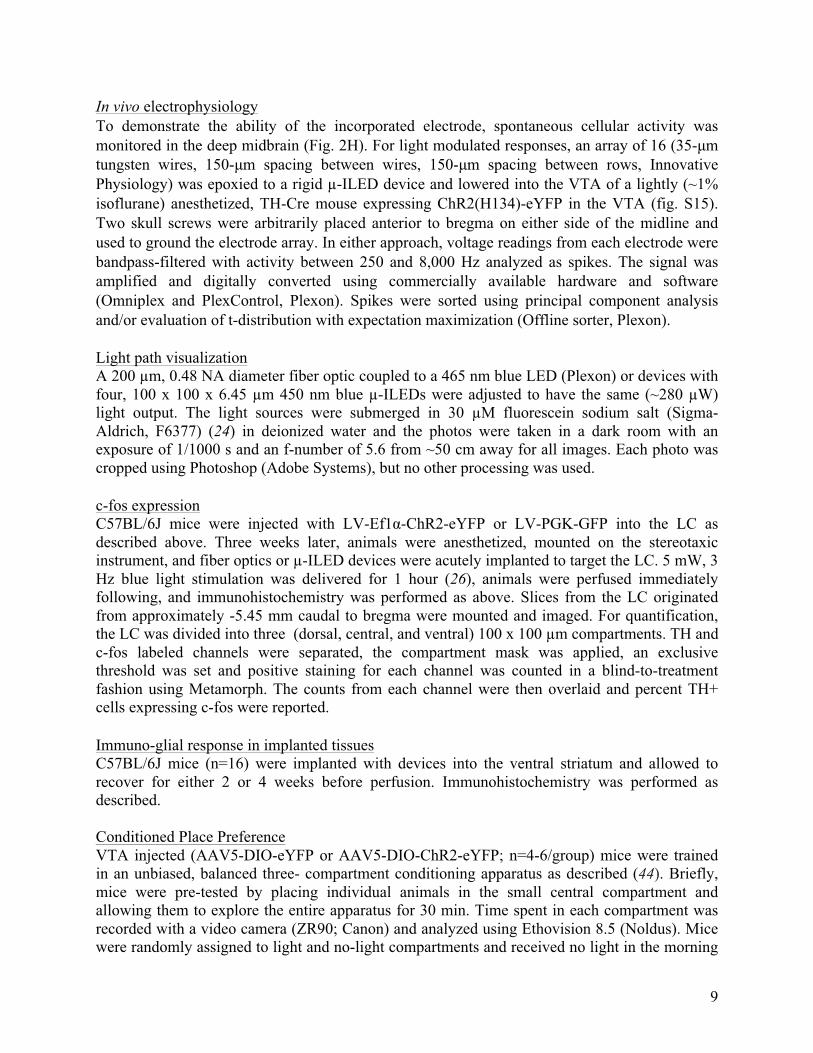
In vivo electrophysiology To demonstrate the ability of the incorporated electrode, spontaneous cellular activity was monitored in the deep midbrain (Fig. 2H). For light modulated responses, an array of 16 (35-μm tungsten wires, 150-μm spacing between wires, 150-μm spacing between rows, Innovative Physiology) was epoxied to a rigid µ-ILED device and lowered into the VTA of a lightly (~1% isoflurane) anesthetized, TH-Cre mouse expressing ChR2(H134)-eYFP in the VTA (fig. S15). Two skull screws were arbitrarily placed anterior to bregma on either side of the midline and used to ground the electrode array. In either approach, voltage readings from each electrode were bandpass-filtered with activity between 250 and 8,000 Hz analyzed as spikes. The signal was amplified and digitally converted using commercially available hardware and software (Omniplex and PlexControl, Plexon). Spikes were sorted using principal component analysis and/or evaluation of t-distribution with expectation maximization (Offline sorter, Plexon). Light path visualization A 200 µm, 0.48 NA diameter fiber optic coupled to a 465 nm blue LED (Plexon) or devices with four, 100 x 100 x 6.45 µm 450 nm blue µ-ILEDs were adjusted to have the same (~280 µW) light output. The light sources were submerged in 30 µM fluorescein sodium salt (Sigma-Aldrich, F6377) (24) in deionized water and the photos were taken in a dark room with an exposure of 1/1000 s and an f-number of 5.6 from ~50 cm away for all images. Each photo was cropped using Photoshop (Adobe Systems), but no other processing was used. c-fos expression C57BL/6J mice were injected with LV-Ef1α-ChR2-eYFP or LV-PGK-GFP into the LC as described above. Three weeks later, animals were anesthetized, mounted on the stereotaxic instrument, and fiber optics or µ-ILED devices were acutely implanted to target the LC. 5 mW, 3 Hz blue light stimulation was delivered for 1 hour (26), animals were perfused immediately following, and immunohistochemistry was performed as above. Slices from the LC originated from approximately -5.45 mm caudal to bregma were mounted and imaged. For quantification, the LC was divided into three (dorsal, central, and ventral) 100 x 100 µm compartments. TH and c-fos labeled channels were separated, the compartment mask was applied, an exclusive threshold was set and positive staining for each channel was counted in a blind-to-treatment fashion using Metamorph. The counts from each channel were then overlaid and percent TH+ cells expressing c-fos were reported. Immuno-glial response in implanted tissues C57BL/6J mice (n=16) were implanted with devices into the ventral striatum and allowed to recover for either 2 or 4 weeks before perfusion. Immunohistochemistry was performed as described. Conditioned Place Preference VTA injected (AAV5-DIO-eYFP or AAV5-DIO-ChR2-eYFP; n=4-6/group) mice were trained in an unbiased, balanced three- compartment conditioning apparatus as described (44). Briefly, mice were pre-tested by placing individual animals in the small central compartment and allowing them to explore the entire apparatus for 30 min. Time spent in each compartment was recorded with a video camera (ZR90; Canon) and analyzed using Ethovision 8.5 (Noldus). Mice were randomly assigned to light and no-light compartments and received no light in the morning

10
and light (20, 5 ms pulses every minute) in the afternoon at least 4 h after the morning training on three consecutive days. CPP was assessed on day 5 by allowing the mice to roam freely in all three compartments and recording the time spent in each. Scores were calculated by subtracting the time spent in the light stimulus-paired compartment post-test minus the pre-test. Real-time Place Preference VTA injected (AAV5-DIO-eYFP or AAV5-DIO-ChR2-eYFP; n=3/group) TH-Cre mice were trained in an unbiased, balanced three-compartment conditioning apparatus as described (44) Mice were trained in the same conditioning apparatus as described above, and the pretesting phase (day 1) was identical. However, on days 2–4, mice were still allowed to freely roam all three compartments. On these conditioning days, entry into one compartment was paired with 20, 5 ms pulses of light that would repeat every minute the animal remained in the light-paired chamber. On day 5, the post-testing was identical as the above. Scores were calculated by subtracting the time spent in the light stimulus-paired compartment each day minus the pre-test. Operantly Conditioned Place Preference VTA injected (AAV5-DIO-eYFP or AAV5-DIO-ChR2-eYFP; n=6-8/group) TH-Cre mice were prepared for nose poke training by mildly restricting daily food to four grams to stabilize body weight and facilitate behavioral responding. Mice were trained in an unbiased, balanced three-compartment Y-Maze. Each arm of the Y-Maze was 50 cm by 10 cm, a 50 cm2 equilateral triangle connected all three arms (for a total area of 1550 cm2), and each arm was outfitted with a unique context (white, horizontal black stripes, or vertical black stripes). At the distal end of each of the striped arms a nose poke device (Med Associates, ENV-313M). On day 1, the headstage antenna was attached and mice were pre-tested by placing individual animals in the intersection of the three arms and allowing them to explore the entire apparatus for 30 min. During the pre-test and post-test sessions, a wall was placed to prohibit access to the nose poke apparatus and the final 15 cm of each arm. On days 2-6, the headstage antenna was attached and mice were allowed access to the entire Y-Maze for 1 hour. During these conditioning sessions a cue light was on to indicate a stimulation could be achieved nose poke and turned off for 500 ms following a poke on either device. A nose poke on the active device triggered an optical stimulation (20 pulses, 20 Hz, 5 ms pulse duration) on a fixed ratio-1 schedule, while a poke on the inactive device resulted in the cue light turning off for 500 ms. Nose pokes were recorded using a Med Associates TTL-I/O Interface connected to the Noldus Ethovision I/O Box. On day 7, the post-testing was conducted in an identical manner as the pre-test. All activity and position data was recorded using Ethovision and analyzed using Microsoft Excel and GraphPad Prism 5.0. Place preference scores were calculated by subtracting the time spent in the active nose poke-paired compartment each day minus the pre-test. Open Field Test OFT testing was performed in a sound attenuated room maintained at 23ºC. Lighting was measured and stabilized at 200 lux, and performed in the afternoon between 13:00–1600 hrs. The open field was a 55 x 55 cm square enclosure and was cleaned with 70% ethanol between testing trials. For testing, VTA injected (AAV5-DIO-eYFP or AAV5-DIO-ChR2-eYFP; n=6-8/group) TH-Cre mice were connected to cables coupled to a function generator and placed in the center of the open field and allowed to roam freely for 15 min. During the entire trial, animals received 20, 5 ms pulses of photostimulation. Movements were video- recorded and analyzed using

11
Ethovision. The center was defined as a square comprised of 50% the total area of the OFT. Time in the center expressed as percentages total time was the primary measure of anxiety-like behaviors. Elevated Zero Maze EZM testing was performed in a sound attenuated room maintained at 23ºC. Lighting was 200 lux, and performed in the afternoon between 13:00–1600 hrs. The EZM (Harvard Apparatus) was made of grey plastic (Dimensions: 200 cm in circumference comprised of four 50 cm sections: two opened, two closed. The maze was elevated 50 cm above the floor and had a path width of 4 cm with a 0.5 cm lip on each open section) and was cleaned with 70% ethanol between trials. For testing, VTA injected (AAV5-DIO-eYFP or AAV5-DIO-ChR2-eYFP; n=6-9/group) TH-Cre mice were connected to the headstage antenna and placed at the threshold of a closed section facing the open section and allowed to roam freely for 9 min. For the first and the final 3 minutes of each trial there was no photostimulation. For minutes 4-6, animals received 5 Hz, 5 ms width stimulation. Movements were video- recorded and analyzed using Ethovision (Noldus). Open section times expressed as percentages total time the primary measures of anxiety-like behaviors. Data Analysis/Statistics Data are expressed as means ± SEM. Data were normally distributed, and differences between groups were determined using independent t-tests or one-way ANOVA, or two-way ANOVAs followed by post hoc Bonferroni comparisons if the main effect was significant at p < 0.05. Statistical analyses were conducted using Prism 5.0 (GraphPad). Genotyping of mouse lines DNA was isolated from tail tissue obtained from weanling mice (21-28 days of age), and PCR screening was performed using the following primers: Cre recombinase (forward: 5’- GCA TTA CCG GTC GAT GCA ACG AGT GAT GAG-3’ and reverse: 5’- GAG TGA ACG AAC CTG GTC GAA ATC AGT GCG-3’) yielding a 400-bp PCR product in Cre positive animals. Fatty acid-binding protein intestinal primers (forward: 5’- TGG ACA GGA CTG GAC CTC TGC TTT CCT AGA-3’ and reverse: 5’- TAG AGC TTT GCC ACA TCA CAG GTC ATT CAG-3’) were used as positive controls and yield a 200-bp PCR product.

12
Figure S1 Schematic illustration of steps for fabrication (A) thin (2.5 or 6.0 μm thick) microneedle-shapedpolymeric template laminated on a PDMS coated substrate, (B) μ-ILEDs integrated by transfer printing, (C) patterned passivation layers and interconnects, and (D) removal of the device fromthe PDMS coated substrate and transfer printing onto a releasable, injection microneedlesubstrate.

13
Figure S2 Schematic illustration of a printed multifunctional μ-ILED system.

14
Figure S3 Photograph of four printed μ-ILEDs next to the tip of a ballpoint pen (right), to set the scale. Each μ-ILED has lateral dimensions of 100 x100 μm2, with two 25x25 μm2 metal pads for contacts and an L-shape current spreader.
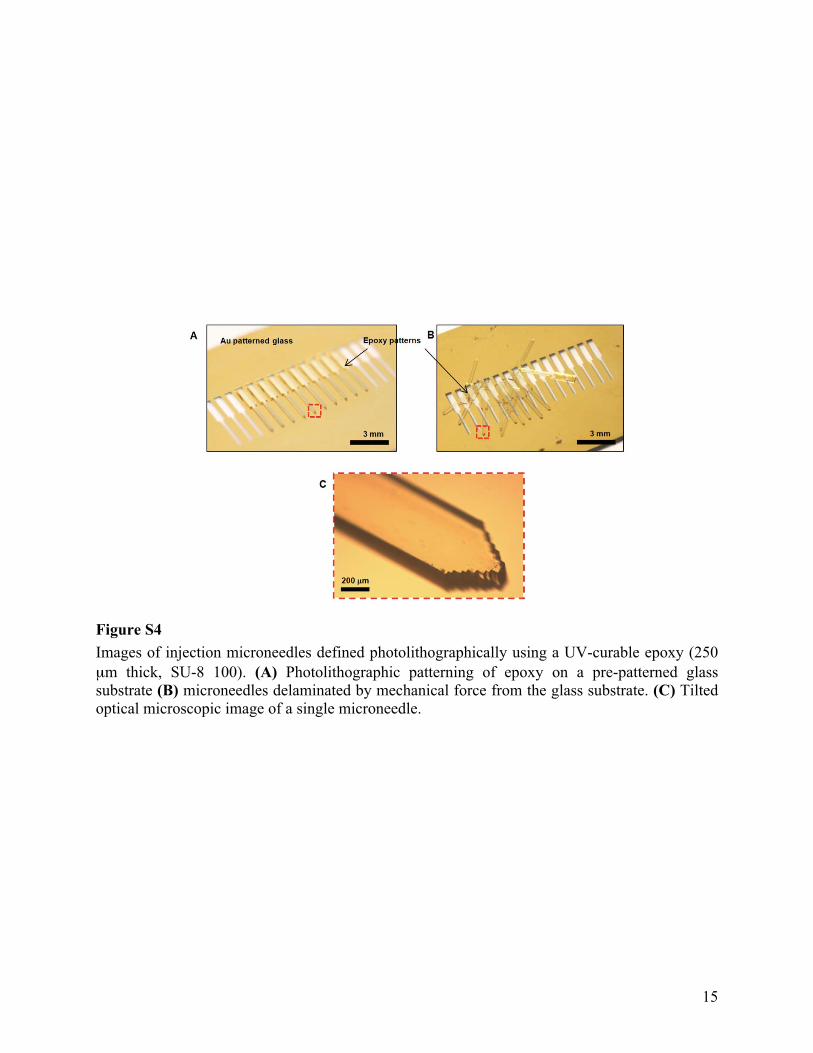
15
Figure S4 Images of injection microneedles defined photolithographically using a UV-curable epoxy (250 μm thick, SU-8 100). (A) Photolithographic patterning of epoxy on a pre-patterned glass substrate (B) microneedles delaminated by mechanical force from the glass substrate. (C) Tilted optical microscopic image of a single microneedle.
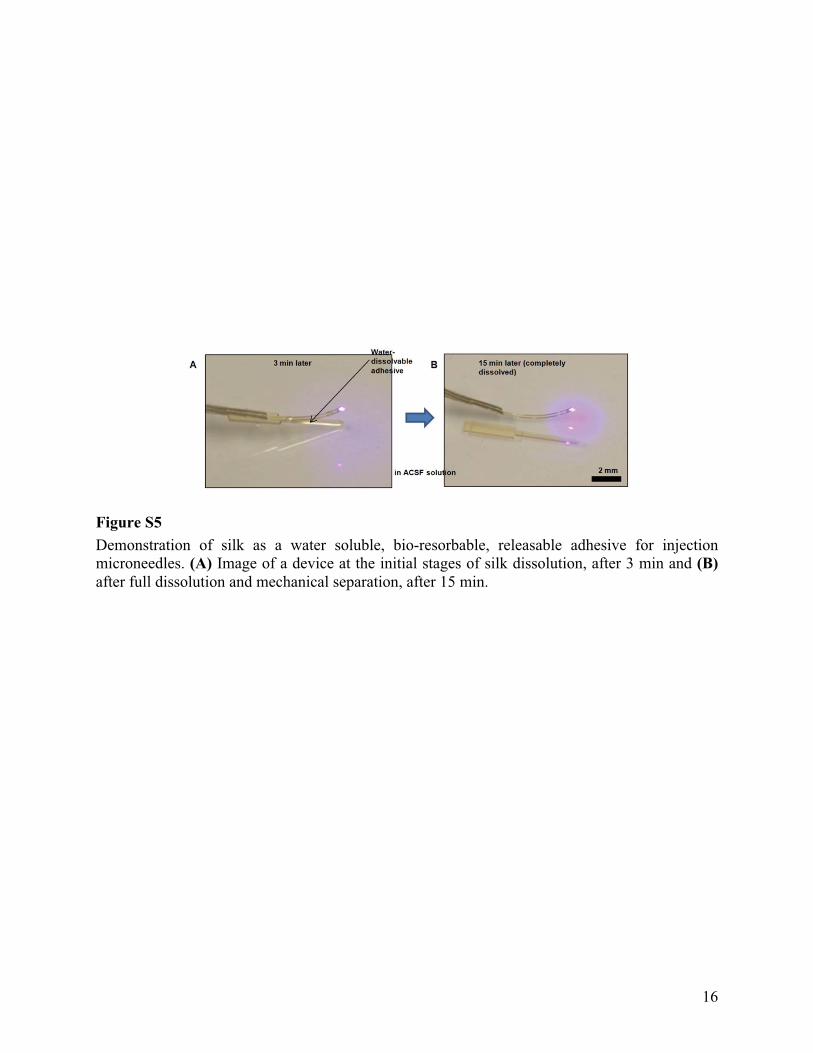
16
Figure S5 Demonstration of silk as a water soluble, bio-resorbable, releasable adhesive for injection microneedles. (A) Image of a device at the initial stages of silk dissolution, after 3 min and (B)after full dissolution and mechanical separation, after 15 min.
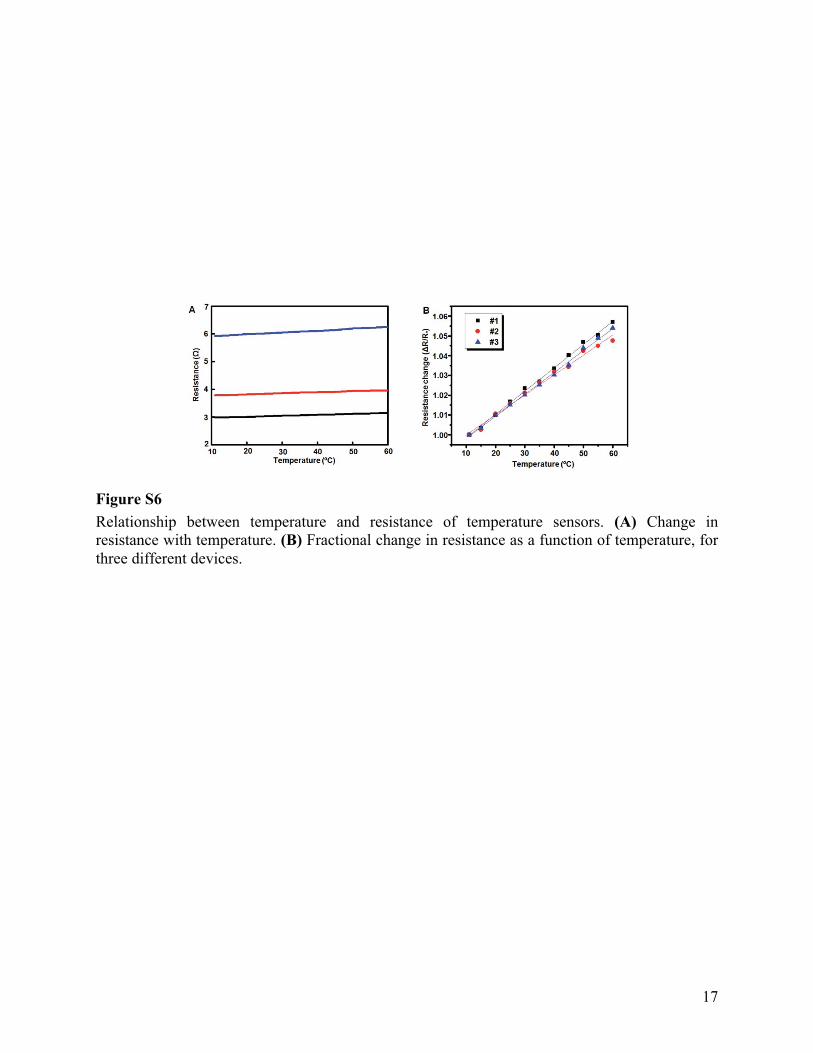
17
Figure S6 Relationship between temperature and resistance of temperature sensors. (A) Change in resistance with temperature. (B) Fractional change in resistance as a function of temperature, for three different devices.

18
Figure S7 Current-voltage (I-V) characteristics of a μ-IPD exposed to different light intensities generated by operation of four μ-ILEDs. Electrical DC input powers into the μ-ILEDs were 0, 6.0, 9.5, 13.5 mW.
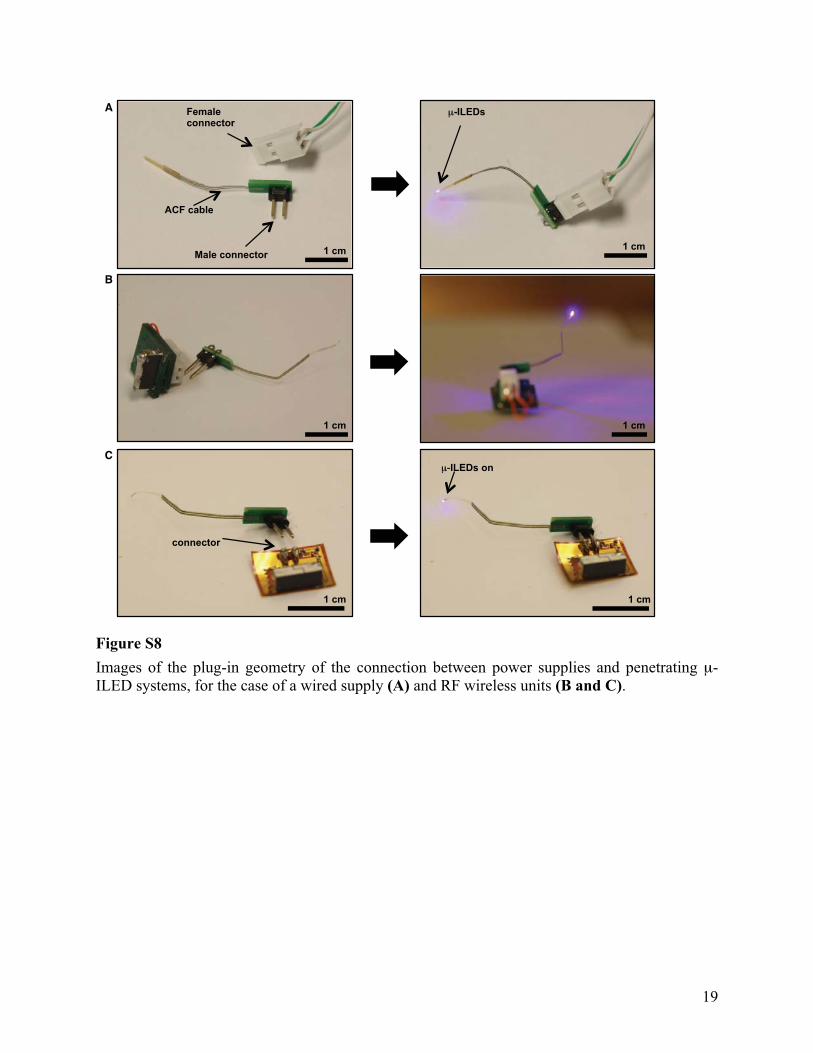
19
Figure S8 Images of the plug-in geometry of the connection between power supplies and penetrating μ-ILED systems, for the case of a wired supply (A) and RF wireless units (B and C).
μ-ILEDs
Male connector
Female connector
1 cm
ACF cable
1 cm
1 cm
A
C
1 cm
μ ILEDs on
connector
1 cm 1 cm
B

20
Figure S9 µ-ILED devices drive a conditioned place preference using standard TTL signals. To demonstrate wired functionality, we selectively targeted ChR2(H134)-eYFP to VTA-DA neurons (Fig. 4A) and tested that phasic activation (20, 5 ms pulses every minute) of cells with aµ-ILED device is sufficient to drive robust place preference behavior without a change in locomotor activity. Animals were conditioned over three days for 30 minutes. µ-ILED devices were powered and controlled using standard function generator (Tektronix, AFG3022B or AMPI, Master-9). (A) Left, Diagram of three-chambered conditioned place preference apparatus. Right, representative heat maps of activity during the post-test, hotter colors represent longer duration at every location in the apparatus. (B) Place preference scores, calculated as post-test minus pre-test on the light stimulation-paired side (n = 4-6/group; *p<0.05 t test compared to AAV5-DIO-eYFP controls). (C) Total activity during the pre- and post-tests shows no difference between the two groups. All bars represent means ± SEM.
Stim
ulat
ion�
No
stim
ulat
ion�
eYFP�ChR2�A
C�B�
0
5000
10000
15000
Dis
tanc
e tra
vele
d (c
m)
Pre Post-400
-200
0
200
400
600
Pre
fere
nce
(s)
*
eYFPChR2

21
Figure S10 Real-time assessment of reward seeking or aversion is possible by pairing an animal’s behavioral response with self-triggered stimulation or inhibition (46-48). Real-time conditioning, animals allowed free access to the apparatus from fig. S18A learn to self-trigger stimulations when 10, 5 ms pulses at 20 Hz light is delivered contingent on entry into the paired chamber. (A) Animals did not express either a real-time or conditioned place preference under this experimental design. (B) AAV5-DIO-ChR2 mice, however, did have increased numbers of passive, entry-triggered self-stimulations. (C) Passive self-stimulation is learned over the course of each trial. (D) Importantly, this difference is not due to a change in activity between the two groups (n = 3/group, **p<0.01 t test compared to AAV5-DIO-eYFP controls). (E) Animals could receive subsequent stimulations if they remained in the stimulus-paired chamber for 60 seconds. ChR2 mice did not learn to remain in the chamber for these subsequent stimulations.
-400
-200
0
200
400
600
800
Pre
fere
nce
(s)
Session
D1 D2 D30
2000
4000
6000
8000
Dis
tanc
e tra
vele
d (c
m)
B C A
E D
eYFP ChR20.0
0.5
1.0
1.5
Sel
f-stim
ulat
ions
per
ent
ry
eYFP ChR20
10
20
30
40
50
Sel
f-trig
gere
d st
imul
atio
ns **
10 20 302
4
6
8
10
12
Time (min)
Sel
f-trig
gere
d st
imul
atio
ns
eYFPChR2
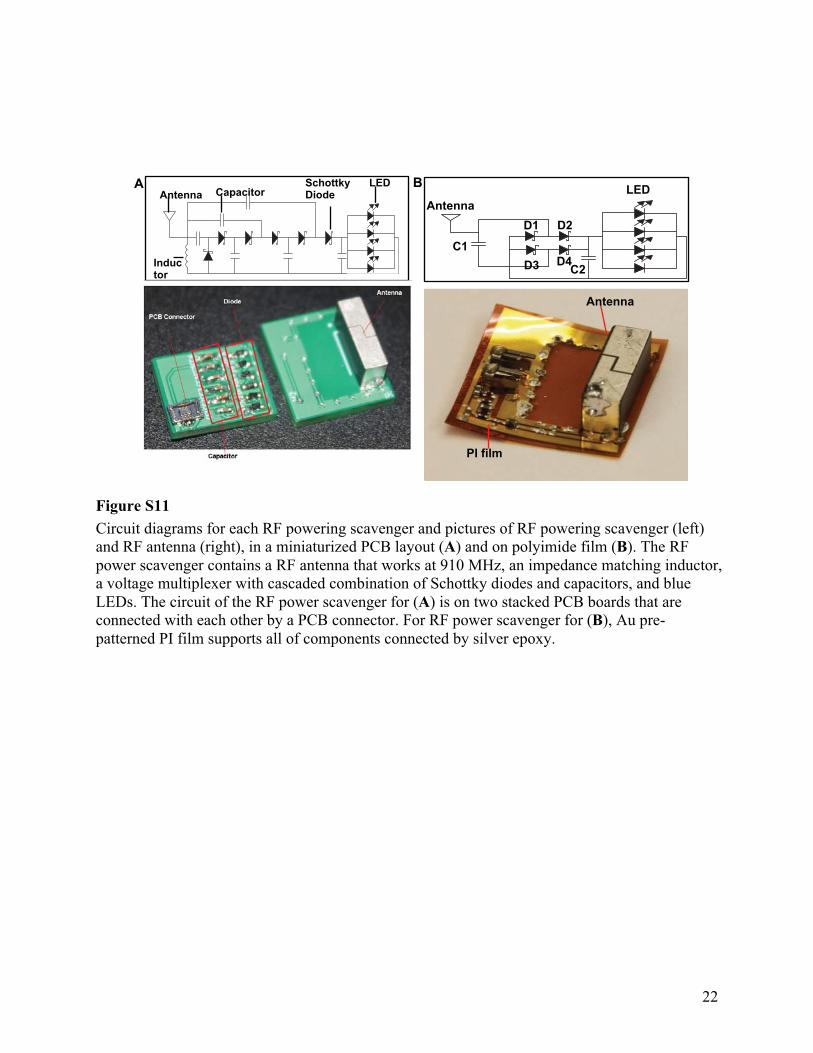
22
Figure S11 Circuit diagrams for each RF powering scavenger and pictures of RF powering scavenger (left) and RF antenna (right), in a miniaturized PCB layout (A) and on polyimide film (B). The RF power scavenger contains a RF antenna that works at 910 MHz, an impedance matching inductor, a voltage multiplexer with cascaded combination of Schottky diodes and capacitors, and blue LEDs. The circuit of the RF power scavenger for (A) is on two stacked PCB boards that are connected with each other by a PCB connector. For RF power scavenger for (B), Au pre-patterned PI film supports all of components connected by silver epoxy.
Antenna
PI film
A B Antenna
C1
C2
D1 D2
D3 D4
LED Antenna
Inductor
Schottky Diode Capacitor
LED
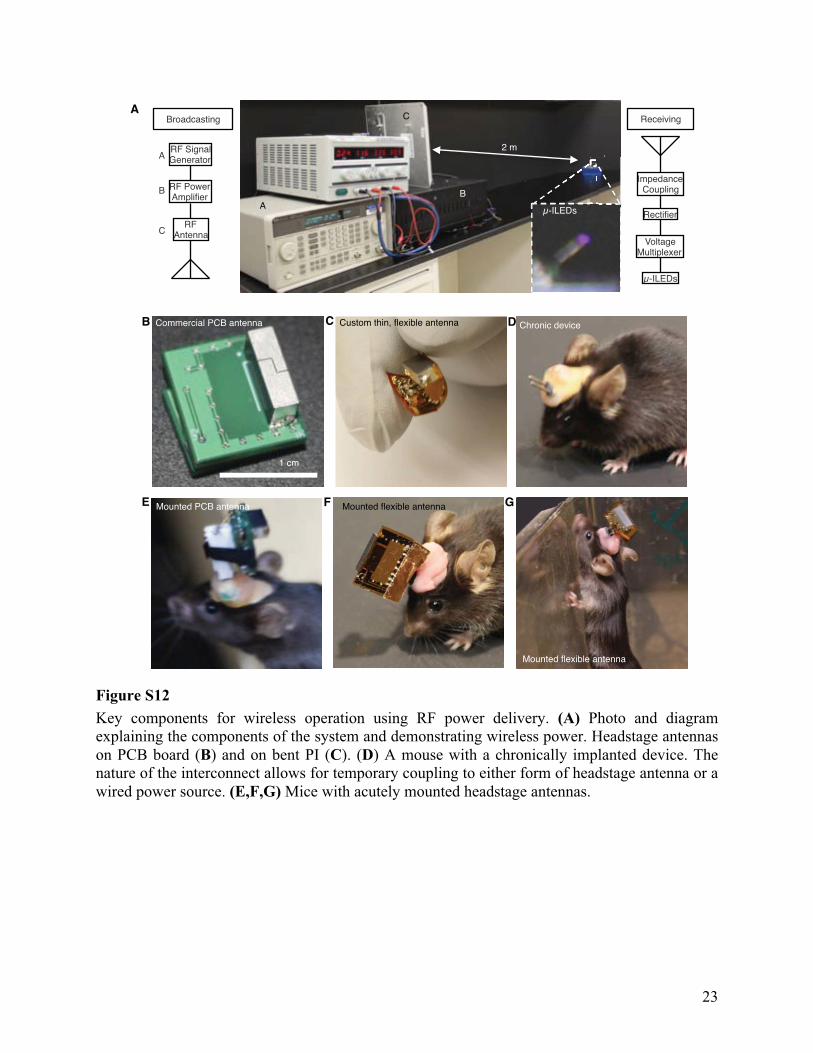
23
Figure S12 Key components for wireless operation using RF power delivery. (A) Photo and diagram explaining the components of the system and demonstrating wireless power. Headstage antennason PCB board (B) and on bent PI (C). (D) A mouse with a chronically implanted device. The nature of the interconnect allows for temporary coupling to either form of headstage antenna or a wired power source. (E,F,G) Mice with acutely mounted headstage antennas.
RF Signal �Generator�
RF Power�Amplifier�
RF �Antenna�
A�
B�
C�
Broadcasting�
Impedance�Coupling�
Rectifier�
Voltage�Multiplexer �
μ-ILEDs�
Receiving�
B�A�
C�
2 m�
μ-ILEDs�
A�
1 cm�
Commercial PCB antenna� Chronic device�
Mounted PCB antenna�
B� C� D�
E� F� G�
Custom thin, flexible antenna�
Mounted flexible antenna�
Mounted flexible antenna�
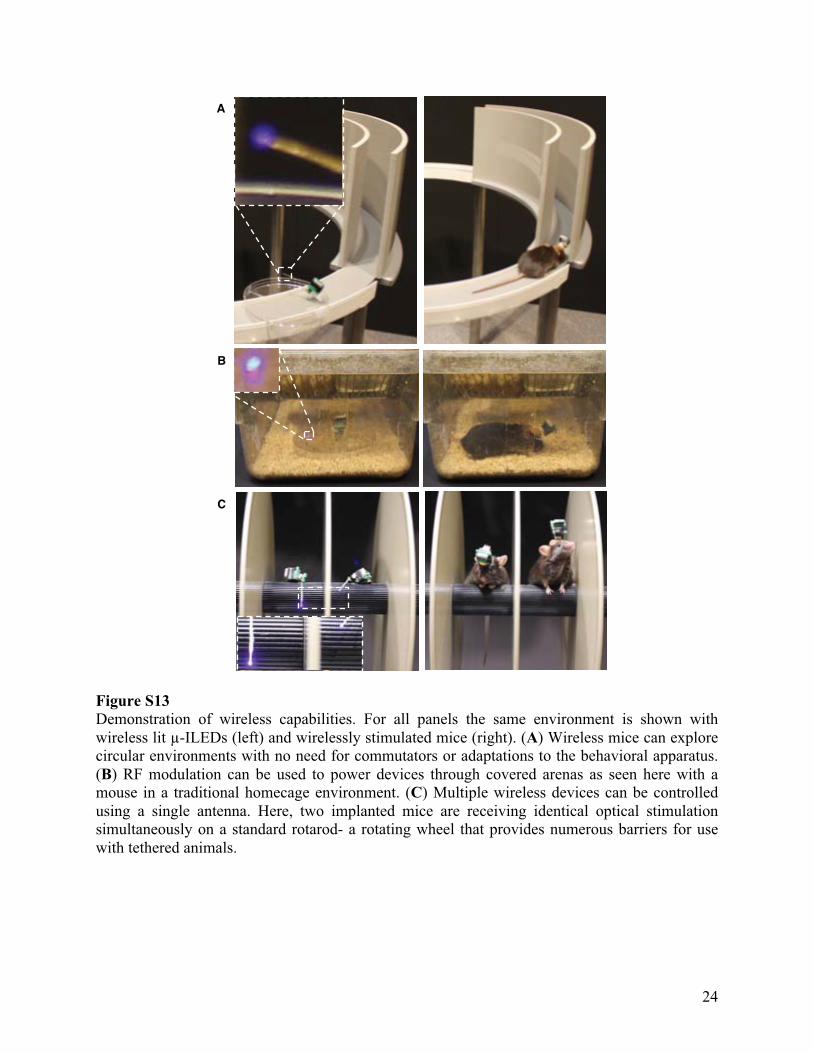
24
Figure S13 Demonstration of wireless capabilities. For all panels the same environment is shown with wireless lit µ-ILEDs (left) and wirelessly stimulated mice (right). (A) Wireless mice can explore circular environments with no need for commutators or adaptations to the behavioral apparatus. (B) RF modulation can be used to power devices through covered arenas as seen here with a mouse in a traditional homecage environment. (C) Multiple wireless devices can be controlled using a single antenna. Here, two implanted mice are receiving identical optical stimulation simultaneously on a standard rotarod- a rotating wheel that provides numerous barriers for use with tethered animals.
B�
A�
C�

25
Figure S14 Electrical and optical properties of an array of four μ-ILEDs connected in parallel. (A) Current-Voltage (I-V) characteristics, (B) light output power and radiant efficiency as a function ofelectrical input power, and (C) light emission intensity as a function of wavelength.
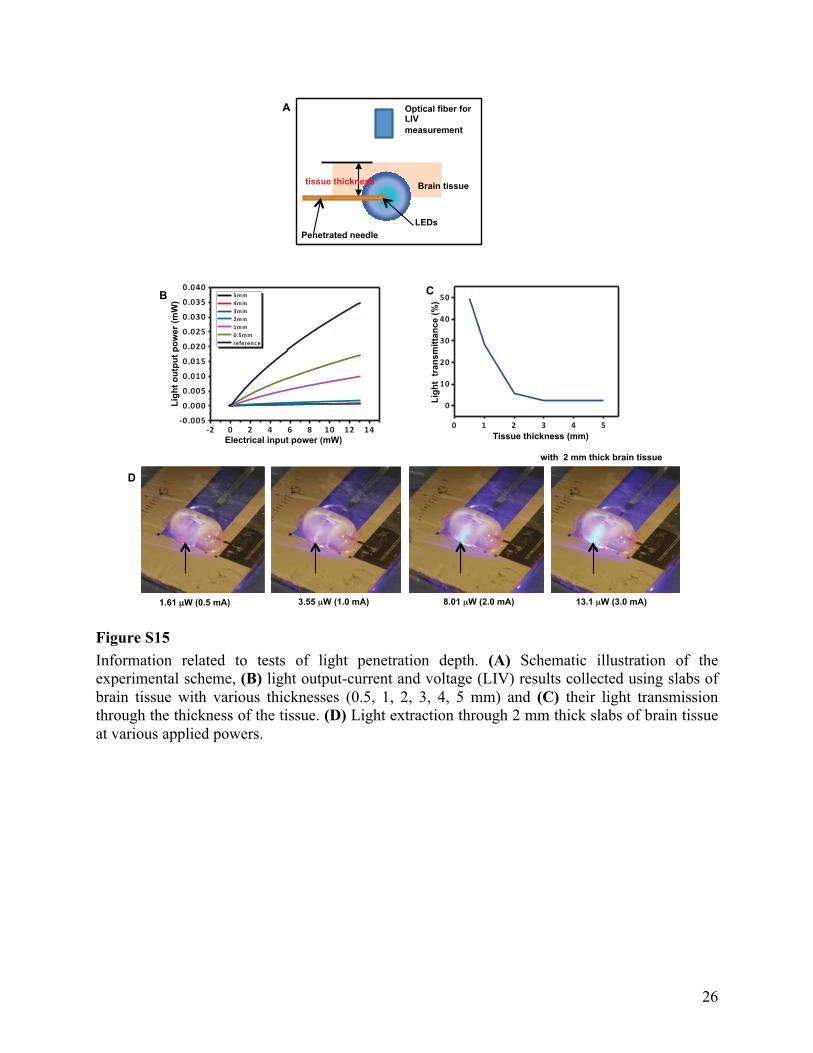
26
Figure S15 Information related to tests of light penetration depth. (A) Schematic illustration of the experimental scheme, (B) light output-current and voltage (LIV) results collected using slabs of brain tissue with various thicknesses (0.5, 1, 2, 3, 4, 5 mm) and (C) their light transmission through the thickness of the tissue. (D) Light extraction through 2 mm thick slabs of brain tissue at various applied powers.
�� � � � � � �� �� ������
����
���
����
���
����
���
����
���
����
�
�
������������������������ ��� ��� �
Electrical input power (mW)
Ligh
t out
put p
ower
(mW
)
1.61 μμW (0.5 mA) 3.55 μW (1.0 mA) 8.01 μW (2.0 mA) 13.1 μW (3.0 mA)
with 2 mm thick brain tissue
Brain tissue
Penetrated needle LEDs
tissue thickness
Optical fiber for LIV measurement
A
B
D
C
� � � � � �
�
��
��
��
��
��
�
�
Tissue thickness (mm) Li
ght
tran
smitt
ance
(%)

27
Figure S16 µ-ILED-induced activation of cAMP and ERK phosphorylation in Optoβ2 expressing cells. (A)Optoβ2 cells co-expressing pGlo show a rapid and transient increase in cAMP following light (450 nm, 5 sec, 0.5 W/cm2 pulse) stimulation (n=3). HEK293 cells expressing pGlo show no response to the same light stimulation (n=3). Data are expressed as mean ± sem. (B). Representative pERK and actin Western Blots for Optoβ2 and HEK293 cells following light (450 nm, 1 min, 0.5 W/cm2 pulse) stimulation (n=3). (C). Quantitation of pERK normalized to actinin light stimulated Optoβ2 and HEK293 cells. (*p<0.05, unpaired, two-tailed t-test).
0 2 4 6 8 100
2
4
6
8
time (min)cAM
P re
spon
se (f
old
base
line)
HEK-pGlo (n=3)Optoβ2-pGlo (n=3) B�A� C�
- Light + Light0
1
2
3
pER
K (f
old
base
line) ***
Optoβ2�
-Light� +Light�
pERK�
actin�
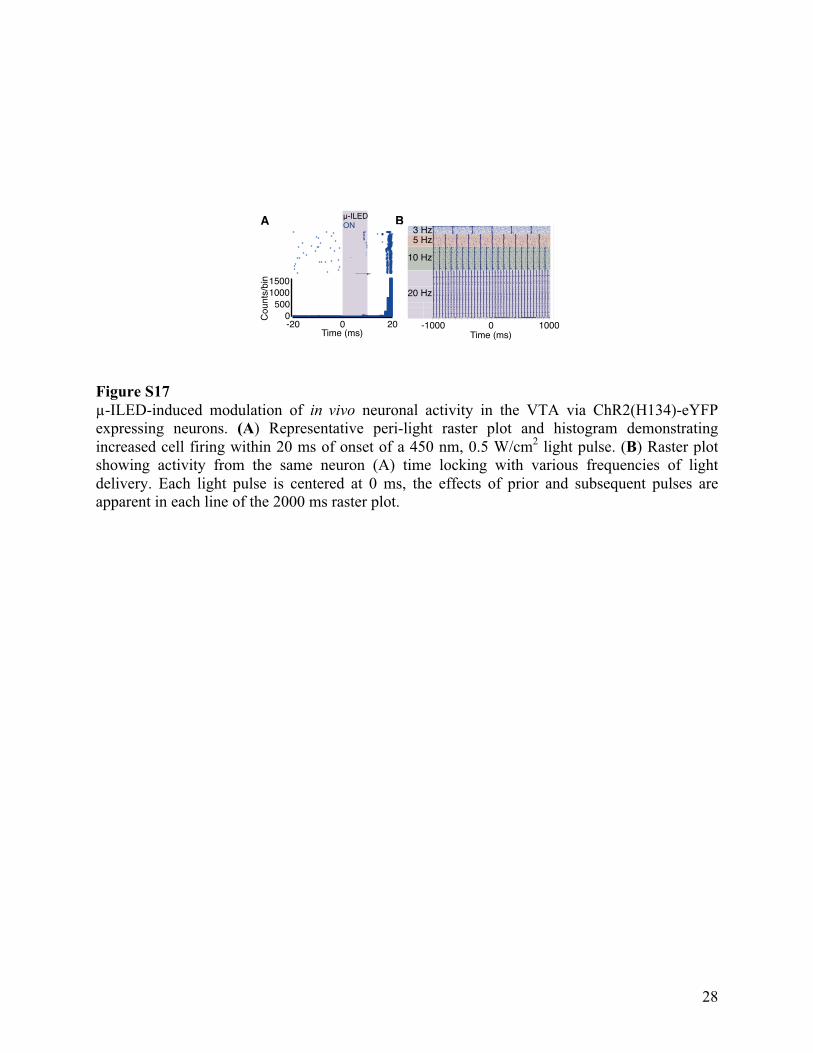
28
Figure S17 µ-ILED-induced modulation of in vivo neuronal activity in the VTA via ChR2(H134)-eYFP expressing neurons. (A) Representative peri-light raster plot and histogram demonstrating increased cell firing within 20 ms of onset of a 450 nm, 0.5 W/cm2 light pulse. (B) Raster plotshowing activity from the same neuron (A) time locking with various frequencies of light delivery. Each light pulse is centered at 0 ms, the effects of prior and subsequent pulses are apparent in each line of the 2000 ms raster plot.
B�A� BA
-20� 0� 20�Time (ms)�
0�500�
1000�1500�
Cou
nts/
bin�
µ-ILED ON
-1000� 0� 1000�Time (ms)�
3 Hz�5 Hz�
10 Hz�
20 Hz�

29
Figure S18 Surface temperature of μ-LEDs on an injection microneedle, during operation at various power levels in open air. (A) Measured (dots) and calculated (lines) temperatures of μ-ILEDs at various pulse duty cycles and at DC power levels. All calculated temperatures (lines) are obtained by time-average results at 37 oC background temperature. The duration time (width) for all pulsed cases is 10 msec. (B) Measured (left) and calculated (right) temperatures at 15 and 10 mW applied power. The measured (calculated) temperatures are 37.44 (39.31) and 36.15 (38.54) oC, respectively, with a 3 Hz pulse. (C) Measured (left) and calculated (right) temperature at 15 and 10 mW DC applied power. The measured temperatures (calculated) are 84.01 (86.95) and 86.31 (70.30) oC, respectively, with a 3 Hz pulse.

30
Figure S19 Thermal imaging with a calibrated IR camera. (A) Schematic illustration and (B) pictures of the IR camera stage and μ-ILED devices injected in brain tissue. (C) Measured and (D) calculated tissue temperature with μ-ILEDs injected into a 0.3 mm thick slab of tissue, evaluated at the surface for the case of 10 mW DC input power. Measured and calculated temperatures are 42.09 and 43.82 oC, respectively.
40 oC
37
38
39
DC
42.09 oC
A
Brain tissue
Penetrated needle LEDs
tissue thickness
IR camera
LED OFF
LED ON
B
C Measured Calculated
D
43.82 oC
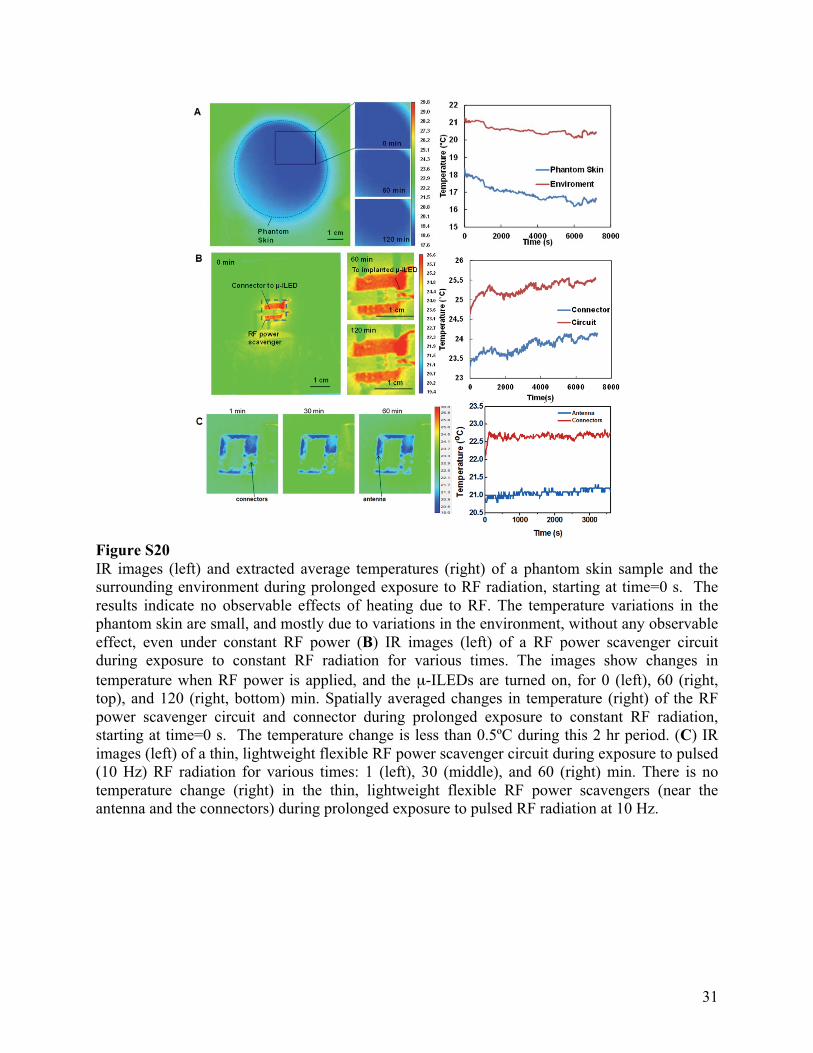
31
Figure S20 IR images (left) and extracted average temperatures (right) of a phantom skin sample and the surrounding environment during prolonged exposure to RF radiation, starting at time=0 s. The results indicate no observable effects of heating due to RF. The temperature variations in the phantom skin are small, and mostly due to variations in the environment, without any observable effect, even under constant RF power (B) IR images (left) of a RF power scavenger circuitduring exposure to constant RF radiation for various times. The images show changes in temperature when RF power is applied, and the μ-ILEDs are turned on, for 0 (left), 60 (right, top), and 120 (right, bottom) min. Spatially averaged changes in temperature (right) of the RF power scavenger circuit and connector during prolonged exposure to constant RF radiation, starting at time=0 s. The temperature change is less than 0.5ºC during this 2 hr period. (C) IR images (left) of a thin, lightweight flexible RF power scavenger circuit during exposure to pulsed (10 Hz) RF radiation for various times: 1 (left), 30 (middle), and 60 (right) min. There is no temperature change (right) in the thin, lightweight flexible RF power scavengers (near the antenna and the connectors) during prolonged exposure to pulsed RF radiation at 10 Hz.

32
Figure S21 Cartoon depicting the experimental strategy used in Fig. 3B & 3C. µ-ILED devices allow for unique spatial targeting of brain structures (here the locus coeruleus) to provide consistent illumination along the entire dorsal-ventral plane of the structure.
Fiber-optic implant�
Tethered to external laser or LED �
Multimodal μ-ILED device�
Dorsal LC�
Ventral LC�
To wired TTL power source or �headstage antenna for wireless�
200 μm fiber�
cranial surface�
brain tissue�
~20 μm PS�
Legend�
Neurons expressing ChR2-eYFP�
μ-ILED (100 x 100 x 6.45 μm)�
Electrode (platinum)�
Photodetector (silicon)�
A�
Temperature sensor (platinum)�

33
Figure S22 The durability of the devices and the constituent component following chronic implantation. (A) Survival curve showing viability of µ-ILEDs, fully passivated sensors (temperature and µ-IPD), and animals following device injection. µ-ILEDs were considered viable if the all µ-ILEDs in each array were still emitting sufficient light to activated ChR2. Sensors were considered viable if performance was within 1% of original performance. Components performed reliably within the two-three week timespan of a normal behavioral experiment and often well beyond that range. Detailed information on each point of attrition or censorship is available in Table S1. (B) The µ-ILED devices are robust and capable of functioning properly months after implantation. Working devices one (top), three (center), and six (bottom) months after chronic implantation into freely moving mice.
1 month after injection
3 months after injection
6 months after injection
B
A
0 50 100 150 200 2500
20
40
60
80
100
120
Time since implantation (d)
Sur
viva
l (%
)
�-ILEDSensorsAnimals
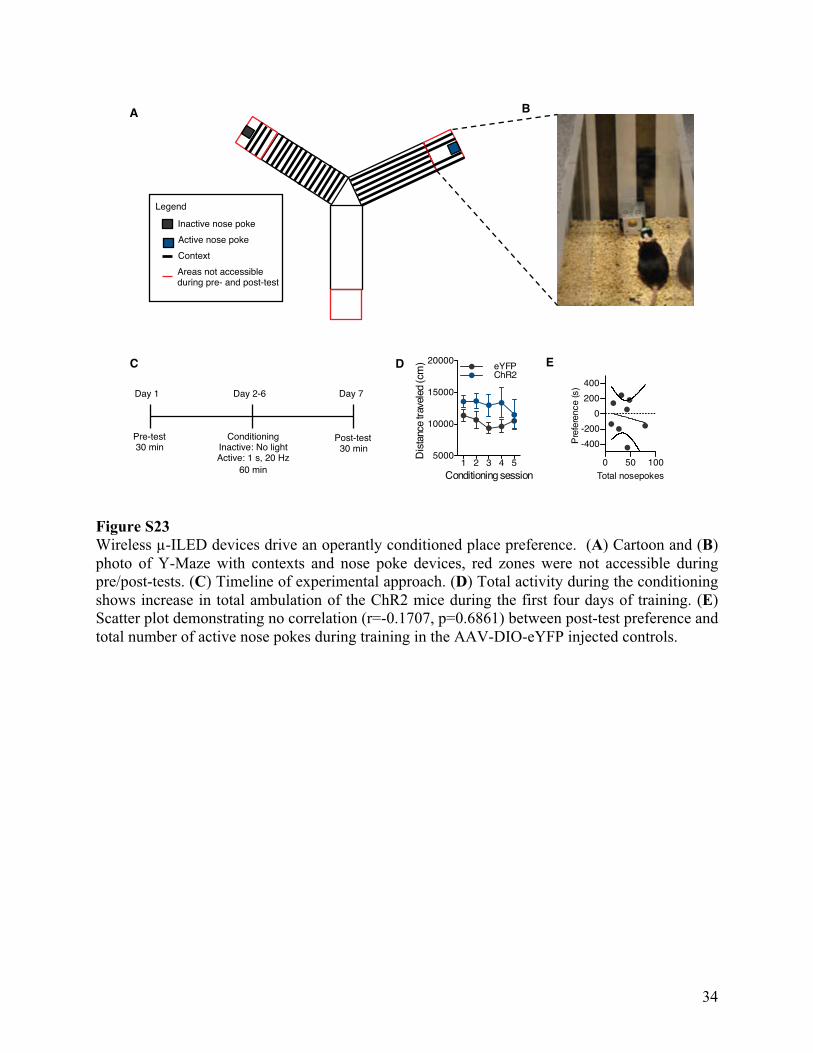
34
Figure S23 Wireless µ-ILED devices drive an operantly conditioned place preference. (A) Cartoon and (B) photo of Y-Maze with contexts and nose poke devices, red zones were not accessible during pre/post-tests. (C) Timeline of experimental approach. (D) Total activity during the conditioning shows increase in total ambulation of the ChR2 mice during the first four days of training. (E) Scatter plot demonstrating no correlation (r=-0.1707, p=0.6861) between post-test preference and total number of active nose pokes during training in the AAV-DIO-eYFP injected controls.
B�A�
Inactive nose poke�
Active nose poke�
Areas not accessible �during pre- and post-test�
Legend�
Context�
D� E�
Pre-test�30 min�
Conditioning �Inactive: No light�Active: 1 s, 20 Hz �
60 min�
Post-test�30 min�
Day 1 � Day 2-6 � Day 7 �
C�
0 50 100
-400
-200
0
200
400
Total nosepokes
Pre
fere
nce
(s)
1 2 3 4 55000
10000
15000
20000
Conditioning session
Dis
tanc
e tra
vele
d (c
m) eYFP
ChR2

35
Figure S24 Tonic, not phasic, activation of VTA-DA neurons induces anxiolytic-like behavior. (A) 5 Hz activation of VTA-DA neurons induces an anxiolytic-like behavioral response in an elevated zero maze independent of (B) locomotor effects (n=6-9; *p<0.05 t test compared to AAV5-DIO-eYFP controls). (C) Phasic (20, 5 ms pulses of 20 Hz light every minute) stimulation does not influence anxiety-like behavior or (D) locomotor activity in the open field test (n=6-8/group).
B A
C D
eYFP ChR20
500
1000
1500
2000
2500
Dis
tanc
e tra
vele
d (c
m)
eYFP ChR20
2000
4000
6000
8000
10000
Dis
tanc
e tra
vele
d (c
m)
eYFP ChR20
50
100
150
200
250
Tim
e in
Cen
ter (
s)
eYFP ChR20
10
20
30
40
50
60
70
Tim
e in
ope
n ar
m (%
) *

36
Table S1 Detailed information on the attrition and censoring of devices from Figure S22A. The last working day after implantation was recorded as 0 if the damage occurred prior to or during implantation.
Device ID Reason for attrition/censor Last working day after implantation
S1 Testing period ended, sensor working 21 S2 Testing period ended, sensor working 21 S3 Testing period ended, sensor working 21 S4 Testing period ended, sensor working 21 S5 Testing period ended, sensor working 21 S6 Testing period ended, sensor working 220 S7 Interconnect failure 0 S8 Testing period ended, sensor working 7 L1 Structural damage during implantation 0 L2 Testing period ended, µ-ILEDs working 220 L3 Animal died, device damaged on removal 183 L4 Testing period ended, µ-ILEDs working 220 L5 Testing period ended, µ-ILEDs working 220 L6 Testing period ended, µ-ILEDs working 220 L7 Testing period ended, µ-ILEDs working 220 L8 Testing period ended, µ-ILEDs working 220 L9 Testing period ended, µ-ILEDs working 220
L10 Testing period ended, µ-ILEDs working 220 L11 Testing period ended, µ-ILEDs working 220 L12 Testing period ended, µ-ILEDs working 30 L13 Animal died, device damaged on removal 164 L14 One or more µ-ILED failure 186 L15 Testing period ended, µ-ILEDs working 90 L16 Testing period ended, µ-ILEDs working 90 L17 One or more µ-ILED failure 220 L18 One or more µ-ILED failure 220 L19 One or more µ-ILED failure 220 L20 One or more µ-ILED failure 220

37
Movie S1 A movie clip that illustrates the procedure for injecting ultrathin, mechanically compliant optoelectronics into the ventral striatum of an intact, living mouse brain. The movie specifically highlights the injection on the rigid microneedle and removal of the microneedle following dissolution of the silk adhesive. Total elapsed time between video clips is ~15 minutes.

38
References and Notes 1. D.-H. Kim et al., Dissolvable films of silk fibroin for ultrathin conformal bio-integrated
electronics. Nat. Mater. 9, 511 (2010). doi:10.1038/nmat2745 Medline 2. J. Viventi et al., A conformal, bio-interfaced class of silicon electronics for mapping cardiac
electrophysiology. Sci. Transl. Med. 2, 24ra22 (2010). doi:10.1126/scitranslmed.3000738 Medline
3. B. Tian et al., Three-dimensional, flexible nanoscale field-effect transistors as localized bioprobes. Science 329, 830 (2010). doi:10.1126/science.1192033 Medline
4. D.-H. Kim et al., Epidermal electronics. Science 333, 838 (2011). doi:10.1126/science.1206157 Medline
5. Q. Qing et al., Nanowire transistor arrays for mapping neural circuits in acute brain slices. Proc. Natl. Acad. Sci. U.S.A. 107, 1882 (2010). doi:10.1073/pnas.0914737107 Medline
6. T. Sekitani, T. Someya, Stretchable organic integrated circuits for large-area electronic skin surface. MRS Bull. 37, 236 (2012). doi:10.1557/mrs.2012.42
7. J. Ordonez, M. Schuettler, C. Boehler, T. Boretius, T. Stieglitz, Thin films and microelectrode arrays for neuroprosthetics. MRS Bull. 37, 590 (2012). doi:10.1557/mrs.2012.117
8. S. C. B. Mannsfeld et al., Highly sensitive flexible pressure sensors with microstructured rubber dielectric layers. Nat. Mater. 9, 859 (2010). doi:10.1038/nmat2834 Medline
9. T. Sekitani et al., Organic nonvolatile memory transistors for flexible sensor arrays. Science 326, 1516 (2009). doi:10.1126/science.1179963 Medline
10. S. Takeuchi, T. Suzuki, K. Mabuchi, H. Fujita, 3D flexible multichannel neural probe array. J. Micromech. Microeng. 14, 104 (2004). doi:10.1088/0960-1317/14/1/014
11. E. Stark, T. Koos, G. Buzsáki, Diode probes for spatiotemporal optical control of multiple neurons in freely moving animals. J. Neurophysiol. 108, 349 (2012). doi:10.1152/jn.00153.2012 Medline
12. Y.-T. Kim, M. I. Romero-Ortega, Material considerations for peripheral nerve interfacing. MRS Bull. 37, 573 (2012). doi:10.1557/mrs.2012.99
13. J. Mattis et al., Principles for applying optogenetic tools derived from direct comparative analysis of microbial opsins. Nat. Methods 18, 159 (2011). doi:10.1038/nmeth.1808 Medline
14. P. Anikeeva et al., Optetrode: A multichannel readout for optogenetic control in freely moving mice. Nat. Neurosci. 15, 163 (2011). doi:10.1038/nn.2992 Medline
15. H. Cao, L. Gu, S. K. Mohanty, J.-C. Chiao, An integrated μLED optrode for optogenetic stimulation and electrical recording. IEEE Trans. Biomed. Eng. 60, 225 (2013). doi:10.1109/TBME.2012.2217395 Medline
16. B. Tian et al., Macroporous nanowire nanoelectronic scaffolds for synthetic tissues. Nat. Mater. 11, 986 (2012). doi:10.1038/nmat3404 Medline

39
17. T.-I. Kim et al., High efficiency, microscale GaN light-emitting diodes and their thermal properties on unusually substrates. Small 8, 1643 (2012). doi:10.1002/smll.201200382 Medline
18. Materials and methods are available as supporting material on Science Online.
19. Federal Communications Commission (FCC), Guidelines for Evaluating the Environmental Effects of Radiofrequency Radiation (FCC publication docket no. 93-62, 1996); http://transition.fcc.gov/Bureaus/Engineering_Technology/Orders/1996/fcc96326.txt.
20. R. D. Airan, K. R. Thompson, L. E. Fenno, H. Bernstein, K. Deisseroth, Temporally precise in vivo control of intracellular signalling. Nature 458, 1025 (2009). doi:10.1038/nature07926 Medline
21. M. M. Elwassif, Q. Kong, M. Vazquez, M. Bikson, Bio-heat transfer model of deep brain stimulation-induced temperature changes. J. Neural Eng. 3, 306 (2006). doi:10.1088/1741-2560/3/4/008 Medline
22. A. M. Aravanis et al., An optical neural interface: In vivo control of rodent motor cortex with integrated fiberoptic and optogenetic technology. J. Neural Eng. 4, S143 (2007). doi:10.1088/1741-2560/4/3/S02 Medline
23. O. Yizhar, L. E. Fenno, T. J. Davidson, M. Mogri, K. Deisseroth, Optogenetics in neural systems. Neuron 71, 9 (2011). doi:10.1016/j.neuron.2011.06.004 Medline
24. K. M. Tye et al., Amygdala circuitry mediating reversible and bidirectional control of anxiety. Nature 471, 358 (2011). doi:10.1038/nature09820 Medline
25. A. N. Zorzos, J. Scholvin, E. S. Boyden, C. G. Fonstad, Three-dimensional multiwaveguide probe array for light delivery to distributed brain circuits. Opt. Lett. 37, 4841 (2012). doi:10.1364/OL.37.004841 Medline
26. M. E. Carter et al., Tuning arousal with optogenetic modulation of locus coeruleus neurons. Nat. Neurosci. 13, 1526 (2010). doi:10.1038/nn.2682 Medline
27. D. H. Szarowski et al., Brain responses to micro-machined silicon devices. Brain Res. 983, 23 (2003). doi:10.1016/S0006-8993(03)03023-3 Medline
28. T. D. Y. Kozai, D. R. Kipke, Insertion shuttle with carboxyl terminated self-assembled monolayer coatings for implanting flexible polymer neural probes in the brain. J. Neurosci. Methods 184, 199 (2009). doi:10.1016/j.jneumeth.2009.08.002
29. H. C. Tsai et al., Phasic firing in dopaminergic neurons is sufficient for behavioral conditioning. Science 324, 1080 (2009). doi:10.1126/science.1168878 Medline
30. A. R. Adamantidis et al., Optogenetic interrogation of dopaminergic modulation of the multiple phases of reward-seeking behavior. J. Neurosci. 31, 10829 (2011). doi:10.1523/JNEUROSCI.2246-11.2011 Medline
31. I. B. Witten et al., Recombinase-driver rat lines: Tools, techniques, and optogenetic application to dopamine-mediated reinforcement. Neuron 72, 721 (2011). doi:10.1016/j.neuron.2011.10.028 Medline

40
32. K. M. Kim et al., Optogenetic mimicry of the transient activation of dopamine neurons by natural reward is sufficient for operant reinforcement. PLoS ONE 7, e33612 (2012). doi:10.1371/journal.pone.0033612 Medline
33. T. M. McGranahan, N. E. Patzlaff, S. R. Grady, S. F. Heinemann, T. K. Booker, α4β2 nicotinic acetylcholine receptors on dopaminergic neurons mediate nicotine reward and anxiety relief. J. Neurosci. 31, 10891 (2011). doi:10.1523/JNEUROSCI.0937-11.2011 Medline
34. L. Coque et al., Specific role of VTA dopamine neuronal firing rates and morphology in the reversal of anxiety-related, but not depression-related behavior in the ClockΔ19 mouse model of mania. Neuropsychopharmacology 36, 1478 (2011). doi:10.1038/npp.2011.33 Medline
35. F. P. Incropera, D. P. Dewitt, T. L. Bergman, A. S. Lavine, Fundamentals of Heat and Mass Transfer, J. Hayton, Eds. (Wiley, New York, 2006).
36. B. Solano, S. Rolt, D. Wood, Thermal and mechanical analysis of an SU8 polymeric actuator using infrared thermography. J. Mech. Eng. Sci. 222, 73 (2008). doi:10.1243/09544062JMES676
37. C. G. Mattsson et al., Development of an infrared thermopile detector with a thin selfsupporting SU-8 membrane, IEEE SENSORS 2007 Conference, 28 to 31 October 2007, Atlanta, GA (2007), pp. 836–839.
38. A. K. van der Vegt, L. E. Govaert, Polymeren, Van Keten Tot Kunststof (Delft Univ. Press, Delft, Netherlands, 2005).
39. S. A. Campbell, The Science and Engineering of Microelectronic Fabrication (Oxford Univ. Press, New York, 2001).
40. A. Modafe, N. Ghalichechian, M. Powers, M. Khbeis, R. Ghodssi, Embedded benzocyclobutene in silicon: An integrated fabrication process for electrical and thermal isolation in MEMS. Microelectron. Eng. 82, 154 (2005). doi:10.1016/j.mee.2005.07.005
41. B. Esler, T. Lyons, S. Turovets, D. Tucker, Instrumentation for low frequency EIT studies of the human head and its validation in phantom experiments. J. Phys. Conf. Ser. 224, 012007 (2010). doi:10.1088/1742-6596/224/1/012007
42. K. Ito, K. Furuya, Y. Okano, L. Hamada, Development and characteristics of a biological tissue-equivalent phantom for microwaves. Electron. Commun. 84, 67 (2001). doi:10.1002/1520-6424(200104)84:4<67::AID-ECJA8>3.0.CO;2-D
43. D. R. Sparta et al., Construction of implantable optical fibers for long-term optogenetic manipulation of neural circuits. Nat. Protoc. 7, 12 (2011). doi:10.1038/nprot.2011.413 Medline
44. M. R. Bruchas et al., Selective p38α MAPK deletion in serotonergic neurons produces stress resilience in models of depression and addiction. Neuron 71, 498 (2011). doi:10.1016/j.neuron.2011.06.011 Medline
45. N. R. Zhang et al., Serine 363 is required for nociceptin/orphanin FQ opioid receptor (NOPR) desensitization, internalization, and arrestin signaling. J. Biol. Chem. 287, 42019 (2012). doi:10.1074/jbc.M112.405696 Medline

41
46. K. R. Tan et al., GABA neurons of the VTA drive conditioned place aversion. Neuron 73, 1173 (2012). doi:10.1016/j.neuron.2012.02.015 Medline
47. A. M. Stamatakis, G. D. Stuber, Activation of lateral habenula inputs to the ventral midbrain promotes behavioral avoidance. Nat. Neurosci. 15, 1105 (2012). doi:10.1038/nn.3145 Medline
48. S. Lammel et al., Input-specific control of reward and aversion in the ventral tegmental area. Nature 491, 212 (2012). doi:10.1038/nature11527 Medline