Initiation: steering towards a better...
26
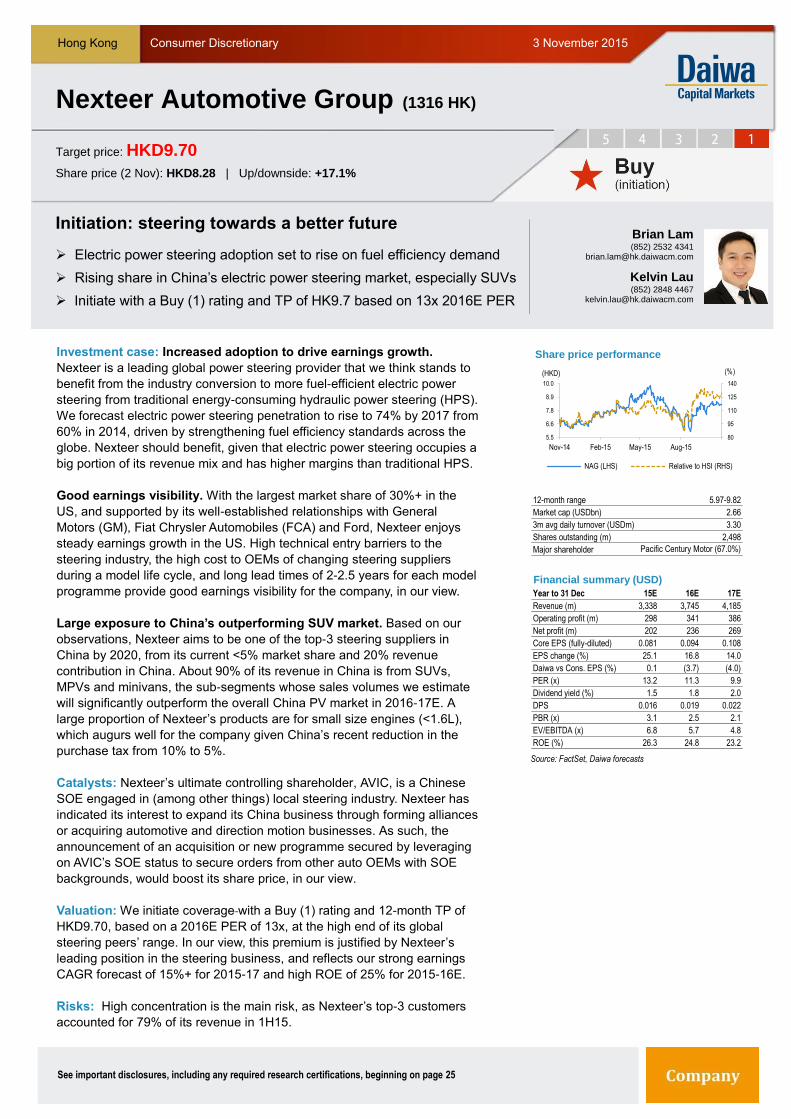
See important disclosures, including any required research certifications, beginning on page 25 Hong Kong Consumer Discretionary Investment case: Increased adoption to drive earnings growth. Nexteer is a leading global power steering provider that we think stands to benefit from the industry conversion to more fuel-efficient electric power steering from traditional energy-consuming hydraulic power steering (HPS). We forecast electric power steering penetration to rise to 74% by 2017 from 60% in 2014, driven by strengthening fuel efficiency standards across the globe. Nexteer should benefit, given that electric power steering occupies a big portion of its revenue mix and has higher margins than traditional HPS. Good earnings visibility. With the largest market share of 30%+ in the US, and supported by its well-established relationships with General Motors (GM), Fiat Chrysler Automobiles (FCA) and Ford, Nexteer enjoys steady earnings growth in the US. High technical entry barriers to the steering industry, the high cost to OEMs of changing steering suppliers during a model life cycle, and long lead times of 2-2.5 years for each model programme provide good earnings visibility for the company, in our view. Large exposure to China’s outperforming SUV market. Based on our observations, Nexteer aims to be one of the top-3 steering suppliers in China by 2020, from its current <5% market share and 20% revenue contribution in China. About 90% of its revenue in China is from SUVs, MPVs and minivans, the sub-segments whose sales volumes we estimate will significantly outperform the overall China PV market in 2016-17E. A large proportion of Nexteer’s products are for small size engines (<1.6L), which augurs well for the company given China’s recent reduction in the purchase tax from 10% to 5%. Catalysts: Nexteer’s ultimate controlling shareholder, AVIC, is a Chinese SOE engaged in (among other things) local steering industry. Nexteer has indicated its interest to expand its China business through forming alliances or acquiring automotive and direction motion businesses. As such, the announcement of an acquisition or new programme secured by leveraging on AVIC’s SOE status to secure orders from other auto OEMs with SOE backgrounds, would boost its share price, in our view. Valuation: We initiate coverage with a Buy (1) rating and 12-month TP of HKD9.70, based on a 2016E PER of 13x, at the high end of its global steering peers’ range. In our view, this premium is justified by Nexteer’s leading position in the steering business, and reflects our strong earnings CAGR forecast of 15%+ for 2015-17 and high ROE of 25% for 2015-16E. Risks: High concentration is the main risk, as Nexteer’s top-3 customers accounted for 79% of its revenue in 1H15. 3 November 2015 Initiation: steering towards a better future Electric power steering adoption set to rise on fuel efficiency demand Rising share in China’s electric power steering market, especially SUVs Initiate with a Buy (1) rating and TP of HK9.7 based on 13x 2016E PER Source: FactSet, Daiwa forecasts Nexteer Automotive Group (1316 HK) Target price: HKD9.70 Share price (2 Nov): HKD8.28 | Up/downside: +17.1% Brian Lam (852) 2532 4341 [email protected] Kelvin Lau (852) 2848 4467 [email protected] 80 95 110 125 140 5.5 6.6 7.8 8.9 10.0 Nov-14 Feb-15 May-15 Aug-15 Share price performance NAG (LHS) Relative to HSI (RHS) (HKD) (%) 12-month range 5.97-9.82 Market cap (USDbn) 2.66 3m avg daily turnover (USDm) 3.30 Shares outstanding (m) 2,498 Major shareholder Pacific Century Motor (67.0%) Financial summary (USD) Year to 31 Dec 15E 16E 17E Revenue (m) 3,338 3,745 4,185 Operating profit (m) 298 341 386 Net profit (m) 202 236 269 Core EPS (fully-diluted) 0.081 0.094 0.108 EPS change (%) 25.1 16.8 14.0 Daiwa vs Cons. EPS (%) 0.1 (3.7) (4.0) PER (x) 13.2 11.3 9.9 Dividend yield (%) 1.5 1.8 2.0 DPS 0.016 0.019 0.022 PBR (x) 3.1 2.5 2.1 EV/EBITDA (x) 6.8 5.7 4.8 ROE (%) 26.3 24.8 23.2
Transcript of Initiation: steering towards a better...
See important disclosures, including any required research certifications, beginning on page 25
Hong Kong Consumer Discretionary
Investment case: Increased adoption to drive earnings growth.
Nexteer is a leading global power steering provider that we think stands to
benefit from the industry conversion to more fuel-efficient electric power
steering from traditional energy-consuming hydraulic power steering (HPS).
We forecast electric power steering penetration to rise to 74% by 2017 from
60% in 2014, driven by strengthening fuel efficiency standards across the
globe. Nexteer should benefit, given that electric power steering occupies a
big portion of its revenue mix and has higher margins than traditional HPS.
Good earnings visibility. With the largest market share of 30%+ in the
US, and supported by its well-established relationships with General
Motors (GM), Fiat Chrysler Automobiles (FCA) and Ford, Nexteer enjoys
steady earnings growth in the US. High technical entry barriers to the
steering industry, the high cost to OEMs of changing steering suppliers
during a model life cycle, and long lead times of 2-2.5 years for each model
programme provide good earnings visibility for the company, in our view.
Large exposure to China’s outperforming SUV market. Based on our
observations, Nexteer aims to be one of the top-3 steering suppliers in
China by 2020, from its current <5% market share and 20% revenue
contribution in China. About 90% of its revenue in China is from SUVs,
MPVs and minivans, the sub-segments whose sales volumes we estimate
will significantly outperform the overall China PV market in 2016-17E. A
large proportion of Nexteer’s products are for small size engines (<1.6L),
which augurs well for the company given China’s recent reduction in the
purchase tax from 10% to 5%.
Catalysts: Nexteer’s ultimate controlling shareholder, AVIC, is a Chinese
SOE engaged in (among other things) local steering industry. Nexteer has
indicated its interest to expand its China business through forming alliances
or acquiring automotive and direction motion businesses. As such, the
announcement of an acquisition or new programme secured by leveraging
on AVIC’s SOE status to secure orders from other auto OEMs with SOE
backgrounds, would boost its share price, in our view.
Valuation: We initiate coverage with a Buy (1) rating and 12-month TP of
HKD9.70, based on a 2016E PER of 13x, at the high end of its global
steering peers’ range. In our view, this premium is justified by Nexteer’s
leading position in the steering business, and reflects our strong earnings
CAGR forecast of 15%+ for 2015-17 and high ROE of 25% for 2015-16E.
Risks: High concentration is the main risk, as Nexteer’s top-3 customers
accounted for 79% of its revenue in 1H15.
3 November 2015
Nexteer Automoti ve Group
Initiation: steering towards a better future
Electric power steering adoption set to rise on fuel efficiency demand
Rising share in China’s electric power steering market, especially SUVs
Initiate with a Buy (1) rating and TP of HK9.7 based on 13x 2016E PER
Source: FactSet, Daiwa forecasts
Nexteer Automotive Group (1316 HK)
Target price: HKD9.70
Share price (2 Nov): HKD8.28 | Up/downside: +17.1%
Brian Lam(852) 2532 4341
Kelvin Lau(852) 2848 4467
80
95
110
125
140
5.5
6.6
7.8
8.9
10.0
Nov-14 Feb-15 May-15 Aug-15
Share price performance
NAG (LHS) Relative to HSI (RHS)
(HKD) (%)
12-month range 5.97-9.82
Market cap (USDbn) 2.66
3m avg daily turnover (USDm) 3.30
Shares outstanding (m) 2,498
Major shareholder Pacific Century Motor (67.0%)
Financial summary (USD)
Year to 31 Dec 15E 16E 17E
Revenue (m) 3,338 3,745 4,185
Operating profit (m) 298 341 386
Net profit (m) 202 236 269
Core EPS (fully-diluted) 0.081 0.094 0.108
EPS change (%) 25.1 16.8 14.0
Daiwa vs Cons. EPS (%) 0.1 (3.7) (4.0)
PER (x) 13.2 11.3 9.9
Dividend yield (%) 1.5 1.8 2.0
DPS 0.016 0.019 0.022
PBR (x) 3.1 2.5 2.1
EV/EBITDA (x) 6.8 5.7 4.8
ROE (%) 26.3 24.8 23.2

2
Nexteer Automotive Group (1316 HK): 3 November 2015
Table of contents
Investment thesis 6
Technology conversion from hydraulic power steering to electric power steering ..........................6
Global trend of strengthening fuel efficiency standards to drive electric power steering growth .....7
Long lead times and high earnings visibility ...................................................................................8
Global auto demand still strong despite China slowdown ..............................................................8
AVIC as a controlling shareholder ............................................................................................... 10
Competitive landscape ................................................................................................................ 10
A leading steering manufacturer 12
Rich backlog, extensive electric power steering exposure ........................................................... 12
New programmes focussed on SUVs and MPVs ......................................................................... 12
Financial forecasts ...................................................................................................................... 13
Valuation and recommendation ................................................................................................... 15
Risks to our call ........................................................................................................................... 17
Company background 18
Company history ......................................................................................................................... 18
Products ...................................................................................................................................... 19

3
Nexteer Automotive Group (1316 HK): 3 November 2015
How do we justify our view?
Growth outlook Valuation Earnings revisions
Growth outlook Nexteer: net-profit forecasts
Nexteer reported net-profit growth of 48% YoY to
USD161m for 2014, driven by the conversion of steering
systems from hydraulic power steering to electric power
steering, especially in emerging countries like China. From
a high earnings base in 2014, the company still stands to
record solid net profit growth of 25%/17% YoY for 2015-
2016, based on our forecasts, supported by market-share
gains in China’s SUV market and Nexteer’s rich order
backlog coverage of 3.0x for 2016E.
Source: Company, Daiwa forecasts
Valuation Nexteer: 1-year forward PER (x)
Nexteer is trading currently at PERs of 13x for 2015E and
11x for 2016E, based on our EPS forecasts, compared with
its average trading PER of 10x since listing in October
2013. We set our target price at HKD9.7, based on a
2016E 13x PER, in line with global auto part peers’
average of 13.1x, but at the high end of its steering peers’
valuation range, justified in our view by Nexteer’s higher-
than-peer profit growth and ROE for the next 3 years.
Source: Company, Daiwa forecasts
Earnings revisions Nexteer: revisions to the Bloomberg-consensus EPS forecasts
Our earnings forecasts are largely in line with the
Bloomberg consensus. However, on the operational front,
we are more bullish than the market on Nexteer securing
more orders in the China market, by leveraging on AVIC’s
strong SOE background and network.
Source: Bloomberg
(20%)
0%
20%
40%
60%
80%
100%
0
50
100
150
200
250
300
2012 2013 2014 2015E 2016E 2017E
Net Profit (LHS) YoY Growth (RHS)
(USDm)
4
6
8
10
12
14
16
Oct
-13
Nov
-13
Dec
-13
Jan-
14
Feb
-14
Mar
-14
Apr
-14
May
-14
Jun-
14
Jul-1
4
Aug
-14
Sep
-14
Oct
-14
Nov
-14
Dec
-14
Jan-
15
Feb
-15
Mar
-15
Apr
-15
May
-15
Jun-
15
Jul-1
5
Aug
-15
Sep
-15
Oct
-15
Nov
-15
Trading PER Average + 1SD -1 SD
(PER)
-1 SD
Avg
+1 SD
0.00
0.02
0.04
0.06
0.08
0.10
0.12
Jan-
14
Feb
-14
Mar
-14
Apr
-14
May
-14
Jun-
14
Jul-1
4
Aug
-14
Sep
-14
Oct
-14
Nov
-14
Dec
-14
Jan-
15
Feb
-15
Mar
-15
Apr
-15
May
-15
Jun-
15
Jul-1
5
Aug
-15
Sep
-15
Oct
-15
Nov
-15
(USD)
2015E 2016E

4
Nexteer Automotive Group (1316 HK): 3 November 2015
Financial summary
Key assumptions
Profit and loss (USDm)
Cash flow (USDm)
Source: FactSet, Daiwa forecasts
Year to 31 Dec 2010 2011 2012 2013 2014 2015E 2016E 2017E
Revenue growth (%) - U.S. 0.0 13.3 4.5 10.4 20.3 10.0 10.0 8.0
Revenue growth (%) - China 0.0 14.3 8.2 43.6 78.8 40.0 25.0 25.0
EBITDAR margin (%) - U.S. 2.5 4.6 4.7 10.9 11.4 14.0 14.0 14.0
EBITDAR margin (%) - China 13.2 (2.5) 11.0 8.6 15.5 16.0 16.5 17.0
Year to 31 Dec 2010 2011 2012 2013 2014 2015E 2016E 2017E
North America 1,298 1,470 1,536 1,697 2,042 2,246 2,471 2,668
China 147 168 182 262 468 655 819 1,024
Other Revenue 607 609 449 428 468 437 455 493
Total Revenue 2,052 2,248 2,168 2,387 2,978 3,338 3,745 4,185
Other income (7) 9 (3) (2) (5) (13) (15) (17)
COGS (1,793) (1,970) (1,896) (2,047) (2,558) (2,830) (3,167) (3,536)
SG&A (225) (197) (180) (163) (178) (197) (221) (247)
Other op.expenses 0 0 0 0 0 0 0 0
Operating profit 27 90 89 175 238 298 341 386
Net-interest inc./(exp.) (6) (16) (22) (22) (22) (24) (24) (24)
Assoc/forex/extraord./others 1 (1) (5) (2) (1) (2) (2) (2)
Pre-tax profit 22 73 62 151 215 272 315 360
Tax (11) (5) (4) (40) (51) (65) (75) (86)
Min. int./pref. div./others (2) (1) (2) (2) (2) (5) (4) (5)
Net profit (reported) 9 67 57 109 161 202 236 269
Net profit (adjusted) 9 67 57 109 161 202 236 269
EPS (reported)(USD) 9.416 66.686 57.096 0.058 0.065 0.081 0.094 0.108
EPS (adjusted)(USD) 9.416 66.686 57.096 0.058 0.065 0.081 0.094 0.108
EPS (adjusted fully-diluted)(USD) 9.416 66.686 57.096 0.058 0.065 0.081 0.094 0.108
DPS (USD) 0.000 33.600 0.000 0.009 0.013 0.016 0.019 0.022
EBIT 27 90 89 175 238 298 341 386
EBITDA 57 144 146 248 356 447 523 602
Year to 31 Dec 2010 2011 2012 2013 2014 2015E 2016E 2017E
Profit before tax 22 73 62 151 215 272 315 360
Depreciation and amortisation 30 54 58 74 119 149 181 216
Tax paid (8) (8) (6) (7) (51) (65) (75) (86)
Change in working capital 25 (39) (8) (27) (109) (35) (37) (40)
Other operational CF items 7 17 54 32 78 28 28 28
Cash flow from operations 76 98 160 223 251 349 413 478
Capex (61) (137) (276) (287) (279) (287) (293) (304)
Net (acquisitions)/disposals (318) 3 4 13 0 3 4 6
Other investing CF items (0) 1 (0) (4) 3 0 0 0
Cash flow from investing (379) (133) (273) (277) (276) (284) (288) (298)
Change in debt 299 15 133 47 (107) 0 0 0
Net share issues/(repurchases) 0 0 0 295 0 0 0 0
Dividends paid (34) 0 0 0 (22) (32) (40) (47)
Other financing CF items 92 (15) (34) (38) 219 (26) (26) (26)
Cash flow from financing 357 0 99 305 91 (58) (67) (73)
Forex effect/others 0 0 0 0 0 0 0 0
Change in cash 53 (35) (14) 250 66 6 58 107
Free cash flow 14 (39) (116) (65) (28) 62 120 174

5
Nexteer Automotive Group (1316 HK): 3 November 2015
Financial summary continued …
Balance sheet (USDm)
Key ratios (%)
Source: FactSet, Daiwa forecasts
As at 31 Dec 2010 2011 2012 2013 2014 2015E 2016E 2017E
Cash & short-term investment 113 78 64 314 380 387 444 552
Inventory 152 157 174 185 226 250 280 312
Accounts receivable 308 316 324 364 525 589 660 738
Other current assets 50 45 65 76 94 105 118 132
Total current assets 624 596 628 939 1,226 1,331 1,503 1,734
Fixed assets 271 290 434 563 626 699 760 807
Goodwill & intangibles 6 76 180 272 345 399 438 465
Other non-current assets 12 12 17 31 46 52 57 63
Total assets 912 973 1,259 1,805 2,242 2,481 2,758 3,069
Short-term debt 365 405 99 130 97 97 97 97
Accounts payable 255 260 296 336 439 486 544 607
Other current liabilities 139 103 112 125 146 163 183 204
Total current liabilities 758 767 507 592 682 746 823 908
Long-term debt 26 2 442 458 634 634 634 634
Other non-current liabilities 53 82 118 165 218 218 218 218
Total liabilities 837 850 1,067 1,214 1,534 1,598 1,675 1,760
Share capital 54 111 171 568 684 684 684 684
Reserves/R.E./others 0 0 0 0 0 170 365 587
Shareholders' equity 54 111 171 568 684 853 1,049 1,270
Minority interests 21 12 21 23 24 30 34 39
Total equity & liabilities 912 973 1,259 1,805 2,242 2,481 2,758 3,069
EV 2,966 3,009 3,166 2,966 3,038 3,031 2,972 2,864
Net debt/(cash) 277 328 477 274 351 344 287 179
BVPS (USD) 54.339 110.828 170.931 0.227 0.274 0.342 0.420 0.509
Year to 31 Dec 2010 2011 2012 2013 2014 2015E 2016E 2017E
Sales (YoY) n.a. 9.5 (3.6) 10.1 24.8 12.1 12.2 11.8
EBITDA (YoY) n.a. 154.4 1.7 69.6 43.6 25.4 17.0 15.1
Operating profit (YoY) n.a. 232.5 (1.7) 97.2 36.1 25.5 14.5 12.9
Net profit (YoY) n.a. 608.2 (14.4) 91.2 47.8 25.1 16.8 14.0
Core EPS (fully-diluted) (YoY) n.a. 608.2 (14.4) (99.9) 10.5 25.1 16.8 14.0
Gross-profit margin 12.6 12.4 12.5 14.2 14.1 15.2 15.4 15.5
EBITDA margin 2.8 6.4 6.8 10.4 12.0 13.4 14.0 14.4
Operating-profit margin 1.3 4.0 4.1 7.3 8.0 8.9 9.1 9.2
Net profit margin 0.5 3.0 2.6 4.6 5.4 6.1 6.3 6.4
ROAE 34.7 80.7 40.5 29.6 25.8 26.3 24.8 23.2
ROAA 2.1 7.1 5.1 7.1 8.0 8.6 9.0 9.2
ROCE 11.6 18.1 14.0 18.3 18.2 19.5 19.9 20.0
ROIC 4.0 20.8 14.9 16.7 18.8 19.8 20.0 20.5
Net debt to equity 509.7 296.3 278.8 48.2 51.3 40.4 27.3 14.1
Effective tax rate 48.3 7.4 5.7 26.7 23.9 23.9 23.9 23.9
Accounts receivable (days) 27.4 50.7 53.9 52.6 54.5 60.9 60.9 61.0
Current ratio (x) 0.8 0.8 1.2 1.6 1.8 1.8 1.8 1.9
Net interest cover (x) 4.8 5.7 4.1 8.0 11.0 12.4 14.2 16.2
Net dividend payout 0.0 50.4 0.0 15.0 20.0 20.0 20.0 20.0
Free cash flow yield 0.5 n.a. n.a. n.a. n.a. 2.3 4.5 6.5
Company profile
Listed on the Hong Kong Stock Exchange in 2013, Nexteer is a leading global steering and driveline
manufacturer, solely dedicated to electric and hydraulic steering systems, steering columns and
driveline products for original equipment manufacturers. Its customers include General Motors, Fiat
Chrysler, Ford, Toyota and PSA Peugeot Citroen, as well as automakers in India, China and South
America.

6
Nexteer Automotive Group (1316 HK): 3 November 2015
Investment thesis
Technology conversion from hydraulic power steering to electric power steering
Power steering
Power steering is a system that helps drivers steer the wheels of vehicles using a source
of power other than the driver’s own power. Depending on the origins of the power,
steering systems can be further categorised into: 1) electric power steering, which uses
electrical components to generate power and control steering, and 2) hydraulic power
steering, which uses fluid pressure to control the steering.
Advantages of electric power steering over hydraulic power steering
Nexteer’s technology edge is in electronic power steering, a comparatively new
technology. Electric power steering involves a less complicated build and mechanism
which takes up less space in a vehicle’s engine, while hydraulic power steering is a
primitive technology that has been around for decades. Due to the advantages listed below
of electric power steering over hydraulic power steering, there has been increasing
conversion from hydraulic power steering to electric power steering over the past 5 years:
i) Electric power steering is about 5% more energy efficient than hydraulic power
steering, as hydraulic power steering extracts power from the engine, while electric
power steering consumes power from the battery.
ii) Electric power steering needs less maintenance compared to hydraulic power
steering, since hydraulic power steering uses hydraulic fluids for operation, whereas
there is no such fluid needed for electric power steering.
iii) Electric power steering is not connected to the engine by a belt (as is hydraulic
steering), and is therefore engine-independent. It can still run when the engine is off,
as it depends on the car’s electrical systems.
iv) Electric power steering gives a better response at different speeds compared to
hydraulic power steering.
v) Electric power steering is less prone to problems and faults and its components are
more durable.
vi) Hydraulic power steering is more complicated and usually weighs more than electric
power steering.
Rising electric power steering penetration for the auto industry
Benefiting from the rising trend of fuel-efficient vehicle development, electric power
steering is likely to see an acceleration in adoption globally. In 2015, we forecast the global
automotive steering system market size to reach USD31bn (from USD23bn in 2007), while
electric power steering dominates the steering system market, with a market share of over
60%.
Electric power steering, hydraulic power steering and Others revenue split in global steering market
Source: Company, IPSOS, Daiwa forecasts
22,878 23,948
20,697
24,661 26,339 27,045 28,162 29,436 30,945
32,673 34,654
0
5,000
10,000
15,000
20,000
25,000
30,000
35,000
40,000
0
5,000
10,000
15,000
20,000
25,000
30,000
35,000
40,000
2007 2008 2009 2010 2011 2012 2013 2014 2015 E 2016 E 2017 E
(USDm)(USDm)
Electric Power Steering Hydraulic Power Steering Others
Electric power steering
is more fuel efficient,
requires less
maintenance, and is
more durable than
hydraulic power steering

7
Nexteer Automotive Group (1316 HK): 3 November 2015
Adoption of electric power steering in emerging markets still lags that in the US and Europe In 2014, China’s automotive steering system market size reached 23.89m units, from only
21m units in 2013, of which the demand for passenger car steering systems rose to 19.9m
units. In emerging markets like China, mainstream companies’ electric power steering
technology has been maturing over the past 5 years, and replacing hydraulic power
steering to take the main role in the automotive steering system market in China. However,
the adoption rate in China, at about 52%, is still behind that in the US (70%+) and
Europe/Japan (80%+).
Global trend of strengthening fuel efficiency standards to drive electric power steering growth
Electric power steering market share to increase to 74% by 2017E on greater demand for fuel efficiency Due to increasingly stringent government fuel efficiency, emissions and safety regulations
across the globe, OEMs have as a result seen increased demand for electric power
steering to replace conventional hydraulic power steering for its better fuel efficiency.
According to a recent IPSOS Report, the market share of electric power steering increased
from 44.6% in 2007 to 58.8% of the total steering industry in 2012 in terms of sales
revenue, and is expected to rise to 74.0% of the total steering industry by 2017E.
China to strengthen fuel efficiency standards by 35% in next 5 years China’s new fuel consumption standards, targeted to be implemented for passenger
vehicles (PVs) by end-2015, call for vehicle fuel consumption to be reduced to 5.0L/km (or
21.3km/litre) by 2020, from 6.9L/km (or 15.7km/litre) currently. This is lower than current
US standards and close to Japan’s (see table). Meanwhile, China has also announced that
it plans to cut CO2 emissions by 27% by 2020.
China’s fuel-consumption target is calculated by taking the weighted average number of
vehicles sold and then determining the corresponding fuel consumption per OEM. Thus,
we think the OEMs are likely to develop more electric vehicles (EVs) in the coming years,
as doing so would allow them to reduce their blended fuel consumption figures. We see
increasing demand for electric power steering in China, especially for SUV OEMs, as they
will need to develop more fuel-efficient models, given that SUVs typically consume a lot of
fuel.
Nexteer’s advanced technology is complemented by its strong technical expertise in the
field of electric power steering, which is widely considered a pioneering and industry-
leading technology. In our view, the company is poised to benefit from higher electric
power steering adoption in China.
Summary of fuel-efficiency targets: major markets in terms of car manufacturing or exports
km/l (mpg) US EU Japan China S. Korea
2005 12.4 (29.0) 15.8 (37.2) 16.7 (39.3) 11.0 (25.9) 12.3 (28.9)
2010 13.9 (33.0) 18.0 (42.3) 19.6 (46.1) 14.4 (33.9) 14.8 (34.8)
2015 15.4 (36.0) 19.7 (46.3) 21.0 (49.4) 15.7 (36.9) 16.7 (39.3)
2020 19.9 (47.0) 25.8 (60.7) 23.4 (55.0) 21.3 (50.1) 16.7 (39.3)
2025 23.9 (56.0) 30.8 (72.4) ~ 35.0 (82.3) 23.4 (55.0) 21.3 (50.1) 16.7 (39.3)
5-YOY (%) US EU Japan China S. Korea
2010 12.1% 13.9% 17.4% 30.9% 20.3%
2015 10.8% 9.4% 7.1% 9.0% 12.8%
2020 29.2% 31.0% 11.4% 35.7% 0.0%
2025 20.1% 19.4%~35.7% 0.0% 0.0% 0.0%
Improvement (%) US EU Japan China S. Korea
2010-25 71.9% 71.1%~94.4% 19.4% 47.9% 12.8%
2015-25 55.2% 56.3%~77.7% 11.4% 35.7% 0.0%
Source: ICCT
Note: No official guidance on fuel efficiency has been provided by Korea (beyond 2015), Japan (beyond 2020), or China (beyond 2020)
Higher fuel efficiency
standards and
environmental
regulations should
accelerate the adoption
of electric power
steering

8
Nexteer Automotive Group (1316 HK): 3 November 2015
CO2 emissions targets: major car markets
Year (g/km) US EU Japan China S. Korea
2005 212 162 153 n.a. 325
2010 188 140 128 180 175
2015 167 130 110 161 153
2020 126 95 105 117 153
2025 103 68~78 105 117 153
5-YoY (%) US EU Japan China S. Korea
2010 -11.3% -13.6% -16.3% n.a. -46.2%
2015 -11.2% -7.1% -14.1% -10.6% -12.6%
2020 -24.6% -26.9% -4.5% -27.3% 0.0%
2025 -18.3% -17.9~-28.4% 0.0% 0.0% 0.0%
Improvement (%) US EU Japan China S. Korea
2010-25 -45.2% -44%~-51% -18.0% -35.0% -12.6%
2015-25 -38.3% -39%~-48% -4.5% -27.3% 0.0%
Source: The International Council on Clean Transportation (ICCT)
Note: No official guidance on emissions has been provided by Korea (beyond 2015), Japan ( beyond 2020), or China (beyond 2020)
Long lead times and high earnings visibility
Barriers for OEMs to switch steering suppliers
Steering systems and driveline suppliers have to get involved in the early stage of new
automobile model design, usually 2-2.5 years (longer for some luxury brands) ahead of the
official launch of the models. Moreover, the steering suppliers typically enter into business
contracts with auto OEMs that last the whole life cycle (usually 4-7 years) of a vehicle’s
programme. Once a steering systems supplier has secured the contract for a new
programme, it is likely to predict the visible revenue contribution from that programme. It is
therefore unlikely that OEMs would switch suppliers during the course of a vehicle
programme.
Barriers to entry to the steering systems market
One of the main barriers to entry to the global driveline system market is the competitive
nature of the market, which is dominated by a few key manufacturers, including Nexteer,
JTEKT Corporation (6473 JP, JPY2,102, Outperform [2]), Germany’s ZF Lenksysteme, and
the US’s TRW Automotive, which all have typically established long-term relationships with
auto OEMs.
Other barriers include limited access to relevant technology, and the capital-intensive
nature of the industry. High investment is needed for continuous testing of new products
and development. Steering systems suppliers must have strong technical and engineering
capabilities in vehicle integration and software development. New entrants lacking
sufficient capital and technical capability will face difficulties meeting the stringent
requirements of world-class automotive manufacturers.
New business opportunities typically arise only when new models of vehicles are
developed or existing models undergo a design enhancement. OEMs conduct a global
supplier search to source the next generation of such vehicle programmes, which may or
may not include the incumbent supplier. Each new vehicle programme includes new
requirements for suppliers, including new design specifications.
Global auto demand still strong despite China slowdown
Enjoys the largest market share in the US
During the conference call for the company’s 3Q update, Nexteer management said the
company’s automobile sales in North America had maintained solid momentum and
continued to be strong. According to Wards, year-to-September overall US automobile
sales were up 5%, largely driven by 11% growth in the light trucks segment. Nexteer had
the largest market share of more than 30% in terms of sales revenue from steering
systems in 2014, by our estimate, and is therefore well positioned to gain from the steady
growth of the US automobile market.
High entry barriers given
technology and capital
requirements, plus long
lead times, provide good
earnings visibility

9
Nexteer Automotive Group (1316 HK): 3 November 2015
US: light vehicle sales volume and growth US: truck vehicle sales volume and growth
Source: Wards Source: Wards
Recovering EU automobile market
Light vehicle sales in the EU market have recovered to 9% YoY growth in the YTD to end-
September 2015, from 6% YoY growth for 2014. Management noted that auto sales for
3Q15 picked up and that the 4Q15 number could see a further improvement. The company
targets for its EU operation to enjoy a natural hedge by increasing localisation in the region
by next year.
EU: passenger vehicle sales volume and growth EU: commercial vehicle sales volume and growth
Source: ACEA Source: ACEA
Considerable exposure to China’s SUV market According to management, about 90% of Nexteer’s revenue in China is derived from
steering and driveline systems for SUVs, MPVs and minivans, sub-segments that tend to
significantly outperform the overall automobile market in China. For instance, in the YTD to
September, the SUV and MPV sales volumes grew by 50% and 11%, respectively, while
the overall passenger vehicles market edged up by 3% only. A large proportion of
Nexteer’s products are for PVs with small engines (<1.6L), which should also benefit from
China’s reduction in September of its purchase tax cut to 5% (previously 10%).
China: passenger vehicle sales volume and growth China: SUV sales volume and growth
Source: CAAM Source: CAAM
0%
2%
4%
6%
8%
10%
12%
14%
16%
0
2,000,000
4,000,000
6,000,000
8,000,000
10,000,000
12,000,000
14,000,000
16,000,000
2011 2012 2013 2014 2015 YTDSep
(YoY %)(Units)
US Light vehicle sales YoY % (RHS)
0%
2%
4%
6%
8%
10%
12%
14%
0
1,000,000
2,000,000
3,000,000
4,000,000
5,000,000
6,000,000
7,000,000
8,000,000
9,000,000
2011 2012 2013 2014 2015 YTD Sep
(YoY %) (Units)
US Light trucks YoY % (RHS)
(10%)
(5%)
0%
5%
10%
0
2,000,000
4,000,000
6,000,000
8,000,000
10,000,000
12,000,000
14,000,000
2011 2012 2013 2014 2015 YTDSep
(YoY %)(Units)
EU PV YoY % (RHS)
(15%)
(10%)
(5%)
0%
5%
10%
15%
0
200,000
400,000
600,000
800,000
1,000,000
1,200,000
1,400,000
1,600,000
1,800,000
2011 2012 2013 2014 2015 YTDSep
(YoY %)(Units)
EU <= 3.5t YoY % (RHS)
0%
2%
4%
6%
8%
10%
12%
14%
16%
18%
0
5,000,000
10,000,000
15,000,000
20,000,000
2011 2012 2013 2014 2015 YTDSep
(YoY %)(Units)
China PV sales YoY % (RHS)
0%
10%
20%
30%
40%
50%
60%
0
500,000
1,000,000
1,500,000
2,000,000
2,500,000
3,000,000
3,500,000
4,000,000
4,500,000
2011 2012 2013 2014 2015 YTDSep
(YoY %)(Units)
China SUV salse YoY % (RHS)
Stable US auto market,
recovering EU market,
and gaining market
share in China, with
focus on outperforming
SUV segment

10
Nexteer Automotive Group (1316 HK): 3 November 2015
AVIC as a controlling shareholder
China market share likely to increase, benefiting from AVIC’s SOE background
AVIC, Nexteer’s controlling shareholder (through Pacific Century Motor [PCM], of which
AVIC owns 51%), is a China SOE conglomerate with businesses spanning several
segments, including defence, helicopters, avionic systems, general aviation, asset
management, financial services and automobiles. PCM, a subsidiary of Beijing E-Town, an
investment arm of the Beijing Government, bought a 100% stake in Nexteer from GM in
2010. AVIC then purchased a 51% stake in PCM in 2011, becoming Nexteer’s largest
shareholder.
Following the AVIC acquisition, we believe Nexteer will gradually start competing more
aggressively in China, taking advantage of parent AVIC’s SOE background. For example,
two of the auto-related companies controlled by AVIC, namely Zhuzhou Yilida Electrical
Mechanical (Yilida) and Yubei Steering System (Yubei Steering), are engaged in the
steering business. Both are not listed and their technology lags that of Nexteer. It is
therefore possible, in our view, that Nexteer will leverage on its parent AVIC to expand its
own steering business in China. Nexteer has also indicated its interest in expanding the
China business through acquisitions and alliances in both the automotive and direction
motion businesses, to achieve greater autonomous functionality in the longer term.
Competitive landscape
With the expansion of the global automotive market, demand for steering systems has
showed steady growth. In 2014, the size of the global automotive steering system market
exceeded 90m units, with revenue of USD31.1bn. Electric power steering has a dominant
position in the steering system market, with a share of more than 60%.
The size of China’s automotive steering system market increased to 23.89m units in 2014
from 21m units in 2013, of which the demand for passenger car steering systems rose to
19.92m units. In China, the electric power steering technology of the mainstream
manufacturing companies has become more mature over the past 5 years, with product
demand growing rapidly, and electric power steering replacing hydraulic power steering as
the main role in the automotive steering system market.
The global automotive steering system market is highly concentrated, with only 6 big
producers, namely, JTEKT Corporation, ZF Lenksysteme, TRW, NSK (6471 JP,
JPY1,442, , Hold [3]) , Korea’s Mando (204320 KS, KRW146,500, Underperform [4]), and
Nexteer. In 2014, a 100% stake of the world's second-largest steering system
manufacturer in terms of revenue and volume, ZF Lenksysteme, was acquired by Bosch,
while ZF Lenksysteme acquired the third-ranked TRW Automotive in 2014.
In China, JTEKT and other foreign manufacturers still hold dominant positions. At the same
time, local China enterprises, such as China Automotive Systems (CAAS), Zhejiang
Shibao, FAWER Automotive Parts and AVIC-Xihang Yubei have been increasing their
market shares. As China's largest steering system group, CAAS operates its business
through 8 subsidiaries. In China, CAAS serves mainly Geely (175 HK, HKD4.09, Buy [1],
Great Wall Motors (2333 HK, HKD9.50, Underperform [4]), Brilliance Jinbei, BYD (1211
HK, HKD47.7, Outperform [2]), Beiqi Foton, Dongfeng Motor, FAW Group and Chery.
Leveraging AVIC’s
network in china
automobile industry,
Nexteer looks set to gain
market share in China
Electric power steering
is a competitive but
growing industry
11
Nexteer Automotive Group (1316 HK): 3 November 2015
Nexteer: key metrics vs peers
Price PER (x) Gross margin Net margin EPS growth EPS CAGR PEG
11/2/2015 2015E 2016E 2017E 2015E 2016E 2017E 2015E 2016E 2017E 2015E 2016E 2017E (%) (x)
Nexteer Automotive* 8.28 13.2 11.3 9.9 15.2% 15.4% 15.5% 6.1% 6.3% 6.4% 25.1% 16.8% 14.0% 15.4 0.9
Jtekt Corp** 2093 13.1 11.9 11.0 15.4% 15.8% 16.0% 3.9% 4.2% 4.4% 24.3% 10.6% 7.5% 9.0 1.5
NSK** 1422 11.1 10.7 10.3 23.2% 23.6% 24.1% 6.9% 7.0% 7.1% 15.3% 3.9% 4.3% 4.1 2.7
Mando Corp* 146500 10.5 8.6 7.1 14.3% 15.1% 15.1% 2.6% 2.8% 3.2% 173.0% 22.4% 20.7% 21.5 0.5
Source: *Daiwa forecasts, Bloomberg, **calendarised earnings
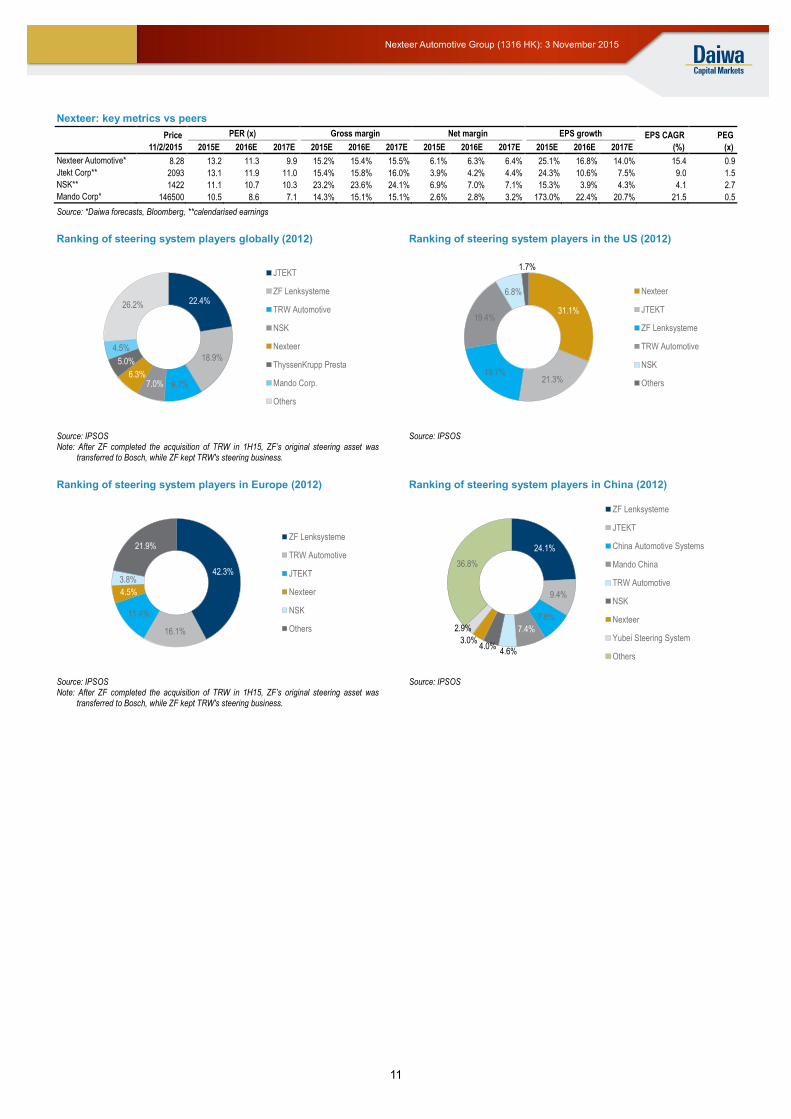
Ranking of steering system players globally (2012) Ranking of steering system players in the US (2012)
Source: IPSOS Note: After ZF completed the acquisition of TRW in 1H15, ZF’s original steering asset was
transferred to Bosch, while ZF kept TRW's steering business.
Source: IPSOS
Ranking of steering system players in Europe (2012) Ranking of steering system players in China (2012)
Source: IPSOS Note: After ZF completed the acquisition of TRW in 1H15, ZF’s original steering asset was
transferred to Bosch, while ZF kept TRW's steering business.
Source: IPSOS
22.4%
18.9%
9.7%7.0%6.3%
5.0%
4.5%
26.2%
JTEKT
ZF Lenksysteme
TRW Automotive
NSK
Nexteer
ThyssenKrupp Presta
Mando Corp.
Others
31.1%
21.3%19.7%
19.4%
6.8%
1.7%
Nexteer
JTEKT
ZF Lenksysteme
TRW Automotive
NSK
Others
42.3%
16.1%
11.4%
4.5%
3.8%
21.9%ZF Lenksysteme
TRW Automotive
JTEKT
Nexteer
NSK
Others
24.1%
9.4%
7.8%
7.4%
4.6%4.0%
3.0%
2.9%
36.8%
ZF Lenksysteme
JTEKT
China Automotive Systems
Mando China
TRW Automotive
NSK
Nexteer
Yubei Steering System
Others
12
Nexteer Automotive Group (1316 HK): 3 November 2015
A leading steering manufacturer
Rich backlog, extensive electric power steering exposure
Heavy backlog should drive future earnings growth
Nexteer had a big backlog of orders worth USD11.5bn as at end-3Q15 (equivalent to 3.4x
backlog coverage), with 77% of its backlog comprising electric power steering system
orders, compared with only a 65% electric power steering backlog mix at end-2014.
We expect the proportion of electric power steering revenue in Nexteer’s overall revenue
mix to continue to increase, driven by the low penetration rate of these systems in
emerging markets, including China. As discussed earlier in this report, there is a 2-2.5 year
lead time for a new programme to be launched, and it is likely to last for the vehicle’s entire
life cycle, averaging about 4-7 years. As such, its large order backlog gives Nexteer high
earnings growth visibility for the next few years, in our view.
Nexteer: backlog composition
Source: Company
New programmes focussed on SUVs and MPVs
Continuous new programme launches should support Nexteer’s future earnings growth.
We expect Nexteer’s exposure to GM’s and Ford’s SUVs in the US, as well as SAIC-GM-
Wuling’s SUVs and MPVs in China, to drive 12%+ YoY revenue growth for the company for
2015-17E.
Nexteer’s effort to diversify its markets and customers over the past few years is proof of
its leading position in the competitive steering industry, in our view. For example, Nexteer
secured 50% of the shipment volume for BMW’s UKL platform in 2010, with a supply life
cycle over 2013-20. The UKL platform is for BMW’s 1-Series and 2-Series. It also supplies
BMW’s i3 EV with its single-pinion electronic power steering system. Nexteer also has
contracts with Ford and GM’s delta platform.
Main vehicle models globally that use steering system products
OEMs Vehicle Name Nexteer products
North America:
GM Chevy Silverado Truck, Tahoe SUV & Savana Van Column, 1-Shaft, hydraulic power steering, rack-assist electric power steering
GM Chevy Impala Column-assist electric power steering
Ford Ford F-150 Truck & SUV Rack-assist electric power steering, column
Ford Ford Mustang Rack-assist electric power steering
FCA Ram Truck Rack-assist electric power steering
FCA Fiat 500 Column-assist electric power steering
Europe:
FCA Fiat Punto, Panda & 500 Column-assist electric power steering
PSA Peugeot Citroen Citroen C3 & DS3 Single pinion-assist electric power steering
GM Opel Corsa Column-assist electric power steering
Other regions:
Shanghai GM Sonic & Captiva SUV Column-assist electric power steering
Source: Company
0
2
4
6
8
10
12
14
0
2
4
6
8
10
12
14
End of 2014 End of 1Q15 End of 2Q15 End of 3Q15
(USDbn)(USDbn)
Electric Power Steering Hydraulic Power Steering Column/CIS Halfshaft/Driveline
USD11.5bn USD11.5bn
USD9bn USD9bn
Nexteer has a rich order
backlog, with a large
proportion of electric
power steering system
orders
We see continuous new
programme launches
driving 12%-plus YoY
revenue earnings growth
in 2015-17E

13
Nexteer Automotive Group (1316 HK): 3 November 2015
Main vehicle models globally that use driveline system products
OEMs Vehicle Name Nexteer products
North America:
GM Silverado, Tahoe, Malibu, Lacross, Regal, Cruze, Impala, Camaro & ATS Halfshafts
GM Equinox, Terrain, Traverse & Enclave Halfshafts, Intermediate Drive Shafts
Chrysler Ram Truck, 300 & Liberty Halfshafts
Chrysler Mini Van Halfshafts, Intermediate Drive Shafts
Other regions:
PSA Peugeot Citroen Brazil Various models Halfshafts
Chinese local OEMs Various models Halfshafts
Indian local OEMs Various models Halfshafts
Source: Company
Product programmes launched by various OEMs in 2015
OEMs Vehicle Name Nexteer products Launch time
North America:
GM Equinox, Terrain Halfshafts 1Q15
Ford F550, F650, F750 Column 2Q15
GM Chevy Volt Halfshafts 3Q15
GM Heavy duty Chevy Silverado, GM Sierras Hydraulic power steering 3Q15
China:
Ford Ranger, Everest Hydraulic power steering 2Q15
SAIC-GM-Wuling Bao Jun 560 Rack-assist electric power steering 2Q15
SAIC-GM-Wuling Hong Guang S1 Brush column-assist electric power steering 2Q15
FCA Fiat 225 E6 Brush column-assist electric power steering 2Q15
Changan CS75 Halfshafts 3Q15
Other regions:
Renault Clio, Kangoo Hydraulic power steering 1Q15
Suzuki Every & Every Wagon Column 1Q15
Renault Logan, Sandero, Hydraulic power steering 2Q15
Mahindra Jeeto Halfshafts 2Q15
Eicher Polaris Multix Halfshafts 2Q15
Ford Mustang Electric power steering 3Q15
Renault Kwind Halfshafts 3Q15
Tata Indica Halfshafts 3Q15
Maruti-Suzuki Swift Halfshafts 3Q15
Source: Company
Financial forecasts
Nexteer’s 15%+ earnings CAGR driven by increasing electric power steering adoption in China coupled with its existing strong US presence
We forecast the revenue generated from the China market to account for 20% of Nexteer’s
total revenue in 2015, and further increase to 24% by 2017E, from 16% in 2014. For the
US market, which is largest revenue contributor, Nexteer should see strong momentum in
SUV and pick-up truck sales, while we think Europe should see signs of recovery by the
end of this year. We forecast 40%/10%/0% YoY revenue growth for Nexteer from China/the
US/Europe, respectively, for 2015.
Nexteer’s increasing portion of electric power steering in its revenue mix (from 56% in
2014 to 66% by 2017E) should stand the company in good stead amid the ongoing shift
from hydraulic power steering to electric power steering, especially in emerging markets
like China. Such a high level of electric power steering revenue suggests further margin
expansion for the company over the next 3 years, as electric power steering products
usually carry ASPs that are more than 2x higher than those for hydraulic power steering,
as well as higher margins.
As a result, we forecast Nexteer’s overall revenue to increase by 12% per year for 2015-
17E, backed by market-share gains in China, while its net profit rises by 25%/17%/14%
YoY for 2015-17E, outperforming top-line growth as a result of a strong 2.4pp rise in the
EBITDA margin to 14.4% by 2017E from 12% in 2014.
Increasing revenue
contribution from China
despite slowing China
auto market
Revenue growth backed
by China market-share
gains

14
Nexteer Automotive Group (1316 HK): 3 November 2015
Nexteer: revenue projection by region Nexteer: revenue mix by region
Source: Company, Daiwa forecasts Source: Company, Daiwa forecasts
Nexteer: revenue projection by product Nexteer: revenue mix by product
Source: Company, Daiwa forecasts Source: Company, Daiwa forecasts
Improving cash flow and gearing
Net of maintenance capex of USD287m, we forecast the company’s free cash flow to turn
positive in 2015, and enable it to reduce its net gearing to 40% in 2015E from 51% in 2014.
We look for ROE of 26% for 2015E, but see this figure gradually falling to 23% by 2017E
on further deleveraging. We assume a dividend payout ratio of 20%. The current share
price suggests 1.5%/1.8% dividend yields for 15E/16E. In our view, Nexteer’s healthy
balance sheet will enable it to expand its existing business and seize any new businesses
opportunities.
Nexteer: FCF and debt/equity ratio
Source: Company, Daiwa forecasts
Raw-material costs a large proportion of cost of sales
The company’s raw-material costs accounted for the largest proportion, at 67%, of
Nexteer’s cost of sales in 2014, while manufacturing expenses comprised 30%. Its raw
materials, which are mostly used in castings, machine parts, motors, and bearings, etc.,
are affected by commodities prices, including steel, rare earth magnet materials, aluminium
and copper. The company’s practice is to negotiate certain contracts that permit it to fully
1,697 2,042 2,246 2,471 2,668
303 363
363 381
419
262
468 655
819 1,024
125
105
73 73
73
0
500
1,000
1,500
2,000
2,500
3,000
3,500
4,000
4,500
0
500
1,000
1,500
2,000
2,500
3,000
3,500
4,000
4,500
2013 2014 2015E 2016E 2017E
(USDm)(USDm)
North America Europe China RoW
71% 69% 67% 66% 64%
13% 12% 11% 10% 10%
11% 16% 20% 22% 24%
5% 4% 2% 2% 2%
0%
20%
40%
60%
80%
100%
0%
20%
40%
60%
80%
100%
2013 2014 2015E 2016E 2017E
(Mix %)(Mix %)
North America Europe China RoW
1,085 1,668
2,002 2,402
2,883 320
183 146
117
94
513
583 630
680
735
470
544 560
545
474
0
500
1,000
1,500
2,000
2,500
3,000
3,500
4,000
4,500
0
500
1,000
1,500
2,000
2,500
3,000
3,500
4,000
4,500
2013 2014 2015E 2016E 2017E
(USDm)(USDm)
Electric Power Steering Hydraulic Power Steering Column Driveline
45%56% 60% 64% 69%
13%6% 4%
3%2%21% 20% 19% 18%18%
20% 18% 17% 15% 11%
0%
20%
40%
60%
80%
100%
0%
20%
40%
60%
80%
100%
2013 2014 2015E 2016E 2017E
(Mix %)(Mix %)
Electric Power Steering Hydraulic Power Steering Column Driveline
0%
10%
20%
30%
40%
50%
60%
(150)
(100)
(50)
0
50
100
150
200
2013 2014 2015E 2016E 2017 E
(Net debt / equity ratio,%)(USDm)
Free Cash Flow (LHS) Net debt/ equity ratio (RHS)
We look for net gearing
to decline to 38% this
year

15
Nexteer Automotive Group (1316 HK): 3 November 2015
or partially pass on certain raw-material price increases, particularly price increases related
to steel, to mitigate the impact on its margins.
Nexteer: cost of sales breakdown (2014)
Source: Company
Nexteer: income statement
(In USDm except otherwise indicated) 2013 2014 2015E 2016E 2017E
Revenue 2,387 2,978 3,338 3,745 4,185
YoY growth (RHS) 10% 25% 12% 12% 12%
Rev by region:
North America 1,697 2,042 2,246 2,471 2,668
Europe 303 363 363 381 419
China 262 468 655 819 1,024
RoW 125 105 73 73 73
Rev Mix by regions
North America 71% 69% 67% 66% 64%
Europe 13% 12% 11% 10% 10%
China 11% 16% 20% 22% 24%
RoW 5% 4% 2% 2% 2%
Rev by product:
Steering – electric power steering 1,085 1,668 2,002 2,402 2,883
Steering - hydraulic power steering 320 183 146 117 94
Column 513 583 630 680 735
Driveline 470 544 560 545 474
Rev Mix by product:
Steering - electric power steering 45% 56% 60% 64% 69%
Steering - hydraulic power steering 13% 6% 4% 3% 2%
Column 21% 20% 19% 18% 18%
Driveline 20% 18% 17% 15% 11%
Gross profit 339 420 508 577 649
YoY growth 25% 24% 21% 14% 12%
Gross margin 14.2% 14.1% 15.2% 15.4% 15.5%
EBITDA 248 356 447 523 602
YoY growth 70% 44% 25% 17% 15%
EBITDA margin 10.4% 12.0% 13.4% 14.0% 14.4%
EBIT 175 238 298 341 386
YoY growth 97% 36% 26% 15% 13%
EBIT margin 7.3% 8.0% 8.9% 9.1% 9.2%
Net income, post-exceptionals 109 161 202 236 269
YoY growth 91% 48% 25% 17% 14%
Net margin 4.6% 5.4% 6.1% 6.3% 6.4%
ROE 29.6% 25.8% 26.3% 24.8% 23.2%
ROA 7.1% 8.0% 8.6% 9.0% 9.2%
SG&A/revenue -6.8% -6.0% -5.9% -5.9% -5.9%
Source: Company, Daiwa forecasts
Valuation and recommendation
We initiate coverage of Nexteer with a Buy (1) rating and 12-month target price of
HKD9.70, based on a 2016E PER of 13x, representing 17% upside potential from the
current share price level. We believe Nexteer’s leading position in the steering business,
potentially stronger-than-peer earnings CAGR (which we forecast at 15%+ over 2015-17E)
and ROE (c25%+ for 2015-16E) and increasing exposure to the SUV segment
outperforming the China market, justify the stock trading at a valuation premium to its
peers. Nexteer’s global automotive parts peers are trading currently at weighted average
2016F PER of 13.1x, based on the Bloomberg-consensus forecasts. Our target multiple for
Raw material67%
Manufacturing expense30%
Other expenses2%
We believe Nexteer
should trade at the high
end of its peers’ range,
backed by its higher
ROE and earnings
growth, especially in
China SUV market

16
Nexteer Automotive Group (1316 HK): 3 November 2015
Nexteer represents the average of the global auto parts players’ valuation, but is at a high
end of its steering peers’ range – a premium we believe is well deserved.
Auto fuel efficiency standards are currently being strengthened across the globe, which is
resulting in an acceleration in the shift to electric power steering from hydraulic power
steering. Nexteer, as one of the world’s leading steering systems manufacturers, should
benefit from its substantial electric power steering revenue portion, leading to higher
margins and earnings growth for the company.
By 2020, the company targets to have become a top-3 steering supplier in China, the
largest auto market in the world. About 90% of Nexteer’s revenue in China is derived from
SUVs, MPVs and minivans, the sub-segments that since this year have significantly
outperformed (in terms of volume) the overall automobile market in China. New vehicle
programmes from OEMs also provide good delivery visibility and sold earnings growth.
Nexteer: PER bands Nexteer: PBR bands
Source: Bloomberg, Daiwa forecasts Source: Bloomberg, Daiwa forecasts
Auto parts: valuation comparisons
Name
Bloomberg Trading
Share price
Market cap Rating PER (x) PBR (x) EV/EBITDA(x) Div yield (%) ROE (%)
code currency USDm
FY15E FY16E FY15E FY16E FY15E FY16E FY15E FY16E FY15E FY16E
China H-share listed
Nexteer Automotive * 1316 HK HKD 8.28 2669 Buy 13.2 11.3 3.1 2.5 6.8 5.7 1.5 1.8 26.3 24.8
Minth Group
425 HK HKD 16.04 2290 NR 11.6 9.9 1.5 1.4 9.0 7.7 3.3 3.7 14.2 14.8
Johnson Electric Holdings ** 179 HK HKD 27.90 3170 NR 14.2 13.2 1.5 1.4 7.4 6.9 1.9 2.1 11.3 11.3
Japan
Jtekt Corp *,** 6473 JP JPY 2093.00 5956 NR 13.1 11.9 1.4 1.3 5.9 5.6 1.9 2.1 11.0 11.3
Nsk Ltd *, ** 6471 JP JPY 1422.00 6498 Neutral 11.1 10.7 1.5 1.4 6.3 6.1 2.4 2.6 14.2 13.1
Ntn Corp ** 6472 JP JPY 552.00 2437 NR 9.1 8.6 1.1 1.0 6.0 6.0 1.9 2.6 12.2 11.2
Denso Corp *, ** 6902 JP JPY 5546.00 40645 Outperform 15.4 13.8 1.3 1.2 6.5 6.1 2.2 2.4 8.5 8.9
Aisin Seiki *, ** 7259 JP JPY 4820.00 11774 Outperform 14.3 12.6 1.1 1.0 4.4 4.0 2.1 2.4 7.9 8.5
S.Korea
Hyundai Mobis * 012330 KS KRW 240000.00 20543 Buy 7.1 6.2 0.9 0.8 4.2 3.4 1.5 1.7 13.2 13.6
Mando Corp * 204320 KS KRW 146500.00 1210 Underperform 10.5 8.6 1.0 0.8 5.7 5.7 3.3 3.7 10.5 10.9
Halla Holdings Corp
060980 KS KRW 56500.00 537 NR 3.1 2.7 0.4 0.4 1.8 1.5 1.8 1.8 15.1 15.2
US
Dana Holding Corp
DAN US USD 16.80 2569 NR 9.3 9.2 2.7 2.3 4.9 4.8 1.3 1.3 27.5 27.1
Johnson Controls Inc *** JCI US USD 45.18 29551 NR 13.3 11.8 2.6 2.5 9.3 8.6 2.3 2.4 19.3 21.1
Delphi Automotive Plc
DLPH US USD 83.19 23301 NR 16.1 13.4 9.4 7.0 10.7 9.2 1.2 1.3 56.0 59.4
Autoliv Inc
ALV US USD 121.24 10679 NR 19.1 16.6 3.0 2.8 9.3 8.4 1.9 2.1 14.9 17.2
Visteon Corp
VC US USD 109.07 4410 NR 55.6 36.8 1.7 2.3 8.4 7.2 n.a. n.a. 4.0 5.2
Others
Motherson Sumi Systems ** MSS IN INR 245.05 4938 NR 23.1 16.2 7.8 6.1 7.3 5.8 1.5 2.0 35.9 39.6
Tong Yang Industry
1319 TT TWD 36.45 663 NR 16.0 13.2 1.2 1.2 7.2 6.7 2.7 3.5 7.5 8.9
Valeo Sa
FR FP EUR 142.35 12461 NR 15.8 14.1 3.4 2.9 6.8 6.2 1.9 2.2 22.3 21.7
Magna International Inc
MG CN CAD 68.96 21330 NR 11.5 9.7 1.8 1.9 6.7 5.7 1.6 1.8 22.2 24.3
Total
Weighted average
14.7 13.1 2.8 2.4 7.2 6.5 1.9 2.1 19.8 21.0
High
55.6 36.8 9.4 7.0 10.7 9.2 3.3 3.7 56.0 59.4
Low
3.1 2.7 0.4 0.4 1.8 1.5 1.2 1.3 4.0 5.2
Median
13.2 11.8 1.5 1.4 6.7 6.0 1.9 2.1 14.2 14.2
Source: Bloomberg, *Daiwa forecasts Note: **Mar year-end, *** Sep year-end, Japan companies are based on calendarised earnings Pricing as of 2 November 2015 for Asia stocks, and 30 October 2015 for North America and Europe stocks
2
3
4
5
6
7
8
9
10
Oct
-13
Nov
-13
Dec
-13
Jan-
14
Feb
-14
Mar
-14
Apr
-14
May
-14
Jun-
14
Jul-1
4
Aug
-14
Sep
-14
Oct
-14
Nov
-14
Dec
-14
Jan-
15
Feb
-15
Mar
-15
Apr
-15
May
-15
Jun-
15
Jul-1
5
Aug
-15
Sep
-15
Oct
-15
Nov
-15
(HKD)
Historical Avg PER: 10.3x
13x
12x
11x
10x
9x8x
2
3
4
5
6
7
8
9
10
11
Oct
-13
Nov
-13
Dec
-13
Jan-
14
Feb
-14
Mar
-14
Apr
-14
May
-14
Jun-
14
Jul-1
4
Aug
-14
Sep
-14
Oct
-14
Nov
-14
Dec
-14
Jan-
15
Feb
-15
Mar
-15
Apr
-15
May
-15
Jun-
15
Jul-1
5
Aug
-15
Sep
-15
Oct
-15
Nov
-15
(HKD)
1.0x
1.5x
2.0x
2.5x
3.0x
3.5x
Historical Avg PBR: 2.4x

17
Nexteer Automotive Group (1316 HK): 3 November 2015
Risks to our call
Main risk: high customer concentration
Nexteer’s top-3 customers (including GM, FCA and Ford) accounted for 79% of its revenue
in 1H15. Its largest customer, GM, accounted for 49% of Nexteer’s global sales, with the
next 2 largest customers making up a further 19% and 12%, respectively. The loss of any
one of these customers could have a material adverse effect on the company’s financial
condition.
Worse-than-expected automobile sales
The steering business is directly related to automotive sales and production, which are
highly cyclical and depend on general economic conditions and consumer spending.
Slower-than-expected auto sales in the US (Nexteer’s largest market) and China
(increasing exposure) would have a negative impact on the company’s financial
performance.
Foreign-exchange risk
Since Nexteer reports in USD, a strong USD, especially against the Euro and CNY, can
lead to translation losses, even though the company targets to limit its currency exposure
through natural hedges in Europe by 2016.

18
Nexteer Automotive Group (1316 HK): 3 November 2015
Company background
Listed on the Stock Exchange of Hong Kong, Nexteer is a global manufacturer of steering
and driveline products, with more than 10,000 employees and 20 manufacturing plants
worldwide, as well as 14 local customer support centres and 5 regional engineering and
test centres. The company is the fourth-largest steering-parts supplier by market share. It
has more than 60 customers globally, including BMW, GM, Ford, Chrysler, Fiat, Toyota,
PSA Peugeot Citroen, and other manufacturers in North America, Europe, China and
South America.
Nexteeer: revenue breakdown by product type (2014)
Source: Company
Company history Nexteer: development milestones
Year Event
1906 Founded as Jackson, Church & Wilcox Co. in the US
1909 Acquired by GM’s Buick
1917 Separated from Buick and became Jackson, Church, Wilcox Division, the first automotive parts manufacturing division of GM
1950s Saginaw Safety Power Steering was made available to the market
1968 Introduced anti-theft steering column to the market. Energy-absorbing steering column is a critical element of governmental safety legislation in developed markets such as the US and Europe, while anti-theft functionality is a critical technical requirement
1976 Rack and pinion (R&P) steering system was introduced to the market on the AMC Pacer. This system provides a more direct steer ing connection with greater road feedback to the driver
1995 Expanded into the China market by establishing Nexteer Zhuozhou, a joint venture, in China to produce halfshafts
1995 Advanced systems centre opened in Saginaw, Michigan
1995 Delphi EPS system was made available to the market
1995 Vehicle evaluation test track commenced construction in Saginaw, Michigan, to facilitate faster development of steering and driveline products
1996 Expanded into the India market by constructing a manufacturing facility in Bangalore to produce halfshafts
1998 Launched EPS business with Volkswagen
1998 Expanded into Poland market by commencing construction of a manufacturing facility in Tychy, Poland to produce axle shafts
1998 Organized as a division of Delphi Corporation, which was created by GM
1999 Became a division of an independent publicly held corporation after Delphi Corporation was spun off from GM
1999 Received Pace Award for E-STEER electronic power steering from Automotive News. The Automotive News Pace Awards honour superior innovation, technological advancement and business performance among automotive suppliers
1999 Launched the driveline business with Volkswagen
2000 Received Shingo Prize for Excellence Award from The Shingo Prize for Operational Excellence, which is awarded to organisations demonstrating the sound application of improvement techniques across an enterprise
2000 International Organization for Standardization 140001 certification obtained for the manufacturing site in the US
2003 Introduced Delphi EPS on the Fiat Panda, the European Car of the Year in 2004
2006 100-year anniversary
2006 Introduced Driver Protection Module and One Touch Adjustable Column to the market
2007 Launched the electronic power steering product with Ford
2009 Acquired by GM and renamed Nexteer Automotive
2010 Acquired by PCM China from GM
2010 High Output 12 Volt Rack EPS debuts on Ford Mustang and Ford F-150 Truck
2011 AVIC Auto acquired a 51% interest in PCM China from Beijing E-Town
2012 Expanded product portfolio by securing contract for entry-level CEPS products
2012 Grew high-output REPS business by contracting with an additional global OEM customer
2012 Contracted for the first global business with Volkswagen
2013 Listed on the Hong Kong Stock Exchange
Source: Company
USD1,668m;rev mix 56%
USD183m;6%
USD 583m;20%
USD 544m; 18% Electric Power Steering
Hydraulic Power Steering
Column
Driveline

19
Nexteer Automotive Group (1316 HK): 3 November 2015
Nexteer: shareholding structure
Source: Company
Products
What is power steering?
Power steering is a system that helps to steer a vehicle’s wheels using a source of power
other than the driver’s manual force. Nexteer is mainly engaged in the manufacturing of: 1)
steering systems that include electronic power steering, hydraulic power steering, and
steering columns, and 2) driveline systems including halfshafts, intermediate drive shafts
and propeller shaft joints. Its products are used on a broad range of vehicles, from small
passenger cars to full-size trucks.
Electronic power steering
Electronic power steering uses an electric motor to assist the driver in steering. Depending
on the type of electric power steering system, a computer module applies assistive power
via an electric motor coupled directly to either the steering gear or steering column.
1) Column-assist electric power steering integrates the system electronics (motor,
controller and sensor) and assists mechanism with the steering column. Auto OEMs
that use Nexteer’s column-assist electric power steering products include GM in small
cars, such as the Aveo, Shanghai GM in the Sonic and Captiva sports utility vehicles,
and Fiat Chrysler in small cars such as the Fiat 500. In China, the company has
introduced a new entry-level brush motor column-assist electric power steering (brush
column-assist electric power steering) specifically tailored for developing markets.
OEMs that use Nexteer’s Brush column-assist electric power steering include SAIC-
GM-Wuling Automobile for the Wuling Hongguang S micro van and Zheng Cheng.
2) Rack-assist electric power steering integrates the electric assist mechanism with
the steering rack, and they are contained under the hood/bonnet in the engine
compartment. Nexteer’s rack-assist electric power steering customers include Ford for
the F-150 pickup truck and Mustang, Fiat Chrysler in the Ram pickup truck, and GM in
AVIC Automobile Industry Holding Co., Ltd
(China)
100%
Pacific Century Motors, Inc.
(China)
49% 51%
Nexteer Automotive (Hong Kong) Holding Limited
(Hong Kong) Other Shareholders
Nexteer Automotive Group Limited
(1316 HK)
67% 33%
Beijing E-Town International Investment & Development Co.,
Ltd.
(China)

20
Nexteer Automotive Group (1316 HK): 3 November 2015
various half-ton trucks and SUVs. The company also supplies rack-assist electric
power steering for performance vehicles including the Ford Mustang, Dodge Charger
and Dodge Challenger.
3) Single pinion-assist electric power steering integrates the electric assist
mechanism with the steering gear pinion shaft. The company’s single pinion-assist
electric power steering customers include PSA Peugeot Citroën in the Citroën C3 and
DS3, Dongfeng Peugeot Citroën in the Citroën C-Elysée and Peugeot 2008, and BMW
in the 1-series, the i3 and the Mini Cooper line.
Hydraulic power steering
HPS uses high pressure fluids to assist driver steering, where an engine-driven power
steering pump creates system pressure. When the driver turns the steering wheel, it opens
up the flow of pressurised fluid, turning the wheels in the required direction. Nexteer’s OEM
customers that use steering gears include GM in its three-quarter-ton trucks and large
vans, and Fiat Chrysler in various light commercial vehicles. OEM customers that use
steering pumps include Fiat Chrysler, GM and PSA Peugeot Citroën.
Column-assist electric power steering Rack-assist electric power steering
Source: Company Source: Company
Single pinion-assist electric power steering Hydraulic power steering
Source: Company Source: Company
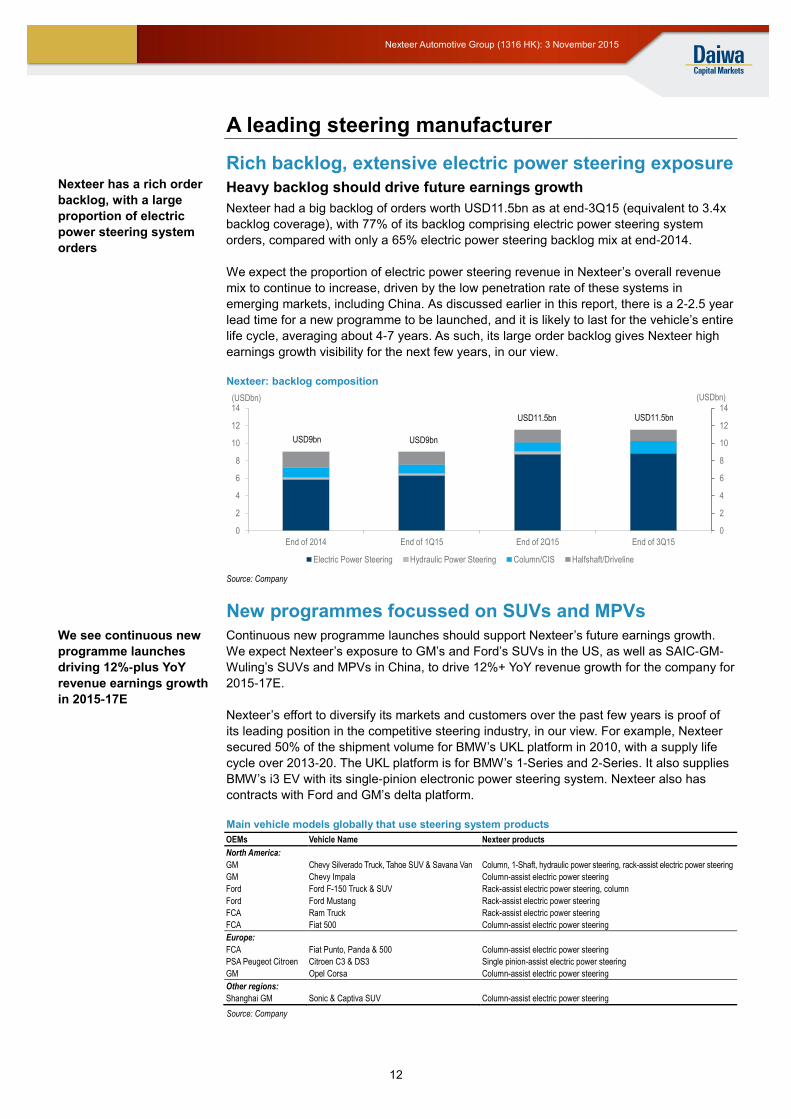
Steering columns and intermediate shafts
Steering columns and intermediate shafts connect the steering wheel to the steering
mechanism and control steering by transferring the driver’s input torque from the steering
wheel. The company designs these products for small cars, SUVs and trucks. OEM
customers for steering columns include GM for various full-size trucks, large vans and the
Chevy Impala, and Ford in the F-150 pickup truck.
21
Nexteer Automotive Group (1316 HK): 3 November 2015
Steering column
Source: Company
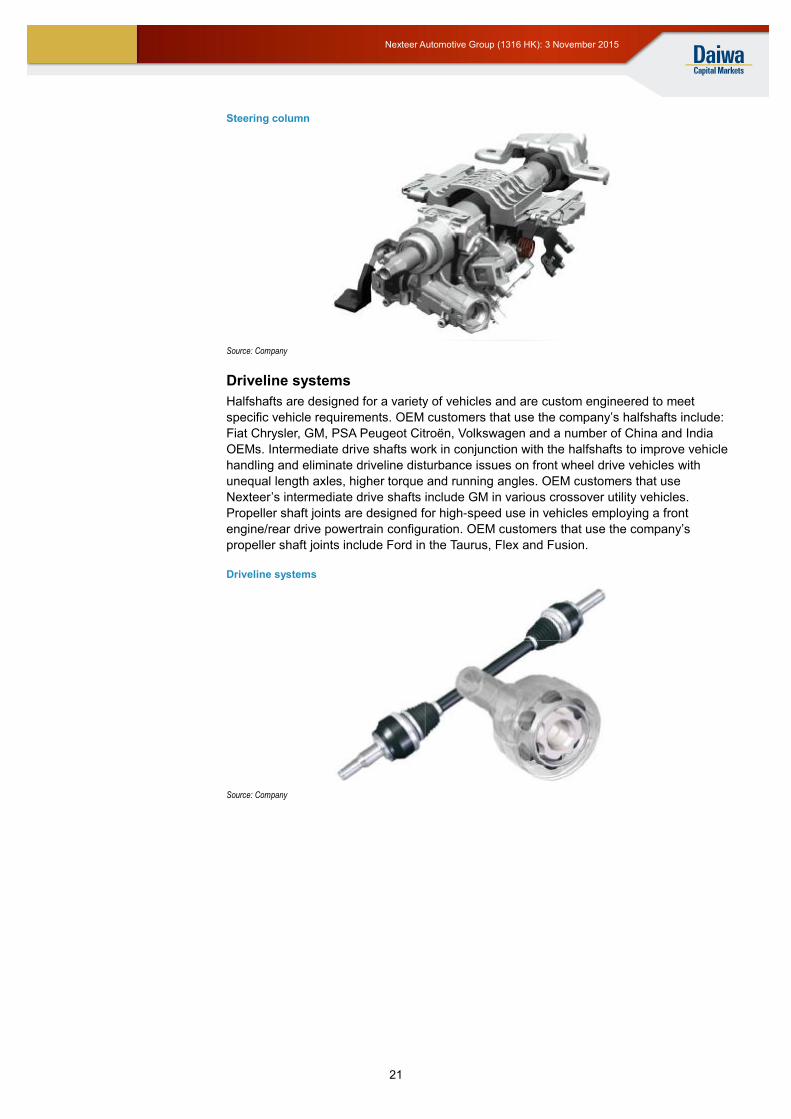
Driveline systems
Halfshafts are designed for a variety of vehicles and are custom engineered to meet
specific vehicle requirements. OEM customers that use the company’s halfshafts include:
Fiat Chrysler, GM, PSA Peugeot Citroën, Volkswagen and a number of China and India
OEMs. Intermediate drive shafts work in conjunction with the halfshafts to improve vehicle
handling and eliminate driveline disturbance issues on front wheel drive vehicles with
unequal length axles, higher torque and running angles. OEM customers that use
Nexteer’s intermediate drive shafts include GM in various crossover utility vehicles.
Propeller shaft joints are designed for high-speed use in vehicles employing a front
engine/rear drive powertrain configuration. OEM customers that use the company’s
propeller shaft joints include Ford in the Taurus, Flex and Fusion.
Driveline systems
Source: Company
22
Nexteer Automotive Group (1316 HK): 3 November 2015
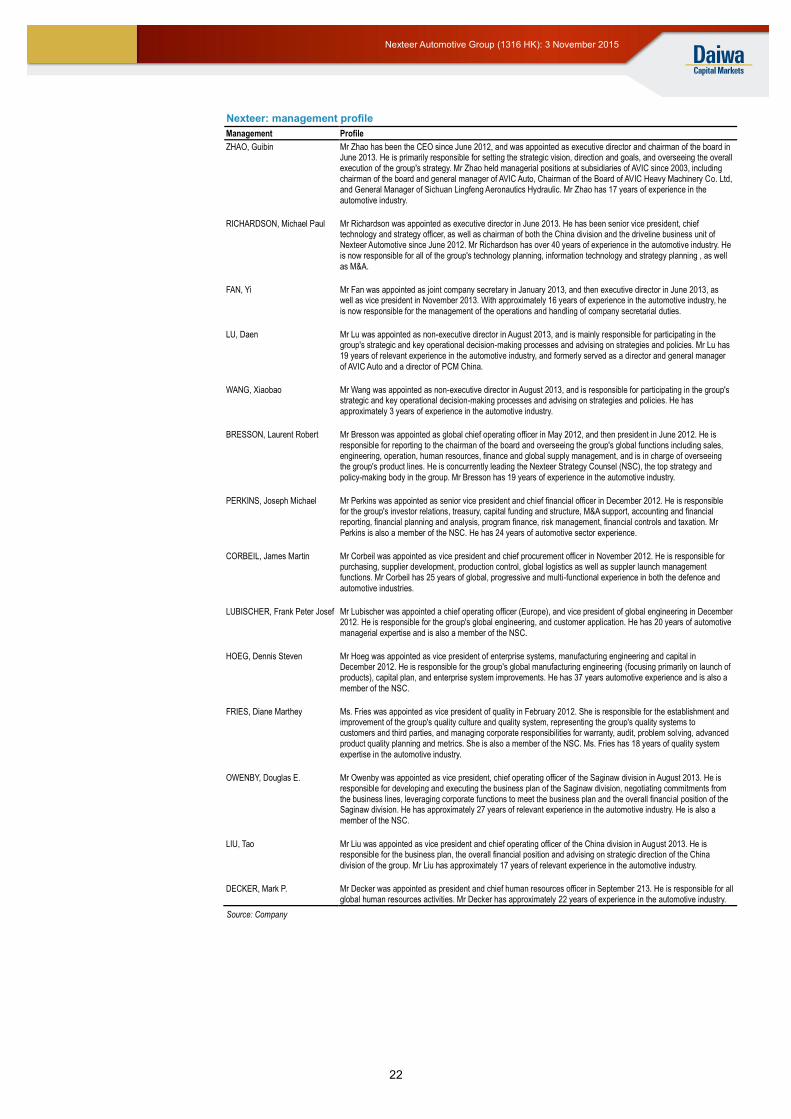
Nexteer: management profile
Management Profile
ZHAO, Guibin Mr Zhao has been the CEO since June 2012, and was appointed as executive director and chairman of the board in June 2013. He is primarily responsible for setting the strategic vision, direction and goals, and overseeing the overall execution of the group's strategy. Mr Zhao held managerial positions at subsidiaries of AVIC since 2003, including chairman of the board and general manager of AVIC Auto, Chairman of the Board of AVIC Heavy Machinery Co. Ltd, and General Manager of Sichuan Lingfeng Aeronautics Hydraulic. Mr Zhao has 17 years of experience in the automotive industry.
RICHARDSON, Michael Paul Mr Richardson was appointed as executive director in June 2013. He has been senior vice president, chief technology and strategy officer, as well as chairman of both the China division and the driveline business unit of Nexteer Automotive since June 2012. Mr Richardson has over 40 years of experience in the automotive industry. He is now responsible for all of the group's technology planning, information technology and strategy planning , as well as M&A.
FAN, Yi Mr Fan was appointed as joint company secretary in January 2013, and then executive director in June 2013, as well as vice president in November 2013. With approximately 16 years of experience in the automotive industry, he is now responsible for the management of the operations and handling of company secretarial duties.
LU, Daen Mr Lu was appointed as non-executive director in August 2013, and is mainly responsible for participating in the group's strategic and key operational decision-making processes and advising on strategies and policies. Mr Lu has 19 years of relevant experience in the automotive industry, and formerly served as a director and general manager of AVIC Auto and a director of PCM China.
WANG, Xiaobao Mr Wang was appointed as non-executive director in August 2013, and is responsible for participating in the group's strategic and key operational decision-making processes and advising on strategies and policies. He has approximately 3 years of experience in the automotive industry.
BRESSON, Laurent Robert Mr Bresson was appointed as global chief operating officer in May 2012, and then president in June 2012. He is responsible for reporting to the chairman of the board and overseeing the group's global functions including sales, engineering, operation, human resources, finance and global supply management, and is in charge of overseeing the group's product lines. He is concurrently leading the Nexteer Strategy Counsel (NSC), the top strategy and policy-making body in the group. Mr Bresson has 19 years of experience in the automotive industry.
PERKINS, Joseph Michael Mr Perkins was appointed as senior vice president and chief financial officer in December 2012. He is responsible for the group's investor relations, treasury, capital funding and structure, M&A support, accounting and financial reporting, financial planning and analysis, program finance, risk management, financial controls and taxation. Mr Perkins is also a member of the NSC. He has 24 years of automotive sector experience.
CORBEIL, James Martin Mr Corbeil was appointed as vice president and chief procurement officer in November 2012. He is responsible for purchasing, supplier development, production control, global logistics as well as suppler launch management functions. Mr Corbeil has 25 years of global, progressive and multi-functional experience in both the defence and
automotive industries.
LUBISCHER, Frank Peter Josef Mr Lubischer was appointed a chief operating officer (Europe), and vice president of global engineering in December 2012. He is responsible for the group's global engineering, and customer application. He has 20 years of automotive managerial expertise and is also a member of the NSC.
HOEG, Dennis Steven Mr Hoeg was appointed as vice president of enterprise systems, manufacturing engineering and capital in December 2012. He is responsible for the group's global manufacturing engineering (focusing primarily on launch of products), capital plan, and enterprise system improvements. He has 37 years automotive experience and is also a member of the NSC.
FRIES, Diane Marthey Ms. Fries was appointed as vice president of quality in February 2012. She is responsible for the establishment and improvement of the group's quality culture and quality system, representing the group's quality systems to customers and third parties, and managing corporate responsibilities for warranty, audit, problem solving, advanced product quality planning and metrics. She is also a member of the NSC. Ms. Fries has 18 years of quality system expertise in the automotive industry.
OWENBY, Douglas E. Mr Owenby was appointed as vice president, chief operating officer of the Saginaw division in August 2013. He is responsible for developing and executing the business plan of the Saginaw division, negotiating commitments from the business lines, leveraging corporate functions to meet the business plan and the overall financial position of the Saginaw division. He has approximately 27 years of relevant experience in the automotive industry. He is also a member of the NSC.
LIU, Tao Mr Liu was appointed as vice president and chief operating officer of the China division in August 2013. He is responsible for the business plan, the overall financial position and advising on strategic direction of the China division of the group. Mr Liu has approximately 17 years of relevant experience in the automotive industry.
DECKER, Mark P. Mr Decker was appointed as president and chief human resources officer in September 213. He is responsible for all global human resources activities. Mr Decker has approximately 22 years of experience in the automotive industry.
Source: Company

23
Nexteer Automotive Group (1316 HK): 3 November 2015
Daiwa’s Asia Pacific Research Directory
HONG KONG
Takashi FUJIKURA (852) 2848 4051 [email protected]
Regional Research Head
Kosuke MIZUNO (852) 2848 4949 / (852) 2773 8273
Regional Research Co-head
John HETHERINGTON (852) 2773 8787 [email protected]
Regional Deputy Head of Asia Pacific Research
Rohan DALZIELL (852) 2848 4938 [email protected]
Regional Head of Product Management
Kevin LAI (852) 2848 4926 [email protected]
Chief Economist for Asia ex-Japan; Macro Economics (Regional)
Christie CHIEN (852) 2848 4482 [email protected]
Macro Economics (Regional); Banking; Insurance (Taiwan)
Junjie TANG (852) 2773 8736 [email protected]
Macro Economics (China)
Jonas KAN (852) 2848 4439 [email protected]
Head of Hong Kong and China Property
Cynthia CHAN (852) 2773 8243 [email protected]
Property (China)
Leon QI (852) 2532 4381 [email protected]
Banking (Hong Kong/China); Broker (China); Insurance (China)
Anson CHAN (852) 2532 4350 [email protected]
Consumer (Hong Kong/China)
Jamie SOO (852) 2773 8529 [email protected]
Gaming and Leisure (Hong Kong/China)
Dennis IP (852) 2848 4068 [email protected]
Power; Utilities; Renewables and Environment (Hong Kong/China)
John CHOI (852) 2773 8730 [email protected]
Head of Hong Kong and China Internet; Regional Head of Small/Mid Cap
Kelvin LAU (852) 2848 4467 [email protected]
Head of Automobiles; Transportation and Industrial (Hong Kong/China)
Brian LAM (852) 2532 4341 [email protected]
Transportation – Railway; Construction and Engineering (China)
Jibo MA (852) 2848 4489 [email protected]
Head of Custom Products Group
Thomas HO (852) 2773 8716 [email protected]
Custom Products Group
PHILIPPINES
Bianca SOLEMA (63) 2 737 3023 [email protected]
Utilities and Energy
SOUTH KOREA
Sung Yop CHUNG (82) 2 787 9157 [email protected]
Pan-Asia Co-head/Regional Head of Automobiles and Components; Automobiles; Shipbuilding; Steel
Mike OH (82) 2 787 9179 [email protected]
Banking; Capital Goods (Construction and Machinery)
Iris PARK (82) 2 787 9165 [email protected]
Consumer/Retail
SK KIM (82) 2 787 9173 [email protected]
IT/Electronics – Semiconductor/Display and Tech Hardware
Thomas Y KWON (82) 2 787 9181 [email protected]
Pan-Asia Head of Internet & Telecommunications; Software – Internet/On-line Game
TAIWAN
Rick HSU (886) 2 8758 6261 [email protected]
Head of Regional Technology; Head of Taiwan Research; Semiconductor/IC Design (Regional)
Steven TSENG (886) 2 8758 6252 [email protected]
IT/Technology Hardware (PC Hardware)
Christine WANG (886) 2 8758 6249 [email protected]
IT/Technology Hardware (Automation); Pharmaceuticals and Healthcare; Consumer
Kylie HUANG (886) 2 8758 6248 [email protected]
IT/Technology Hardware (Handsets and Components)
Helen CHIEN (886) 2 8758 6254 [email protected]
Small/Mid Cap
INDIA
Punit SRIVASTAVA (91) 22 6622 1013 [email protected]
Head of India Research; Strategy; Banking/Finance
Saurabh MEHTA (91) 22 6622 1009 [email protected]
Capital Goods; Utilities
SINGAPORE
Ramakrishna MARUVADA (65) 6499 6543 [email protected]
Head of Singapore Research; Telecommunications (China/ASEAN/India)
Royston TAN (65) 6321 3086 [email protected]
Oil and Gas; Capital Goods
David LUM (65) 6329 2102 [email protected]
Property and REITs
Shane GOH (65) 64996546 [email protected]
Small/Mid Cap (Singapore)
Jame OSMAN (65) 6321 3092 [email protected]
Telecommunications (ASEAN/India); Pharmaceuticals and Healthcare; Consumer (Singapore)

24
Nexteer Automotive Group (1316 HK): 3 November 2015
Daiwa’s Offices
Office / Branch / Affiliate Address Tel Fax
DAIWA SECURITIES GROUP INC
HEAD OFFICE Gran Tokyo North Tower, 1-9-1, Marunouchi, Chiyoda-ku, Tokyo, 100-6753 (81) 3 5555 3111 (81) 3 5555 0661
Daiwa Securities Trust Company One Evertrust Plaza, Jersey City, NJ 07302, U.S.A. (1) 201 333 7300 (1) 201 333 7726
Daiwa Securities Trust and Banking (Europe) PLC (Head Office) 5 King William Street, London EC4N 7JB, United Kingdom (44) 207 320 8000 (44) 207 410 0129
Daiwa Europe Trustees (Ireland) Ltd Level 3, Block 5, Harcourt Centre, Harcourt Road, Dublin 2, Ireland (353) 1 603 9900 (353) 1 478 3469
Daiwa Capital Markets America Inc. New York Head Office Financial Square, 32 Old Slip, New York, NY10005, U.S.A. (1) 212 612 7000 (1) 212 612 7100
Daiwa Capital Markets America Inc. San Francisco Branch 555 California Street, Suite 3360, San Francisco, CA 94104, U.S.A. (1) 415 955 8100 (1) 415 956 1935
Daiwa Capital Markets Europe Limited, London Head Office 5 King William Street, London EC4N 7AX, United Kingdom (44) 20 7597 8000 (44) 20 7597 8600
Daiwa Capital Markets Europe Limited, Frankfurt Branch Neue Mainzer Str. 1, 60311 Frankfurt/Main, Germany (49) 69 717 080 (49) 69 723 340
Daiwa Capital Markets Europe Limited, Paris Representative Office 17, rue de Surène 75008 Paris, France (33) 1 56 262 200 (33) 1 47 550 808
Daiwa Capital Markets Europe Limited, Geneva Branch 50 rue du Rhône, P.O.Box 3198, 1211 Geneva 3, Switzerland (41) 22 818 7400 (41) 22 818 7441
Daiwa Capital Markets Europe Limited, Moscow Representative Office
Midland Plaza 7th Floor, 10 Arbat Street, Moscow 119002, Russian Federation
(7) 495 641 3416 (7) 495 775 6238
Daiwa Capital Markets Europe Limited, Bahrain Branch 7th Floor, The Tower, Bahrain Commercial Complex, P.O. Box 30069, Manama, Bahrain
(973) 17 534 452 (973) 17 535 113
Daiwa Capital Markets Hong Kong Limited Level 28, One Pacific Place, 88 Queensway, Hong Kong (852) 2525 0121 (852) 2845 1621
Daiwa Capital Markets Singapore Limited 6 Shenton Way #26-08, OUE Downtown 2, Singapore 068809, Republic of Singapore
(65) 6220 3666 (65) 6223 6198
Daiwa Capital Markets Australia Limited Level 34, Rialto North Tower, 525 Collins Street, Melbourne, Victoria 3000, Australia
(61) 3 9916 1300 (61) 3 9916 1330
DBP-Daiwa Capital Markets Philippines, Inc 18th Floor, Citibank Tower, 8741 Paseo de Roxas, Salcedo Village, Makati City, Republic of the Philippines
(632) 813 7344 (632) 848 0105
Daiwa-Cathay Capital Markets Co Ltd 14/F, 200, Keelung Road, Sec 1, Taipei, Taiwan, R.O.C. (886) 2 2723 9698 (886) 2 2345 3638
Daiwa Securities Capital Markets Korea Co., Ltd. 20 Fl.& 21Fl. One IFC, 10 Gukjegeumyung-Ro, Yeongdeungpo-gu, Seoul, Korea
(82) 2 787 9100 (82) 2 787 9191
Daiwa Securities Co. Ltd., Beijing Representative Office Room 301/302,Kerry Center,1 Guanghua Road,Chaoyang District,
Beijing 100020, People’s Republic of China
(86) 10 6500 6688 (86) 10 6500 3594
Daiwa (Shanghai) Corporate Strategic Advisory Co. Ltd. 44/F, Hang Seng Bank Tower, 1000 Lujiazui Ring Road, Pudong, Shanghai China 200120 , People’s Republic of China
(86) 21 3858 2000 (86) 21 3858 2111
Daiwa Securities Co. Ltd., Bangkok Representative Office 18th Floor, M Thai Tower, All Seasons Place, 87 Wireless Road,
Lumpini, Pathumwan, Bangkok 10330, Thailand (66) 2 252 5650 (66) 2 252 5665
Daiwa Capital Markets India Private Ltd 10th Floor, 3 North Avenue, Maker Maxity, Bandra Kurla Complex, Bandra East, Mumbai – 400051, India
(91) 22 6622 1000 (91) 22 6622 1019
Daiwa Securities Co. Ltd., Hanoi Representative Office Suite 405, Pacific Palace Building, 83B, Ly Thuong Kiet Street, Hoan Kiem Dist. Hanoi, Vietnam
(84) 4 3946 0460 (84) 4 3946 0461
DAIWA INSTITUTE OF RESEARCH LTD
HEAD OFFICE 15-6, Fuyuki, Koto-ku, Tokyo, 135-8460, Japan (81) 3 5620 5100 (81) 3 5620 5603
MARUNOUCHI OFFICE Gran Tokyo North Tower, 1-9-1, Marunouchi, Chiyoda-ku, Tokyo, 100-6756 (81) 3 5555 7011 (81) 3 5202 2021
New York Research Center 11th Floor, Financial Square, 32 Old Slip, NY, NY 10005-3504, U.S.A. (1) 212 612 6100 (1) 212 612 8417
London Research Centre 3/F, 5 King William Street, London, EC4N 7AX, United Kingdom (44) 207 597 8000 (44) 207 597 8550
25
Nexteer Automotive Group (1316 HK): 3 November 2015
Important Disclosures and Disclaimer
This publication is produced by Daiwa Securities Group Inc. and/or its non-U.S. affiliates, and distributed by Daiwa Securities Group Inc. and/or its non-U.S. affiliates, except to the extent expressly provided herein. This publication and the contents hereof are intended for information purposes only, and may be subject to change without further notice. Any use, disclosure, distribution, dissemination, copying, printing or reliance on this publication for any other purpose without our prior consent or approval is strictly prohibited. Neither Daiwa Securities Group Inc. nor any of its respective parent, holding, subsidiaries or affiliates, nor any of its respective directors, officers, servants and employees, represent nor warrant the accuracy or completeness of the information contained herein or as to the existence of other facts which might be significant, and will not accept any responsibility or liability whatsoever for any use of or reliance upon this publication or any of the contents hereof. Neither this publication, nor any content hereof, constitute, or are to be construed as, an offer or solicitation of an offer to buy or sell any of the securities or investments mentioned herein in any country or jurisdiction nor, unless expressly provided, any recommendation or investment opinion or advice. Any view, recommendation, opinion or advice expressed in this publication may not necessarily reflect those of Daiwa Securities Group Inc., and/or its affiliates nor any of its respective directors, officers, servants and employees except where the publication states otherwise. This research report is not to be relied upon by any person in making any investment decision or otherwise advising with respect to, or dealing in, the securities mentioned, as it does not take into account the specific investment objectives, financial situation and particular needs of any person. Daiwa Securities Group Inc., its subsidiaries or affiliates, or its or their respective directors, officers and employees from time to time have trades as principals, or have positions in, or have other interests in the securities of the company under research including market making activities, derivatives in respect of such securities or may have also performed investment banking and other services for the issuer of such securities. The following are additional disclosures.
Ownership of Securities
For “Ownership of Securities” information, please visit BlueMatrix disclosure link at https://daiwa3.bluematrix.com/sellside/Disclosures.action.
Investment Banking Relationship
For “Investment Banking Relationship”, please visit BlueMatrix disclosure link at https://daiwa3.bluematrix.com/sellside/Disclosures.action.
Japan
Daiwa Securities Co. Ltd. and Daiwa Securities Group Inc.
Daiwa Securities Co. Ltd. is a subsidiary of Daiwa Securities Group Inc.
Investment Banking Relationship
Within the preceding 12 months, the subsidiaries and/or affiliates of Daiwa Securities Group Inc. * has lead-managed public offerings and/or secondary offerings (excluding straight bonds) of the securities of the following companies: Modern Land (China) Co. Ltd (1107 HK); econtext Asia Ltd (1390 HK); Accordia Golf Trust (AGT SP); Hua Hong Semiconductor Ltd (1347 HK); GF Securities Co Ltd (1776 HK); Mirae Asset Life Insurance Co Ltd (085620 KS).
*Subsidiaries of Daiwa Securities Group Inc. for the purposes of this section shall mean any one or more of: Daiwa Capital Markets Hong Kong Limited (大和資本市場香港有限公司), Daiwa
Capital Markets Singapore Limited, Daiwa Capital Markets Australia Limited, Daiwa Capital Markets India Private Limited, Daiwa-Cathay Capital Markets Co., Ltd., Daiwa Securities Capital Markets Korea Co., Ltd.
Hong Kong
This research is distributed in Hong Kong by Daiwa Capital Markets Hong Kong Limited (大和資本市場香港有限公司) (“DHK”) which is regulated by the Hong Kong Securities and Futures
Commission. Recipients of this research in Hong Kong may contact DHK in respect of any matter arising from or in connection with this research. Relevant Relationship (DHK)
DHK may from time to time have an individual employed by or associated with it serves as an officer of any of the companies under its research coverage.
Singapore
This research is distributed in Singapore by Daiwa Capital Markets Singapore Limited and it may only be distributed in Singapore to accredited investors, expert investors and institutional investors as defined in the Financial Advisers Regulations and the Securities and Futures Act (Chapter 289), as amended from time to time. By virtue of distribution to these category of investors, Daiwa Capital Markets Singapore Limited and its representatives are not required to comply with Section 36 of the Financial Advisers Act (Chapter 110) (Section 36 relates to disclosure of Daiwa Capital Markets Singapore Limited’s interest and/or its representative’s interest in securities). Recipients of this research in Singapore may contact Daiwa Capital Markets Singapore Limited in respect of any matter arising from or in connection with the research.
Australia
This research is distributed in Australia by Daiwa Capital Markets Australia Limited and it may only be distributed in Australia to wholesale investors within the meaning of the Corporations Act. Recipients of this research in Australia may contact Daiwa Capital Markets Stockbroking Limited in respect of any matter arising from or in connection with the research.
India
This research is distributed in India to Institutional Clients only by Daiwa Capital Markets India Private Limited (Daiwa India) which is an intermediary registered with Securities & Exchange Board of India as a Stock Broker, Merchant Bank and Research Analyst. Daiwa India, its Research Analyst and their family members and its associates do not have any financial interest save as disclosed or other undisclosed material conflict of interest in the securities or derivatives of any companies under coverage. Daiwa India and its associates may have received compensation for any products other than Investment Banking (as disclosed) or brokerage services from the subject company in this report during the past 12 months. Unless otherwise stated in BlueMatrix disclosure link at https://daiwa3.bluematrix.com/sellside/Disclosures.action, Daiwa India and its associates do not hold more than 1% of any companies covered in this research report. There is no material disciplinary action against Daiwa India by any regulatory authority impacting equity research analysis activities as of the date of this report.
Taiwan
This research is distributed in Taiwan by Daiwa-Cathay Capital Markets Co., Ltd and it may only be distributed in Taiwan to institutional investors or specific investors who have signed recommendation contracts with Daiwa-Cathay Capital Markets Co., Ltd in accordance with the Operational Regulations Governing Securities Firms Recommending Trades in Securities to Customers. Recipients of this research in Taiwan may contact Daiwa-Cathay Capital Markets Co., Ltd in respect of any matter arising from or in connection with the research.
Philippines This research is distributed in the Philippines by DBP-Daiwa Capital Markets Philippines, Inc. which is regulated by the Philippines Securities and Exchange Commission and the Phil ippines Stock Exchange, Inc. Recipients of this research in the Philippines may contact DBP-Daiwa Capital Markets Philippines, Inc. in respect of any matter arising from or in connection with the research. DBP-Daiwa Capital Markets Philippines, Inc. recommends that investors independently assess, with a professional advisor, the specific financial risks as well as the legal, regulatory, tax, accounting, and other consequences of a proposed transaction. DBP-Daiwa Capital Markets Philippines, Inc. may have positions or may be materially interested in the securities in any of the markets mentioned in the publication or may have performed other services for the issuers of such securities.
For relevant securities and trading rules please visit SEC and PSE links at http://www.sec.gov.ph/irr/AmendedIRRfinalversion.pdf and http://www.pse.com.ph/ respectively.
Thailand
This research is distributed to only institutional investors in Thailand primarily by Thanachart Securities Public Company Limited (“TNS”).
This report is prepared by analysts who are employed by Daiwa Securities Group Inc. and/or its non-U.S. affiliates. This report is provided to you for informational purposes only and it is not, and is not to be construed as, an offer or an invitation to make an offer to sell or buy any securities. Neither Thanachart Securities Public Company Limited, Daiwa Securities Group Inc. nor any of their respective parent, holding, subsidiaries or affiliates, nor any of their respective directors, officers, servants and employees accept any liability whatsoever for any direct or consequential loss arising from any use of this research or its contents.
The information and opinions contained herein have been compiled or arrived at from sources believed to be reliable. However, Thanachart Securities Public Company Limited, Daiwa Securities Group Inc. nor any of their respective parent, holding, subsidiaries or affiliates, nor any of their respective directors, officers, servants and employees make no representation or warranty, express or implied, as to their accuracy or completeness. Expressions of opinion herein are subject to change without notice. The use of any information, forecasts and opinions contained in this report shall be at the sole discretion and risk of the user.
Daiwa Securities Group Inc. and/or its non-U.S. affiliates perform and seek to perform business with companies covered in this research. Thanachart Securities Public Company Limited, Daiwa Securities Group Inc., their respective parent, holding, subsidiaries or affiliates, their respective directors, officers, servants and employees may have positions and financial interest in securities mentioned in this research. Thanachart Securities Public Company Limited, Daiwa Securities Group Inc., their respective parent, holding, subsidiaries or affiliates may from time to time perform investment banking or other services for, or solicit investment banking or other business from, any entity mentioned in this research. Therefore, investors should be aware of conflict of interest that may affect the objectivity of this research.
United Kingdom This research report is produced by Daiwa Securities Co. Ltd. and/or its affiliates and is distributed in the European Union, Iceland, Liechtenstein, Norway and Switzerland. Daiwa Capital Markets Europe Limited is authorised and regulated by The Financial Conduct Authority (“FCA”) and is a member of the London Stock Exchange and Eurex. This publication is intended for investors who are not Retail Clients in the United Kingdom within the meaning of the Rules of the FCA and should not therefore be distributed to such Retail Clients in the United Kingdom. Should you enter into investment business with Daiwa Capital Markets Europe’s affiliates outside the United Kingdom, we are obliged to advise that the protection afforded by the United Kingdom regulatory system may not apply; in particular, the benefits of the Financial Services Compensation Scheme may not be available.

26
Nexteer Automotive Group (1316 HK): 3 November 2015
Daiwa Capital Markets Europe Limited has in place organisational arrangements for the prevention and avoidance of conflicts of interest. Our conflict management policy is available at http://www.uk.daiwacm.com/about-us/corporate-governance-regulatory.
Germany
This document is distributed in Germany by Daiwa Capital Markets Europe Limited, Niederlassung Frankfurt which is regulated by BaFin (Bundesanstalt fuer Finanzdienstleistungsaufsicht) for the conduct of business in Germany.
Bahrain
This research material is distributed in Bahrain by Daiwa Capital Markets Europe Limited, Bahrain Branch, regulated by The Central Bank of Bahrain and holds Investment Business Firm – Category 2 license and having its official place of business at the Bahrain World Trade Centre, South Tower, 7th floor, P.O. Box 30069, Manama, Kingdom of Bahrain. Tel No. +973 17534452 Fax No. +973 535113
United States
This report is distributed in the U.S. by Daiwa Capital Markets America Inc. (DCMA). It may not be accurate or complete and should not be relied upon as such. It reflects the preparer’s views at the time of its preparation, but may not reflect events occurring after its preparation; nor does it reflect DCMA’s views at any time. Neither DCMA nor the preparer has any obligation to update this report or to continue to prepare research on this subject. This report is not an offer to sell or the solicitation of any offer to buy securities. Unless this report says otherwise, any recommendation it makes is risky and appropriate only for sophisticated speculative investors able to incur significant losses. Readers should consult their financial advisors to determine whether any such recommendation is consistent with their own investment objectives, financial situation and needs. This report does not recommend to U.S. recipients the use of any of DCMA’s non-U.S. affiliates to effect trades in any security and is not supplied with any understanding that U.S. recipients of this report will direct commission business to such non-U.S. entities. Unless applicable law permits otherwise, non-U.S. customers wishing to effect a transaction in any securities referenced in this material should contact a Daiwa entity in their local jurisdiction. Most countries throughout the world have their own laws regulating the types of securities and other investment products which may be offered to their residents, as well as a process for doing so. As a result, the securities discussed in this report may not be eligible for sales in some jurisdictions. Customers wishing to obtain further information about this report should contact DCMA: Daiwa Capital Markets America Inc., Financial Square, 32 Old Slip, New York, New York 10005 (Tel no. 212-612-7000).
Ownership of Securities
For “Ownership of Securities” information please visit BlueMatrix disclosure link at https://daiwa3.bluematrix.com/sellside/Disclosures.action.
Investment Banking Relationships
For “Investment Banking Relationships” please visit BlueMatrix disclosure link at https://daiwa3.bluematrix.com/sellside/Disclosures.action. DCMA Market Making
For “DCMA Market Making” please visit BlueMatrix disclosure link at https://daiwa3.bluematrix.com/sellside/Disclosures.action.
Research Analyst Conflicts
For updates on “Research Analyst Conflicts” please visit BlueMatrix disclosure link at https://daiwa3.bluematrix.com/sellside/Disclosures.action. The principal research analysts who prepared this report have no financial interest in securities of the issuers covered in the report, are not (nor are any members of their household) an officer, director or advisory board member of the issuer(s) covered in the report, and are not aware of any material relevant conflict of interest involving the analyst or DCMA, and did not receive any compensation from the issuer during the past 12 months except as noted: no exceptions.
Research Analyst Certification
For updates on “Research Analyst Certification” and “Rating System” please visit BlueMatrix disclosure link at https://daiwa3.bluematrix.com/sellside/Disclosures.action. The views about any and all of the subject securities and issuers expressed in this Research Report accurately reflect the personal views of the research analyst(s) primarily responsible for this report (or the views of the firm producing the report if no individual analysts[s] is named on the report); and no part of the compensation of such analyst(s) (or no part of the compensation of the firm if no individual analyst[s)] is named on the report) was, is, or will be directly or indirectly related to the specific recommendations or views contained in this Research Report.
The following explains the rating system in the report as compared to relevant local indices, unless otherwise stated, based on the beliefs of the author of the report.
"1": the security could outperform the local index by more than 15% over the next 12 months. "2": the security is expected to outperform the local index by 5-15% over the next 12 months. "3": the security is expected to perform within 5% of the local index (better or worse) over the next 12 months. "4": the security is expected to underperform the local index by 5-15% over the next 12 months. "5": the security could underperform the local index by more than 15% over the next 12 months. Disclosure of investment ratings
Rating Percentage of total
Buy* 63.8%
Hold** 22.2%
Sell*** 14.0%
Source: Daiwa
Notes: data is for single-branded Daiwa research in Asia (ex Japan) and correct as of 30 September 2015. * comprised of Daiwa’s Buy and Outperform ratings. ** comprised of Daiwa’s Hold ratings. *** comprised of Daiwa’s Underperform and Sell ratings. Additional information may be available upon request.
Japan - additional notification items pursuant to Article 37 of the Financial Instruments and Exchange Law
(This Notification is only applicable where report is distributed by Daiwa Securities Co. Ltd.)
If you decide to enter into a business arrangement with us based on the information described in materials presented along with this document, we ask you to pay close attention to the following items.
In addition to the purchase price of a financial instrument, we will collect a trading commission* for each transaction as agreed beforehand with you. Since commissions may be included in the purchase price or may not be charged for certain transactions, we recommend that you confirm the commission for each transaction.
In some cases, we may also charge a maximum of ¥ 2 million (including tax) per year as a standing proxy fee for our deposit of your securities, if you are a non-resident of Japan.
For derivative and margin transactions etc., we may require collateral or margin requirements in accordance with an agreement made beforehand with you. Ordinarily in such cases, the amount of the transaction will be in excess of the required collateral or margin requirements.
There is a risk that you will incur losses on your transactions due to changes in the market price of financial instruments based on fluctuations in interest rates, exchange rates, stock prices, real estate prices, commodity prices, and others. In addition, depending on the content of the transaction, the loss could exceed the amount of the collateral or margin requirements.
There may be a difference between bid price etc. and ask price etc. of OTC derivatives handled by us.
Before engaging in any trading, please thoroughly confirm accounting and tax treatments regarding your trading in financial instruments with such experts as certified public accountants. *The amount of the trading commission cannot be stated here in advance because it will be determined between our company and you based on current market conditions and the content of each transaction etc.
When making an actual transaction, please be sure to carefully read the materials presented to you prior to the execution of agreement, and to take responsibility for your own decisions regarding the signing of the agreement with us.
Corporate Name: Daiwa Securities Co. Ltd. Financial instruments firm: chief of Kanto Local Finance Bureau (Kin-sho) No.108 Memberships: Japan Securities Dealers Association, The Financial Futures Association of Japan Japan Securities Investment Advisers Association Type II Financial Instruments Firms Association