Initiating Coverage Orient Refractories - Rakesh...
15
IndiaNivesh Securities Ltd IndiaNivesh Securities Limited|Research Analyst SEBI Registration No:INH0000000511 601 & 602, Sukh Sagar, N. S. Patkar Marg, Girgaum Chowpatty, Mumbai 400 007. Tel: (022) 66188800 IndiaNivesh Research is also available on Bloomberg INNS, Thomson First Call, Reuters and Factiva INDNIV. Orient Refractories Ltd MNC at Trough Valuation Initiating Coverage 21 June 2016 Current Previous CMP : Rs 87 Rating : BUY Rating : NA Target : Rs 112 Target : NA (NR‐Not Rated) STOCK INFO INDEX BSE 534076 NSE ORIENTREF Bloomberg ORIENT IN EQUITY Reuters ORIENT.BO Sector Metal & Mining Face Value (Rs) 1 Equity Capital (Rs mn) 120 Mkt Cap (Rs mn) 10,440 52w H/L (Rs) 97 / 70 Avg Daily Vol (BSE+NSE) 60,314 SHAREHOLDING PATTERN % (as on Mar. 2016) Promoters 69.6 FIIs ‐ DIIs 11.5 Public & Others 18.9 STOCK PERFORMANCE(%) 3m 6m 12m ORIENT IN EQUITY 18.0 5.6 2.5 SENSEX 6.0 4.2 (1.8) Source: Bloomberg, IndiaNivesh Research ORIENT IN EQUITY v/s SENSEX Source: Bloomberg, IndiaNivesh Research Daljeet S. Kohli Head of Research Tel: +91 22 66188826 [email protected] Amar Mourya Research Analyst Tel: 91‐22‐66188836 [email protected] Kamal Sahoo Research Associate Tel:+91 22 66188833 [email protected] 0.0 50.0 100.0 150.0 Jun‐15 Jul‐15 Aug‐15 Sep‐15 Oct‐15 Nov‐15 Dec‐15 Jan‐16 Feb‐16 Mar‐16 Apr‐16 May‐16 ORIENT IN SENSEX ORL’s strong manufacturing capabilities resulted in almost doubling the net profit over last 5 years. One of the key drivers for significant increase in revenue was cross‐selling between ORL, RHI India and RHI Clasil clients. Additionally, the parent’s umbrella offerings and go‐to‐market strategy led to entry into Tier‐I steel manufacturers. The company has been able to consistently enjoy above industry level margins (last 4 Yr. 17.9% v/s Avg. Industry 14%) on back of product innovation and client mix. We believe under RHI AG APAC vision, ORL will be able to achieve parent’s target of 100 mn Euro’s (~Rs 7,631 mn| ~20% CAGR) before FY20. Investment Rationale Higher Market Share = Robust Revenue Performance Technology Innovation = Industry Leading Margin Sound Cash Conversion Cycle = Favorable Free Cash Flow Generation Umbrella Offering = Strong Competitive Edge Strong Exports Growth = Revenue Risk Reduction New Capacity Creation = Increasing Revenue Visibility Key Risks Delay in Economic Recovery = Revenue Risk High Raw Material Import = Business Risk Intensifying Competition = Pricing Pressure Valuations: We like ORL because of its niche business model and ability to deliver strong revenue growth in tough industry environment. The company’s revenue growth multiplier is ~2.4x (past decade) v/s Indian steel industry. Additionally, the company enjoy higher than industry average margins on back of product innovation and client mix. On back of diversified client base and expected uptake in infrastructure and rise in steel consumption, ORL looks a safe destination to ride infrastructure and steel recovery. At the current price of Rs.87, ORL is trading at a EV/EBITDA multiple of 9.7x for FY17E and 7.9x of FY18E respectively. We recommend BUY with TP of Rs.112 (12.4x EV/EBITDA FY17E and 10.5x of FY18E respectively). Financial Performance YE March (Rs Mn) Net Sales EBITDA Adj.PAT Adj.EPS (Rs) EBITDA Margin RoE(%) Adj.P/E(x) EV / EBITDA (x) FY14 4,035 792 528 4.4 19.6 44.0 19.8 13.0 FY15 4,514 795 525 4.4 17.6 34.2 19.9 12.9 FY16 4,589 852 558 4.6 18.6 29.8 18.7 11.4 FY17E 5,164 977 657 5.5 18.9 28.5 15.9 9.7 FY18E 5,810 1,152 782 6.5 19.8 27.1 13.4 7.9 Source: Company, IndiaNivesh Research
-
Upload
nguyenxuyen -
Category
Documents
-
view
218 -
download
2
Transcript of Initiating Coverage Orient Refractories - Rakesh...

IndiaNivesh Securities Ltd IndiaNivesh Securities Limited|Research Analyst SEBI Registration No:INH0000000511
601 & 602, Sukh Sagar, N. S. Patkar Marg, Girgaum Chowpatty, Mumbai 400 007. Tel: (022) 66188800
IndiaNivesh Research is also available on Bloomberg INNS, Thomson First Call, Reuters and Factiva INDNIV.
Orient Refractories Ltd
MNC at Trough Valuation
Initiating Coverage21 June 2016
Current Previous
CMP : Rs 87
Rating : BUY Rating : NA
Target : Rs 112 Target : NA (NR‐Not Rated)
STOCK INFO
INDEX BSE 534076 NSE ORIENTREF
Bloomberg ORIENT IN EQUITY
Reuters ORIENT.BO
Sector Metal & Mining
Face Value (Rs) 1
Equity Capital (Rs mn) 120
Mkt Cap (Rs mn) 10,440
52w H/L (Rs) 97 / 70 Avg Daily Vol (BSE+NSE) 60,314
SHAREHOLDING PATTERN %
(as on Mar. 2016)
Promoters 69.6
FIIs ‐
DIIs 11.5
Public & Others 18.9
STOCK PERFORMANCE(%) 3m 6m 12m ORIENT IN EQUITY 18.0 5.6 2.5
SENSEX 6.0 4.2 (1.8)
Source: Bloomberg, IndiaNivesh Research
ORIENT IN EQUITY v/s SENSEX
Source: Bloomberg, IndiaNivesh Research
Daljeet S. Kohli Head of Research Tel: +91 22 66188826 [email protected]
Amar Mourya Research Analyst Tel: 91‐22‐66188836 [email protected]
Kamal Sahoo Research Associate Tel:+91 22 66188833 [email protected]
0.0
50.0
100.0
150.0
Jun‐15
Jul‐15
Aug‐15
Sep‐15
Oct‐15
Nov‐15
Dec‐15
Jan‐16
Feb‐16
Mar‐16
Apr‐16
May‐16
ORIENT IN SENSEX
ORL’s strong manufacturing capabilities resulted in almost doubling the net profit
over last 5 years. One of the key drivers for significant increase in revenue was
cross‐selling between ORL, RHI India and RHI Clasil clients. Additionally, the
parent’s umbrella offerings and go‐to‐market strategy led to entry into Tier‐I steel
manufacturers. The company has been able to consistently enjoy above industry
level margins (last 4 Yr. 17.9% v/s Avg. Industry 14%) on back of product innovation
and client mix. We believe under RHI AG APAC vision, ORL will be able to achieve
parent’s target of 100 mn Euro’s (~Rs 7,631 mn| ~20% CAGR) before FY20.
Investment Rationale
Higher Market Share = Robust Revenue Performance
Technology Innovation = Industry Leading Margin
Sound Cash Conversion Cycle = Favorable Free Cash Flow Generation
Umbrella Offering = Strong Competitive Edge
Strong Exports Growth = Revenue Risk Reduction
New Capacity Creation = Increasing Revenue Visibility
Key Risks
Delay in Economic Recovery = Revenue Risk
High Raw Material Import = Business Risk
Intensifying Competition = Pricing Pressure
Valuations:
We like ORL because of its niche business model and ability to deliver strong revenue
growth in tough industry environment. The company’s revenue growth multiplier is
~2.4x (past decade) v/s Indian steel industry. Additionally, the company enjoy higher
than industry average margins on back of product innovation and client mix.
On back of diversified client base and expected uptake in infrastructure and rise in
steel consumption, ORL looks a safe destination to ride infrastructure and steel
recovery.
At the current price of Rs.87, ORL is trading at a EV/EBITDA multiple of 9.7x for FY17E
and 7.9x of FY18E respectively. We recommend BUY with TP of Rs.112 (12.4x
EV/EBITDA FY17E and 10.5x of FY18E respectively).
Financial Performance YE March (Rs Mn)
Net Sales EBITDA Adj.PAT Adj.EPS (Rs)EBITDA Margin
RoE(%) Adj.P/E(x) EV / EBITDA (x)
FY14 4,035 792 528 4.4 19.6 44.0 19.8 13.0
FY15 4,514 795 525 4.4 17.6 34.2 19.9 12.9
FY16 4,589 852 558 4.6 18.6 29.8 18.7 11.4
FY17E 5,164 977 657 5.5 18.9 28.5 15.9 9.7
FY18E 5,810 1,152 782 6.5 19.8 27.1 13.4 7.9
Source: Company, IndiaNivesh Research
Initiating Coverage | Orient Refractories Ltd
IndiaNivesh Securities Ltd 21 June 2016 2 of 14
Investment Rationale
Higher Market Share = Robust Revenue Performance
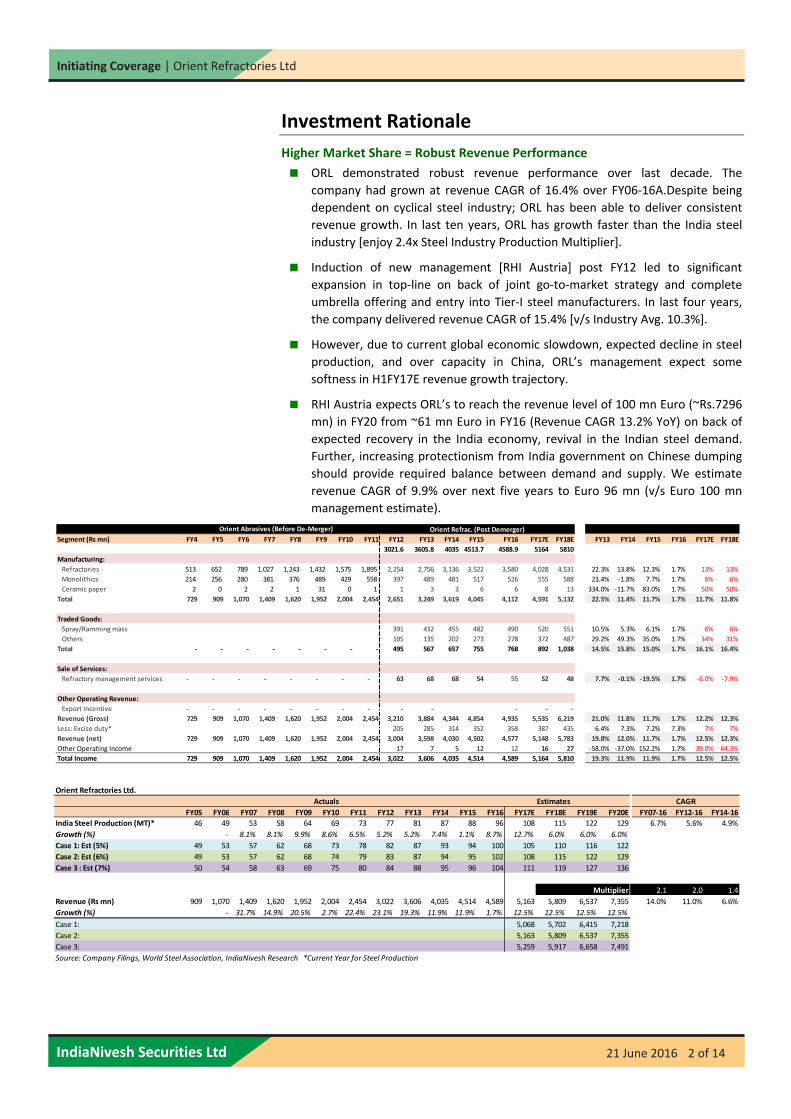
ORL demonstrated robust revenue performance over last decade. The
company had grown at revenue CAGR of 16.4% over FY06‐16A.Despite being
dependent on cyclical steel industry; ORL has been able to deliver consistent
revenue growth. In last ten years, ORL has growth faster than the India steel
industry [enjoy 2.4x Steel Industry Production Multiplier].
Induction of new management [RHI Austria] post FY12 led to significant
expansion in top‐line on back of joint go‐to‐market strategy and complete
umbrella offering and entry into Tier‐I steel manufacturers. In last four years,
the company delivered revenue CAGR of 15.4% [v/s Industry Avg. 10.3%].
However, due to current global economic slowdown, expected decline in steel
production, and over capacity in China, ORL’s management expect some
softness in H1FY17E revenue growth trajectory.
RHI Austria expects ORL’s to reach the revenue level of 100 mn Euro (~Rs.7296
mn) in FY20 from ~61 mn Euro in FY16 (Revenue CAGR 13.2% YoY) on back of
expected recovery in the India economy, revival in the Indian steel demand.
Further, increasing protectionism from India government on Chinese dumping
should provide required balance between demand and supply. We estimate
revenue CAGR of 9.9% over next five years to Euro 96 mn (v/s Euro 100 mn
management estimate).
Segment (Rs mn) FY4 FY5 FY6 FY7 FY8 FY9 FY10 FY11 FY12 FY13 FY14 FY15 FY16 FY17E FY18E FY13 FY14 FY15 FY16 FY17E FY18E
3021.6 3605.8 4035 4513.7 4588.9 5164 5810
Manufacturing:
Refractories 513 652 789 1,027 1,243 1,432 1,575 1,895 2,254 2,756 3,136 3,522 3,580 4,028 4,531 22.3% 13.8% 12.3% 1.7% 13% 13%
Monolithics 214 256 280 381 376 489 429 558 397 489 481 517 526 555 588 23.4% ‐1.8% 7.7% 1.7% 6% 6%
Ceramic paper 2 0 2 2 1 31 0 1 1 3 3 6 6 8 13 334.0% ‐11.7% 83.0% 1.7% 50% 50%
Total 729 909 1,070 1,409 1,620 1,952 2,004 2,454 2,651 3,249 3,619 4,045 4,112 4,591 5,132 22.5% 11.4% 11.7% 1.7% 11.7% 11.8%
Traded Goods:
Spray/Ramming mass 391 432 455 482 490 520 551 10.5% 5.3% 6.1% 1.7% 6% 6%
Others 105 135 202 273 278 372 487 29.2% 49.3% 35.0% 1.7% 34% 31%
Total ‐ ‐ ‐ ‐ ‐ ‐ ‐ ‐ 495 567 657 755 768 892 1,038 14.5% 15.8% 15.0% 1.7% 16.1% 16.4%
Sale of Services:
Refractory management services ‐ ‐ ‐ ‐ ‐ ‐ ‐ ‐ 63 68 68 54 55 52 48 7.7% ‐0.1% ‐19.5% 1.7% ‐6.0% ‐7.9%
Other Operating Revenue:
Export Incentive ‐ ‐ ‐ ‐ ‐ ‐ ‐ ‐ ‐ ‐ ‐ ‐ ‐
Revenue (Gross) 729 909 1,070 1,409 1,620 1,952 2,004 2,454 3,210 3,884 4,344 4,854 4,935 5,535 6,219 21.0% 11.8% 11.7% 1.7% 12.2% 12.3%
Less: Excise duty* 205 285 314 352 358 387 435 6.4% 7.3% 7.2% 7.3% 7% 7%
Revenue (net) 729 909 1,070 1,409 1,620 1,952 2,004 2,454 3,004 3,598 4,030 4,502 4,577 5,148 5,783 19.8% 12.0% 11.7% 1.7% 12.5% 12.3%
Other Operating Income 17 7 5 12 12 16 27 ‐58.0% ‐37.0% 152.2% 1.7% 39.0% 64.3%
Total Income 729 909 1,070 1,409 1,620 1,952 2,004 2,454 3,022 3,606 4,035 4,514 4,589 5,164 5,810 19.3% 11.9% 11.9% 1.7% 12.5% 12.5%
Growth (%)Orient Refrac. (Post Demerger)Orient Abrasives (Before De‐Merger)
Orient Refractories Ltd.
FY05 FY06 FY07 FY08 FY09 FY10 FY11 FY12 FY13 FY14 FY15 FY16 FY17E FY18E FY19E FY20E FY07‐16 FY12‐16 FY14‐16
India Steel Production (MT)* 46 49 53 58 64 69 73 77 81 87 88 96 108 115 122 129 6.7% 5.6% 4.9%
Growth (%) ‐ 8.1% 8.1% 9.9% 8.6% 6.5% 5.2% 5.2% 7.4% 1.1% 8.7% 12.7% 6.0% 6.0% 6.0%
Case 1: Est (5%) 49 53 57 62 68 73 78 82 87 93 94 100 105 110 116 122
Case 2: Est (6%) 49 53 57 62 68 74 79 83 87 94 95 102 108 115 122 129
Case 3 : Est (7%) 50 54 58 63 69 75 80 84 88 95 96 104 111 119 127 136
2.1 2.0 1.4
Revenue (Rs mn) 909 1,070 1,409 1,620 1,952 2,004 2,454 3,022 3,606 4,035 4,514 4,589 5,163 5,809 6,537 7,355 14.0% 11.0% 6.6%
Growth (%) ‐ 31.7% 14.9% 20.5% 2.7% 22.4% 23.1% 19.3% 11.9% 11.9% 1.7% 12.5% 12.5% 12.5% 12.5%
Case 1: 5,068 5,702 6,415 7,218
Case 2: 5,163 5,809 6,537 7,355
Case 3: 5,259 5,917 6,658 7,491
Source: Company Filings, World Steel Association, IndiaNivesh Research *Current Year for Steel Production
CAGREstimates
Multiplier
Actuals

Initiating Coverage | Orient Refractories Ltd
IndiaNivesh Securities Ltd 21 June 2016 3 of 14
Production (MT Tonnes) CY05 CY06 CY07 CY08 CY09 CY10 CY11 CY12 CY13 CY14 CY15 CY16
World 1,148 1,250 1,348 1,343 1,239 1,433 1,538 1,560 1,650 1,670 1,670 1,623
China 356 421 490 512 577 639 702 731 822 823 823 804
World ex‐China 792 829 858 831 662 795 836 829 828 847 847 819
India 46 49 53 58 64 69 73 77 81 87 88 89
World Growth (%) ‐ 8.9% 7.8% ‐0.3% ‐7.8% 15.7% 7.3% 1.4% 5.8% 1.2% 0.0% ‐2.8%
India Growth (%) ‐ 8.0% 8.1% 8.1% 9.9% 8.6% 6.5% 5.2% 5.2% 7.4% 1.1% 1.3%
Source:World Steel Association, INSPL Research
Indian Steel Ind. Historical CAGR (%) Orient Ref Ltd. Rev. Historical CAGR (%) World Steel Ind. Historical CAGR (%)
Source: Company Filings, IndiaNivesh Research
Technology Innovation = Industry Leading Margin
Refractories technology has undergone huge transformation over last three
decades. As a result, consumption of refractories per ton of steel manufactured
declined from ~30kg/ton in 1990 to less than 10kg per/ton currently. Despite
this, ORL has shown a consistent revenue growth along with increase in market
share.
Further, the company’s long term association with Tier‐I domestic integrated
steel producers and strong portfolio of mini/small [600 Customers | 60%
Market Share] steel plants led to constant margin expansion. The key clients
are SAIL, Bhushan Steel, Mukund, RINL – Vizag, Sunflag Iron, Lloyd Steel, Usha
Martin and the Jindal Group.
FY16: Revenue Mix EBIDTA Margin (%) Comparison
Source: Company Filings, IndiaNivesh Research
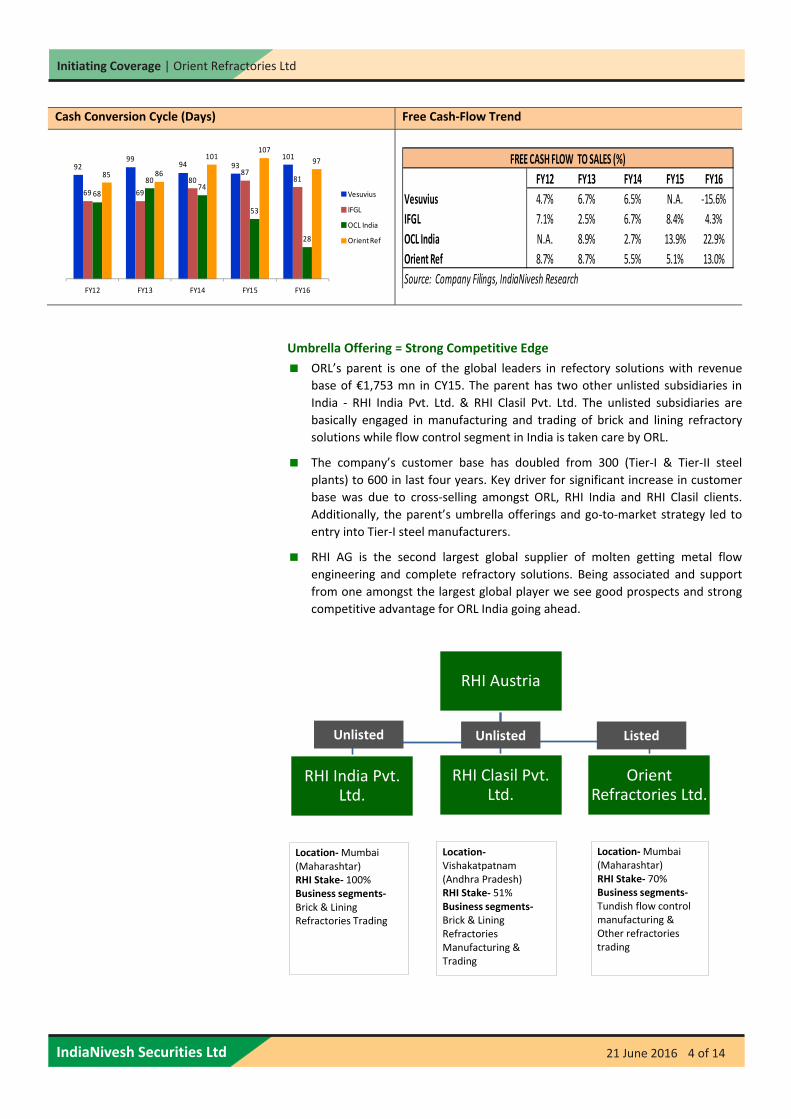
Sound Cash Conversion Cycle = Favorable Free Cash Flow Generation
Despite operating into the distressed steel industry cycle the company continues to
maintain sound cash conversion cycle. As a result, the company’s average free cash‐
flow to sales is 13.0% (v/s 6.2% Refractory Industry Avg). However, we highlight that
in the past two years there has been a certain increase in cash‐conversion‐cycle
days was due to higher inventory and receivable days.
5.9%
3.7%
1.2%
10 Years 5 Years 3 Years
16.2%
15.8%
15.4%
10 Years 5 Years 3 Years
Series1
2.1%
1.0%
‐1.4%
10 Years 5 Years 3 Years
Top Client Mix Rev (Rs mn) As a % of Rev
TMS 688 15%
Export 930 20%
Mini Steel 2294 50%
Others 677 15%
Total 4589 100%
Source: Company Filings, India Nivesh
Initiating Coverage | Orient Refractories Ltd
IndiaNivesh Securities Ltd 21 June 2016 4 of 14
FY12 FY13 FY14 FY15 FY16
Vesuvius 4.7% 6.7% 6.5% N.A. ‐15.6%
IFGL 7.1% 2.5% 6.7% 8.4% 4.3%
OCL India N.A. 8.9% 2.7% 13.9% 22.9%
Orient Ref 8.7% 8.7% 5.5% 5.1% 13.0%
Source: Company Filings, IndiaNivesh Research
FREE CASH FLOW TO SALES (%)
Cash Conversion Cycle (Days) Free Cash‐Flow Trend
Umbrella Offering = Strong Competitive Edge
ORL’s parent is one of the global leaders in refectory solutions with revenue
base of €1,753 mn in CY15. The parent has two other unlisted subsidiaries in
India ‐ RHI India Pvt. Ltd. & RHI Clasil Pvt. Ltd. The unlisted subsidiaries are
basically engaged in manufacturing and trading of brick and lining refractory
solutions while flow control segment in India is taken care by ORL.
The company’s customer base has doubled from 300 (Tier‐I & Tier‐II steel
plants) to 600 in last four years. Key driver for significant increase in customer
base was due to cross‐selling amongst ORL, RHI India and RHI Clasil clients.
Additionally, the parent’s umbrella offerings and go‐to‐market strategy led to
entry into Tier‐I steel manufacturers.
RHI AG is the second largest global supplier of molten getting metal flow
engineering and complete refractory solutions. Being associated and support
from one amongst the largest global player we see good prospects and strong
competitive advantage for ORL India going ahead.
9299
94 93101
69 69
8087
81
68
8074
53
28
85 86
101107
97
FY12 FY13 FY14 FY15 FY16
Vesuvius
IFGL
OCL India
Orient Ref
RHI Austria
RHI India Pvt. Ltd.
RHI Clasil Pvt. Ltd.
Orient Refractories Ltd.
Location‐Mumbai (Maharashtar)RHI Stake‐ 100%Business segments‐Brick & Lining Refractories Trading
Location‐Vishakatpatnam (Andhra Pradesh)RHI Stake‐ 51%Business segments‐Brick & Lining Refractories Manufacturing & Trading
Location‐Mumbai (Maharashtar)RHI Stake‐ 70%Business segments‐Tundish flow control manufacturing & Other refractories trading
Unlisted Unlisted Listed
Initiating Coverage | Orient Refractories Ltd
IndiaNivesh Securities Ltd 21 June 2016 5 of 14
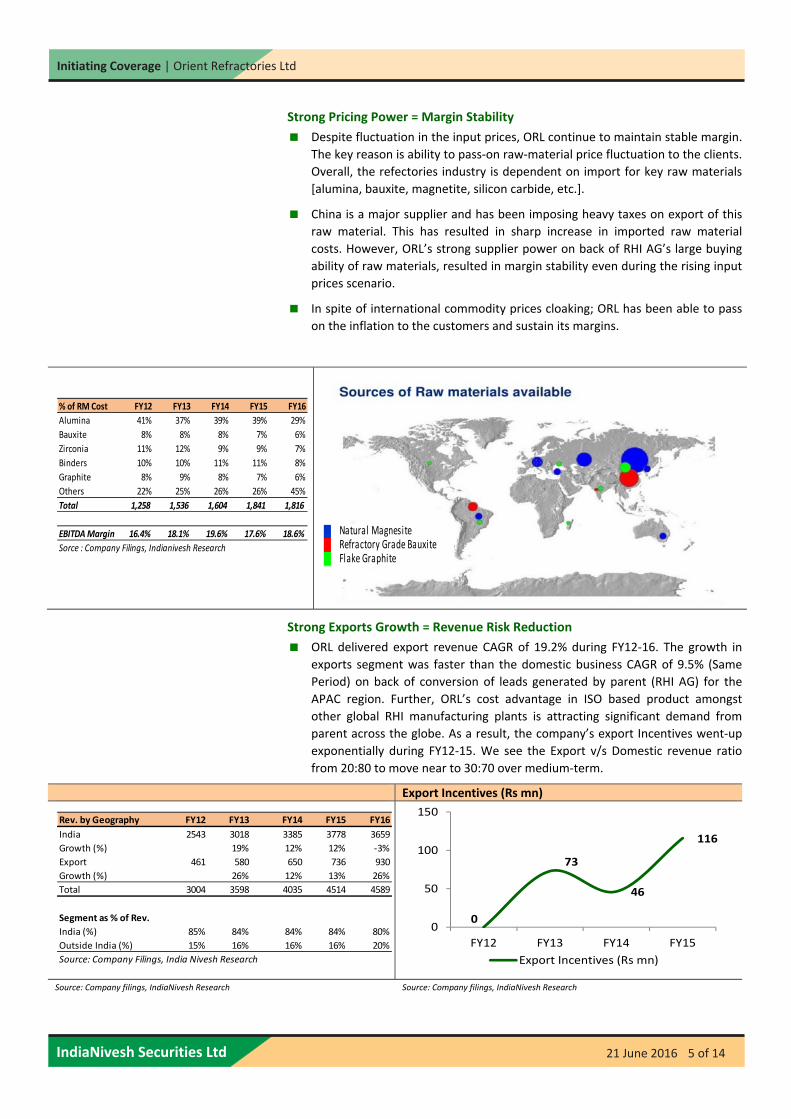
Strong Pricing Power = Margin Stability
Despite fluctuation in the input prices, ORL continue to maintain stable margin.
The key reason is ability to pass‐on raw‐material price fluctuation to the clients.
Overall, the refectories industry is dependent on import for key raw materials
[alumina, bauxite, magnetite, silicon carbide, etc.].
China is a major supplier and has been imposing heavy taxes on export of this
raw material. This has resulted in sharp increase in imported raw material
costs. However, ORL’s strong supplier power on back of RHI AG’s large buying
ability of raw materials, resulted in margin stability even during the rising input
prices scenario.
In spite of international commodity prices cloaking; ORL has been able to pass
on the inflation to the customers and sustain its margins.
Strong Exports Growth = Revenue Risk Reduction
ORL delivered export revenue CAGR of 19.2% during FY12‐16. The growth in
exports segment was faster than the domestic business CAGR of 9.5% (Same
Period) on back of conversion of leads generated by parent (RHI AG) for the
APAC region. Further, ORL’s cost advantage in ISO based product amongst
other global RHI manufacturing plants is attracting significant demand from
parent across the globe. As a result, the company’s export Incentives went‐up
exponentially during FY12‐15. We see the Export v/s Domestic revenue ratio
from 20:80 to move near to 30:70 over medium‐term.
Export Incentives (Rs mn)
Source: Company filings, IndiaNivesh Research Source: Company filings, IndiaNivesh Research
% of RM Cost FY12 FY13 FY14 FY15 FY16
Alumina 41% 37% 39% 39% 29%
Bauxite 8% 8% 8% 7% 6%
Zirconia 11% 12% 9% 9% 7%
Binders 10% 10% 11% 11% 8%
Graphite 8% 9% 8% 7% 6%
Others 22% 25% 26% 26% 45%
Total 1,258 1,536 1,604 1,841 1,816
EBITDA Margin 16.4% 18.1% 19.6% 17.6% 18.6%
Sorce : Company Filings, Indianivesh Research
Rev. by Geography FY12 FY13 FY14 FY15 FY16
India 2543 3018 3385 3778 3659
Growth (%) 19% 12% 12% ‐3%
Export 461 580 650 736 930
Growth (%) 26% 12% 13% 26%
Total 3004 3598 4035 4514 4589
Segment as % of Rev.
India (%) 85% 84% 84% 84% 80%
Outside India (%) 15% 16% 16% 16% 20%
Source: Company Filings, India Nivesh Research
0
73
46
116
0
50
100
150
FY12 FY13 FY14 FY15
Export Incentives (Rs mn)
Natural Magnesite Refractory Grade BauxiteFlake Graphite
Initiating Coverage | Orient Refractories Ltd
IndiaNivesh Securities Ltd 21 June 2016 6 of 14
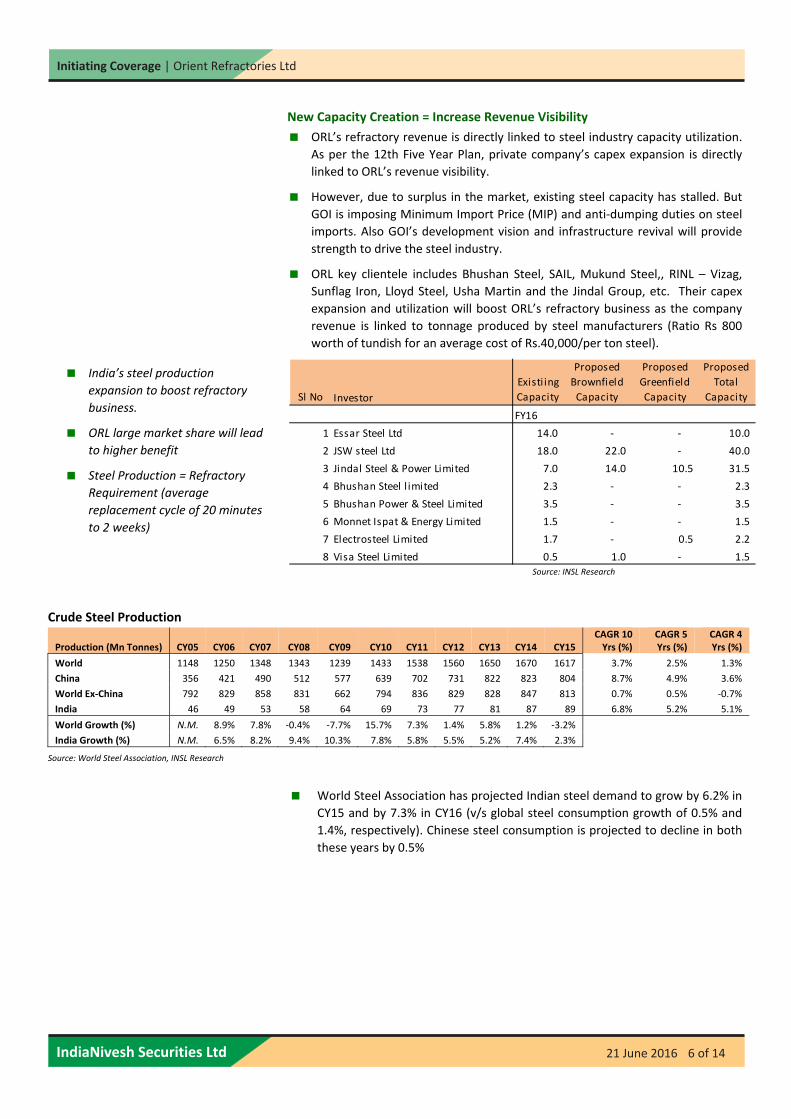
New Capacity Creation = Increase Revenue Visibility
ORL’s refractory revenue is directly linked to steel industry capacity utilization.
As per the 12th Five Year Plan, private company’s capex expansion is directly
linked to ORL’s revenue visibility.
However, due to surplus in the market, existing steel capacity has stalled. But
GOI is imposing Minimum Import Price (MIP) and anti‐dumping duties on steel
imports. Also GOI’s development vision and infrastructure revival will provide
strength to drive the steel industry.
ORL key clientele includes Bhushan Steel, SAIL, Mukund Steel,, RINL – Vizag,
Sunflag Iron, Lloyd Steel, Usha Martin and the Jindal Group, etc. Their capex
expansion and utilization will boost ORL’s refractory business as the company
revenue is linked to tonnage produced by steel manufacturers (Ratio Rs 800
worth of tundish for an average cost of Rs.40,000/per ton steel).
Source: INSL Research
Crude Steel Production
Production (Mn Tonnes) CY05 CY06 CY07 CY08 CY09 CY10 CY11 CY12 CY13 CY14 CY15 CAGR 10 Yrs (%)
CAGR 5 Yrs (%)
CAGR 4 Yrs (%)
World 1148 1250 1348 1343 1239 1433 1538 1560 1650 1670 1617 3.7% 2.5% 1.3%
China 356 421 490 512 577 639 702 731 822 823 804 8.7% 4.9% 3.6%
World Ex‐China 792 829 858 831 662 794 836 829 828 847 813 0.7% 0.5% ‐0.7%
India 46 49 53 58 64 69 73 77 81 87 89 6.8% 5.2% 5.1%
World Growth (%) N.M. 8.9% 7.8% ‐0.4% ‐7.7% 15.7% 7.3% 1.4% 5.8% 1.2% ‐3.2%
India Growth (%) N.M. 6.5% 8.2% 9.4% 10.3% 7.8% 5.8% 5.5% 5.2% 7.4% 2.3%
Source: World Steel Association, INSL Research
World Steel Association has projected Indian steel demand to grow by 6.2% in
CY15 and by 7.3% in CY16 (v/s global steel consumption growth of 0.5% and
1.4%, respectively). Chinese steel consumption is projected to decline in both
these years by 0.5%
Sl No Investor
Existi ing
Capacity
Proposed
Brownfield
Capacity
Proposed
Greenfield
Capacity
Proposed
Total
Capacity
FY16
1 Essar Steel Ltd 14.0 ‐ ‐ 10.0
2 JSW steel Ltd 18.0 22.0 ‐ 40.0
3 Jindal Steel & Power Limited 7.0 14.0 10.5 31.5
4 Bhushan Steel l imited 2.3 ‐ ‐ 2.3
5 Bhushan Power & Steel Limited 3.5 ‐ ‐ 3.5
6 Monnet Ispat & Energy Limited 1.5 ‐ ‐ 1.5
7 Electrosteel Limited 1.7 ‐ 0.5 2.2
8 Visa Steel Limited 0.5 1.0 ‐ 1.5
India’s steel production
expansion to boost refractory
business.
ORL large market share will lead
to higher benefit
Steel Production = Refractory
Requirement (average
replacement cycle of 20 minutes
to 2 weeks)
Initiating Coverage | Orient Refractories Ltd
IndiaNivesh Securities Ltd 21 June 2016 7 of 14
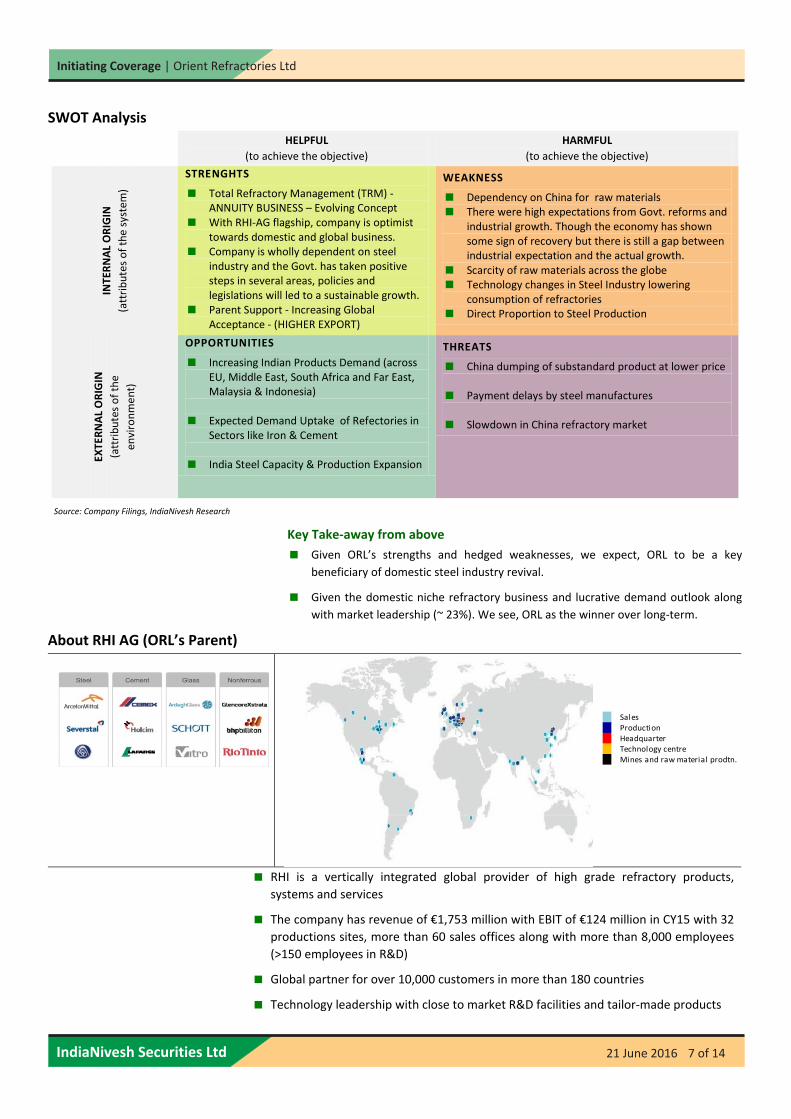
SWOT Analysis
Source: Company Filings, IndiaNivesh Research
Key Take‐away from above
Given ORL’s strengths and hedged weaknesses, we expect, ORL to be a key
beneficiary of domestic steel industry revival.
Given the domestic niche refractory business and lucrative demand outlook along
with market leadership (~ 23%). We see, ORL as the winner over long‐term.
About RHI AG (ORL’s Parent)
RHI is a vertically integrated global provider of high grade refractory products, systems and services
The company has revenue of €1,753 million with EBIT of €124 million in CY15 with 32
productions sites, more than 60 sales offices along with more than 8,000 employees
(>150 employees in R&D)
Global partner for over 10,000 customers in more than 180 countries
Technology leadership with close to market R&D facilities and tailor‐made products
HELPFUL
(to achieve the objective)
HARMFUL
(to achieve the objective)
INTERNAL ORIGIN
(attributes of the system
)
STRENGHTS
Total Refractory Management (TRM) ‐ ANNUITY BUSINESS – Evolving Concept
With RHI‐AG flagship, company is optimist towards domestic and global business.
Company is wholly dependent on steel industry and the Govt. has taken positive steps in several areas, policies and legislations will led to a sustainable growth.
Parent Support ‐ Increasing Global Acceptance ‐ (HIGHER EXPORT)
WEAKNESS
Dependency on China for raw materials There were high expectations from Govt. reforms and
industrial growth. Though the economy has shown some sign of recovery but there is still a gap between industrial expectation and the actual growth.
Scarcity of raw materials across the globe Technology changes in Steel Industry lowering
consumption of refractories Direct Proportion to Steel Production
EXTERNAL ORIGIN
(attributes of the
environment)
OPPORTUNITIES
Increasing Indian Products Demand (across EU, Middle East, South Africa and Far East, Malaysia & Indonesia)
Expected Demand Uptake of Refectories in Sectors like Iron & Cement
India Steel Capacity & Production Expansion
THREATS
China dumping of substandard product at lower price
Payment delays by steel manufactures
Slowdown in China refractory market
SalesProductionHeadquarterTechnology centreMines and raw material prodtn.

Initiating Coverage | Orient Refractories Ltd
IndiaNivesh Securities Ltd 21 June 2016 8 of 14
The RHI group of Austria is the leading global supplier in molten metal flow
engineering. Being the second largest player in the refractory industry, RHI
has been in existence since 1834 and produces more than 1.7 mn tons of
refractory products per year.
The company has two main divisions ‐ Steel & Industrials. RHI develops
refractories under two product segments: steel under Interstop brand for
steel flow control, Didier for lining, and refractories for glass industry
under Monofrax & Refel brands.
RHI has 33 production sites, +160 international technical experts at
customer locations, and 70 sales and service sites, together employing
over 8,000 personnel and serving more than 10,000 customers from the
steel, cement, non‐ferrous metals, glass, energy and chemical industries in
nearly all countries of the world.
Key Customers Includes:
Steel Segment ‐ ArcelorMittal, Severstal, etc.
Industrial Segment
Cement division ‐ Cemex, Holcim, Lafarge in,
Glass division ‐ Ardagh Glass, Corning, Vitro in and
Non‐ferrous‐ Division Glencore, Bhp Billiton, Rio Tinto, etc
Take away from one interaction with RHI‐AG (INSL v/s RHI AG)
RHI‐ AG acquired Indian Orient Refractories Ltd. and on January 15, 2013.
RHI AG (Parent) targets revenue of €3.00bn by CY20 (v/s €1.75bn in CY15) at
overall group level, which in 8% revenue CAGR. The company also intends to
maintain EBIT margin of +12% over the same period.
Parents future growth strategy is largely based on increasing presence in
emerging markets (to+70% from 57% in CY15). On back of strong growth
potential, weight of India is very high in the overall parent’s mission and vision.
RHI has set revenue target of €100mn (v/s €60 mn in FY16) for ORL over next
five years.
Additionally, parent also intends to maintain its number two position in flow
control segment; hence expect APAC sales to increase from €310 mn in CY15 to
+€400 mn by CY20.
The parent has no plans to do any acquisition in ORL subsidiary; hence, no
major capex plan, debt free status should be maintained even going‐ahead.
Based on RHI’s management’s conference meeting, we understand that ORL’s
acquisition remains key for parent, in perusing growth strategy and maintaining
number two position in flow control business.
64%12%
9%
7%
5% 3%
Steel Cement Nonferrous
Glass EEC Raw Materials
19%
13%
13%
7%
5%
28%
14%
1%
Asia Middle East & Africa
South America & Mexico Eastern Europe
CIS USA & Canada
Western Europe Australia & Japan

Initiating Coverage | Orient Refractories Ltd
IndiaNivesh Securities Ltd 21 June 2016 9 of 14
S T R A T E G Y – 2 0 2 0 PROFITBLE GROWTH RAW MATERIAL INTEGRATION Capture growth in highly profitable markets (like India
& US) and product groups
Strengthening No.2 position in flow control segment (€310 mn v/s €400 mn in CY20) with strong margin
Given the decline in refractory raw material prices (after reaching peak levels in 2011) driven by slower growth in China, no further projects currently envisaged
Access to high‐quality raw materials still considered as a competitive advantage due to their significant influence on the performance of finished products
INNOVATION BUSINESS EXCELLENCE Develop solutions that are tailored as per the
customer trends – Steel: automation, environment, functional products
Focuses on substitution if raw materials for energy efficiency, recycling
Optimize plant structure to ensure optimal utilization of worldwide plants
Adapt business processes continuously to better serve customers and optimize costs
Lower growth of selling and administration costs compared to revenue growth
Key Risks
Delay in Economic Recovery = Revenue Risk
Slowdown in steel sales momentum can impact ORL sales growth targets.
Higher Raw Material Import = Business Risk
The industry is largely dependent on imports for key raw materials like high
grade alumina, bauxite, magnesite, silicon carbide, etc. China is a major
supplier and has been imposing heavy taxes on export of these raw materials.
This resulted in sharp increase in raw material costs. In FY16, the raw materials
cost constitute ~40% of the total net sales, including (~25% of raw material
costs as) currency headwinds due to import. The company has a~11% (as % of
Sales) of imports as compare to exports of ~16% (as % of Sales), making it a net
exporter.
Intensifying Competition = Pricing Pressure
Overall, refractory business got matured in previous decade; hence become
more competitive. Further, the increasing focus of global players in Emerging
markets intensifies the competition. E.g. Vesuvius Plc. which have a strong
leadership position in steel flow control process globally, targets Emerging
markets as key growth destination, Krosaki Harima had bought 51% in Tata
Refractories, Calderys, part of Imerys of France which acquired ACE
Refractories is also setting up base in India.
About Company Orient Refractories Limited was incorporated in 2010 (de‐merged from Orient
Abrasives Ltd.) and is as a subsidiary of RHI Austria (through holding c/o Dutch
Us Holding B.V). The company manufactures, distributes, and sells refractories,
monolithic, and ceramic paper for integrated steel producers and mini steel
plants in India.
Initiating Coverage | Orient Refractories Ltd
IndiaNivesh Securities Ltd 21 June 2016 10 of 14
ORL customer base include large domestic integrated steel producers and mini
steel plants. The clientele is Steel Authority of India, Mukand Steel, RINL –
Vizag, Sunflag Iron, Lloyd Steel, Usha Martin and the Jindal Group. The
company has close to 600 small to medium sized iron and steel producing
Indian companies as customers. ORL has significant presence in the global
market with exports to over 35 countries including Germany, France, Spain,
Turkey, Egypt, Indonesia, Saudi Arabia, Thailand, UAE and Greece.
Facilities Details:
Headquartered in New Delhi, India, ORL’s manufacturing facility is located in
Bhiwadi, Rajasthan which is ISO ‐ 9001 quality certified.
This facility began commercial production in 1986. The division also has an
allied plant based in Salem, Tamilnadu for manufacturing monolithics.
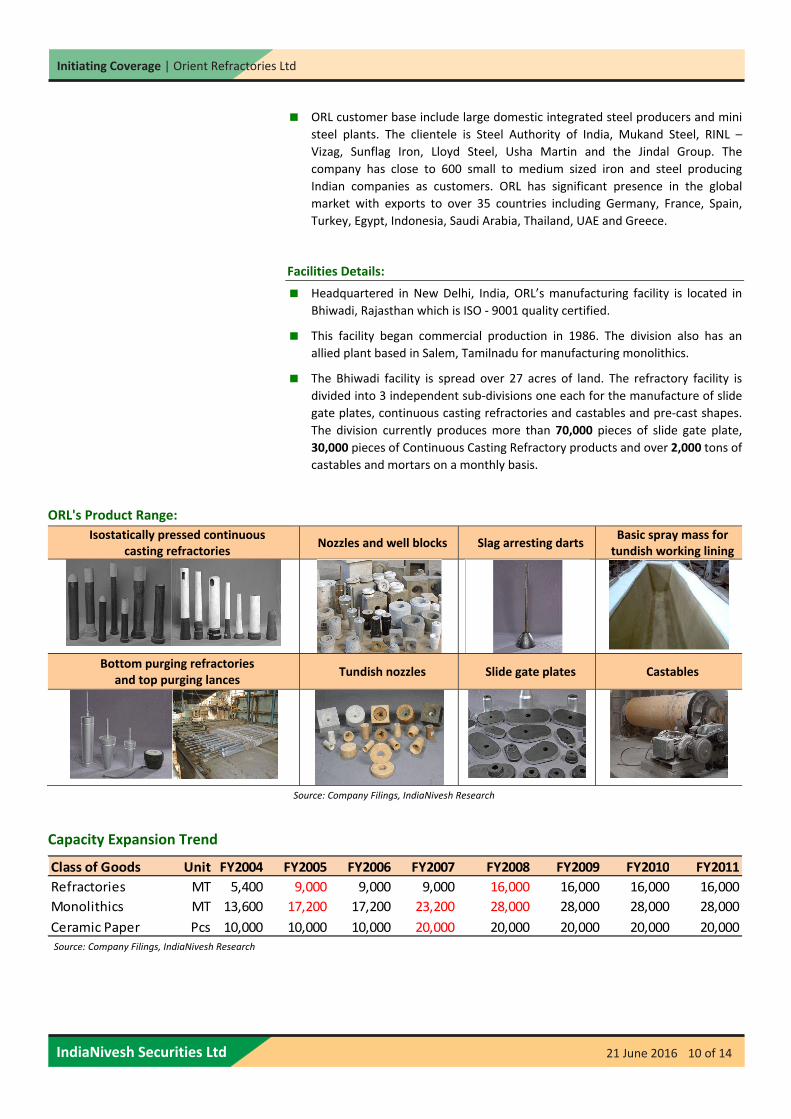
The Bhiwadi facility is spread over 27 acres of land. The refractory facility is
divided into 3 independent sub‐divisions one each for the manufacture of slide
gate plates, continuous casting refractories and castables and pre‐cast shapes.
The division currently produces more than 70,000 pieces of slide gate plate,
30,000 pieces of Continuous Casting Refractory products and over 2,000 tons of
castables and mortars on a monthly basis.
ORL's Product Range:
Isostatically pressed continuous casting refractories
Nozzles and well blocks Slag arresting darts Basic spray mass for tundish working lining
Bottom purging refractories and top purging lances
Tundish nozzles Slide gate plates Castables
Source: Company Filings, IndiaNivesh Research
Capacity Expansion Trend
Source: Company Filings, IndiaNivesh Research
Source: Company Filings, IndiaNivesh Research
Class of Goods Unit FY2004 FY2005 FY2006 FY2007 FY2008 FY2009 FY2010 FY2011
Refractories MT 5,400 9,000 9,000 9,000 16,000 16,000 16,000 16,000
Monolithics MT 13,600 17,200 17,200 23,200 28,000 28,000 28,000 28,000
Ceramic Paper Pcs 10,000 10,000 10,000 20,000 20,000 20,000 20,000 20,000
Initiating Coverage | Orient Refractories Ltd
IndiaNivesh Securities Ltd 21 June 2016 11 of 14
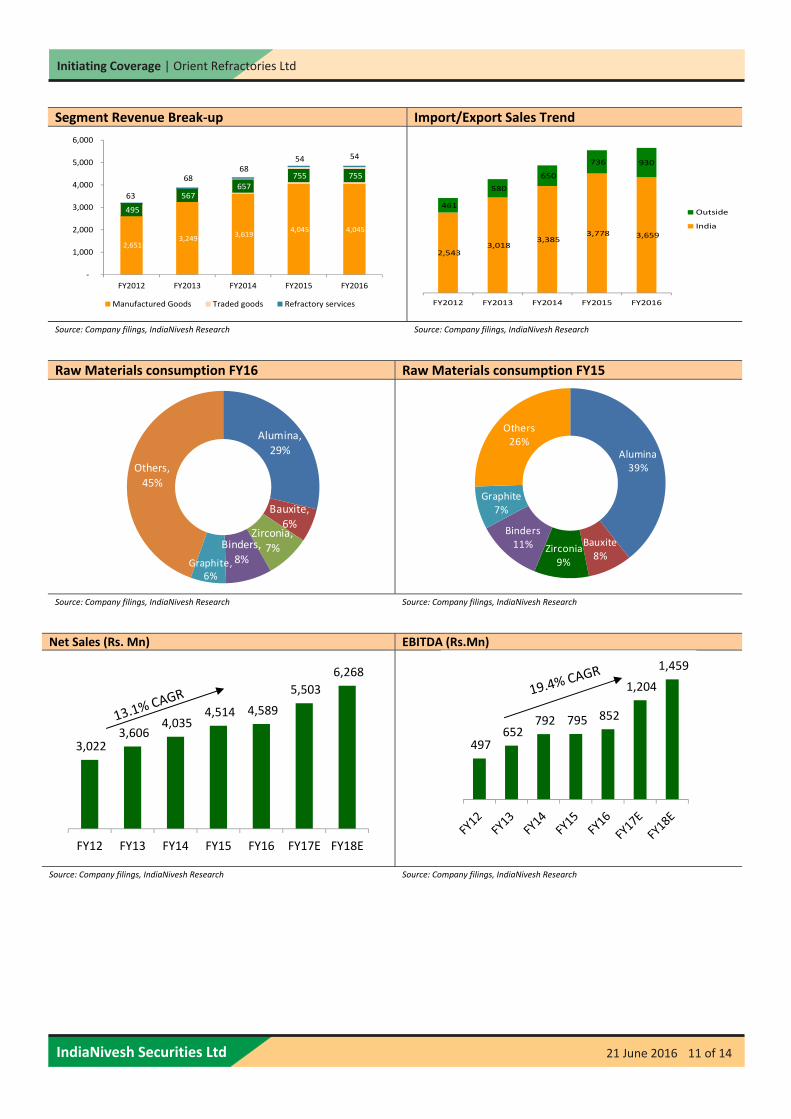
Segment Revenue Break‐up Import/Export Sales Trend
Source: Company filings, IndiaNivesh Research Source: Company filings, IndiaNivesh Research
Raw Materials consumption FY16 Raw Materials consumption FY15
Source: Company filings, IndiaNivesh Research Source: Company filings, IndiaNivesh Research
Net Sales (Rs. Mn) EBITDA (Rs.Mn)
Source: Company filings, IndiaNivesh Research Source: Company filings, IndiaNivesh Research
2,651 3,249
3,619 4,045 4,045
495
567 657
755 755
63
68 68
54 54
‐
1,000
2,000
3,000
4,000
5,000
6,000
FY2012 FY2013 FY2014 FY2015 FY2016
Manufactured Goods Traded goods Refractory services
2,543 3,018
3,385 3,778 3,659
461
580
650
736 930
FY2012 FY2013 FY2014 FY2015 FY2016
Outside
India
Alumina, 29%
Bauxite, 6%
Zirconia,
7%Binders, 8%Graphite,
6%
Others,
45%
Alumina39%
Bauxite8%
Zirconia9%
Binders11%
Graphite7%
Others26%
3,022 3,606
4,035 4,514 4,589
5,503
6,268
FY12 FY13 FY14 FY15 FY16 FY17E FY18E
497 652
792 795 852
1,204
1,459
Initiating Coverage | Orient Refractories Ltd
IndiaNivesh Securities Ltd 21 June 2016 12 of 14
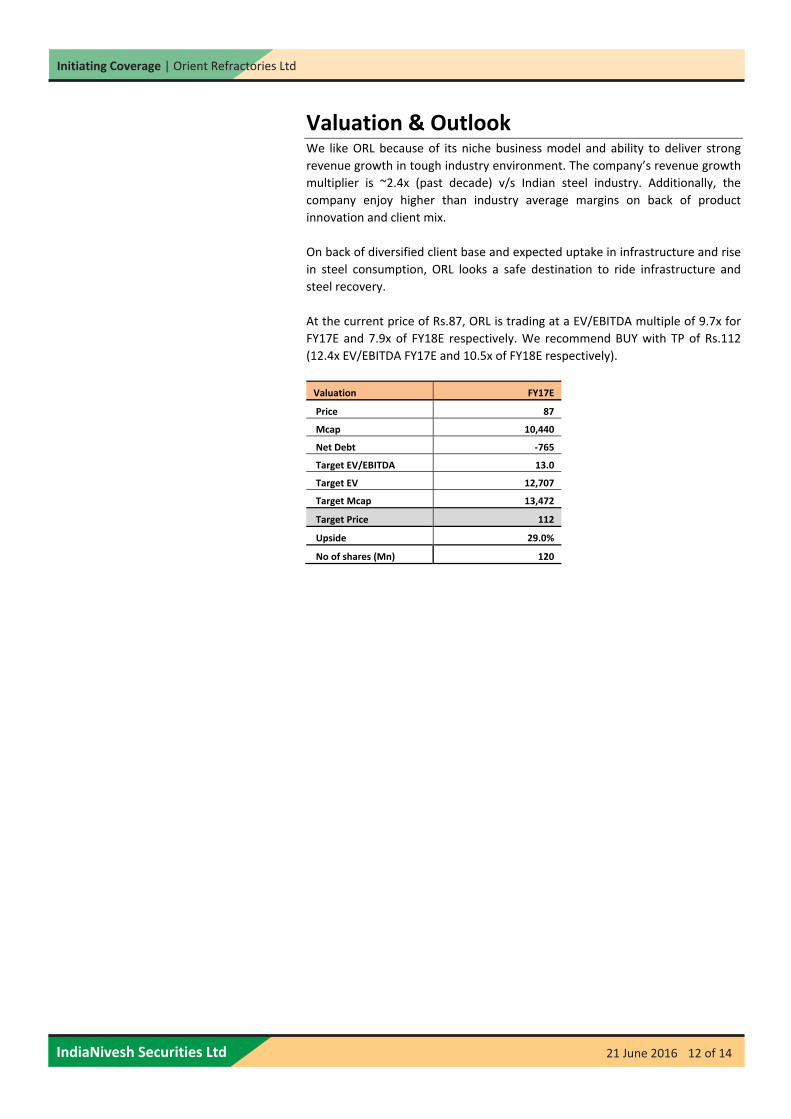
Valuation & Outlook We like ORL because of its niche business model and ability to deliver strong
revenue growth in tough industry environment. The company’s revenue growth
multiplier is ~2.4x (past decade) v/s Indian steel industry. Additionally, the
company enjoy higher than industry average margins on back of product
innovation and client mix.
On back of diversified client base and expected uptake in infrastructure and rise
in steel consumption, ORL looks a safe destination to ride infrastructure and
steel recovery.
At the current price of Rs.87, ORL is trading at a EV/EBITDA multiple of 9.7x for
FY17E and 7.9x of FY18E respectively. We recommend BUY with TP of Rs.112
(12.4x EV/EBITDA FY17E and 10.5x of FY18E respectively).
Valuation FY17E
Price 87
Mcap 10,440
Net Debt ‐765
Target EV/EBITDA 13.0
Target EV 12,707
Target Mcap 13,472
Target Price 112
Upside 29.0%
No of shares (Mn) 120
Initiating Coverage | Orient Refractories Ltd
IndiaNivesh Securities Ltd 21 June 2016 13 of 14
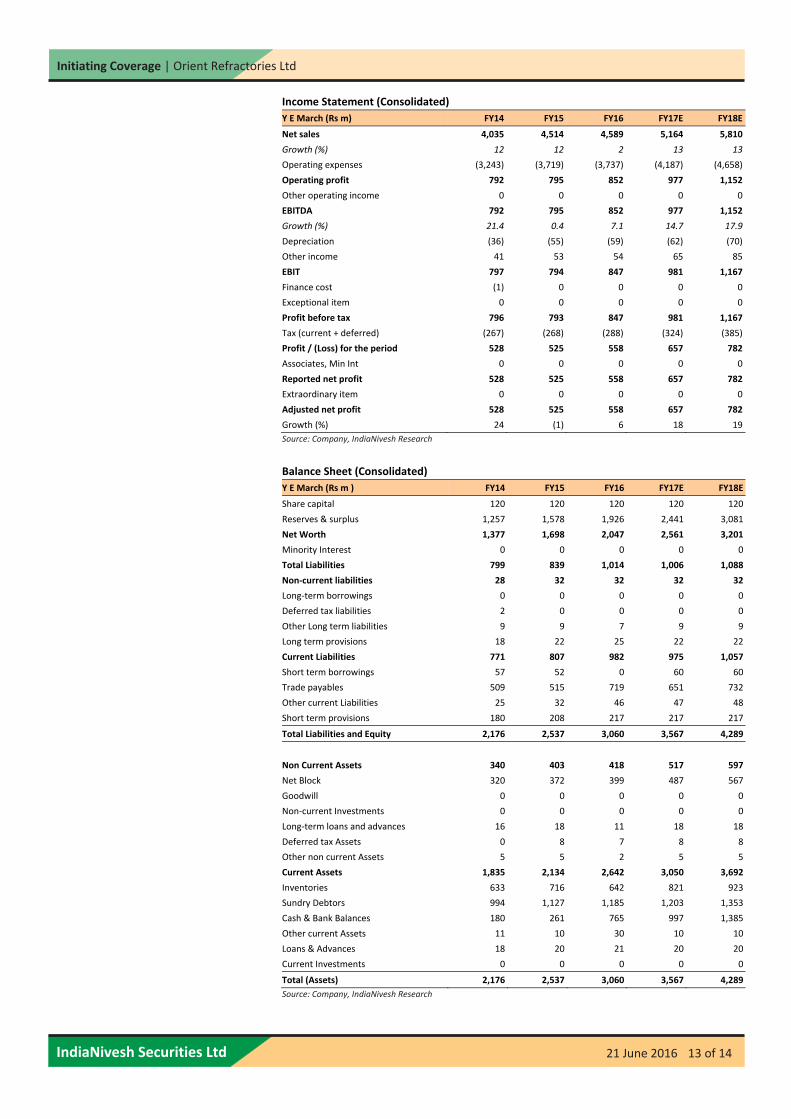
Income Statement (Consolidated)
Y E March (Rs m) FY14 FY15 FY16 FY17E FY18E
Net sales 4,035 4,514 4,589 5,164 5,810
Growth (%) 12 12 2 13 13
Operating expenses (3,243) (3,719) (3,737) (4,187) (4,658)
Operating profit 792 795 852 977 1,152
Other operating income 0 0 0 0 0
EBITDA 792 795 852 977 1,152
Growth (%) 21.4 0.4 7.1 14.7 17.9
Depreciation (36) (55) (59) (62) (70)
Other income 41 53 54 65 85
EBIT 797 794 847 981 1,167
Finance cost (1) 0 0 0 0
Exceptional item 0 0 0 0 0
Profit before tax 796 793 847 981 1,167
Tax (current + deferred) (267) (268) (288) (324) (385)
Profit / (Loss) for the period 528 525 558 657 782
Associates, Min Int 0 0 0 0 0
Reported net profit 528 525 558 657 782
Extraordinary item 0 0 0 0 0
Adjusted net profit 528 525 558 657 782
Growth (%) 24 (1) 6 18 19
Source: Company, IndiaNivesh Research
Balance Sheet (Consolidated)
Y E March (Rs m ) FY14 FY15 FY16 FY17E FY18E
Share capital 120 120 120 120 120
Reserves & surplus 1,257 1,578 1,926 2,441 3,081
Net Worth 1,377 1,698 2,047 2,561 3,201
Minority Interest 0 0 0 0 0
Total Liabilities 799 839 1,014 1,006 1,088
Non‐current liabilities 28 32 32 32 32
Long‐term borrowings 0 0 0 0 0
Deferred tax liabilities 2 0 0 0 0
Other Long term liabilities 9 9 7 9 9
Long term provisions 18 22 25 22 22
Current Liabilities 771 807 982 975 1,057
Short term borrowings 57 52 0 60 60
Trade payables 509 515 719 651 732
Other current Liabilities 25 32 46 47 48
Short term provisions 180 208 217 217 217
Total Liabilities and Equity 2,176 2,537 3,060 3,567 4,289
Non Current Assets 340 403 418 517 597
Net Block 320 372 399 487 567
Goodwill 0 0 0 0 0
Non‐current Investments 0 0 0 0 0
Long‐term loans and advances 16 18 11 18 18
Deferred tax Assets 0 8 7 8 8
Other non current Assets 5 5 2 5 5
Current Assets 1,835 2,134 2,642 3,050 3,692
Inventories 633 716 642 821 923
Sundry Debtors 994 1,127 1,185 1,203 1,353
Cash & Bank Balances 180 261 765 997 1,385
Other current Assets 11 10 30 10 10
Loans & Advances 18 20 21 20 20
Current Investments 0 0 0 0 0
Total (Assets) 2,176 2,537 3,060 3,567 4,289
Source: Company, IndiaNivesh Research
Initiating Coverage | Orient Refractories Ltd
IndiaNivesh Securities Ltd 21 June 2016 14 of 14
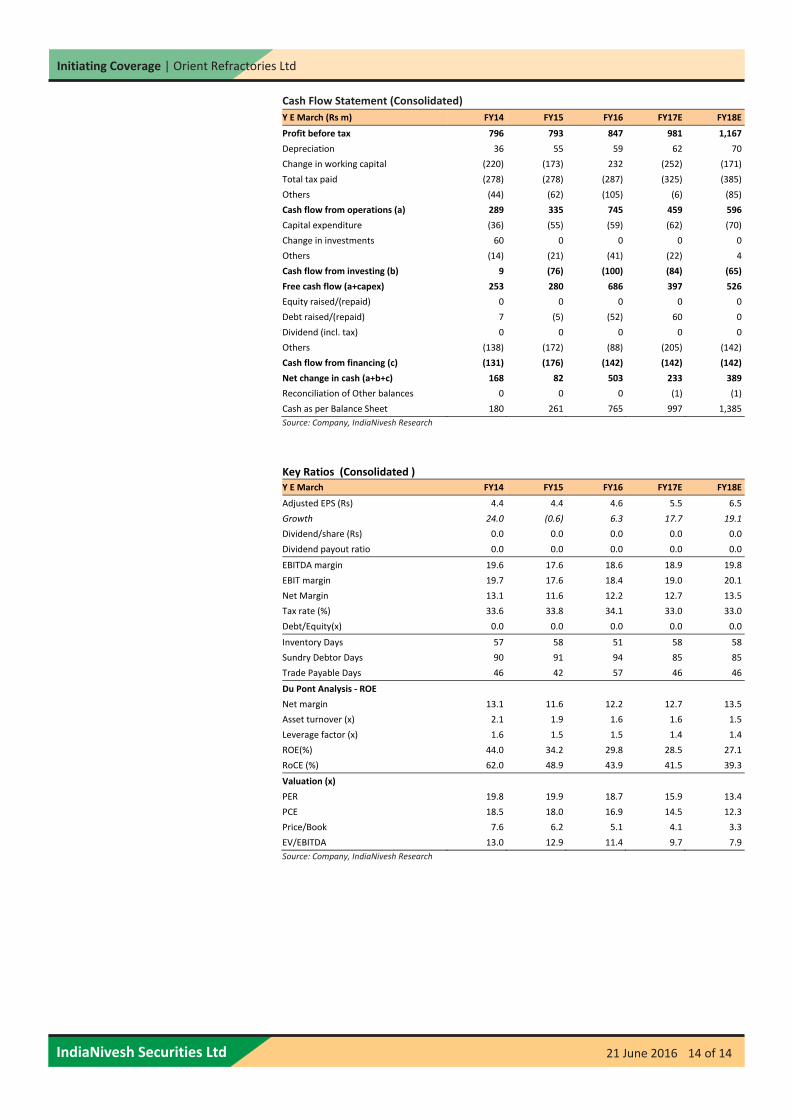
Cash Flow Statement (Consolidated)
Y E March (Rs m) FY14 FY15 FY16 FY17E FY18E
Profit before tax 796 793 847 981 1,167
Depreciation 36 55 59 62 70
Change in working capital (220) (173) 232 (252) (171)
Total tax paid (278) (278) (287) (325) (385)
Others (44) (62) (105) (6) (85)
Cash flow from operations (a) 289 335 745 459 596
Capital expenditure (36) (55) (59) (62) (70)
Change in investments 60 0 0 0 0
Others (14) (21) (41) (22) 4
Cash flow from investing (b) 9 (76) (100) (84) (65)
Free cash flow (a+capex) 253 280 686 397 526
Equity raised/(repaid) 0 0 0 0 0
Debt raised/(repaid) 7 (5) (52) 60 0
Dividend (incl. tax) 0 0 0 0 0
Others (138) (172) (88) (205) (142)
Cash flow from financing (c) (131) (176) (142) (142) (142)
Net change in cash (a+b+c) 168 82 503 233 389
Reconciliation of Other balances 0 0 0 (1) (1)
Cash as per Balance Sheet 180 261 765 997 1,385
Source: Company, IndiaNivesh Research
Key Ratios (Consolidated ) Y E March FY14 FY15 FY16 FY17E FY18E
Adjusted EPS (Rs) 4.4 4.4 4.6 5.5 6.5
Growth 24.0 (0.6) 6.3 17.7 19.1
Dividend/share (Rs) 0.0 0.0 0.0 0.0 0.0
Dividend payout ratio 0.0 0.0 0.0 0.0 0.0
EBITDA margin 19.6 17.6 18.6 18.9 19.8
EBIT margin 19.7 17.6 18.4 19.0 20.1
Net Margin 13.1 11.6 12.2 12.7 13.5
Tax rate (%) 33.6 33.8 34.1 33.0 33.0
Debt/Equity(x) 0.0 0.0 0.0 0.0 0.0
Inventory Days 57 58 51 58 58
Sundry Debtor Days 90 91 94 85 85
Trade Payable Days 46 42 57 46 46
Du Pont Analysis ‐ ROE
Net margin 13.1 11.6 12.2 12.7 13.5
Asset turnover (x) 2.1 1.9 1.6 1.6 1.5
Leverage factor (x) 1.6 1.5 1.5 1.4 1.4
ROE(%) 44.0 34.2 29.8 28.5 27.1
RoCE (%) 62.0 48.9 43.9 41.5 39.3
Valuation (x)
PER 19.8 19.9 18.7 15.9 13.4
PCE 18.5 18.0 16.9 14.5 12.3
Price/Book 7.6 6.2 5.1 4.1 3.3
EV/EBITDA 13.0 12.9 11.4 9.7 7.9
Source: Company, IndiaNivesh Research
Initiating Coverage
Disclaimer: This report has been prepared by IndiaNivesh Securities Limited (“INSL”) and published in accordance with the provisions of Regulation 18 of the Securities and Exchange Board of India (Research Analysts) Regulations, 2014, for use by the recipient as information only and is not for circulation or public distribution. INSL includes subsidiaries, group and associate companies, promoters, directors, employees and affiliates. This report is not to be altered, transmitted, reproduced, copied, redistributed, uploaded, published or made available to others, in any form, in whole or in part, for any purpose without prior written permission from INSL. The projections and the forecasts described in this report are based upon a number of estimates and assumptions and are inherently subject to significant uncertainties and contingencies. Projections and forecasts are necessarily speculative in nature, and it can be expected that one or more of the estimates on which the projections are forecasts were based will not materialize or will vary significantly from actual results and such variations will likely increase over the period of time. All the projections and forecasts described in this report have been prepared solely by authors of this report independently. None of the forecasts were prepared with a view towards compliance with published guidelines or generally accepted accounting principles.
This report should not be construed as an offer to sell or the solicitation of an offer to buy, purchase or subscribe to any securities, and neither this report nor anything contained therein shall form the basis of or be relied upon in connection with any contract or commitment whatsoever. It does not constitute a personal recommendation or take into account the particular investment objective, financial situation or needs of individual clients. The research analysts of INSL have adhered to the code of conduct under Regulation 24 (2) of the Securities and Exchange Board of India (Research Analysts) Regulations, 2014. The recipients of this report must make their own investment decisions, based on their own investment objectives, financial situation or needs and other factors. The recipients should consider and independently evaluate whether it is suitable for its/ his/ her/their particular circumstances and if necessary, seek professional / financial advice as there is substantial risk of loss. INSL does not take any responsibility thereof. Any such recipient shall be responsible for conducting his/her/its/their own investigation and analysis of the information contained or referred to in this report and of evaluating the merits and risks involved in securities forming the subject matter of this report. The price and value of the investment referred to in this report and income from them may go up as well as down, and investors may realize profit/loss on their investments. Past performance is not a guide for future performance. Actual results may differ materially from those set forth in the projection.
Except for the historical information contained herein, statements in this report, which contain words such as ‘will’, ‘would’, etc., and similar expressions or variations of such words may constitute ‘forward‐looking statements’. These forward‐looking statements involve a number of risks, uncertainties and other factors that could cause actual results to differ materially from those suggested by the forward‐looking statements. Forward‐looking statements are not predictions and may be subject to change without notice. INSL undertakes no obligation to update forward‐looking statements to reflect events or circumstances after the date thereof. INSL accepts no liabilities for any loss or damage of any kind arising out of use of this report.
This report has been prepared by INSL based upon the information available in the public domain and other public sources believed to be reliable. Though utmost care has been taken to ensure its accuracy and completeness, no representation or warranty, express or implied is made by INSL that such information is accurate or complete and/or is independently verified. The contents of this report represent the assumptions and projections of INSL and INSL does not guarantee the accuracy or reliability of any projection, assurances or advice made herein. Nothing in this report constitutes investment, legal, accounting and/or tax advice or a representation that any investment or strategy is suitable or appropriate to recipients’ specific circumstances. This report is based / focused on fundamentals of the Company and forward‐looking statements as such, may not match with a report on a company’s technical analysis report. This report may not be followed by any specific event update/ follow‐up.
Following table contains the disclosure of interest in order to adhere to utmost transparency in the matter;
Disclosure of Interest Statement
1 Details of business activity of IndiaNivesh Securities Limited (INSL) INSL is a Stock Broker registered with BSE, NSE and MCX ‐ SX in all the major segments viz. Cash, F & O and CDS segments. INSL is also a Depository Participant and registered with both Depository viz. CDSL and NSDL. Further, INSL is a Registered Portfolio Manager and is registered with SEBI.
2 Details of Disciplinary History of INSL No disciplinary action is / was running / initiated against INSL
3 Research analyst or INSL or its relatives'/associates' financial interest in the subject company and nature of such financial interest
No (except to the extent of shares held by Research analyst or INSL or its relatives'/associates')
4 Whether Research analyst or INSL or its relatives'/associates' is holding the securities of the subject company
No
5 Research analyst or INSL or its relatives'/associates' actual/beneficial ownership of 1% or more in securities of the subject company, at the end of the month immediately preceding the date of publication of the document.
No
6 Research analyst or INSL or its relatives'/associates' any other material conflict of interest at the time of publication of the document
No
7 Has research analyst or INSL or its associates received any compensation from the subject company in the past 12 months
No
8 Has research analyst or INSL or its associates managed or co‐managed public offering of securities for the subject company in the past 12 months
No
9 Has research analyst or INSL or its associates received any compensation for investment banking or merchant banking or brokerage services from the subject company in the past 12 months
No
10 Has research analyst or INSL or its associates received any compensation for products or services other than investment banking or merchant banking or brokerage services from the subject company in the past 12 months
No
11 Has research analyst or INSL or its associates received any compensation or other benefits from the subject company or third party in connection with the document.
No
12 Has research analyst served as an officer, director or employee of the subject company No
13 Has research analyst or INSL engaged in market making activity for the subject company No
14 Other disclosures No
INSL, its affiliates, directors, its proprietary trading and investment businesses may, from time to time, make investment decisions that are inconsistent with or contradictory to the recommendations expressed herein. The views contained in this document are those of the analyst, and the company may or may not subscribe to all the views expressed within. This information is subject to change, as per applicable law, without any prior notice. INSL reserves the right to make modifications and alternations to this statement, as may be required, from time to time.
Definitions of ratings
BUY. We expect this stock to deliver more than 15% returns over the next 12 months.
HOLD. We expect this stock to deliver ‐15% to +15% returns over the next 12 months.
SELL. We expect this stock to deliver <‐15% returns over the next 12 months.
Our target prices are on a 12‐month horizon basis.
Other definitions
NR = Not Rated. The investment rating and target price, if any, have been arrived at due to certain circumstances not in control of INSL
CS = Coverage Suspended. INSL has suspended coverage of this company.
UR=Under Review. Such e invest review happens when any developments have already occurred or likely to occur in target company & INSL analyst is waiting for some more information to draw conclusion on rating/target.
NA = Not Available or Not Applicable. The information is not available for display or is not applicable.
NM = Not Meaningful. The information is not meaningful and is therefore excluded.
Research Analyst has not served as an officer, director or employee of Subject Company
One year Price history of the daily closing price of the securities covered in this note is available at www.nseindia.com and www.economictimes.indiatimes.com/markets/stocks/stock‐quotes. (Choose name of company in the list browse companies and select 1 year in icon YTD in the price chart)
IndiaNivesh Securities Limited
Research Analyst SEBI Registration No. INH000000511
601 & 602, Sukh Sagar, N. S. Patkar Marg, Girgaum Chowpatty, Mumbai 400 007.
Tel: (022) 66188800 / Fax: (022) 66188899 e‐mail: [email protected] | Website: www.indianivesh.in