INITIATING COVERAGE HDFC IN EQUITY February 21,...
32
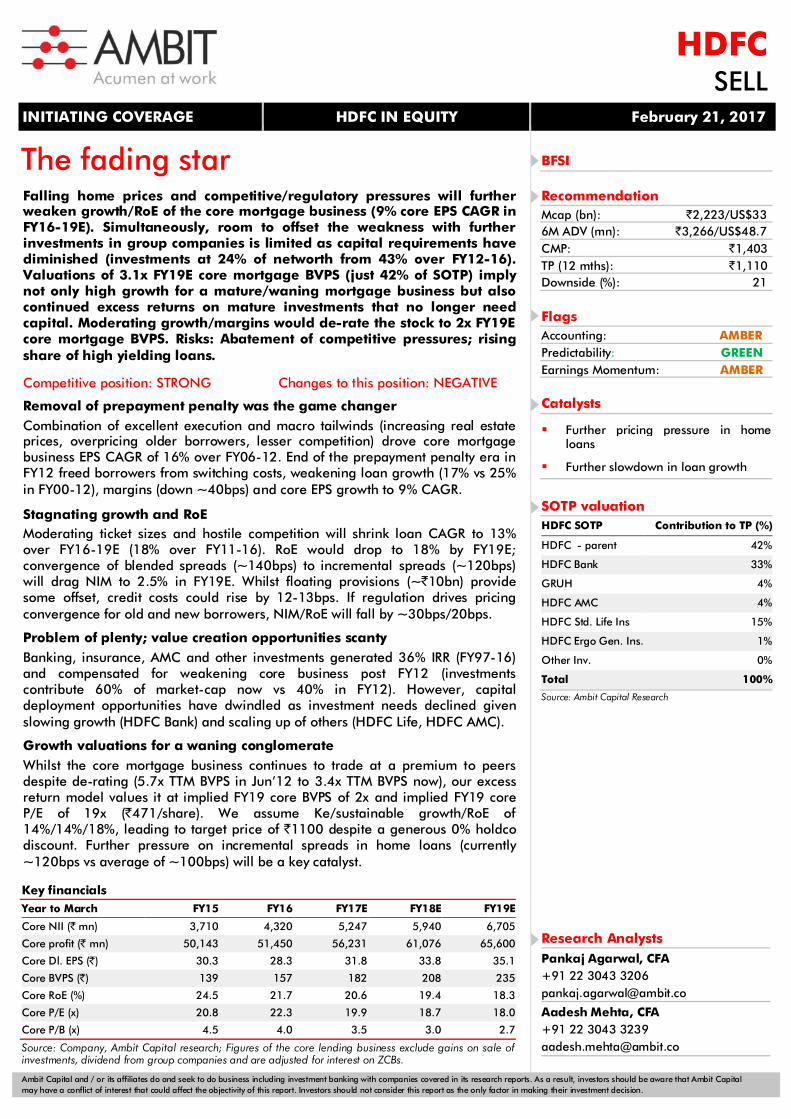
Ambit Capital and / or its affiliates do and seek to do business including investment banking with companies covered in its research reports. As a result, investors should be aware that Ambit Capital may have a conflict of interest that could affect the objectivity of this report. Investors should not consider this report as the only factor in making their investment decision. The fading star Falling home prices and competitive/regulatory pressures will further weaken growth/RoE of the core mortgage business (9% core EPS CAGR in FY16-19E). Simultaneously, room to offset the weakness with further investments in group companies is limited as capital requirements have diminished (investments at 24% of networth from 43% over FY12-16). Valuations of 3.1x FY19E core mortgage BVPS (just 42% of SOTP) imply not only high growth for a mature/waning mortgage business but also continued excess returns on mature investments that no longer need capital. Moderating growth/margins would de-rate the stock to 2x FY19E core mortgage BVPS. Risks: Abatement of competitive pressures; rising share of high yielding loans. Competitive position: STRONG Changes to this position: NEGATIVE Removal of prepayment penalty was the game changer Combination of excellent execution and macro tailwinds (increasing real estate prices, overpricing older borrowers, lesser competition) drove core mortgage business EPS CAGR of 16% over FY06-12. End of the prepayment penalty era in FY12 freed borrowers from switching costs, weakening loan growth (17% vs 25% in FY00-12), margins (down ~40bps) and core EPS growth to 9% CAGR. Stagnating growth and RoE Moderating ticket sizes and hostile competition will shrink loan CAGR to 13% over FY16-19E (18% over FY11-16). RoE would drop to 18% by FY19E; convergence of blended spreads (~140bps) to incremental spreads (~120bps) will drag NIM to 2.5% in FY19E. Whilst floating provisions (~`10bn) provide some offset, credit costs could rise by 12-13bps. If regulation drives pricing convergence for old and new borrowers, NIM/RoE will fall by ~30bps/20bps. Problem of plenty; value creation opportunities scanty Banking, insurance, AMC and other investments generated 36% IRR (FY97-16) and compensated for weakening core business post FY12 (investments contribute 60% of market-cap now vs 40% in FY12). However, capital deployment opportunities have dwindled as investment needs declined given slowing growth (HDFC Bank) and scaling up of others (HDFC Life, HDFC AMC). Growth valuations for a waning conglomerate Whilst the core mortgage business continues to trade at a premium to peers despite de-rating (5.7x TTM BVPS in Jun’12 to 3.4x TTM BVPS now), our excess return model values it at implied FY19 core BVPS of 2x and implied FY19 core P/E of 19x (`471/share). We assume Ke/sustainable growth/RoE of 14%/14%/18%, leading to target price of `1100 despite a generous 0% holdco discount. Further pressure on incremental spreads in home loans (currently ~120bps vs average of ~100bps) will be a key catalyst. INITIATING COVERAGE HDFC IN EQUITY February 21, 2017 HDFC SELL BFSI Recommendation Mcap (bn): `2,223/US$33 6M ADV (mn): `3,266/US$48.7 CMP: `1,403 TP (12 mths): `1,110 Downside (%): 21 Flags Accounting: AMBER Predictability: GREEN Earnings Momentum: AMBER Catalysts Further pricing pressure in home loans Further slowdown in loan growth SOTP valuation HDFC SOTP Contribution to TP (%) HDFC - parent 42% HDFC Bank 33% GRUH 4% HDFC AMC 4% HDFC Std. Life Ins 15% HDFC Ergo Gen. Ins. 1% Other Inv. 0% Total 100% Source: Ambit Capital Research Research Analysts Pankaj Agarwal, CFA +91 22 3043 3206 [email protected] Aadesh Mehta, CFA +91 22 3043 3239 [email protected] Key financials Year to March FY15 FY16 FY17E FY18E FY19E Core NII (` mn) 3,710 4,320 5,247 5,940 6,705 Core profit (` mn) 50,143 51,450 56,231 61,076 65,600 Core Dl. EPS (`) 30.3 28.3 31.8 33.8 35.1 Core BVPS (`) 139 157 182 208 235 Core RoE (%) 24.5 21.7 20.6 19.4 18.3 Core P/E (x) 20.8 22.3 19.9 18.7 18.0 Core P/B (x) 4.5 4.0 3.5 3.0 2.7 Source: Company, Ambit Capital research; Figures of the core lending business exclude gains on sale of investments, dividend from group companies and are adjusted for interest on ZCBs.
Transcript of INITIATING COVERAGE HDFC IN EQUITY February 21,...
Ambit Capital and / or its affiliates do and seek to do business including investment banking with companies covered in its research reports. As a result, investors should be aware that Ambit Capital may have a conflict of interest that could affect the objectivity of this report. Investors should not consider this report as the only factor in making their investment decision.
The fading star
Falling home prices and competitive/regulatory pressures will further weaken growth/RoE of the core mortgage business (9% core EPS CAGR in FY16-19E). Simultaneously, room to offset the weakness with further investments in group companies is limited as capital requirements have diminished (investments at 24% of networth from 43% over FY12-16). Valuations of 3.1x FY19E core mortgage BVPS (just 42% of SOTP) imply not only high growth for a mature/waning mortgage business but also continued excess returns on mature investments that no longer need capital. Moderating growth/margins would de-rate the stock to 2x FY19E core mortgage BVPS. Risks: Abatement of competitive pressures; rising share of high yielding loans.
Competitive position: STRONG Changes to this position: NEGATIVE Removal of prepayment penalty was the game changer Combination of excellent execution and macro tailwinds (increasing real estate prices, overpricing older borrowers, lesser competition) drove core mortgage business EPS CAGR of 16% over FY06-12. End of the prepayment penalty era in FY12 freed borrowers from switching costs, weakening loan growth (17% vs 25% in FY00-12), margins (down ~40bps) and core EPS growth to 9% CAGR. Stagnating growth and RoE Moderating ticket sizes and hostile competition will shrink loan CAGR to 13% over FY16-19E (18% over FY11-16). RoE would drop to 18% by FY19E; convergence of blended spreads (~140bps) to incremental spreads (~120bps) will drag NIM to 2.5% in FY19E. Whilst floating provisions (~`10bn) provide some offset, credit costs could rise by 12-13bps. If regulation drives pricing convergence for old and new borrowers, NIM/RoE will fall by ~30bps/20bps. Problem of plenty; value creation opportunities scanty Banking, insurance, AMC and other investments generated 36% IRR (FY97-16) and compensated for weakening core business post FY12 (investments contribute 60% of market-cap now vs 40% in FY12). However, capital deployment opportunities have dwindled as investment needs declined given slowing growth (HDFC Bank) and scaling up of others (HDFC Life, HDFC AMC).
Growth valuations for a waning conglomerate Whilst the core mortgage business continues to trade at a premium to peers despite de-rating (5.7x TTM BVPS in Jun’12 to 3.4x TTM BVPS now), our excess return model values it at implied FY19 core BVPS of 2x and implied FY19 core P/E of 19x (`471/share). We assume Ke/sustainable growth/RoE of 14%/14%/18%, leading to target price of `1100 despite a generous 0% holdco discount. Further pressure on incremental spreads in home loans (currently ~120bps vs average of ~100bps) will be a key catalyst.
INITIATING COVERAGE HDFC IN EQUITY February 21, 2017
HDFCSELL
BFSI
Recommendation Mcap (bn): `2,223/US$33 6M ADV (mn): `3,266/US$48.7 CMP: `1,403 TP (12 mths): `1,110 Downside (%): 21
Flags Accounting: AMBER Predictability: GREEN Earnings Momentum: AMBER
Catalysts
Further pricing pressure in home loans
Further slowdown in loan growth
SOTP valuation HDFC SOTP Contribution to TP (%)
HDFC - parent 42%
HDFC Bank 33%
GRUH 4%
HDFC AMC 4%
HDFC Std. Life Ins 15%
HDFC Ergo Gen. Ins. 1%
Other Inv. 0%
Total 100%
Source: Ambit Capital Research
Research Analysts Pankaj Agarwal, CFA +91 22 3043 3206 [email protected]
Aadesh Mehta, CFA +91 22 3043 3239 [email protected]
Key financials Year to March FY15 FY16 FY17E FY18E FY19E
Core NII (` mn) 3,710 4,320 5,247 5,940 6,705
Core profit (` mn) 50,143 51,450 56,231 61,076 65,600
Core Dl. EPS (`) 30.3 28.3 31.8 33.8 35.1
Core BVPS (`) 139 157 182 208 235
Core RoE (%) 24.5 21.7 20.6 19.4 18.3
Core P/E (x) 20.8 22.3 19.9 18.7 18.0
Core P/B (x) 4.5 4.0 3.5 3.0 2.7
Source: Company, Ambit Capital research; Figures of the core lending business exclude gains on sale of investments, dividend from group companies and are adjusted for interest on ZCBs.
HDFC
February 21, 2017 Ambit Capital Pvt. Ltd. Page 2
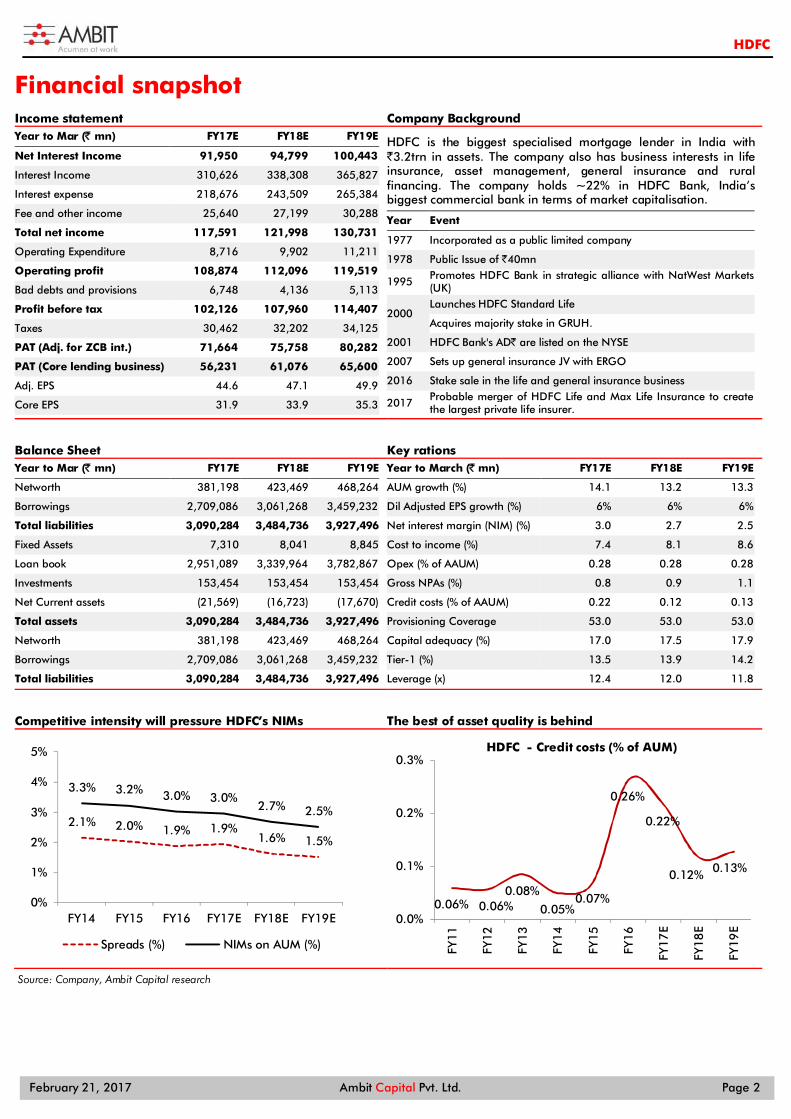
Financial snapshot Income statement Company Background Year to Mar (̀ mn) FY17E FY18E FY19E
Net Interest Income 91,950 94,799 100,443
Interest Income 310,626 338,308 365,827
Interest expense 218,676 243,509 265,384
Fee and other income 25,640 27,199 30,288
Total net income 117,591 121,998 130,731
Operating Expenditure 8,716 9,902 11,211
Operating profit 108,874 112,096 119,519
Bad debts and provisions 6,748 4,136 5,113
Profit before tax 102,126 107,960 114,407
Taxes 30,462 32,202 34,125
PAT (Adj. for ZCB int.) 71,664 75,758 80,282
PAT (Core lending business) 56,231 61,076 65,600
Adj. EPS 44.6 47.1 49.9
Core EPS 31.9 33.9 35.3
HDFC is the biggest specialised mortgage lender in India with `3.2trn in assets. The company also has business interests in life insurance, asset management, general insurance and rural financing. The company holds ~22% in HDFC Bank, India’s biggest commercial bank in terms of market capitalisation.
Year Event
1977 Incorporated as a public limited company
1978 Public Issue of `40mn
1995 Promotes HDFC Bank in strategic alliance with NatWest Markets (UK)
2000 Launches HDFC Standard Life
Acquires majority stake in GRUH.
2001 HDFC Bank's AD` are listed on the NYSE
2007 Sets up general insurance JV with ERGO
2016 Stake sale in the life and general insurance business
2017 Probable merger of HDFC Life and Max Life Insurance to create the largest private life insurer.
Balance Sheet Key rations Year to Mar (̀ mn) FY17E FY18E FY19E
Networth 381,198 423,469 468,264
Borrowings 2,709,086 3,061,268 3,459,232
Total liabilities 3,090,284 3,484,736 3,927,496
Fixed Assets 7,310 8,041 8,845
Loan book 2,951,089 3,339,964 3,782,867
Investments 153,454 153,454 153,454
Net Current assets (21,569) (16,723) (17,670)
Total assets 3,090,284 3,484,736 3,927,496
Networth 381,198 423,469 468,264
Borrowings 2,709,086 3,061,268 3,459,232
Total liabilities 3,090,284 3,484,736 3,927,496
Year to March (̀ mn) FY17E FY18E FY19E
AUM growth (%) 14.1 13.2 13.3
Dil Adjusted EPS growth (%) 6% 6% 6%
Net interest margin (NIM) (%) 3.0 2.7 2.5
Cost to income (%) 7.4 8.1 8.6
Opex (% of AAUM) 0.28 0.28 0.28
Gross NPAs (%) 0.8 0.9 1.1
Credit costs (% of AAUM) 0.22 0.12 0.13
Provisioning Coverage 53.0 53.0 53.0
Capital adequacy (%) 17.0 17.5 17.9
Tier-1 (%) 13.5 13.9 14.2
Leverage (x) 12.4 12.0 11.8
Competitive intensity will pressure HDFC’s NIMs The best of asset quality is behind
Source: Company, Ambit Capital research
2.1% 2.0% 1.9% 1.9%1.6% 1.5%
3.3% 3.2% 3.0% 3.0%2.7% 2.5%
0%
1%
2%
3%
4%
5%
FY14 FY15 FY16 FY17E FY18E FY19E
Spreads (%) NIMs on AUM (%)
0.06% 0.06%0.08%
0.05%0.07%
0.26%
0.22%
0.12% 0.13%
0.0%
0.1%
0.2%
0.3%
FY11
FY12
FY13
FY14
FY15
FY16
FY17
E
FY18
E
FY19
EHDFC - Credit costs (% of AUM)
HDFC
February 21, 2017 Ambit Capital Pvt. Ltd. Page 3
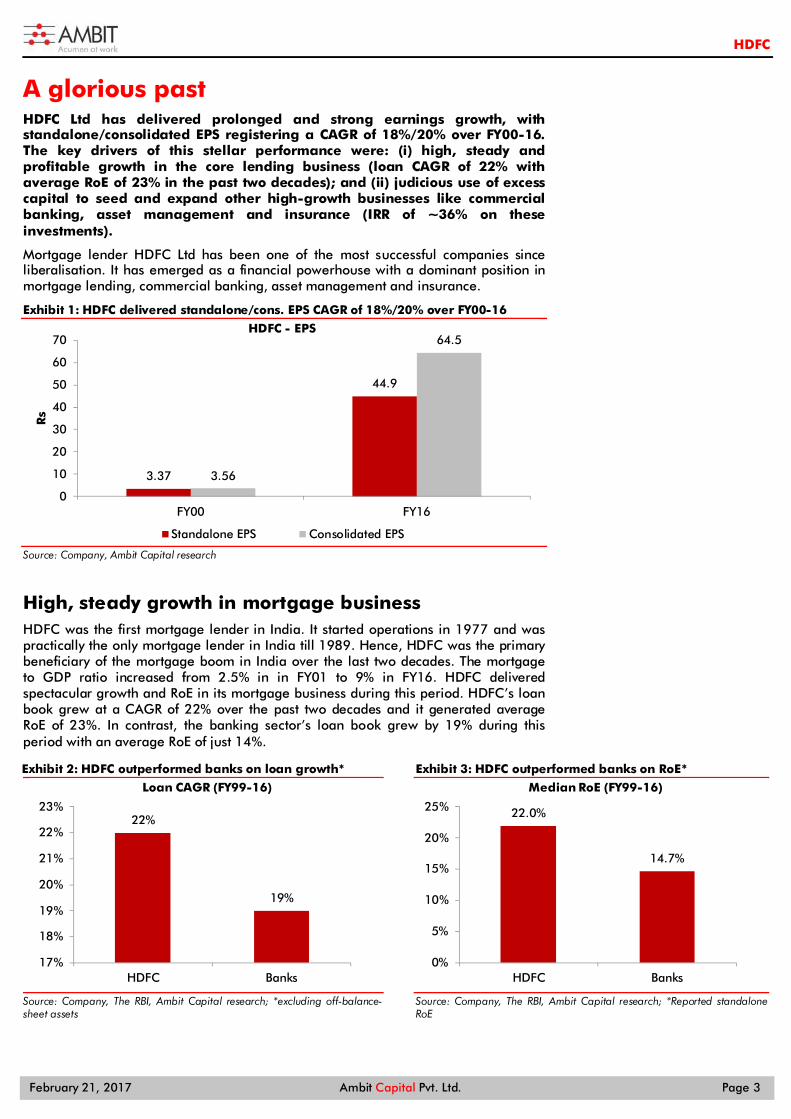
A glorious past HDFC Ltd has delivered prolonged and strong earnings growth, with standalone/consolidated EPS registering a CAGR of 18%/20% over FY00-16. The key drivers of this stellar performance were: (i) high, steady and profitable growth in the core lending business (loan CAGR of 22% with average RoE of 23% in the past two decades); and (ii) judicious use of excess capital to seed and expand other high-growth businesses like commercial banking, asset management and insurance (IRR of ~36% on these investments).
Mortgage lender HDFC Ltd has been one of the most successful companies since liberalisation. It has emerged as a financial powerhouse with a dominant position in mortgage lending, commercial banking, asset management and insurance.
Exhibit 1: HDFC delivered standalone/cons. EPS CAGR of 18%/20% over FY00-16
Source: Company, Ambit Capital research
High, steady growth in mortgage business HDFC was the first mortgage lender in India. It started operations in 1977 and was practically the only mortgage lender in India till 1989. Hence, HDFC was the primary beneficiary of the mortgage boom in India over the last two decades. The mortgage to GDP ratio increased from 2.5% in in FY01 to 9% in FY16. HDFC delivered spectacular growth and RoE in its mortgage business during this period. HDFC’s loan book grew at a CAGR of 22% over the past two decades and it generated average RoE of 23%. In contrast, the banking sector’s loan book grew by 19% during this period with an average RoE of just 14%.
Exhibit 2: HDFC outperformed banks on loan growth*
Source: Company, The RBI, Ambit Capital research; *excluding off-balance-sheet assets
Exhibit 3: HDFC outperformed banks on RoE*
Source: Company, The RBI, Ambit Capital research; *Reported standalone RoE
3.37
44.9
3.56
64.5
0
10
20
30
40
50
60
70
FY00 FY16
Rs
HDFC - EPS
Standalone EPS Consolidated EPS
22%
19%
17%
18%
19%
20%
21%
22%
23%
HDFC Banks
Loan CAGR (FY99-16)
22.0%
14.7%
0%
5%
10%
15%
20%
25%
HDFC Banks
Median RoE (FY99-16)
HDFC
February 21, 2017 Ambit Capital Pvt. Ltd. Page 4
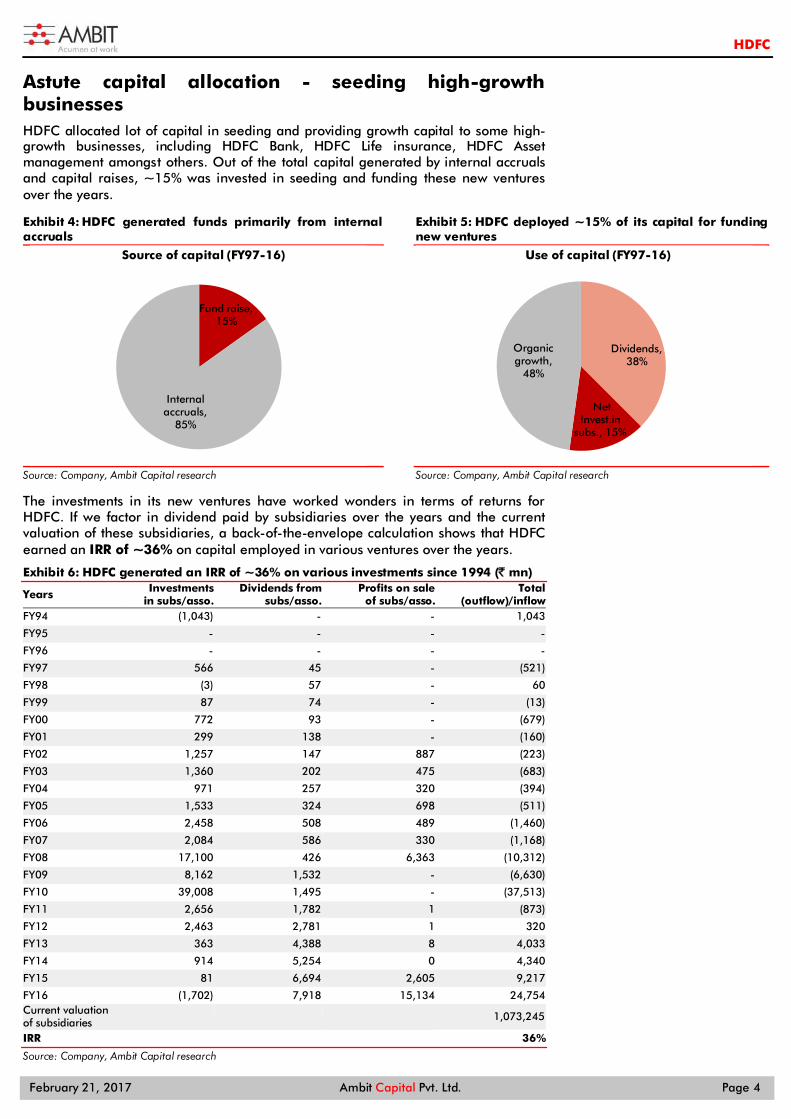
Astute capital allocation - seeding high-growth businesses HDFC allocated lot of capital in seeding and providing growth capital to some high-growth businesses, including HDFC Bank, HDFC Life insurance, HDFC Asset management amongst others. Out of the total capital generated by internal accruals and capital raises, ~15% was invested in seeding and funding these new ventures over the years.
Exhibit 4: HDFC generated funds primarily from internal accruals
Source: Company, Ambit Capital research
Exhibit 5: HDFC deployed ~15% of its capital for funding new ventures
Source: Company, Ambit Capital research
The investments in its new ventures have worked wonders in terms of returns for HDFC. If we factor in dividend paid by subsidiaries over the years and the current valuation of these subsidiaries, a back-of-the-envelope calculation shows that HDFC earned an IRR of ~36% on capital employed in various ventures over the years.
Exhibit 6: HDFC generated an IRR of ~36% on various investments since 1994 (` mn)
Years Investments in subs/asso.
Dividends from subs/asso.
Profits on sale of subs/asso.
Total (outflow)/inflow
FY94 (1,043) - - 1,043
FY95 - - - -
FY96 - - - -
FY97 566 45 - (521)
FY98 (3) 57 - 60
FY99 87 74 - (13)
FY00 772 93 - (679)
FY01 299 138 - (160)
FY02 1,257 147 887 (223)
FY03 1,360 202 475 (683)
FY04 971 257 320 (394)
FY05 1,533 324 698 (511)
FY06 2,458 508 489 (1,460)
FY07 2,084 586 330 (1,168)
FY08 17,100 426 6,363 (10,312)
FY09 8,162 1,532 - (6,630)
FY10 39,008 1,495 - (37,513)
FY11 2,656 1,782 1 (873)
FY12 2,463 2,781 1 320
FY13 363 4,388 8 4,033
FY14 914 5,254 0 4,340
FY15 81 6,694 2,605 9,217
FY16 (1,702) 7,918 15,134 24,754 Current valuation of subsidiaries 1,073,245
IRR 36%
Source: Company, Ambit Capital research
Fund raise, 15%
Internal accruals,
85%
Source of capital (FY97-16)
Dividends, 38%
Net Invest.in
subs., 15%
Organic growth,
48%
Use of capital (FY97-16)

HDFC
February 21, 2017 Ambit Capital Pvt. Ltd. Page 5
Exhibit 7: HDFC is the strongest large HFC on our IBAS framework
Particulars GRUH HDFC LICHF REPCO CNFIN DHFL PNBHF Comments
Innovation
Innovation in terms of ability to appraise a non-salaried borrower is the key to gain penetration in the under-served low-income segment. HDFC is mediocre on this metric owing to its lower exposure to self-employed borrowers.
Brand
Brand for a home loan borrower will depend on the perceived customer service and the perceived project financing abilities by the lender. HDFC enjoys the best brand amongst the HFCs due to superior perception on the above metrics.
Architecture
A robust branch network with decentralised decision making is the key to gain penetration in small-ticket housing finance. HDFC with ~400 branches and a decentralised decision making has one of the best architectures amongst peers, closely followed by DHFL and GRUH.
Strategic asset
Tie up with associate HDFC Bank, strong credit rating and a granular retail deposit franchise are the key strategic assets for HDFC.
Overall rank
HDFC comes out as one the strongest HFCs versus its peers due to its strengths in brand, architecture and strategic assets.
Source: Company, Ambit Capital research; Note: - Strong; - Relatively Strong; - Average; - Relatively weak.
HDFC
February 21, 2017 Ambit Capital Pvt. Ltd. Page 6
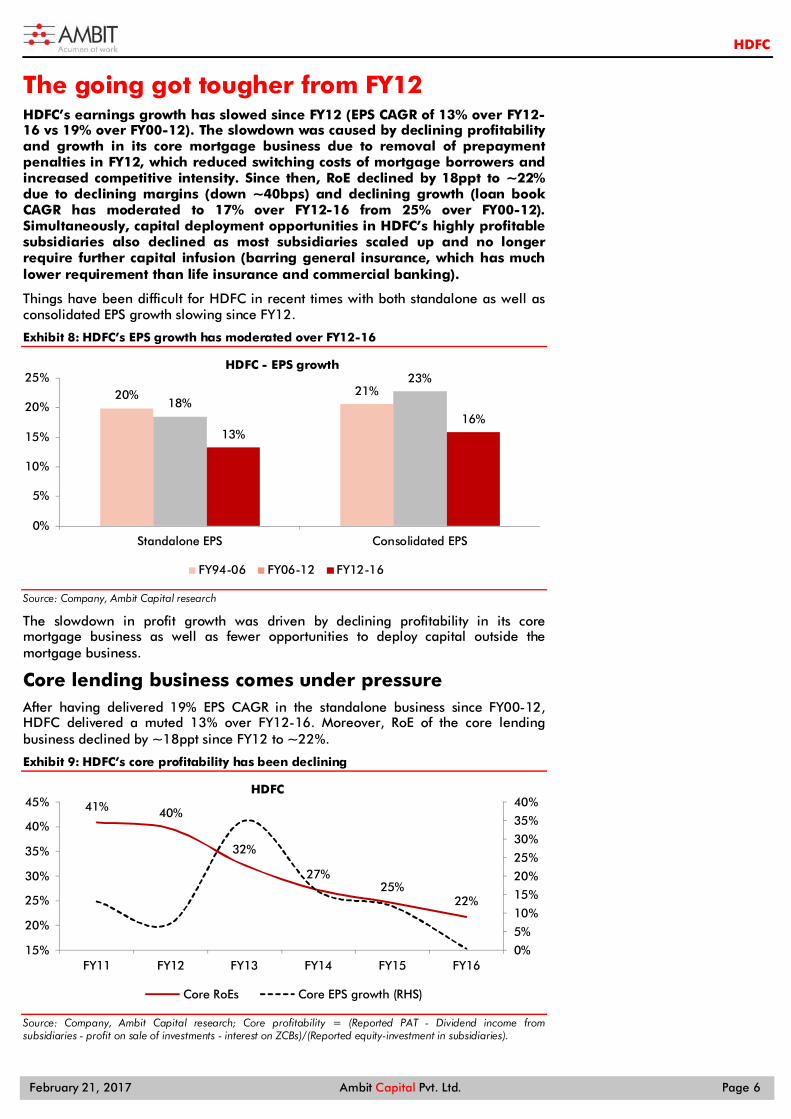
The going got tougher from FY12 HDFC’s earnings growth has slowed since FY12 (EPS CAGR of 13% over FY12-16 vs 19% over FY00-12). The slowdown was caused by declining profitability and growth in its core mortgage business due to removal of prepayment penalties in FY12, which reduced switching costs of mortgage borrowers and increased competitive intensity. Since then, RoE declined by 18ppt to ~22% due to declining margins (down ~40bps) and declining growth (loan book CAGR has moderated to 17% over FY12-16 from 25% over FY00-12). Simultaneously, capital deployment opportunities in HDFC’s highly profitable subsidiaries also declined as most subsidiaries scaled up and no longer require further capital infusion (barring general insurance, which has much lower requirement than life insurance and commercial banking).
Things have been difficult for HDFC in recent times with both standalone as well as consolidated EPS growth slowing since FY12.
Exhibit 8: HDFC’s EPS growth has moderated over FY12-16
Source: Company, Ambit Capital research
The slowdown in profit growth was driven by declining profitability in its core mortgage business as well as fewer opportunities to deploy capital outside the mortgage business.
Core lending business comes under pressure After having delivered 19% EPS CAGR in the standalone business since FY00-12, HDFC delivered a muted 13% over FY12-16. Moreover, RoE of the core lending business declined by ~18ppt since FY12 to ~22%.
Exhibit 9: HDFC’s core profitability has been declining
Source: Company, Ambit Capital research; Core profitability = (Reported PAT - Dividend income from subsidiaries - profit on sale of investments - interest on ZCBs)/(Reported equity-investment in subsidiaries).
20% 21%18%
23%
13%16%
0%
5%
10%
15%
20%
25%
Standalone EPS Consolidated EPS
HDFC - EPS growth
FY94-06 FY06-12 FY12-16
41% 40%
32%
27%25%
22%
0%
5%
10%
15%
20%
25%
30%
35%
40%
15%
20%
25%
30%
35%
40%
45%
FY11 FY12 FY13 FY14 FY15 FY16
HDFC
Core RoEs Core EPS growth (RHS)
HDFC
February 21, 2017 Ambit Capital Pvt. Ltd. Page 7
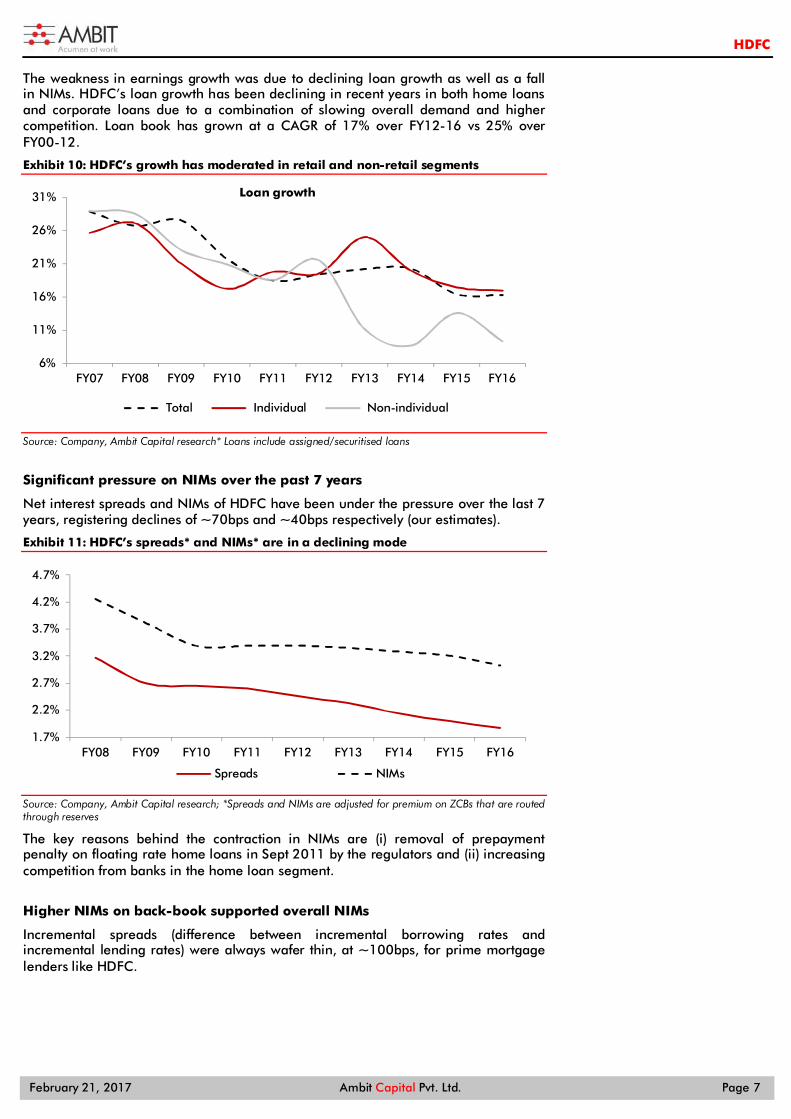
The weakness in earnings growth was due to declining loan growth as well as a fall in NIMs. HDFC’s loan growth has been declining in recent years in both home loans and corporate loans due to a combination of slowing overall demand and higher competition. Loan book has grown at a CAGR of 17% over FY12-16 vs 25% over FY00-12.
Exhibit 10: HDFC’s growth has moderated in retail and non-retail segments
Source: Company, Ambit Capital research* Loans include assigned/securitised loans
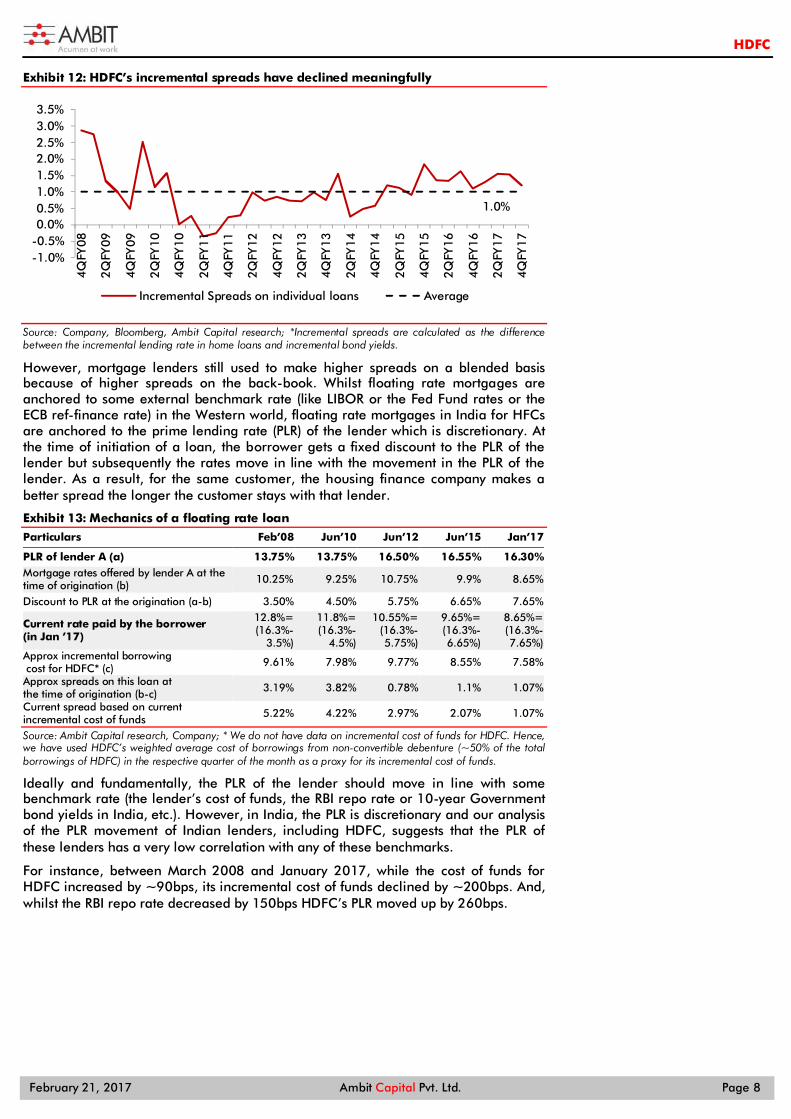
Significant pressure on NIMs over the past 7 years
Net interest spreads and NIMs of HDFC have been under the pressure over the last 7 years, registering declines of ~70bps and ~40bps respectively (our estimates).
Exhibit 11: HDFC’s spreads* and NIMs* are in a declining mode
Source: Company, Ambit Capital research; *Spreads and NIMs are adjusted for premium on ZCBs that are routed through reserves
The key reasons behind the contraction in NIMs are (i) removal of prepayment penalty on floating rate home loans in Sept 2011 by the regulators and (ii) increasing competition from banks in the home loan segment.
Higher NIMs on back-book supported overall NIMs
Incremental spreads (difference between incremental borrowing rates and incremental lending rates) were always wafer thin, at ~100bps, for prime mortgage lenders like HDFC.
6%
11%
16%
21%
26%
31%
FY07 FY08 FY09 FY10 FY11 FY12 FY13 FY14 FY15 FY16
Loan growth
Total Individual Non-individual
1.7%
2.2%
2.7%
3.2%
3.7%
4.2%
4.7%
FY08 FY09 FY10 FY11 FY12 FY13 FY14 FY15 FY16
Spreads NIMs
HDFC
February 21, 2017 Ambit Capital Pvt. Ltd. Page 8
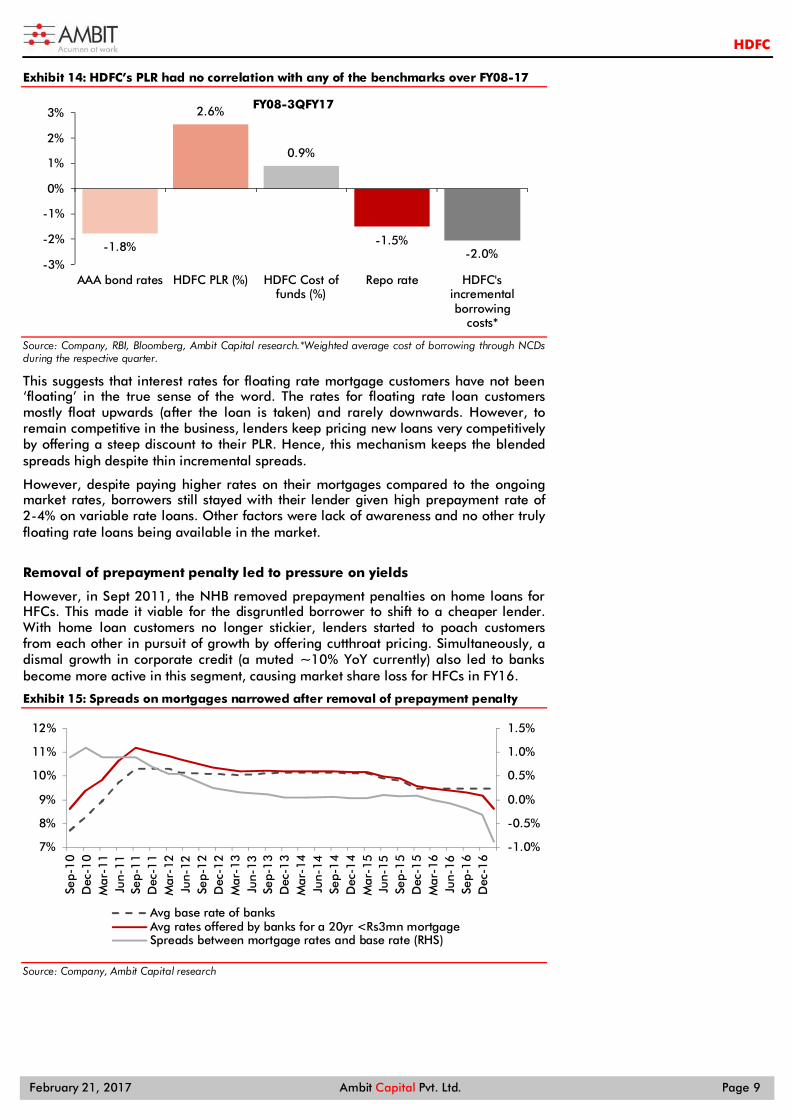
Exhibit 12: HDFC’s incremental spreads have declined meaningfully
Source: Company, Bloomberg, Ambit Capital research; *Incremental spreads are calculated as the difference between the incremental lending rate in home loans and incremental bond yields.
However, mortgage lenders still used to make higher spreads on a blended basis because of higher spreads on the back-book. Whilst floating rate mortgages are anchored to some external benchmark rate (like LIBOR or the Fed Fund rates or the ECB ref-finance rate) in the Western world, floating rate mortgages in India for HFCs are anchored to the prime lending rate (PLR) of the lender which is discretionary. At the time of initiation of a loan, the borrower gets a fixed discount to the PLR of the lender but subsequently the rates move in line with the movement in the PLR of the lender. As a result, for the same customer, the housing finance company makes a better spread the longer the customer stays with that lender.
Exhibit 13: Mechanics of a floating rate loan
Particulars Feb’08 Jun’10 Jun’12 Jun’15 Jan’17
PLR of lender A (a) 13.75% 13.75% 16.50% 16.55% 16.30% Mortgage rates offered by lender A at the time of origination (b) 10.25% 9.25% 10.75% 9.9% 8.65%
Discount to PLR at the origination (a-b) 3.50% 4.50% 5.75% 6.65% 7.65%
Current rate paid by the borrower (in Jan ’17)
12.8%= (16.3%-
3.5%)
11.8%= (16.3%-
4.5%)
10.55%= (16.3%-5.75%)
9.65%= (16.3%-6.65%)
8.65%= (16.3%-7.65%)
Approx incremental borrowing cost for HDFC* (c) 9.61% 7.98% 9.77% 8.55% 7.58%
Approx spreads on this loan at the time of origination (b-c) 3.19% 3.82% 0.78% 1.1% 1.07%
Current spread based on current incremental cost of funds 5.22% 4.22% 2.97% 2.07% 1.07%
Source: Ambit Capital research, Company; * We do not have data on incremental cost of funds for HDFC. Hence, we have used HDFC’s weighted average cost of borrowings from non-convertible debenture (~50% of the total borrowings of HDFC) in the respective quarter of the month as a proxy for its incremental cost of funds.
Ideally and fundamentally, the PLR of the lender should move in line with some benchmark rate (the lender’s cost of funds, the RBI repo rate or 10-year Government bond yields in India, etc.). However, in India, the PLR is discretionary and our analysis of the PLR movement of Indian lenders, including HDFC, suggests that the PLR of these lenders has a very low correlation with any of these benchmarks.
For instance, between March 2008 and January 2017, while the cost of funds for HDFC increased by ~90bps, its incremental cost of funds declined by ~200bps. And, whilst the RBI repo rate decreased by 150bps HDFC’s PLR moved up by 260bps.
1.0%
-1.0%-0.5%0.0%0.5%1.0%1.5%2.0%2.5%3.0%3.5%
4QFY
08
2QFY
09
4QFY
09
2QFY
10
4QFY
10
2QFY
11
4QFY
11
2QFY
12
4QFY
12
2QFY
13
4QFY
13
2QFY
14
4QFY
14
2QFY
15
4QFY
15
2QFY
16
4QFY
16
2QFY
17
4QFY
17
Incremental Spreads on individual loans Average
HDFC
February 21, 2017 Ambit Capital Pvt. Ltd. Page 9
Exhibit 14: HDFC’s PLR had no correlation with any of the benchmarks over FY08-17
Source: Company, RBI, Bloomberg, Ambit Capital research.*Weighted average cost of borrowing through NCDs during the respective quarter.
This suggests that interest rates for floating rate mortgage customers have not been ‘floating’ in the true sense of the word. The rates for floating rate loan customers mostly float upwards (after the loan is taken) and rarely downwards. However, to remain competitive in the business, lenders keep pricing new loans very competitively by offering a steep discount to their PLR. Hence, this mechanism keeps the blended spreads high despite thin incremental spreads.
However, despite paying higher rates on their mortgages compared to the ongoing market rates, borrowers still stayed with their lender given high prepayment rate of 2-4% on variable rate loans. Other factors were lack of awareness and no other truly floating rate loans being available in the market.
Removal of prepayment penalty led to pressure on yields
However, in Sept 2011, the NHB removed prepayment penalties on home loans for HFCs. This made it viable for the disgruntled borrower to shift to a cheaper lender. With home loan customers no longer stickier, lenders started to poach customers from each other in pursuit of growth by offering cutthroat pricing. Simultaneously, a dismal growth in corporate credit (a muted ~10% YoY currently) also led to banks become more active in this segment, causing market share loss for HFCs in FY16.
Exhibit 15: Spreads on mortgages narrowed after removal of prepayment penalty
Source: Company, Ambit Capital research
-1.8%
2.6%
0.9%
-1.5%-2.0%
-3%
-2%
-1%
0%
1%
2%
3%
AAA bond rates HDFC PLR (%) HDFC Cost offunds (%)
Repo rate HDFC'sincrementalborrowing
costs*
FY08-3QFY17
-1.0%
-0.5%
0.0%
0.5%
1.0%
1.5%
7%
8%
9%
10%
11%
12%
Sep-
10
Dec
-10
Mar
-11
Jun-
11Se
p-1
1D
ec-1
1M
ar-1
2Ju
n-12
Sep-
12
Dec
-12
Mar
-13
Jun-
13Se
p-1
3D
ec-1
3M
ar-1
4Ju
n-14
Sep-
14
Dec
-14
Mar
-15
Jun-
15Se
p-1
5D
ec-1
5M
ar-1
6Ju
n-16
Sep-
16
Dec
-16
Avg base rate of banksAvg rates offered by banks for a 20yr <Rs3mn mortgageSpreads between mortgage rates and base rate (RHS)

HDFC
February 21, 2017 Ambit Capital Pvt. Ltd. Page 10
Exhibit 16: Banks growth rate has picked up in home loans in recent years with growth rate slowing down for HDFC
Source: RBI, Company, Ambit Capital research
The increased competition resulted in not only lower yields for HDFC but also increased prepayments. So, loan growth and margins have declined meaningfully since FY11.
Exhibit 17: HDFC’s repayment rates have structurally risen due to increasing competition
Source: Company, Ambit Capital research; *for overall book (including developer loans). *Repayment rate is calculated as ((Loan book year 1 – Loan book year 2 + disbursements)/ Loan book year 1).
Reinvestment opportunities have declined Declining growth and profitability in HDFC’s core mortgage business has also coincided with declining opportunities of capital deployment in its highly profitable subsidiaries. This is because its subsidiaries barring the general insurance business have scaled up and are profitable now and no longer require further capital infusion from HDFC. In general insurance, too, the requirement seems to be lower than for businesses like life insurance and commercial banking.
Exhibit 18: HDFC’s subsidiaries are now profitable and don’t need external capital infusion
RoE FY14 FY15 FY16 Capital infusion requirement
HDFC Bank 21.3% 19.4% 18.3% Its TTM loan book growth has slowed down to 21%, broadly in line with RoE. It can sustain growth through internal accruals.
GRUH Fin Ltd. 32.2% 30.9% 31.5% Its TTM loan book growth has slowed down to 22%, lower than RoE. It can sustain growth through internal accruals.
HDFC Std Life Ins. 44.7% 35.1% 28.7% Its solvency ratio is at 209% versus the regulatory requirement of 150%. It can sustain growth through internal accruals.
HDFC ERGO Gen Ins Co. 24.4% 11.1% 14.6% Its solvency ratio is at 152% versus the regulatory requirement of 150%. It needs capital.
HDFC AMC 44.6% 41.1% 42.1% It is a cash rich business and it doesn’t require capital.
Source: Company, Ambit Capital research
0%
5%
10%
15%
20%
25%
30%
35%
FY07 FY08 FY09 FY10 FY11 FY12 FY13 FY14 FY15 FY16
YoY growth - Retail home loans
Banks
HDFC
0%5%
10%15%20%25%30%35%40%45%50%
FY94
FY95
FY96
FY97
FY98
FY99
FY00
FY01
FY02
FY03
FY04
FY05
FY06
FY07
FY08
FY09
FY10
FY11
FY12
FY13
FY14
FY15
FY16
Repayment rate* (HDFC)

HDFC
February 21, 2017 Ambit Capital Pvt. Ltd. Page 11
The decrease in investment opportunities outside the mortgage business is also reflected in the decline in investments in associates/subsidiaries as a percentage of shareholder equity in recent times.
Exhibit 19: HDFC’s declining investments
Source: Company, Ambit Capital research
20%23% 22% 25%
29%
50%46%
43%
33%30%
27%24%
0%
10%
20%
30%
40%
50%
60%
FY05 FY06 FY07 FY08 FY09 FY10 FY11 FY12 FY13 FY14 FY15 FY16
Investments in asso./subs (% of networth)

HDFC
February 21, 2017 Ambit Capital Pvt. Ltd. Page 12
RoE/growth of mortgage business waning HDFC’s growth would moderate to 14% CAGR over FY16-19E from 19% over FY11-16, given: (i) slowing of ticket size growth (contributing 60% of total growth) as real estate prices moderate and (ii) increasing competition not only in home loans but also in construction financing and lease rental discounting (challengers like Indiabulls Housing Finance, Piramal Enterprises and PNBHF). Profitability faces challenges from a further decline in NIMs (down ~50bps over FY16-19E) as well as deterioration in asset quality (credit costs to remain elevated at 12-13bps over FY16-19E vs ~6bps over FY11-15). NIMs face risks of structural decline as blended spreads on individual loans (~140bps) converge towards incremental spreads (~120bps), lack of room to increase cheaper bond borrowings (~56% now) and tightening of loose regulations (introduction of base rates etc.) on loan pricing. Notwithstanding prudent underwriting, asset quality could worsen from peak levels given increasing risks of low borrower equity and a high proportion of under-construction homes.
Though NIMs and growth in the lending business have been declining since FY11, we expect further pressure on growth and NIMs, resulting in a decline in core mortgage business RoE to 18% by FY19 from 22% in FY16.
Growth to remain muted HDFC’s AUM growth would remain muted. We expect it to decline to 14% CAGR over FY16-19E from 19% over FY12-16 driven by following factors:
1. Declining growth in ticket size
Increasing real estate price has been a major driver of high growth in the mortgage segment over the last 7-8 years with ticket sizes contributing as much as 50-60% of growth of the lenders.
Exhibit 20: Increasing real estate prices have driven loan growth
CAGR
Loans No. of Customers
Avg. Ticket size
Time period
HDFC 19% 7% 11% FY08-16
LICHF 21% 8% 13% FY08-16
Source: Company, Ambit Capital research
However, demonetisation is expected to bring down real estate prices as real estate has been a safe haven for black money (cash transactions account for 30-40% of transactions). With the system being short of cash than earlier levels, liquidity in the real estate market is expected to be sucked out and prices are expected to decline. Moreover, the Government’s crusade against black money is not going to halt just at demonetisation. With the amendments to the Benami Property law expected to be operational soon, there are expectations that real estate holdings of individuals in the country would also be digitised to identify ‘Benami properties’ bought against unexplained income. This would not only lead to a further decline in real estate prices but also in lower transactions, resulting in declining growth for mortgage lenders both in terms of number of customers and average ticket sizes.
HDFC
February 21, 2017 Ambit Capital Pvt. Ltd. Page 13
2. Declining investor demand
A rapid increase in real estate prices since 2006 led to increased investor participation in home purchase for quick gains. This was evident in the rising number of vacant homes, which accounted for 20% of the incremental housing stock over FY01-11 versus 10% in FY91-01. However, investor participation is expected to decline as:
Real estate has delivered lacklustre returns of late versus other asset classes. This has resulted in dwindling interest amongst investors.
There is less demand to hide black money with most of it sucked out of the system owing to the demonetisation. Hence, the “safe haven” demand for real estate has deteriorated.
One of the key reasons of real estate’s popularity as an investment tool was tax savings as interest on home loans could be fully expensed if the home is classified as a let-out property. The budget has proposed to restrict the loss from let-out house property to `200,000 (versus no limit earlier). This could increase the interest burden (net of tax shield) and cost of holding of the investors by up to 33%, especially for home loans where ticket sizes are over `2mn. Consequently, investor demand is expected to further dwindle for larger-ticket homes (>`2.5mn). With ~50% of HFC disbursements for loans exceeding `2.5mn and HDFC being a market leader amongst HFCs, loan book growth should be affected by the potential decline investor demand.
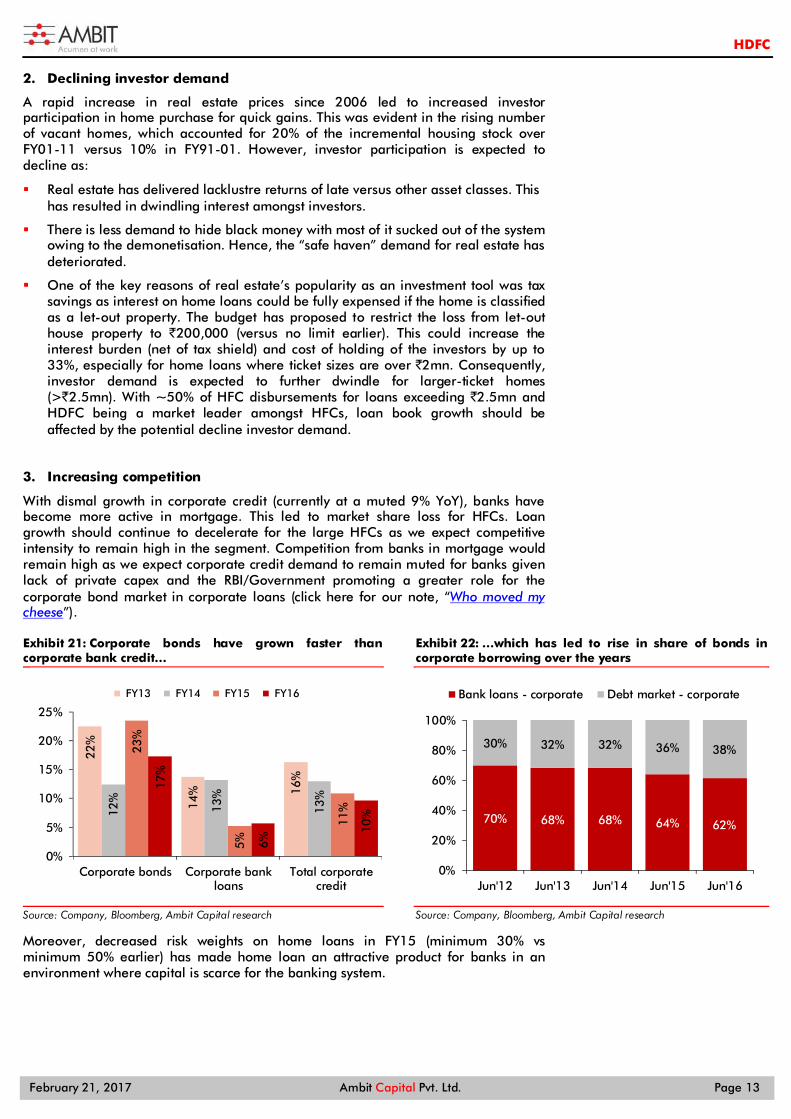
3. Increasing competition
With dismal growth in corporate credit (currently at a muted 9% YoY), banks have become more active in mortgage. This led to market share loss for HFCs. Loan growth should continue to decelerate for the large HFCs as we expect competitive intensity to remain high in the segment. Competition from banks in mortgage would remain high as we expect corporate credit demand to remain muted for banks given lack of private capex and the RBI/Government promoting a greater role for the corporate bond market in corporate loans (click here for our note, “Who moved my cheese”).
Exhibit 21: Corporate bonds have grown faster than corporate bank credit…
Source: Company, Bloomberg, Ambit Capital research
Exhibit 22: …which has led to rise in share of bonds in corporate borrowing over the years
Source: Company, Bloomberg, Ambit Capital research
Moreover, decreased risk weights on home loans in FY15 (minimum 30% vs minimum 50% earlier) has made home loan an attractive product for banks in an environment where capital is scarce for the banking system.
22%
14% 16
%
12%
13%
13%
23%
5%
11%
17%
6%
10%
0%
5%
10%
15%
20%
25%
Corporate bonds Corporate bankloans
Total corporatecredit
FY13 FY14 FY15 FY16
70% 68% 68% 64% 62%
30% 32% 32% 36% 38%
0%
20%
40%
60%
80%
100%
Jun'12 Jun'13 Jun'14 Jun'15 Jun'16
Bank loans - corporate Debt market - corporate

HDFC
February 21, 2017 Ambit Capital Pvt. Ltd. Page 14
Exhibit 23: Home loans provide higher profitability for banks due to higher leverage
FY16 Bank – Corp. loans
Bank – Home loans
HFC – Home loans
Yield on loans 9.0% 9.0% 9.7%
Cost of funds 5.4% 5.7% 6.9%
- Liability cost 5.0% 5.3% 6.9%
- Regulatory cost 0.38% 0.40% 0.02%
NIM 3.6% 3.3% 2.7%
Other income 0.6% 0.5% 0.1%
Total income 4.2% 3.8% 2.9%
Opex 1.0% 1.3% 0.3%
PPOP 3.2% 2.5% 2.6%
Credit costs 1.0% 0.5% 0.2%
PBT 2.2% 2.0% 2.4%
Tax 0.7% 0.7% 0.8%
RoA 1.5% 1.3% 1.6%
Leverage 11 27 12.7
RoE 16% 36% 20%
Cost of liabilities FDs 7.0% 7.0% 7.5%
CASA 3.0% 3.0% NA
Bonds 7.5% 7.5% 7.5%
Incremental liability mix FDs 48.3% 48.3% 30.0%
CASA 38.7% 38.7% NA
Bonds 13.0% 13.0% 70.0%
Regulatory cost* 0.42% 0.42% 0.02%
Source: Ambit Capital research; * Regulatory cost includes cost of CRR/SLR and PSL carry.
Moreover, even within HFCs, competition is increasing with many new players like CANFIN Homes, PNB Housing Finance and Indiabulls emerging as competitors for HDFC (apart from LIC Housing). Increasing regulatory thrust on housing finance has meant that NHB has also been giving out more licenses. For e.g., the number of HFCs operating in affordable housing finance is up from 43 in 2009 to 71 in 2016.
Exhibit 24: Competition has grown faster than HDFC in core home loans segment
Source: Company, Ambit Capital research; * We have used overall loan book growth as proxy of growth in non-retail loan book for PNBHF due to lack of data availability.
4. No more the sole tapper of bond markets
Historically, HDFC’s key competitive advantage over other HFCs was its ability to source low-cost funds by tapping the bond markets. However, with more HFCs now able to source funds from bond markets due to regulatory relaxations, smaller HFCs ability to compete with HDFC in its core salary home loan market has significantly increased.
0%
10%
20%
30%
40%
50%
60%
70%
80%
HDFC LICHF IBULL PNBHF DEWAN REPCO CANFIN
FY12
FY13
FY14
FY15
FY16
3Q17
HDFC
February 21, 2017 Ambit Capital Pvt. Ltd. Page 15
Exhibit 25: Other HFCs have scaled up non-bank borrowings more rapidly than HDFC
Source: Company, Ambit Capital research
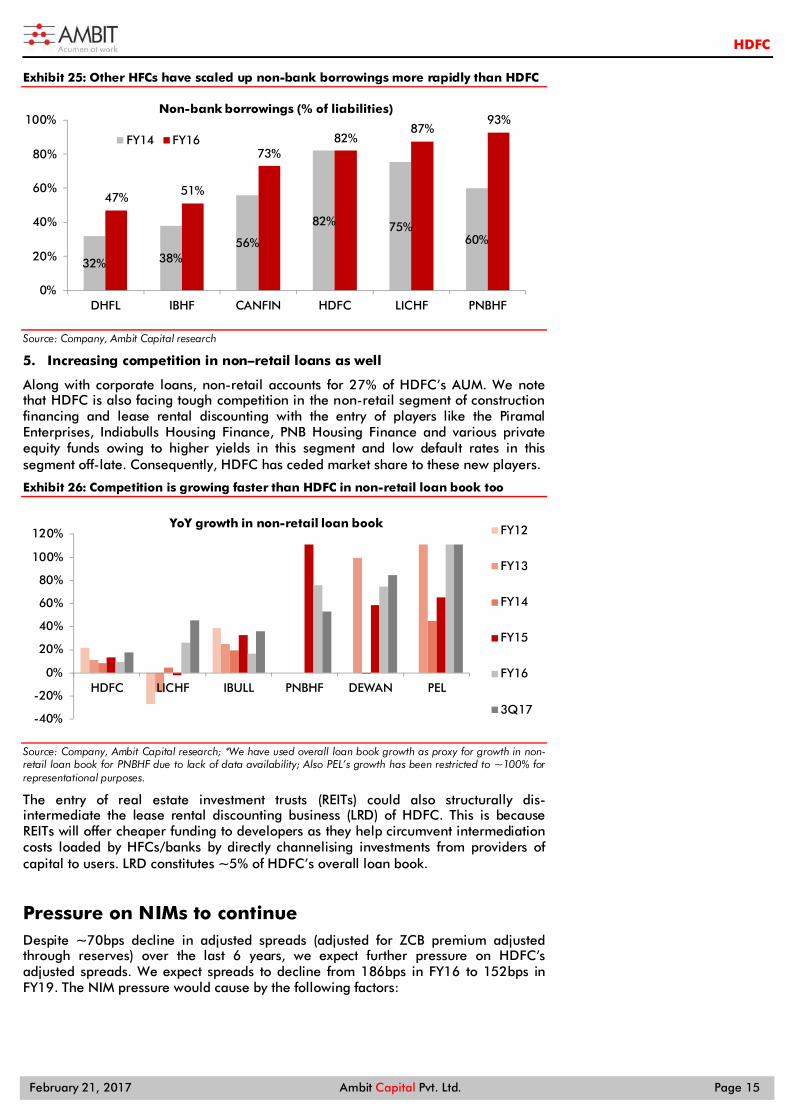
5. Increasing competition in non–retail loans as well
Along with corporate loans, non-retail accounts for 27% of HDFC’s AUM. We note that HDFC is also facing tough competition in the non-retail segment of construction financing and lease rental discounting with the entry of players like the Piramal Enterprises, Indiabulls Housing Finance, PNB Housing Finance and various private equity funds owing to higher yields in this segment and low default rates in this segment off-late. Consequently, HDFC has ceded market share to these new players.
Exhibit 26: Competition is growing faster than HDFC in non-retail loan book too
Source: Company, Ambit Capital research; *We have used overall loan book growth as proxy for growth in non-retail loan book for PNBHF due to lack of data availability; Also PEL’s growth has been restricted to ~100% for representational purposes.
The entry of real estate investment trusts (REITs) could also structurally dis-intermediate the lease rental discounting business (LRD) of HDFC. This is because REITs will offer cheaper funding to developers as they help circumvent intermediation costs loaded by HFCs/banks by directly channelising investments from providers of capital to users. LRD constitutes ~5% of HDFC’s overall loan book.
Pressure on NIMs to continue Despite ~70bps decline in adjusted spreads (adjusted for ZCB premium adjusted through reserves) over the last 6 years, we expect further pressure on HDFC’s adjusted spreads. We expect spreads to decline from 186bps in FY16 to 152bps in FY19. The NIM pressure would cause by the following factors:
32% 38%56%
82% 75%60%
47% 51%
73%82%
87%93%
0%
20%
40%
60%
80%
100%
DHFL IBHF CANFIN HDFC LICHF PNBHF
Non-bank borrowings (% of liabilities)
FY14 FY16
-40%
-20%
0%
20%
40%
60%
80%
100%
120%
HDFC LICHF IBULL PNBHF DEWAN PEL
YoY growth in non-retail loan book FY12
FY13
FY14
FY15
FY16
3Q17
HDFC
February 21, 2017 Ambit Capital Pvt. Ltd. Page 16
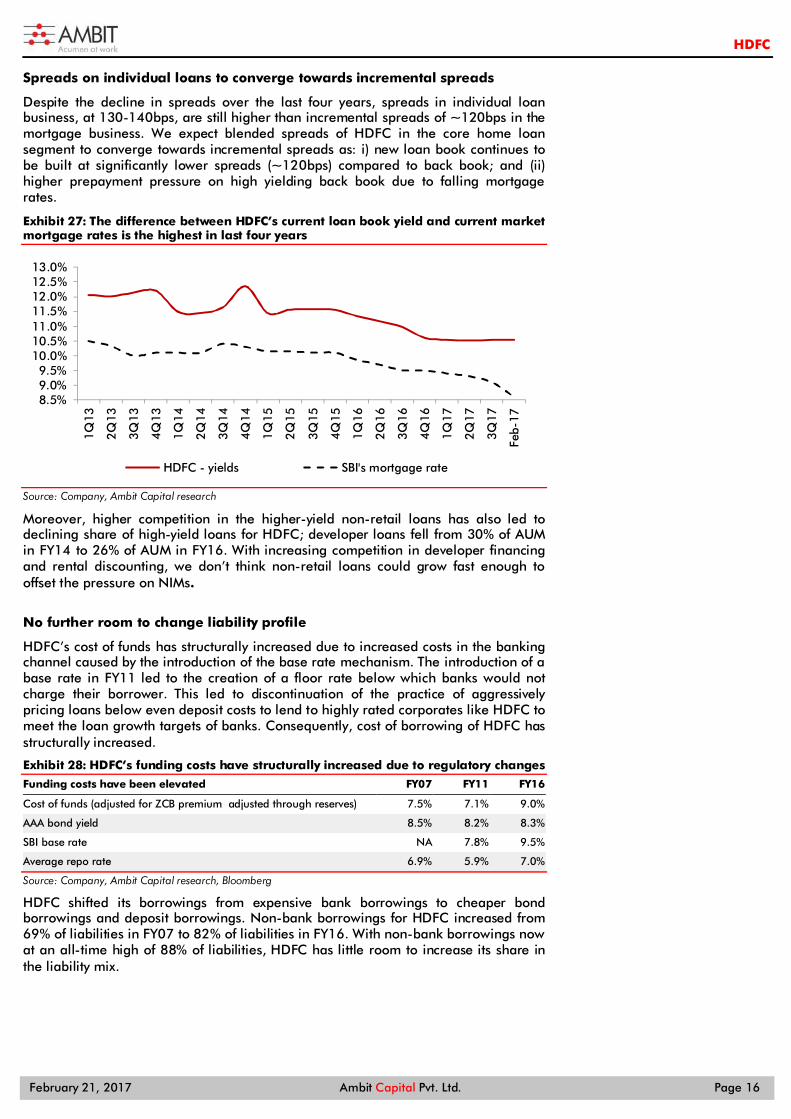
Spreads on individual loans to converge towards incremental spreads
Despite the decline in spreads over the last four years, spreads in individual loan business, at 130-140bps, are still higher than incremental spreads of ~120bps in the mortgage business. We expect blended spreads of HDFC in the core home loan segment to converge towards incremental spreads as: i) new loan book continues to be built at significantly lower spreads (~120bps) compared to back book; and (ii) higher prepayment pressure on high yielding back book due to falling mortgage rates.
Exhibit 27: The difference between HDFC’s current loan book yield and current market mortgage rates is the highest in last four years
Source: Company, Ambit Capital research
Moreover, higher competition in the higher-yield non-retail loans has also led to declining share of high-yield loans for HDFC; developer loans fell from 30% of AUM in FY14 to 26% of AUM in FY16. With increasing competition in developer financing and rental discounting, we don’t think non-retail loans could grow fast enough to offset the pressure on NIMs.
No further room to change liability profile
HDFC’s cost of funds has structurally increased due to increased costs in the banking channel caused by the introduction of the base rate mechanism. The introduction of a base rate in FY11 led to the creation of a floor rate below which banks would not charge their borrower. This led to discontinuation of the practice of aggressively pricing loans below even deposit costs to lend to highly rated corporates like HDFC to meet the loan growth targets of banks. Consequently, cost of borrowing of HDFC has structurally increased.
Exhibit 28: HDFC’s funding costs have structurally increased due to regulatory changes
Funding costs have been elevated FY07 FY11 FY16
Cost of funds (adjusted for ZCB premium adjusted through reserves) 7.5% 7.1% 9.0%
AAA bond yield 8.5% 8.2% 8.3%
SBI base rate NA 7.8% 9.5%
Average repo rate 6.9% 5.9% 7.0%
Source: Company, Ambit Capital research, Bloomberg
HDFC shifted its borrowings from expensive bank borrowings to cheaper bond borrowings and deposit borrowings. Non-bank borrowings for HDFC increased from 69% of liabilities in FY07 to 82% of liabilities in FY16. With non-bank borrowings now at an all-time high of 88% of liabilities, HDFC has little room to increase its share in the liability mix.
8.5%9.0%9.5%
10.0%10.5%11.0%11.5%12.0%12.5%13.0%
1Q13
2Q13
3Q13
4Q13
1Q14
2Q14
3Q14
4Q14
1Q15
2Q15
3Q15
4Q15
1Q16
2Q16
3Q16
4Q16
1Q17
2Q17
3Q17
Feb-
17
HDFC - yields SBI's mortgage rate
HDFC
February 21, 2017 Ambit Capital Pvt. Ltd. Page 17
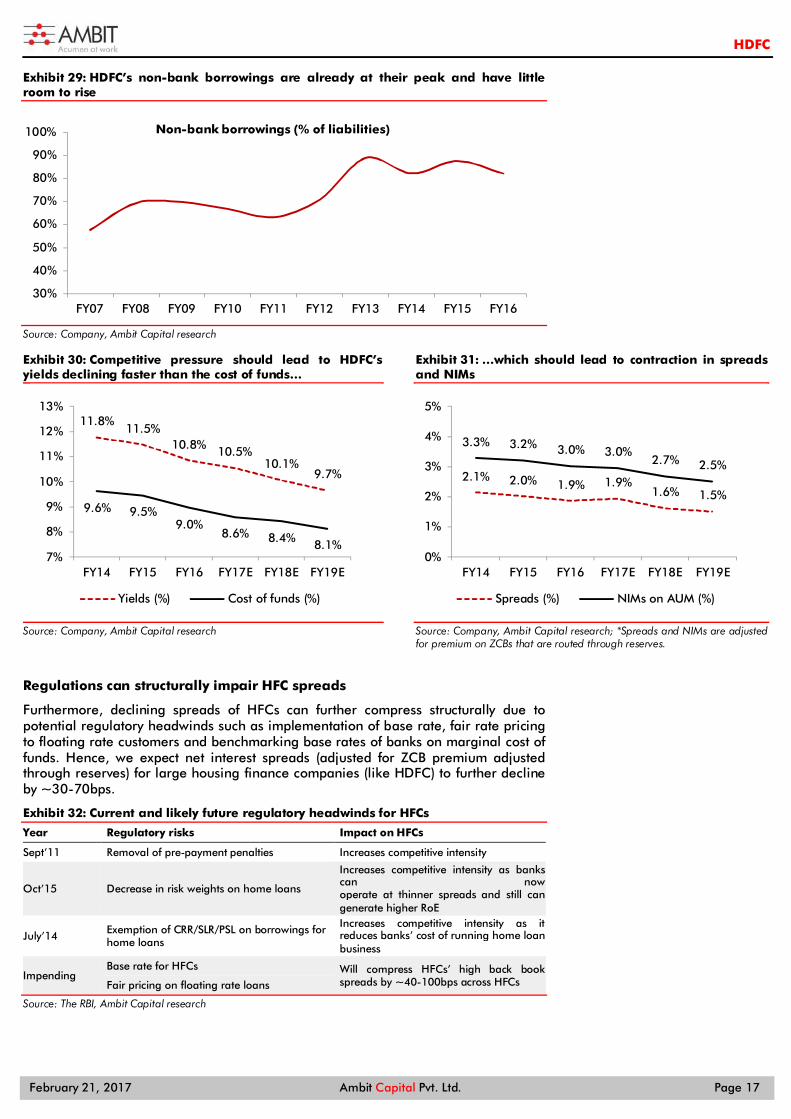
Exhibit 29: HDFC’s non-bank borrowings are already at their peak and have little room to rise
Source: Company, Ambit Capital research
Exhibit 30: Competitive pressure should lead to HDFC’s yields declining faster than the cost of funds…
Source: Company, Ambit Capital research
Exhibit 31: …which should lead to contraction in spreads and NIMs
Source: Company, Ambit Capital research; *Spreads and NIMs are adjusted for premium on ZCBs that are routed through reserves.
Regulations can structurally impair HFC spreads
Furthermore, declining spreads of HFCs can further compress structurally due to potential regulatory headwinds such as implementation of base rate, fair rate pricing to floating rate customers and benchmarking base rates of banks on marginal cost of funds. Hence, we expect net interest spreads (adjusted for ZCB premium adjusted through reserves) for large housing finance companies (like HDFC) to further decline by ~30-70bps.
Exhibit 32: Current and likely future regulatory headwinds for HFCs
Year Regulatory risks Impact on HFCs
Sept’11 Removal of pre-payment penalties Increases competitive intensity
Oct’15 Decrease in risk weights on home loans
Increases competitive intensity as banks can now operate at thinner spreads and still can generate higher RoE
July’14 Exemption of CRR/SLR/PSL on borrowings for home loans
Increases competitive intensity as it reduces banks’ cost of running home loan business
Impending Base rate for HFCs Will compress HFCs’ high back book
spreads by ~40-100bps across HFCs Fair pricing on floating rate loans
Source: The RBI, Ambit Capital research
30%
40%
50%
60%
70%
80%
90%
100%
FY07 FY08 FY09 FY10 FY11 FY12 FY13 FY14 FY15 FY16
Non-bank borrowings (% of liabilities)
11.8%11.5%
10.8% 10.5%10.1%
9.7%
9.6% 9.5%9.0%
8.6% 8.4% 8.1%7%
8%
9%
10%
11%
12%
13%
FY14 FY15 FY16 FY17E FY18E FY19E
Yields (%) Cost of funds (%)
2.1% 2.0% 1.9% 1.9%1.6% 1.5%
3.3% 3.2% 3.0% 3.0%2.7% 2.5%
0%
1%
2%
3%
4%
5%
FY14 FY15 FY16 FY17E FY18E FY19E
Spreads (%) NIMs on AUM (%)

HDFC
February 21, 2017 Ambit Capital Pvt. Ltd. Page 18
Asset quality pressure could emerge As highlighted in our thematic note dated 18th January (HFCs: Past perfect, Future tense, click here for the link), HFCs face increasing risks in their loan books due to lower borrower equity and higher borrower risk profile in an environment of declining real estate prices. We assess risks in the loan book of HFCs based on: i) high share of builder loans; ii) high share of LAP, especially the high-ticket segments; iii) high share of under-construction homes (excluding self-construction); iv) low seasoning of the book; v) low provisioning coverage; and vi) high share of non-salaried borrowers. Our assessment indicates that HDFC stands in the middle rung in the framework owing to:
A very high share of builder and corporate loans, at 27% of loan book;
Undisclosed share of under-construction loans in its book; which could be high. This is because of 72% of disbursements of HFCs are for acquisition/construction of new homes and HDFC is the market leader amongst HFCs;
Relatively high share of recent disbursements in loan book (72% of AUM).
Exhibit 33: HDFC’s high share of builder loans, undisclosed share of under-construction homes and recent disbursements are a cause of worry Particulars HDFC LICHF IBULL PNBHF DHFL GRUH REPCO CNFIN
Builder/corp. loans (% of AUM) 27% 3% 29% 9% 8% 3% 0% 0%
LAP loans (% of AUM) 4% 9% 37% 26% 16% 11% 20% 6%
LAP (ATS, ` mn) NA 1.9 7.3 5.6 2.5 0.8 2.3 1.3
Under-construction (% of HL) NA 65% 35% 37% 12% 2% 15% 4%
Recent disb (% of AUM) 74% 53% 76% 88% 63% 63% 65% 68%
Provisioning coverage (%) 74% 47% 71% 36% 41% 71% 64% 100%
Non-sal. borrowers (% of HL) 15% 16% 30% 39% 45% 36% 49% 16%
Source: Company, Ambit capital research
Exhibit 34: HDFC is placed in the middle rung in terms of asset quality
Metrics HDFC LICHF IBULL PNBHF DEWAN GRUH REPCO CANFIN
Builder loans
LAP
Under-construction
Recent disb (% of AUM)
Provisioning coverage (%)
Non-salaried borrowers
Aggregate
Source: Company, Ambit capital research. Note: - Strong; - Relatively Strong; - Average;
- Relatively weak
The increasing risks for HDFC are also reflected in its increasing NPAs and credit costs. Consequently, the best in asset quality for HDFC is definitely behind. We expect gross NPAs for HDFC to increase by ~38bps and credit costs to remain elevated at 12-13bps over FY18-19E. Note that HDFC is carrying excess provisions of ~`10bn on its balance sheet, which can be used to provide for increasing gross NPAs. Should HDFC decide to use such provisions, its credit costs may not rise proportionately with gross NPAs over FY18-19E.

HDFC
February 21, 2017 Ambit Capital Pvt. Ltd. Page 19
Exhibit 35: HDFC’s gross NPA growth YoY is showing an uptrend
Source: Company, Ambit capital research
Exhibit 36: HDFC’s credit cost has increased from lows and should remain elevated
Source: Company, Ambit capital research
-40%
-20%
0%
20%
40%
60%
80%
100%
HDFC LICHF REPCO GRUH CANFIN IBULLS DEWAN PNBHF
FY12
FY13
FY14
FY15
FY16
0.06% 0.06%0.08%
0.05%0.07%
0.26%
0.22%
0.12% 0.13%
0.00%
0.10%
0.20%
0.30%
0.40%
FY11 FY12 FY13 FY14 FY15 FY16 FY17E FY18E FY19E
HDFC credit costs (% of AUM)
HDFC
February 21, 2017 Ambit Capital Pvt. Ltd. Page 20
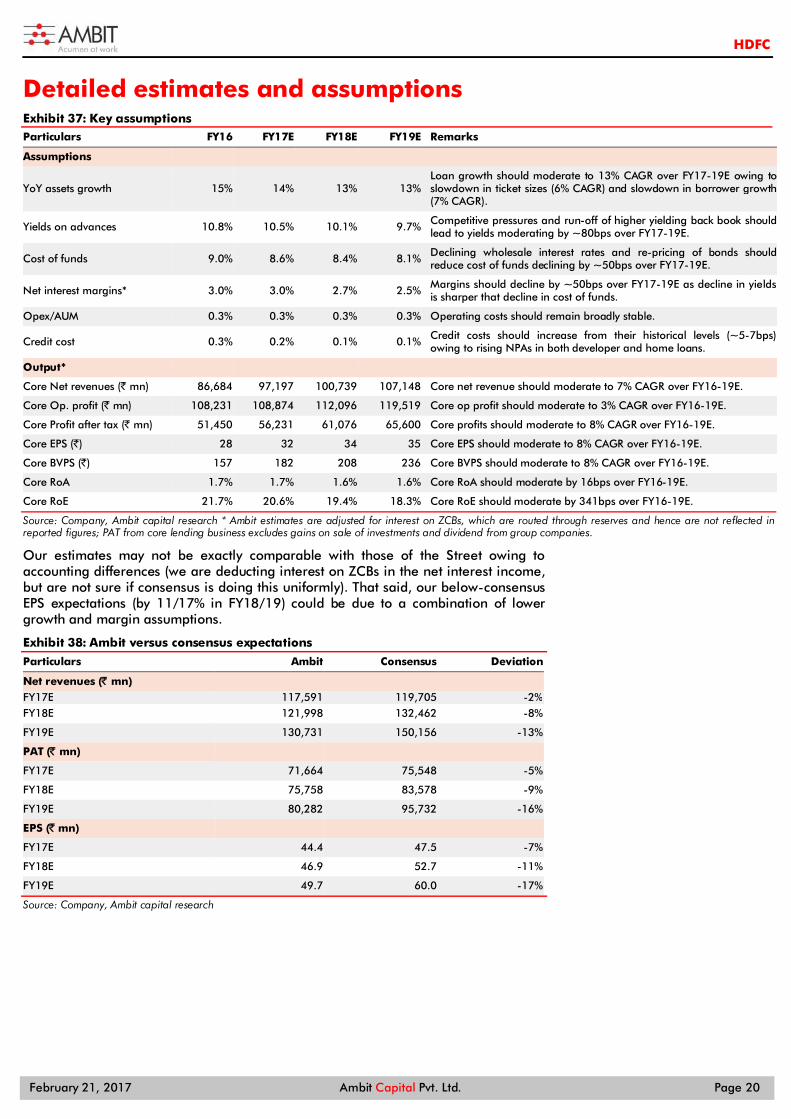
Detailed estimates and assumptions Exhibit 37: Key assumptions Particulars FY16 FY17E FY18E FY19E Remarks
Assumptions
YoY assets growth 15% 14% 13% 13% Loan growth should moderate to 13% CAGR over FY17-19E owing to slowdown in ticket sizes (6% CAGR) and slowdown in borrower growth (7% CAGR).
Yields on advances 10.8% 10.5% 10.1% 9.7% Competitive pressures and run-off of higher yielding back book should lead to yields moderating by ~80bps over FY17-19E.
Cost of funds 9.0% 8.6% 8.4% 8.1% Declining wholesale interest rates and re-pricing of bonds should reduce cost of funds declining by ~50bps over FY17-19E.
Net interest margins* 3.0% 3.0% 2.7% 2.5% Margins should decline by ~50bps over FY17-19E as decline in yields is sharper that decline in cost of funds.
Opex/AUM 0.3% 0.3% 0.3% 0.3% Operating costs should remain broadly stable.
Credit cost 0.3% 0.2% 0.1% 0.1% Credit costs should increase from their historical levels (~5-7bps) owing to rising NPAs in both developer and home loans.
Output*
Core Net revenues (` mn) 86,684 97,197 100,739 107,148 Core net revenue should moderate to 7% CAGR over FY16-19E.
Core Op. profit (` mn) 108,231 108,874 112,096 119,519 Core op profit should moderate to 3% CAGR over FY16-19E.
Core Profit after tax (` mn) 51,450 56,231 61,076 65,600 Core profits should moderate to 8% CAGR over FY16-19E.
Core EPS (`) 28 32 34 35 Core EPS should moderate to 8% CAGR over FY16-19E.
Core BVPS (`) 157 182 208 236 Core BVPS should moderate to 8% CAGR over FY16-19E.
Core RoA 1.7% 1.7% 1.6% 1.6% Core RoA should moderate by 16bps over FY16-19E.
Core RoE 21.7% 20.6% 19.4% 18.3% Core RoE should moderate by 341bps over FY16-19E.
Source: Company, Ambit capital research * Ambit estimates are adjusted for interest on ZCBs, which are routed through reserves and hence are not reflected in reported figures; PAT from core lending business excludes gains on sale of investments and dividend from group companies.
Our estimates may not be exactly comparable with those of the Street owing to accounting differences (we are deducting interest on ZCBs in the net interest income, but are not sure if consensus is doing this uniformly). That said, our below-consensus EPS expectations (by 11/17% in FY18/19) could be due to a combination of lower growth and margin assumptions.
Exhibit 38: Ambit versus consensus expectations
Particulars Ambit Consensus Deviation
Net revenues (̀ mn) FY17E 117,591 119,705 -2% FY18E 121,998 132,462 -8%
FY19E 130,731 150,156 -13%
PAT (̀ mn) FY17E 71,664 75,548 -5%
FY18E 75,758 83,578 -9%
FY19E 80,282 95,732 -16%
EPS (̀ mn) FY17E 44.4 47.5 -7%
FY18E 46.9 52.7 -11%
FY19E 49.7 60.0 -17%
Source: Company, Ambit capital research

HDFC
February 21, 2017 Ambit Capital Pvt. Ltd. Page 21
Valuations expensive despite de-rating Whilst the core mortgage business continues to trade at a premium despite de-rating (5.7x TTM BVPS in Jun’12 to 3.4x TTM BVPS now), our excess return model values it at implied FY19 core BVPS of 2x and implied FY19 core P/E of 19x (`471/share) . We assume Ke/sustainable growth/RoE of 14%/14%/18%, leading to a target price of `1100 despite a generous 0% holdco discount. Whilst increasing the dividend payouts could be a natural step in a scenario of diminished growth opportunities, signaling lower sustainable growth could de-rate valuations. However, use of unconventional structures to raise equity capital (low priced warrants with low/zero coupon bonds) has helped the company sustain respectable growth whilst simultaneously increasing the dividend payouts. Further pricing pressure in home loans and continued slowdown in earnings are the key catalysts for a de-rating. Abatement of competitive pressures; rising share of high yielding loans are the key risks.
Falling earnings growth over the last 5 years resulted in the stock returning just 15% CAGR vs an average 33% for the NBFC sector.
Exhibit 39: HDFC has massively underperformed the Bankex and NBFC indices
Source: Bloomberg, Ambit capital research
Core lending business: De-rating to continue To understand the valuation the market assigns to the standalone lending business, we have deducted the valuations of HDFC’s investment in its associates and subsidiaries from the valuation of the listed company. Based on such a calculation, the implied valuation assigned by the market to the standalone lending business is ~`631/share (Implied valuation of 3.4x TTM BVPS and 20x TTM EPS).
Exhibit 40: Implied valuations of HDFC’s core mortgage business
` bn Valuation (̀ bn) Methodology HDFC's stake in the co.(%)
HDFC's stake in the co. (̀ bn)
Valuation per share (̀ )
HDFC con. listed entity 2,223 Current Stock Price 100.0% 2,223
Less: HDFC Bank 3,516 Current Market price 21.6% 758 452
Less: Gruh Finance 137 Current Stock Price 58.6% 81 49
Less: HDFC AMC 111 5x AUM of Dec'16 59.9% 66 41
Less: Life Insurance 379 Assigning peer valn of 3.7x P/EV 70.7% 267 166
Less: General Insurance 50 Latest transaction value 50.7% 25 16
Less: Other investments 3 1 time current book value 100.0% 3 2 Implied valuation for HDFC's lending business 1,022 631
Source: Ambit capital research
We observe that the core mortgage business has de-rated over the last 4 years from 5.7x trailing BVPS in FY13 to 3.4x trailing BVPS in FY17.
0
100
200
300
400
500
Feb-
12
May
-12
Aug
-12
Nov
-12
Feb-
13
May
-13
Aug
-13
Nov
-13
Feb-
14
May
-14
Aug
-14
Nov
-14
Feb-
15
May
-15
Aug
-15
Nov
-15
Feb-
16
May
-16
Aug
-16
Nov
-16
NBFC Index HDFC BANKEX INDEX
HDFC
February 21, 2017 Ambit Capital Pvt. Ltd. Page 22
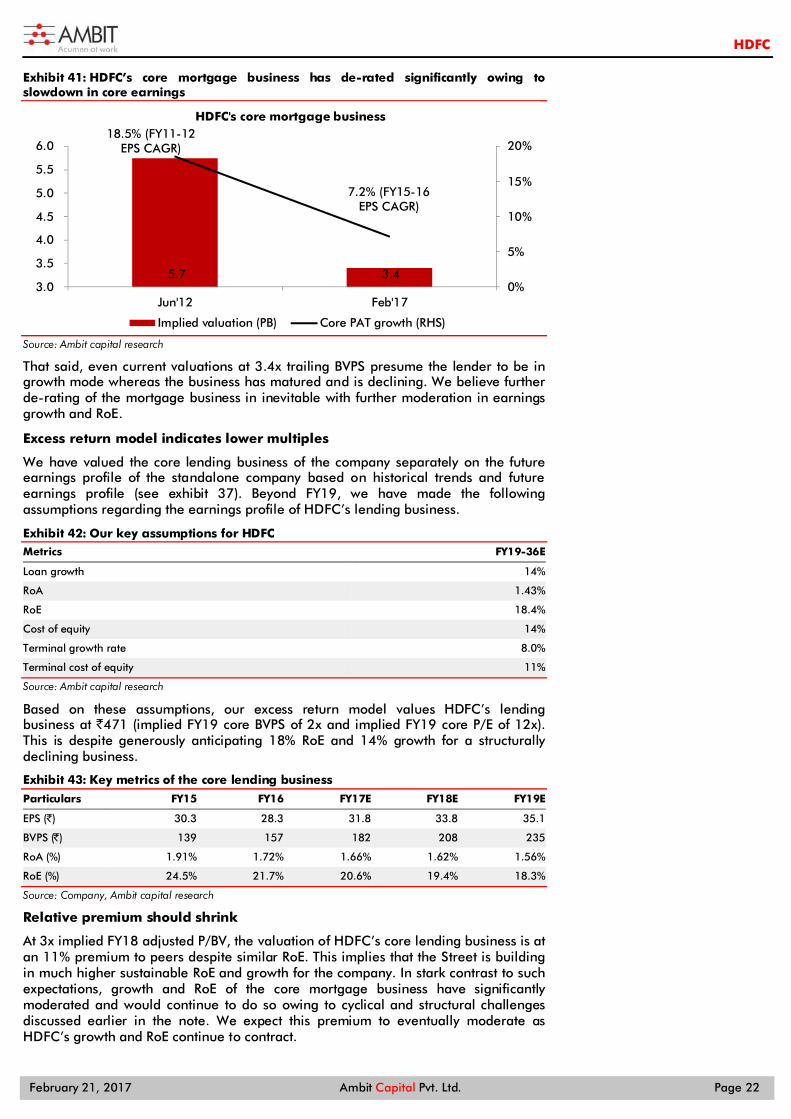
Exhibit 41: HDFC’s core mortgage business has de-rated significantly owing to slowdown in core earnings
Source: Ambit capital research
That said, even current valuations at 3.4x trailing BVPS presume the lender to be in growth mode whereas the business has matured and is declining. We believe further de-rating of the mortgage business in inevitable with further moderation in earnings growth and RoE.
Excess return model indicates lower multiples
We have valued the core lending business of the company separately on the future earnings profile of the standalone company based on historical trends and future earnings profile (see exhibit 37). Beyond FY19, we have made the following assumptions regarding the earnings profile of HDFC’s lending business.
Exhibit 42: Our key assumptions for HDFC Metrics FY19-36E
Loan growth 14%
RoA 1.43%
RoE 18.4%
Cost of equity 14%
Terminal growth rate 8.0%
Terminal cost of equity 11%
Source: Ambit capital research
Based on these assumptions, our excess return model values HDFC’s lending business at `471 (implied FY19 core BVPS of 2x and implied FY19 core P/E of 12x). This is despite generously anticipating 18% RoE and 14% growth for a structurally declining business.
Exhibit 43: Key metrics of the core lending business
Particulars FY15 FY16 FY17E FY18E FY19E
EPS (`) 30.3 28.3 31.8 33.8 35.1
BVPS (̀ ) 139 157 182 208 235
RoA (%) 1.91% 1.72% 1.66% 1.62% 1.56%
RoE (%) 24.5% 21.7% 20.6% 19.4% 18.3%
Source: Company, Ambit capital research
Relative premium should shrink
At 3x implied FY18 adjusted P/BV, the valuation of HDFC’s core lending business is at an 11% premium to peers despite similar RoE. This implies that the Street is building in much higher sustainable RoE and growth for the company. In stark contrast to such expectations, growth and RoE of the core mortgage business have significantly moderated and would continue to do so owing to cyclical and structural challenges discussed earlier in the note. We expect this premium to eventually moderate as HDFC’s growth and RoE continue to contract.
5.7 3.4
18.5% (FY11-12 EPS CAGR)
7.2% (FY15-16 EPS CAGR)
0%
5%
10%
15%
20%
3.0
3.5
4.0
4.5
5.0
5.5
6.0
Jun'12 Feb'17
HDFC's core mortgage business
Implied valuation (PB) Core PAT growth (RHS)
HDFC
February 21, 2017 Ambit Capital Pvt. Ltd. Page 23
Exhibit 44: HFCs’ relative valuation snapshot
Company Mcap Reco. TP Up/
(Down) P/B P/E EPS CAGR RoA RoE
US$bn ` FY17E FY18E FY17E FY18E FY16-18E FY17E FY18E FY17E FY18E
LIC Housing Finance 4.2 SELL 406 -27% 2.6 2.3 14.6 15.4 5% 1.5% 1.3% 19.4% 15.9%
Indiabulls Housing Finance 5.4 NA NA NA 3.0 2.7 12.7 10.6 20% 3.6% 3.6% 25.2% 27.2%
Gruh Finance 2.1 NA NA NA 13.5 10.9 48.3 39.8 19% 2.3% 2.3% 29.9% 29.8%
Dewan Housing Finance 1.5 NA NA NA 1.7 1.5 11.0 9.2 17% 1.2% 1.3% 16.4% 16.8%
Repco Home Finance 0.6 NA NA NA 3.7 3.1 24.8 18.3 21% 2.1% 2.1% 17.4% 18.5%
Can Fin Homes 0.8 NA NA NA 5.0 4.0 23.5 18.8 36% 1.9% 1.8% 22.7% 23.4%
Peer average (ex-GRUH) 3.2 2.7 17.3 14.4 20% 2.1% 2.0% 20.2% 20.4%
HDFC Ltd. 32.9 SELL 1,110 -20% 3.5 3.0 19.9 18.7 9% 1.7% 1.6% 20.6% 19.4%
Premium/(Discount) to above 8% 11% 15% 29% -54% -19% -20% 2% -5%
Source: Ambit Capital research, Bloomberg
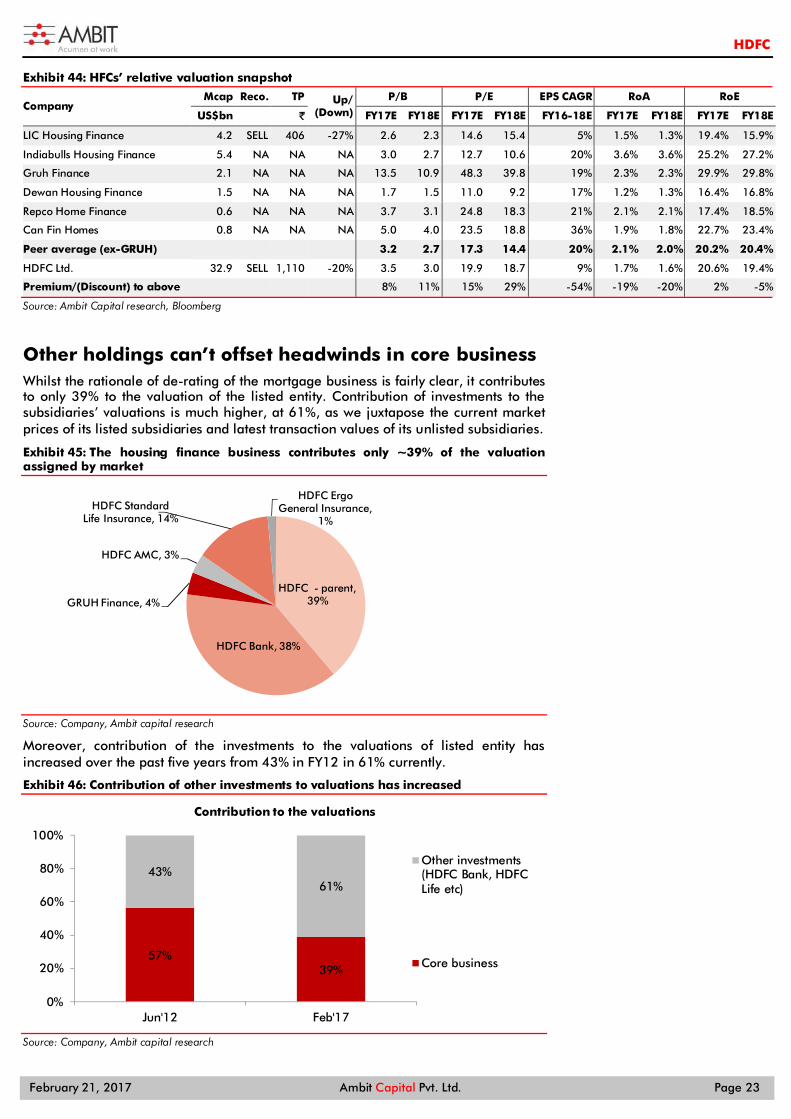
Other holdings can’t offset headwinds in core business Whilst the rationale of de-rating of the mortgage business is fairly clear, it contributes to only 39% to the valuation of the listed entity. Contribution of investments to the subsidiaries’ valuations is much higher, at 61%, as we juxtapose the current market prices of its listed subsidiaries and latest transaction values of its unlisted subsidiaries.
Exhibit 45: The housing finance business contributes only ~39% of the valuation assigned by market
Source: Company, Ambit capital research
Moreover, contribution of the investments to the valuations of listed entity has increased over the past five years from 43% in FY12 in 61% currently.
Exhibit 46: Contribution of other investments to valuations has increased
Source: Company, Ambit capital research
HDFC - parent, 39%
HDFC Bank, 38%
GRUH Finance, 4%
HDFC AMC, 3%
HDFC Standard Life Insurance, 14%
HDFC Ergo General Insurance,
1%
57%39%
43%61%
0%
20%
40%
60%
80%
100%
Jun'12 Feb'17
Contribution to the valuations
Other investments(HDFC Bank, HDFCLife etc)
Core business
HDFC
February 21, 2017 Ambit Capital Pvt. Ltd. Page 24
With the rising contribution of investments to the valuation of the listed entity, the ability of HDFC to deploy the additional capital with high IRR could be a key antidote to the imminent de-rating of the mortgage business. However, as discussed in the earlier section of the note, we believe that the ability of these investments to add further value hereon is limited as:
Other business don’t need further capital: As discussed in the earlier sections of the note, other subsidiaries/associates in banking, asset management and insurance have scaled up, are highly profitable and require little capital support from HDFC (barring general insurance where capital requirement is modest). Moreover, these businesses are now paying healthy dividends to the parent.
Key businesses (HDFC bank) also faces earnings slowdown: Apart from the core housing finance business, HDFC’s investment in HDFC Bank (33% of SOTP) would struggle to add further value to overall valuations. With high competitive intensity in both retail and corporate loans, we expect growth to moderate to 19% CAGR over FY18-19E (vs ~24% over FY12-16) as operating profitability would remain under pressure (14% CAGR in operating profits over FY18-19E vs ~23% between FY12-FY16). Hence, EPS growth should settle at the FY16-17 run-rate of ~15% versus ~30% during most part of the last decade. The current valuation multiples of 23x FY18E P/E and 3.7x FY18E P/B, at a ~40% premium to peers, largely capture superior earnings growth of the bank in the medium term (even including subsidiaries) and leave little margin of safety for investors. We are SELLers of HDFC Bank with a Dec’2017 target price of `1,079 (17.7x FY18E EPS and 2.9x FY18E BVPS).
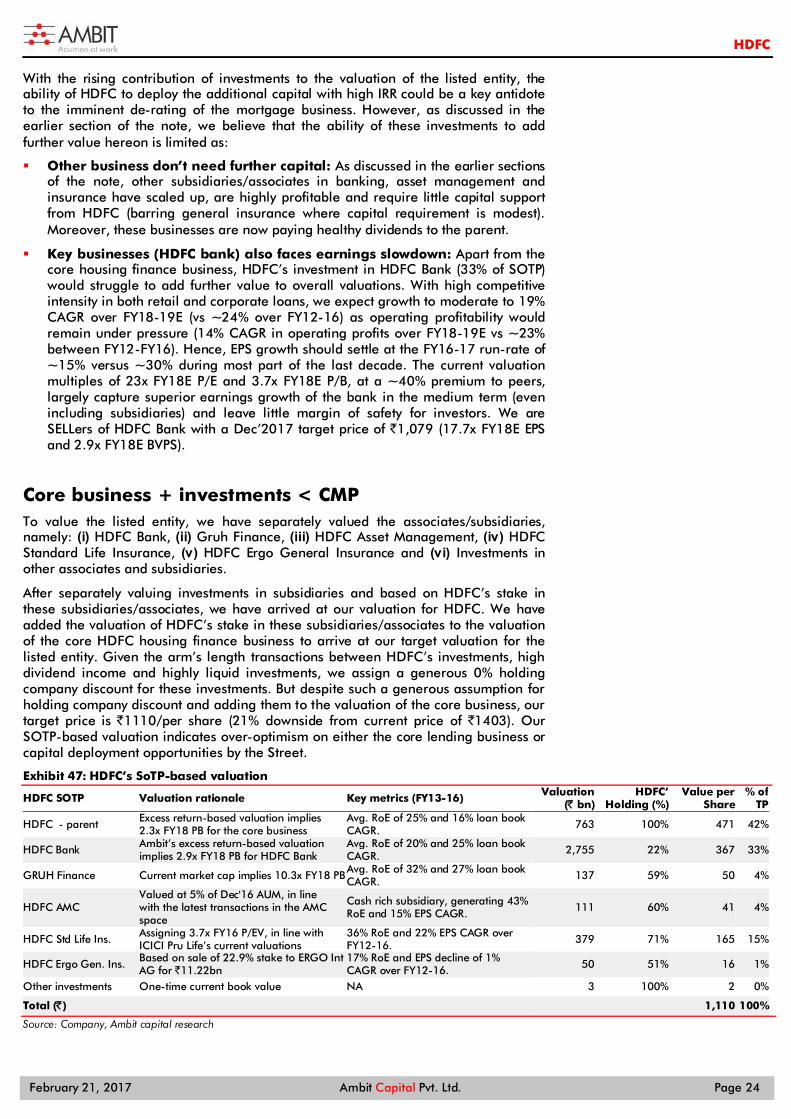
Core business + investments < CMP To value the listed entity, we have separately valued the associates/subsidiaries, namely: (i) HDFC Bank, (ii) Gruh Finance, (iii) HDFC Asset Management, (iv) HDFC Standard Life Insurance, (v) HDFC Ergo General Insurance and (vi) Investments in other associates and subsidiaries.
After separately valuing investments in subsidiaries and based on HDFC’s stake in these subsidiaries/associates, we have arrived at our valuation for HDFC. We have added the valuation of HDFC’s stake in these subsidiaries/associates to the valuation of the core HDFC housing finance business to arrive at our target valuation for the listed entity. Given the arm’s length transactions between HDFC’s investments, high dividend income and highly liquid investments, we assign a generous 0% holding company discount for these investments. But despite such a generous assumption for holding company discount and adding them to the valuation of the core business, our target price is `1110/per share (21% downside from current price of `1403). Our SOTP-based valuation indicates over-optimism on either the core lending business or capital deployment opportunities by the Street.
Exhibit 47: HDFC’s SoTP-based valuation
HDFC SOTP Valuation rationale Key metrics (FY13-16) Valuation (̀ bn)
HDFC’ Holding (%)
Value per Share
% of TP
HDFC - parent Excess return-based valuation implies 2.3x FY18 PB for the core business
Avg. RoE of 25% and 16% loan book CAGR. 763 100% 471 42%
HDFC Bank Ambit’s excess return-based valuation implies 2.9x FY18 PB for HDFC Bank
Avg. RoE of 20% and 25% loan book CAGR. 2,755 22% 367 33%
GRUH Finance Current market cap implies 10.3x FY18 PB Avg. RoE of 32% and 27% loan book CAGR. 137 59% 50 4%
HDFC AMC Valued at 5% of Dec'16 AUM, in line with the latest transactions in the AMC space
Cash rich subsidiary, generating 43% RoE and 15% EPS CAGR. 111 60% 41 4%
HDFC Std Life Ins. Assigning 3.7x FY16 P/EV, in line with ICICI Pru Life’s current valuations
36% RoE and 22% EPS CAGR over FY12-16. 379 71% 165 15%
HDFC Ergo Gen. Ins. Based on sale of 22.9% stake to ERGO Int AG for `11.22bn
17% RoE and EPS decline of 1% CAGR over FY12-16. 50 51% 16 1%
Other investments One-time current book value NA 3 100% 2 0%
Total (̀ ) 1,110 100%
Source: Company, Ambit capital research

HDFC
February 21, 2017 Ambit Capital Pvt. Ltd. Page 25
Returning cash also won’t help With business having scaled up and growth of the core business moderating, returning excess cash either through increasing dividend payout is the best way to maximise shareholder value. In fact, HDFC’s dividend payout ratio has doubled from ~20% in FY94 to ~44% in FY16.
Exhibit 48: HDFC’s dividend payout has increased over FY94-16
Source: Company, Ambit capital research; Note: Dividend payout for HDFC is high in FY00 and FY02 owing to special one-time dividend.
Further increasing dividend payout will lower sustainable growth…
However, increasing the payout ratio and thus lower retained profits imply lower future networth for HDFC, which in turn would lower sustainable growth. In our excess return model, we believe an average 36% payout ratio is reasonable to achieve 14% loan growth without capital raise. However, increasing the payout ratio implies lower sustainable growth and thus lower valuation multiples unless HDFC raises capital at a much lower cost of equity.
..unless future capital raises are at favourable valuations
That said, HDFC has been successful in raising capital at favorable valuations (high implied multiples) to compensate for the increased payout ratio. This is despite growth and profitability moderating. One key reason for such success is the innovative structures through which HDFC has raised capital – low/zero-coupon NCDs along with share warrants in Oct’15 and Aug’09, which not only prevent immediate and bulky dilution but also lower the cost of equity by giving increased flexibility to the investor and underwriting minimum return of the instrument. In this regard, it’s worthwhile to ponder if the company is raising capital from new investors to return capital to the older investors?
Exhibit 49: HDFC’s increasing dividend payout has coincided with capital raises that largely compensate for dividends
Source: Company, Ambit capital research; Note: Rs134bn capital raised includes Rs50.51bn of simultaneous issue of NCDs with warrants in Oct'15. Dividends paid and payout ratio include dividend tax.
0%
10%
20%
30%
40%
50%
60%
70%
FY94
FY95
FY96
FY97
FY98
FY99
FY00
FY01
FY02
FY03
FY04
FY05
FY06
FY07
FY08
FY09
FY10
FY11
FY12
FY13
FY14
FY15
FY16
Dividend payout ratio
0
134
(23)
(183)35%
44%
30%
32%34%
36%38%
40%42%
44%46%
(200)
(150)
(100)
(50)
-
50
100
150
FY94-05 FY06-16
Capital raised (Rs bn) Dividends paid (Rs bn) Median dividend payout (RHS)
HDFC
February 21, 2017 Ambit Capital Pvt. Ltd. Page 26
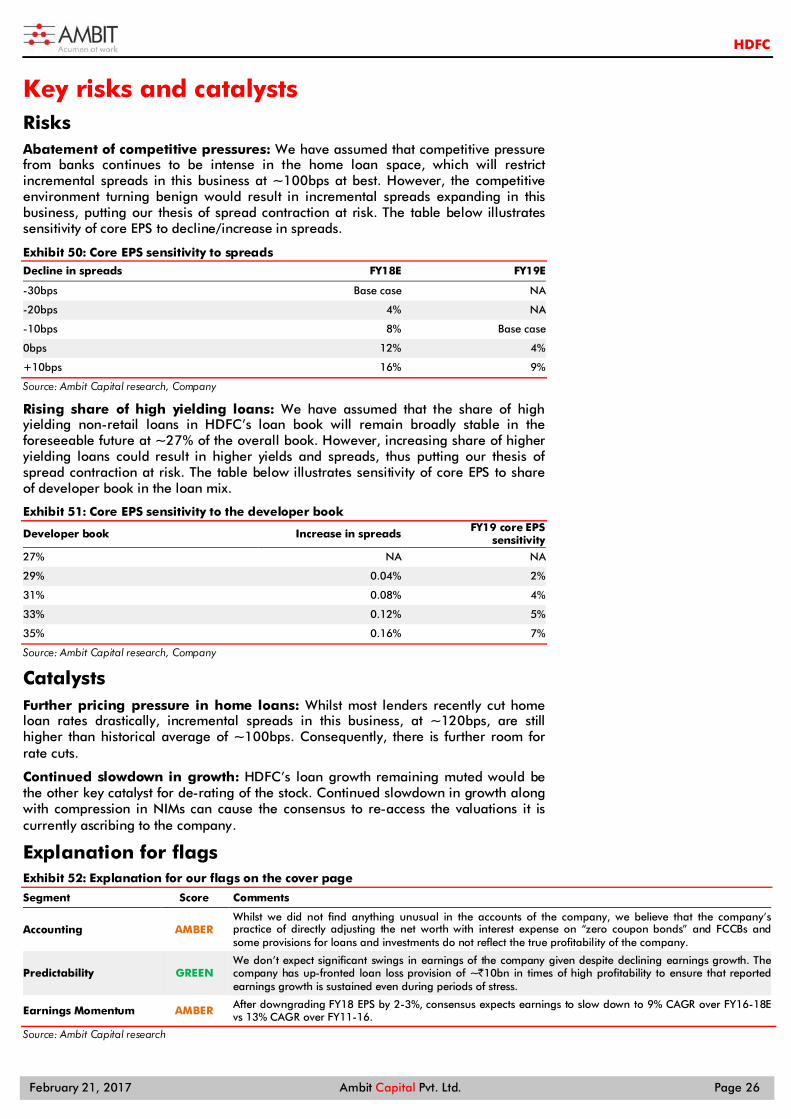
Key risks and catalysts Risks Abatement of competitive pressures: We have assumed that competitive pressure from banks continues to be intense in the home loan space, which will restrict incremental spreads in this business at ~100bps at best. However, the competitive environment turning benign would result in incremental spreads expanding in this business, putting our thesis of spread contraction at risk. The table below illustrates sensitivity of core EPS to decline/increase in spreads.
Exhibit 50: Core EPS sensitivity to spreads Decline in spreads FY18E FY19E
-30bps Base case NA
-20bps 4% NA
-10bps 8% Base case
0bps 12% 4%
+10bps 16% 9%
Source: Ambit Capital research, Company
Rising share of high yielding loans: We have assumed that the share of high yielding non-retail loans in HDFC’s loan book will remain broadly stable in the foreseeable future at ~27% of the overall book. However, increasing share of higher yielding loans could result in higher yields and spreads, thus putting our thesis of spread contraction at risk. The table below illustrates sensitivity of core EPS to share of developer book in the loan mix.
Exhibit 51: Core EPS sensitivity to the developer book
Developer book Increase in spreads FY19 core EPS sensitivity
27% NA NA
29% 0.04% 2%
31% 0.08% 4%
33% 0.12% 5%
35% 0.16% 7%
Source: Ambit Capital research, Company
Catalysts Further pricing pressure in home loans: Whilst most lenders recently cut home loan rates drastically, incremental spreads in this business, at ~120bps, are still higher than historical average of ~100bps. Consequently, there is further room for rate cuts.
Continued slowdown in growth: HDFC’s loan growth remaining muted would be the other key catalyst for de-rating of the stock. Continued slowdown in growth along with compression in NIMs can cause the consensus to re-access the valuations it is currently ascribing to the company.
Explanation for flags Exhibit 52: Explanation for our flags on the cover page
Segment Score Comments
Accounting AMBER Whilst we did not find anything unusual in the accounts of the company, we believe that the company’s practice of directly adjusting the net worth with interest expense on “zero coupon bonds” and FCCBs and some provisions for loans and investments do not reflect the true profitability of the company.
Predictability GREEN We don’t expect significant swings in earnings of the company given despite declining earnings growth. The company has up-fronted loan loss provision of ~`10bn in times of high profitability to ensure that reported earnings growth is sustained even during periods of stress.
Earnings Momentum AMBER After downgrading FY18 EPS by 2-3%, consensus expects earnings to slow down to 9% CAGR over FY16-18E vs 13% CAGR over FY11-16.
Source: Ambit Capital research
HDFC
February 21, 2017 Ambit Capital Pvt. Ltd. Page 27
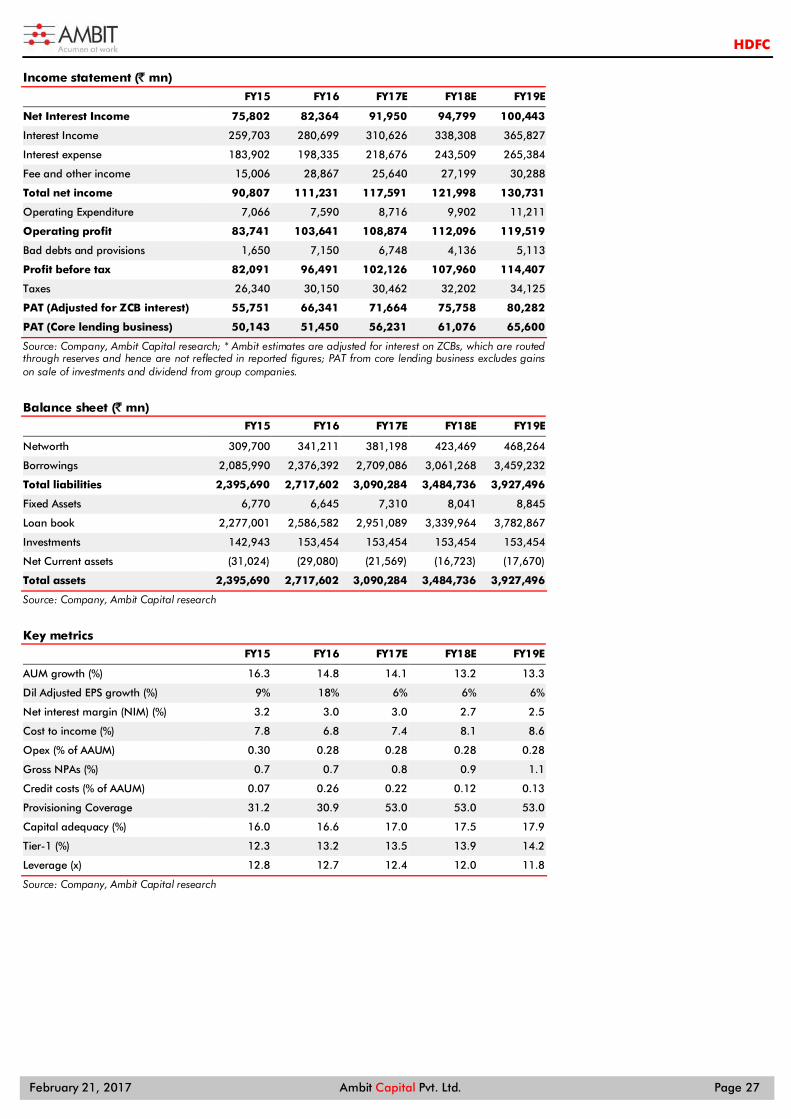
Income statement (` mn)
FY15 FY16 FY17E FY18E FY19E
Net Interest Income 75,802 82,364 91,950 94,799 100,443
Interest Income 259,703 280,699 310,626 338,308 365,827
Interest expense 183,902 198,335 218,676 243,509 265,384
Fee and other income 15,006 28,867 25,640 27,199 30,288
Total net income 90,807 111,231 117,591 121,998 130,731
Operating Expenditure 7,066 7,590 8,716 9,902 11,211
Operating profit 83,741 103,641 108,874 112,096 119,519
Bad debts and provisions 1,650 7,150 6,748 4,136 5,113
Profit before tax 82,091 96,491 102,126 107,960 114,407
Taxes 26,340 30,150 30,462 32,202 34,125
PAT (Adjusted for ZCB interest) 55,751 66,341 71,664 75,758 80,282
PAT (Core lending business) 50,143 51,450 56,231 61,076 65,600
Source: Company, Ambit Capital research; * Ambit estimates are adjusted for interest on ZCBs, which are routed through reserves and hence are not reflected in reported figures; PAT from core lending business excludes gains on sale of investments and dividend from group companies.
Balance sheet (` mn) FY15 FY16 FY17E FY18E FY19E
Networth 309,700 341,211 381,198 423,469 468,264
Borrowings 2,085,990 2,376,392 2,709,086 3,061,268 3,459,232
Total liabilities 2,395,690 2,717,602 3,090,284 3,484,736 3,927,496
Fixed Assets 6,770 6,645 7,310 8,041 8,845
Loan book 2,277,001 2,586,582 2,951,089 3,339,964 3,782,867
Investments 142,943 153,454 153,454 153,454 153,454
Net Current assets (31,024) (29,080) (21,569) (16,723) (17,670)
Total assets 2,395,690 2,717,602 3,090,284 3,484,736 3,927,496
Source: Company, Ambit Capital research
Key metrics FY15 FY16 FY17E FY18E FY19E
AUM growth (%) 16.3 14.8 14.1 13.2 13.3
Dil Adjusted EPS growth (%) 9% 18% 6% 6% 6%
Net interest margin (NIM) (%) 3.2 3.0 3.0 2.7 2.5
Cost to income (%) 7.8 6.8 7.4 8.1 8.6
Opex (% of AAUM) 0.30 0.28 0.28 0.28 0.28
Gross NPAs (%) 0.7 0.7 0.8 0.9 1.1
Credit costs (% of AAUM) 0.07 0.26 0.22 0.12 0.13
Provisioning Coverage 31.2 30.9 53.0 53.0 53.0
Capital adequacy (%) 16.0 16.6 17.0 17.5 17.9
Tier-1 (%) 12.3 13.2 13.5 13.9 14.2
Leverage (x) 12.8 12.7 12.4 12.0 11.8
Source: Company, Ambit Capital research
HDFC
February 21, 2017 Ambit Capital Pvt. Ltd. Page 28
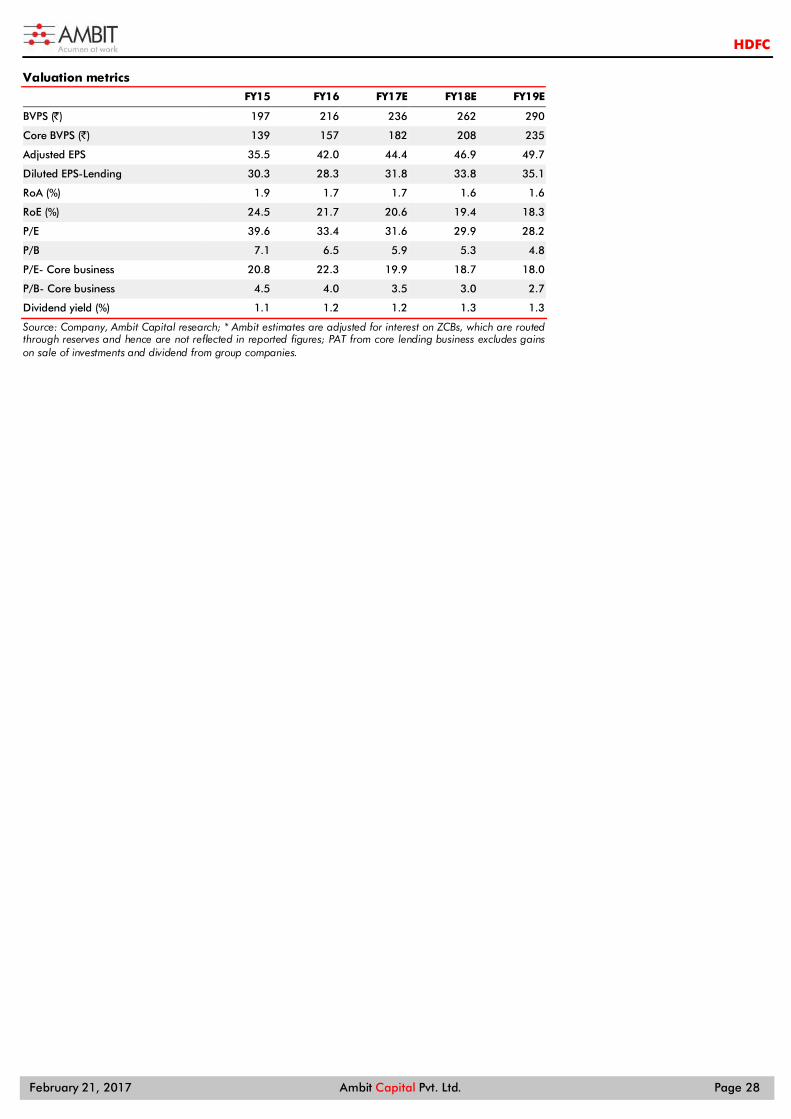
Valuation metrics
FY15 FY16 FY17E FY18E FY19E
BVPS (̀ ) 197 216 236 262 290
Core BVPS (`) 139 157 182 208 235
Adjusted EPS 35.5 42.0 44.4 46.9 49.7
Diluted EPS-Lending 30.3 28.3 31.8 33.8 35.1
RoA (%) 1.9 1.7 1.7 1.6 1.6
RoE (%) 24.5 21.7 20.6 19.4 18.3
P/E 39.6 33.4 31.6 29.9 28.2
P/B 7.1 6.5 5.9 5.3 4.8
P/E- Core business 20.8 22.3 19.9 18.7 18.0
P/B- Core business 4.5 4.0 3.5 3.0 2.7
Dividend yield (%) 1.1 1.2 1.2 1.3 1.3
Source: Company, Ambit Capital research; * Ambit estimates are adjusted for interest on ZCBs, which are routed through reserves and hence are not reflected in reported figures; PAT from core lending business excludes gains on sale of investments and dividend from group companies.

HDFC
February 21, 2017 Ambit Capital Pvt. Ltd. Page 29
Institutional Equities Team Saurabh Mukherjea, CFA CEO, Ambit Capital Private Limited (022) 30433174 [email protected] Pramod Gubbi, CFA Head of Equities (022) 30433124 [email protected]
Research Analysts
Name Industry Sectors Desk-Phone E-mail
Nitin Bhasin - Head of Research E&C / Infra / Cement / Home Building (022) 30433241 [email protected] Aadesh Mehta, CFA Banking / Financial Services (022) 30433239 [email protected] Abhishek Ranganathan, CFA Retail / Consumer Discretionary (022) 30433085 [email protected] Anuj Bansal Consumer (022) 30433122 [email protected] Aditi Singh Economy / Strategy (022) 30433284 [email protected] Ashvin Shetty, CFA Automobiles / Auto Ancillaries (022) 30433285 [email protected] Bhargav Buddhadev Power Utilities / Capital Goods (022) 30433252 [email protected] Deepesh Agarwal, CFA Power Utilities / Capital Goods (022) 30433275 [email protected] Dhiraj Mistry, CFA Consumer (022) 30433264 [email protected] Gaurav Khandelwal, CFA Automobiles / Auto Ancillaries (022) 30433132 [email protected] Girisha Saraf Home Building (022) 30433211 [email protected] Karan Khanna, CFA Strategy (022) 30433251 [email protected] Mayank Porwal Retail / Consumer Discretionary (022) 30433214 [email protected] Pankaj Agarwal, CFA Banking / Financial Services (022) 30433206 [email protected] Paresh Dave, CFA Healthcare (022) 30433212 [email protected] Parita Ashar, CFA Cement / Metals / Aviation (022) 30433223 [email protected] Prashant Mittal, CFA Strategy / Derivatives (022) 30433218 [email protected] Rahil Shah Banking / Financial Services (022) 30433217 [email protected] Ravi Singh Banking / Financial Services (022) 30433181 [email protected] Ritesh Gupta, CFA Oil & Gas / Chemicals / Agri Inputs (022) 30433242 [email protected] Ritesh Vaidya, CFA Consumer (022) 30433246 [email protected] Ritika Mankar Mukherjee, CFA Economy / Strategy (022) 30433175 [email protected] Sagar Rastogi Technology (022) 30433291 [email protected] Sudheer Guntupalli Technology (022) 30433203 [email protected] Sumit Shekhar Economy / Strategy (022) 30433229 [email protected] Utsav Mehta, CFA E&C / Infrastructure (022) 30433209 [email protected] Vivekanand Subbaraman, CFA Media / Telecom (022) 30433261 [email protected]
Sales
Name Regions Desk-Phone E-mail
Sarojini Ramachandran - Head of Sales UK +44 (0) 20 7886 2740 [email protected] Dharmen Shah India / Asia (022) 30433289 [email protected] Dipti Mehta India (022) 30433053 [email protected] Krishnan V India / Asia (022) 30433295 [email protected] Nityam Shah, CFA Europe (022) 30433259 [email protected] Punitraj Mehra, CFA India / Asia (022) 30433198 [email protected] Shaleen Silori India (022) 30433256 [email protected]
Singapore
Praveena Pattabiraman Singapore +65 6536 0481 [email protected] Shashank Abhisheik Singapore +65 6536 1935 [email protected]
USA / Canada
Ravilochan Pola – CEO Americas +1(646) 793 6001 [email protected] Hitakshi Mehra Americas +1(646) 793 6002 [email protected] Achint Bhagat, CFA Americas +1(646) 793 6752 [email protected]
Production
Sajid Merchant Production (022) 30433247 [email protected] Sharoz G Hussain Production (022) 30433183 [email protected] Jestin George Editor (022) 30433272 [email protected] Richard Mugutmal Editor (022) 30433273 [email protected] Nikhil Pillai Database (022) 30433265 [email protected]
HDFC
February 21, 2017 Ambit Capital Pvt. Ltd. Page 30
Housing Development Finance (HDFC IN, SELL)
Source: Bloomberg, Ambit Capital research
0200400600800
1,0001,2001,4001,600
Feb-
14
Apr
-14
Jun-
14
Aug
-14
Oct
-14
Dec
-14
Feb-
15
Apr
-15
Jun-
15
Aug
-15
Oct
-15
Dec
-15
Feb-
16
Apr
-16
Jun-
16
Aug
-16
Oct
-16
Dec
-16
Feb-
17
Housing Development Finance Corp Ltd
HDFC
February 21, 2017 Ambit Capital Pvt. Ltd. Page 31
Explanation of Investment Rating
Investment Rating Expected return (over 12-month)
BUY >10%
SELL <10%
NO STANCE We have forward looking estimates for the stock but we refrain from assigning valuation and recommendation
UNDER REVIEW We will revisit our recommendation, valuation and estimates on the stock following recent events
NOT RATED We do not have any forward looking estimates, valuation or recommendation for the stock POSITIVE We have a positive view on the sector and most of stocks under our coverage in the sector are BUYs
NEGATIVE We have a negative view on the sector and most of stocks under our coverage in the sector are SELLs
Disclaimer This report or any portion hereof may not be reprinted, sold or redistributed without the written consent of Ambit Capital. AMBIT Capital Research is disseminated and available primarily electronically, and, in some cases, in printed form.
Additional information on recommended securities is available on request.
Disclaimer
1. AMBIT Capital Private Limited (“AMBIT Capital”) and its affiliates are a full service, integrated investment banking, investment advisory and brokerage group. AMBIT Capital is a Stock Broker, Portfolio Manager, Merchant Banker and Depository Participant registered with Securities and Exchange Board of India Limited (SEBI) and is regulated by SEBI.
2. AMBIT Capital makes best endeavours to ensure that the research analyst(s) use current, reliable, comprehensive information and obtain such information from sources which the analyst(s) believes to be reliable. However, such information has not been independently verified by AMBIT Capital and/or the analyst(s) and no representation or warranty, express or implied, is made as to the accuracy or completeness of any information obtained from third parties. The information, opinions, views expressed in this Research Report are those of the research analyst as at the date of this Research Report which are subject to change and do not represent to be an authority on the subject. AMBIT Capital may or may not subscribe to any and/ or all the views expressed herein.
3. This Research Report should be read and relied upon at the sole discretion and risk of the recipient. If you are dissatisfied with the contents of this complimentary Research Report or with the terms of this Disclaimer, your sole and exclusive remedy is to stop using this Research Report and AMBIT Capital or its affiliates shall not be responsible and/ or liable for any direct/consequential loss howsoever directly or indirectly, from any use of this Research Report.
4. If this Research Report is received by any client of AMBIT Capital or its affiliate, the relationship of AMBIT Capital/its affiliate with such client will continue to be governed by the terms and conditions in place between AMBIT Capital/ such affiliate and the client.
5. This Research Report is issued for information only and the 'Buy', 'Sell', or ‘Other Recommendation’ made in this Research Report such should not be construed as an investment advice to any recipient to acquire, subscribe, purchase, sell, dispose of, retain any securities and should not be intended or treated as a substitute for necessary review or validation or any professional advice. Recipients should consider this Research Report as only a single factor in making any investment decisions. This Research Report is not an offer to sell or the solicitation of an offer to purchase or subscribe for any investment or as an official endorsement of any investment.
6. This Research Report is being supplied to you solely for your information and may not be reproduced, redistributed or passed on, directly or indirectly, to any other person or published, copied in whole or in part, for any purpose. Neither this Research Report nor any copy of it may be taken or transmitted or distributed, directly or indirectly within India or into any other country including United States (to US Persons), Canada or Japan or to any resident thereof. The distribution of this Research Report in other jurisdictions may be strictly restricted and/ or prohibited by law or contract, and persons into whose possession this Research Report comes should inform themselves about such restriction and/ or prohibition, and observe any such restrictions and/ or prohibition.
7. Ambit Capital Private Limited is registered as a Research Entity under the SEBI (Research Analysts) Regulations, 2014. SEBI Reg.No.- INH000000313.
Conflict of Interests 8. In the normal course of AMBIT Capital’s business circumstances may arise that could result in the interests of AMBIT Capital conflicting with the interests of clients or one client’s interests conflicting
with the interest of another client. AMBIT Capital makes best efforts to ensure that conflicts are identified and managed and that clients’ interests are protected. AMBIT Capital has policies and procedures in place to control the flow and use of non-public, price sensitive information and employees’ personal account trading. Where appropriate and reasonably achievable, AMBIT Capital segregates the activities of staff working in areas where conflicts of interest may arise. However, clients/potential clients of AMBIT Capital should be aware of these possible conflicts of interests and should make informed decisions in relation to AMBIT Capital’s services.
9. AMBIT Capital and/or its affiliates may from time to time have or solicit investment banking, investment advisory and other business relationships with companies covered in this Research Report and may receive compensation for the same.
Additional Disclaimer for Canadian Persons 10. AMBIT Capital is not registered in the Province of Ontario and /or Province of Québec to trade in securities and/or to provide advice with respect to securities. 11. AMBIT Capital's head office or principal place of business is located in India. 12. All or substantially all of AMBIT Capital's assets may be situated outside of Canada.
13. It may be difficult for enforcing legal rights against AMBIT Capital because of the above. 14. Name and address of AMBIT Capital's agent for service of process in the Province of Ontario is: Torys LLP, 79 Wellington St. W., 30th Floor, Box 270, TD South Tower, Toronto, Ontario M5K 1N2
Canada. 15. Name and address of AMBIT Capital's agent for service of process in the Province of Québec is Torys Law Firm LLP, 1 Place Ville Marie, Suite 1919 Montréal, Québec H3B 2C3 Canada.
Additional Disclaimer for Singapore Persons
16. This Report is prepared and distributed by Ambit Capital Private Limited and distributed as per the approved arrangement under Paragraph 9 of Third Schedule of Securities and Futures Act (CAP 289) and Paragraph 11 of the First Schedule to the Financial Advisors Act (CAP 110) provided to Ambit Singapore Pte. Limited by Monetary Authority of Singapore.
17. This Report is only available to persons in Singapore who are institutional investors (as defined in section 4A of the Securities and Futures Act (Cap. 289) of Singapore (the “SFA”).” Accordingly, if a Singapore Person is not or ceases to be such an institutional investor, such Singapore Person must immediately discontinue any use of this Report and inform Ambit Singapore Pte. Limited.
Additional Disclaimer for UK Persons 18. All of the recommendations and views about the securities and companies in this report accurately reflect the personal views of the research analyst named on the cover. No part of this research
analyst’s compensation was, is, or will be directly or indirectly related to the specific recommendations or views expressed by the research analyst in this research report. This report may not be reproduced, redistributed or copied in whole or in part for any purpose.
19. This report is a marketing communication and has been prepared by Ambit Capital Pvt Ltd of Mumbai, India (“Ambit”) and has been approved in the UK by Ambit Capital (UK) Limited (“ACUK”) solely for the purposes of section 21 of the Financial Services and Markets Act 2000. Ambit is regulated by the Securities and Exchange Board of India and is registered as a Research Entity under the SEBI (Research Analysts) Regulations, 2014. ACUK is regulated by the UK Financial Services Authority and has registered office at C/o Panmure Gordon & Co PL, One New Change, London, EC4M9AF.
20. In the UK, this report is directed at and is for distribution only to persons who (i) fall within Article 19(1) (persons who have professional experience in matters relating to investments) or Article 49(2)(a) to (d) (high net worth companies, unincorporated associations etc) of the Financial Services and Markets Act 2000 (Financial Promotions) Order 2005 (as amended) or (ii) are professional customers or eligible counterparties of ACUK (all such persons together being referred to as "relevant persons"). This report must not be acted on or relied upon by persons in the UK who are not relevant persons.
21. Neither Ambit nor ACUK is a US registered broker-dealer. Transactions undertaken in the US in any security mentioned herein must be effected through a US-registered broker-dealer, in conformity with SEC Rule 15a-6.
22. Neither this report nor any copy or part thereof may be distributed in any other jurisdictions where its distribution may be restricted by law and persons into whose possession this report comes should inform themselves about, and observe, any such restrictions. Distribution of this report in any such other jurisdictions may constitute a violation of UK or US securities laws, or the law of any such other jurisdictions.
23. This report does not constitute an offer or solicitation to buy or sell any securities referred to herein. It should not be so construed, nor should it or any part of it form the basis of, or be relied on in connection with, any contract or commitment whatsoever. The information in this report, or on which this report is based, has been obtained from publicly available sources that Ambit believes to be reliable and accurate. However, it has not been prepared in accordance with legal requirements designed to promote the independence of investment research. It has also not been independently verified and no representation or warranty, express or implied, is made as to the accuracy or completeness of any information obtained from third parties.
24. The information or opinions are provided as at the date of this report and are subject to change without notice. The information and opinions provided in this report take no account of the investors’ individual circumstances and should not be taken as specific advice on the merits of any investment decision. Investors should consider this report as only a single factor in making any investment decisions. Further information is available upon request. No member or employee of Ambit or ACUK accepts any liability whatsoever for any direct or consequential loss howsoever arising, directly or indirectly, from any use of this report or its contents.
25. The value of any investment made at your discretion based on this Report, or income therefrom, maybe affected by changes in economic, financial and/or political factors and may go down as well as go up and you may not get back the original amount invested. Some securities and/or investments involve substantial risk and are not suitable for all investors.

HDFC
February 21, 2017 Ambit Capital Pvt. Ltd. Page 32
26. Ambit and its affiliates and their respective officers directors and employees may hold positions in any securities mentioned in this Report (or in any related investment) and may from time to time add to or dispose of any such securities (or investment). Ambit and ACUK may from time to time render advisory and other services to companies referred to in this Report and may receive compensation for the same.
27. Ambit and its affiliates may act as a market maker or risk arbitrator or liquidity provider or may have assumed an underwriting commitment in the securities of companies discussed in this Report (or in related investments) or may sell them or buy them from clients on a principal to principal basis or may be involved in proprietary trading and may also perform or seek to perform investment banking or underwriting services for or relating to those companies.
28. Ambit and ACUK may sell or buy any securities or make any investment which may be contrary to or inconsistent with this Report and are not subject to any prohibition on dealing. By accepting this report you agree to be bound by the foregoing limitations. In the normal course of Ambit and its affiliates’ business, circumstances may arise that could result in the interests of Ambit conflicting with the interests of clients or one client’s interests conflicting with the interest of another client. Ambit makes best efforts to ensure that conflicts are identified, managed and clients’ interests are protected. However, clients/potential clients of Ambit should be aware of these possible conflicts of interests and should make informed decisions in relation to Ambit services.
Disclosures
29. The analyst (s) has/have not served as an officer, director or employee of the subject company. 30. There is no material disciplinary action that has been taken by any regulatory authority impacting equity research analysis activities. 31. All market data included in this report are dated as at the previous stock market closing day from the date of this report. 32. Ambit and/or its associates have received compensation for investment banking/merchant banking/brokering services from HDFC Bank Ltd in the past 12 months.
Analyst Certification Each of the analysts identified in this report certifies, with respect to the companies or securities that the individual analyses, that (1) the views expressed in this report reflect his or her personal views about all of the subject companies and securities and (2) no part of his or her compensation was, is or will be directly or indirectly dependent on the specific recommendations or views expressed in this report. © Copyright 2017 AMBIT Capital Private Limited. All rights reserved.
Ambit Capital Pvt. Ltd. Ambit House, 3rd Floor. 449, Senapati Bapat Marg, Lower Parel, Mumbai 400 013, India. Phone: +91-22-3043 3000 | Fax: +91-22-3043 3100 CIN: U74140MH1997PTC107598 www.ambitcapital.com