Steps followed by dairy companies in india - Parag Milk Foods
1
Please refer to important disclosures at the end of this report 1 1
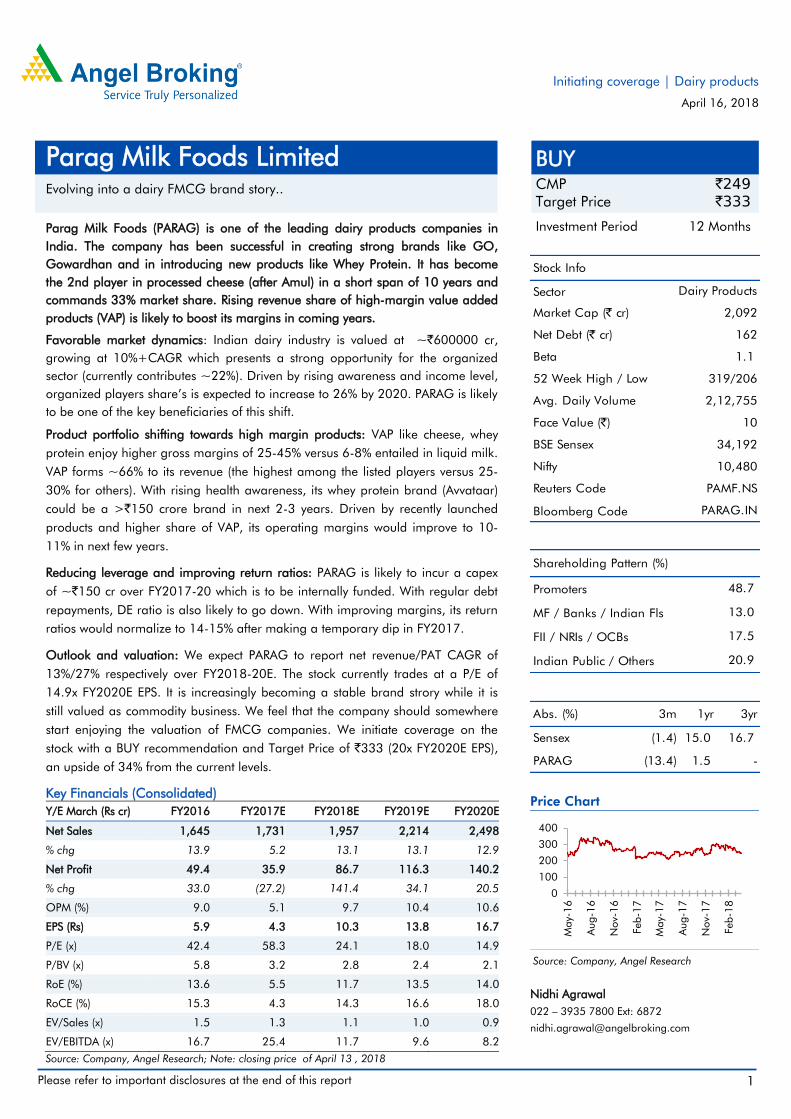
Parag Milk Foods (PARAG) is one of the leading dairy products companies in
India. The company has been successful in creating strong brands like GO,
Gowardhan and in introducing new products like Whey Protein. It has become
the 2nd player in processed cheese (after Amul) in a short span of 10 years and
commands 33% market share. Rising revenue share of high-margin value added
products (VAP) is likely to boost its margins in coming years.
Favorable market dynamics: Indian dairy industry is valued at ~`600000 cr,
growing at 10%+CAGR which presents a strong opportunity for the organized
sector (currently contributes ~22%). Driven by rising awareness and income level,
organized players share’s is expected to increase to 26% by 2020. PARAG is likely
to be one of the key beneficiaries of this shift.
Product portfolio shifting towards high margin products: VAP like cheese, whey
protein enjoy higher gross margins of 25-45% versus 6-8% entailed in liquid milk.
VAP forms ~66% to its revenue (the highest among the listed players versus 25-
30% for others). With rising health awareness, its whey protein brand (Avvataar)
could be a >`150 crore brand in next 2-3 years. Driven by recently launched
products and higher share of VAP, its operating margins would improve to 10-
11% in next few years.
Reducing leverage and improving return ratios: PARAG is likely to incur a capex
of ~`150 cr over FY2017-20 which is to be internally funded. With regular debt
repayments, DE ratio is also likely to go down. With improving margins, its return
ratios would normalize to 14-15% after making a temporary dip in FY2017.
Outlook and valuation: We expect PARAG to report net revenue/PAT CAGR of
13%/27% respectively over FY2018-20E. The stock currently trades at a P/E of
14.9x FY2020E EPS. It is increasingly becoming a stable brand strory while it is
still valued as commodity business. We feel that the company should somewhere
start enjoying the valuation of FMCG companies. We initiate coverage on the
stock with a BUY recommendation and Target Price of `333 (20x FY2020E EPS),
an upside of 34% from the current levels.
Key Financials (Consolidated)
Y/E March (Rs cr) FY2016 FY2017E FY2018E FY2019E FY2020E
Net Sales 1,645 1,731 1,957 2,214 2,498
% chg 13.9 5.2 13.1 13.1 12.9
Net Profit 49.4 35.9 86.7 116.3 140.2
% chg 33.0 (27.2) 141.4 34.1 20.5
OPM (%) 9.0 5.1 9.7 10.4 10.6
EPS (Rs) 5.9 4.3 10.3 13.8 16.7
P/E (x) 42.4 58.3 24.1 18.0 14.9
P/BV (x) 5.8 3.2 2.8 2.4 2.1
RoE (%) 13.6 5.5 11.7 13.5 14.0
RoCE (%) 15.3 4.3 14.3 16.6 18.0
EV/Sales (x) 1.5 1.3 1.1 1.0 0.9
EV/EBITDA (x) 16.7 25.4 11.7 9.6 8.2
Source: Company, Angel Research; Note: closing price of April 13 , 2018
BUY
CMP `249
Target Price `333
Investment Period 12 Months
Stock Info
Sector
Bloomberg Code
Shareholding Pattern (%)
Promoters
MF / Banks / Indian Fls
FII / NRIs / OCBs
Indian Public / Others
Abs. (%) 3m 1yr 3yr
Sensex (1.4) 15.0 16.7
PARAG (13.4) 1.5 -
48.7
13.0
17.5
20.9
Net Debt (` cr)
Market Cap (` cr) 2,092
162
Beta 1.1
52 Week High / Low 319/206
Avg. Daily Volume 2,12,755
Face Value (`) 10
BSE Sensex 34,192
Nifty 10,480
PAMF.NSReuters Code
PARAG.IN
Dairy Products
Price Chart
Source: Company, Angel Research
Nidhi Agrawal
022 – 3935 7800 Ext: 6872
0
100
200
300
400
May-1
6
Aug-1
6
Nov-1
6
Feb-1
7
May-1
7
Aug-1
7
Nov-1
7
Feb-1
8
Parag Milk Foods Limited
Evolving into a dairy FMCG brand story..
Initiating coverage | Dairy products
April 16, 2018
2
Initiating coverage | Menon Bearings
April 16, 2018 2
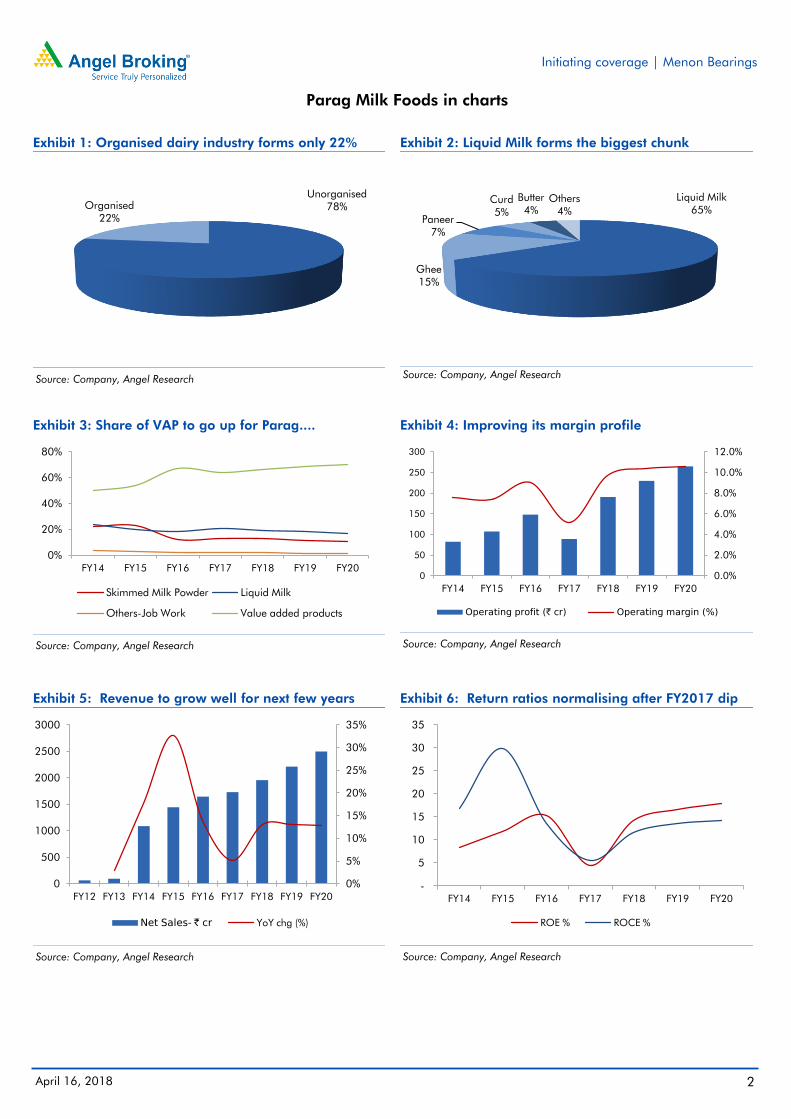
Exhibit 1: Organised dairy industry forms only 22%
Source: Company, Angel Research
Exhibit 2: Liquid Milk forms the biggest chunk
Source: Company, Angel Research
Exhibit 3: Share of VAP to go up for Parag....
Source: Company, Angel Research
Exhibit 4: Improving its margin profile
Source: Company, Angel Research
Exhibit 5: Revenue to grow well for next few years
Source: Company, Angel Research
Exhibit 6: Return ratios normalising after FY2017 dip
Source: Company, Angel Research
Unorganised
78% Organised
22%
Liquid Milk
65%
Ghee
15%
Paneer
7%
Curd
5%
Butter
4%
Others
4%
0%
20%
40%
60%
80%
FY14 FY15 FY16 FY17 FY18 FY19 FY20
Skimmed Milk Powder Liquid Milk
Others-Job Work Value added products
0.0%
2.0%
4.0%
6.0%
8.0%
10.0%
12.0%
0
50
100
150
200
250
300
FY14 FY15 FY16 FY17 FY18 FY19 FY20
Operating profit (` cr) Operating margin (%)
0%
5%
10%
15%
20%
25%
30%
35%
0
500
1000
1500
2000
2500
3000
FY12 FY13 FY14 FY15 FY16 FY17 FY18 FY19 FY20
Net Sales- ̀ cr YoY chg (%)
-
5
10
15
20
25
30
35
FY14 FY15 FY16 FY17 FY18 FY19 FY20
ROE % ROCE %
Parag Milk Foods in charts
Initiating coverage | Parag Milk Foods
3
April 16, 2018 3
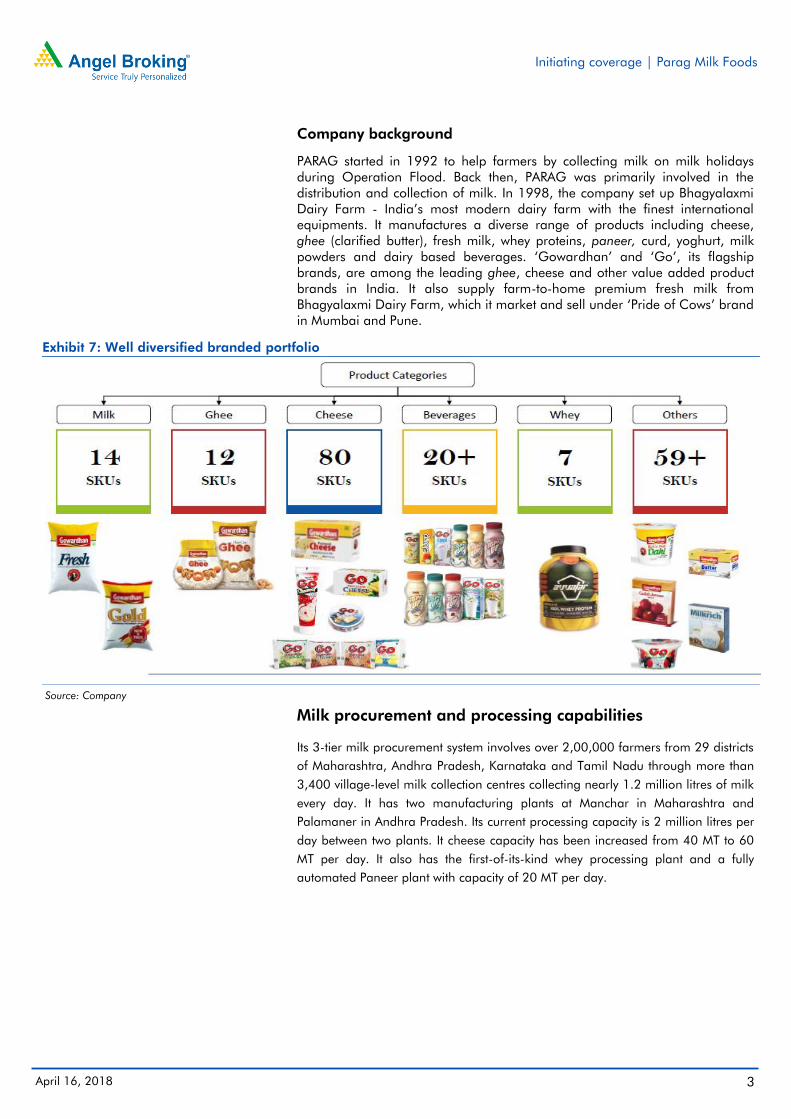
Company background
PARAG started in 1992 to help farmers by collecting milk on milk holidays
during Operation Flood. Back then, PARAG was primarily involved in the
distribution and collection of milk. In 1998, the company set up Bhagyalaxmi
Dairy Farm - India’s most modern dairy farm with the finest international
equipments. It manufactures a diverse range of products including cheese,
ghee (clarified butter), fresh milk, whey proteins, paneer, curd, yoghurt, milk
powders and dairy based beverages. ‘Gowardhan’ and ‘Go’, its flagship
brands, are among the leading ghee, cheese and other value added product
brands in India. It also supply farm-to-home premium fresh milk from
Bhagyalaxmi Dairy Farm, which it market and sell under ‘Pride of Cows’ brand
in Mumbai and Pune.
Exhibit 7: Well diversified branded portfolio
Source: Company
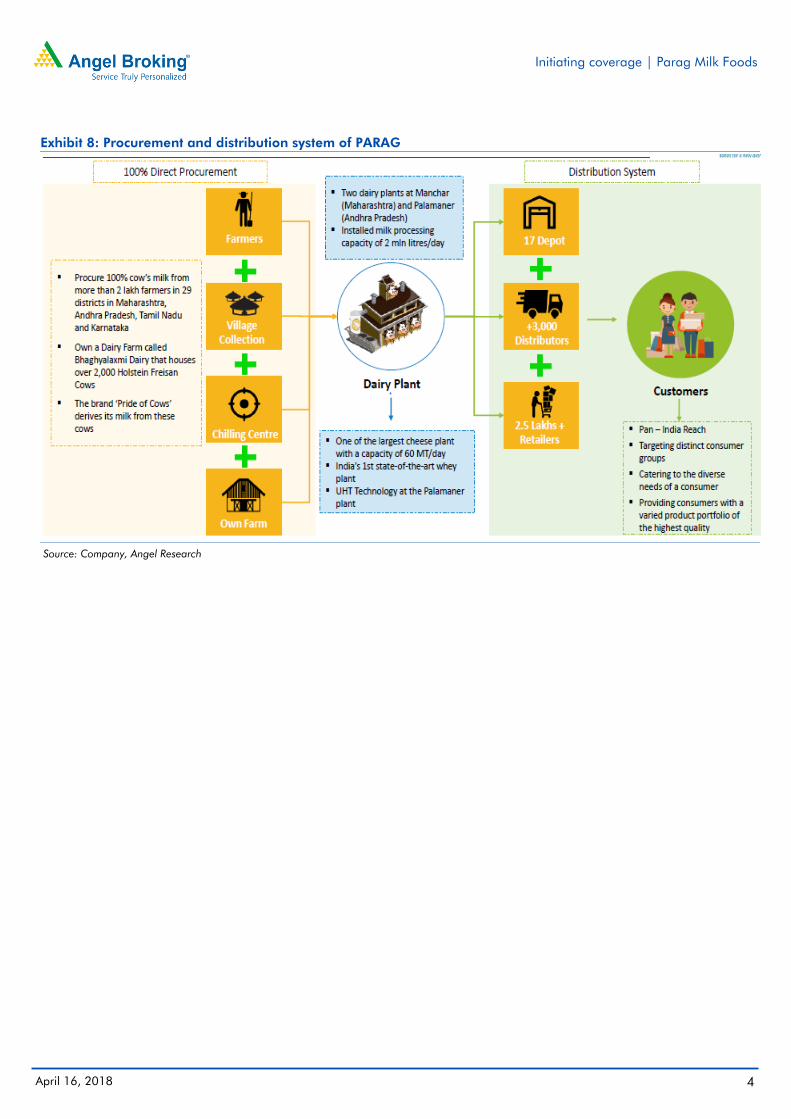
Milk procurement and processing capabilities
Its 3-tier milk procurement system involves over 2,00,000 farmers from 29 districts
of Maharashtra, Andhra Pradesh, Karnataka and Tamil Nadu through more than
3,400 village-level milk collection centres collecting nearly 1.2 million litres of milk
every day. It has two manufacturing plants at Manchar in Maharashtra and
Palamaner in Andhra Pradesh. Its current processing capacity is 2 million litres per
day between two plants. It cheese capacity has been increased from 40 MT to 60
MT per day. It also has the first-of-its-kind whey processing plant and a fully
automated Paneer plant with capacity of 20 MT per day.
Initiating coverage | Parag Milk Foods
4
April 16, 2018 4
Exhibit 8: Procurement and distribution system of PARAG
Source: Company, Angel Research
Initiating coverage | Parag Milk Foods
5
April 16, 2018 5
Investment Rationale
Favorable market dynamics:
1. Shift from unorganized to organized
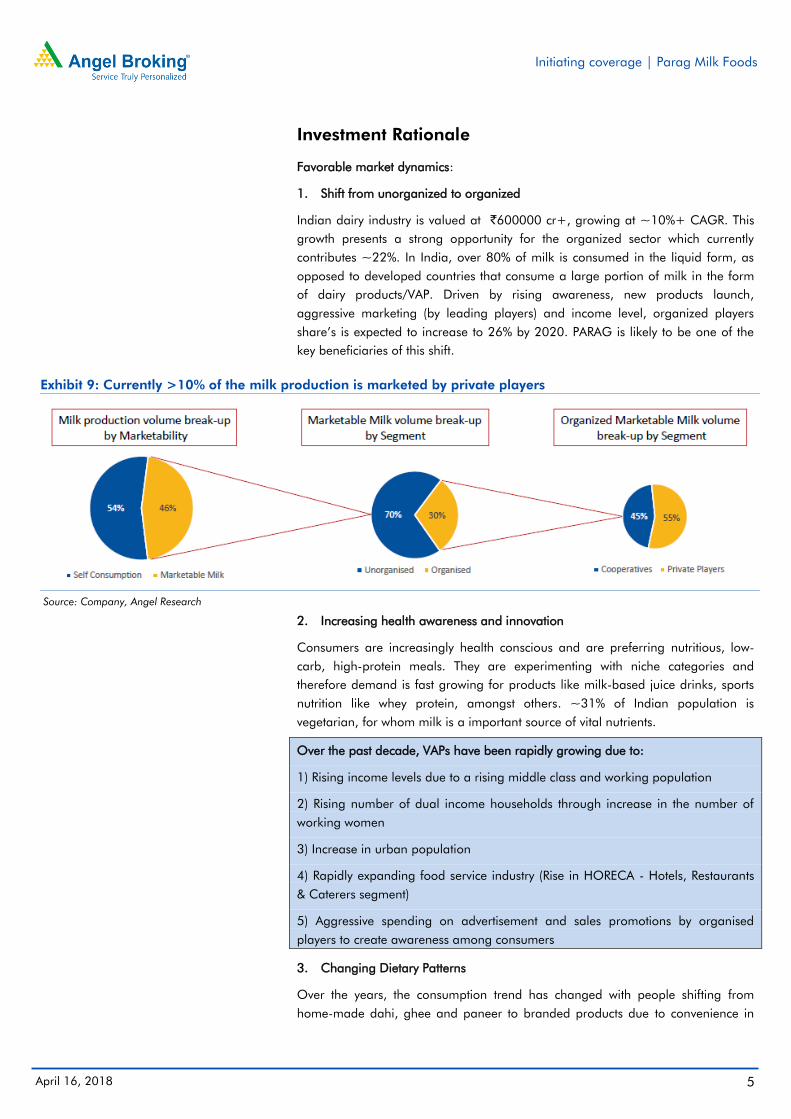
Indian dairy industry is valued at `600000 cr+, growing at ~10%+ CAGR. This
growth presents a strong opportunity for the organized sector which currently
contributes ~22%. In India, over 80% of milk is consumed in the liquid form, as
opposed to developed countries that consume a large portion of milk in the form
of dairy products/VAP. Driven by rising awareness, new products launch,
aggressive marketing (by leading players) and income level, organized players
share’s is expected to increase to 26% by 2020. PARAG is likely to be one of the
key beneficiaries of this shift.
Exhibit 9: Currently >10% of the milk production is marketed by private players
Source: Company, Angel Research
2. Increasing health awareness and innovation
Consumers are increasingly health conscious and are preferring nutritious, low-
carb, high-protein meals. They are experimenting with niche categories and
therefore demand is fast growing for products like milk-based juice drinks, sports
nutrition like whey protein, amongst others. ~31% of Indian population is
vegetarian, for whom milk is a important source of vital nutrients.
Over the past decade, VAPs have been rapidly growing due to:
1) Rising income levels due to a rising middle class and working population
2) Rising number of dual income households through increase in the number of
working women
3) Increase in urban population
4) Rapidly expanding food service industry (Rise in HORECA - Hotels, Restaurants
& Caterers segment)
5) Aggressive spending on advertisement and sales promotions by organised
players to create awareness among consumers
3. Changing Dietary Patterns
Over the years, the consumption trend has changed with people shifting from
home-made dahi, ghee and paneer to branded products due to convenience in
Initiating coverage | Parag Milk Foods
6
April 16, 2018 6
buying and higher assurance of quality. This has promoted the growth in demand
for dairy and VAP.
Product portfolio shifting towards high margin products
Well established brands and diversified product portfolio
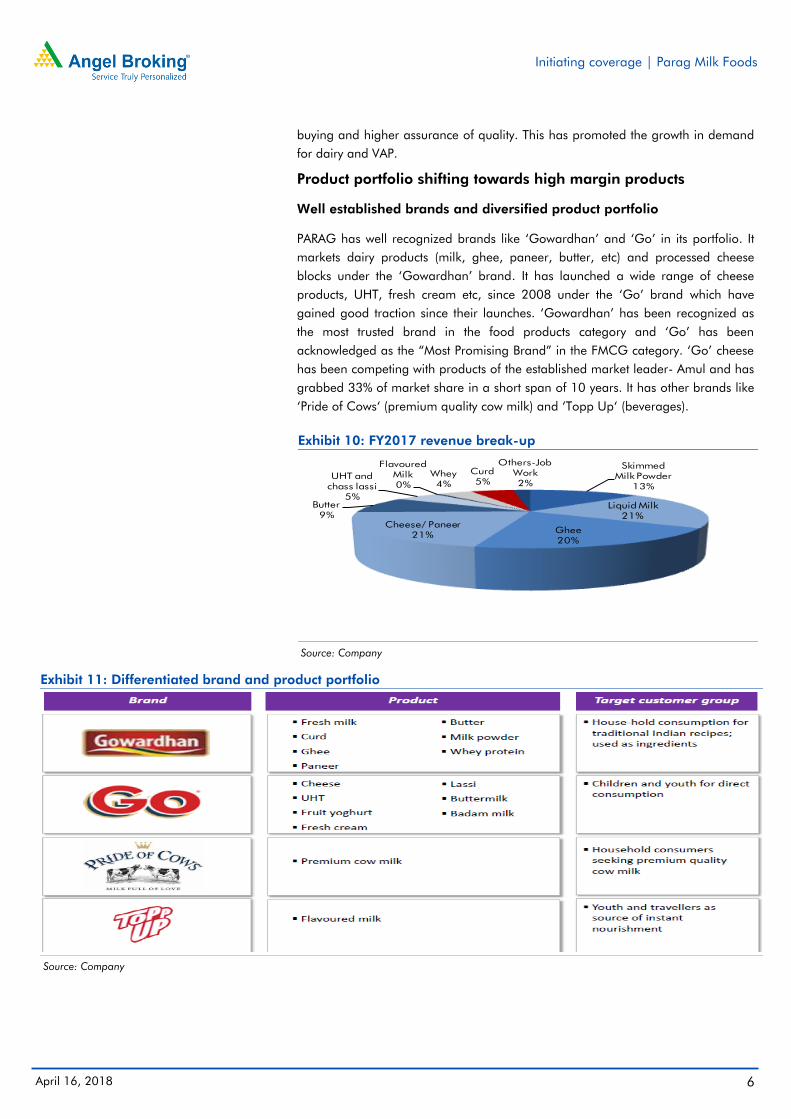
PARAG has well recognized brands like ‘Gowardhan’ and ‘Go’ in its portfolio. It
markets dairy products (milk, ghee, paneer, butter, etc) and processed cheese
blocks under the ‘Gowardhan’ brand. It has launched a wide range of cheese
products, UHT, fresh cream etc, since 2008 under the ‘Go’ brand which have
gained good traction since their launches. ‘Gowardhan’ has been recognized as
the most trusted brand in the food products category and ‘Go’ has been
acknowledged as the “Most Promising Brand” in the FMCG category. ‘Go’ cheese
has been competing with products of the established market leader- Amul and has
grabbed 33% of market share in a short span of 10 years. It has other brands like
‘Pride of Cows‘ (premium quality cow milk) and ‘Topp Up‘ (beverages).
Exhibit 10: FY2017 revenue break-up
Source: Company
Exhibit 11: Differentiated brand and product portfolio
Source: Company
Skimmed
Milk Powder
13%
Liquid Milk
21%
Ghee
20%
Cheese/ Paneer
21%
Butter
9%
UHT and
chass lassi
5%
Flavoured
Milk
0%
Whey
4%
Curd
5%
Others-Job
Work
2%
Initiating coverage | Parag Milk Foods
7
April 16, 2018 7
Product portfolio shifting towards high margin products
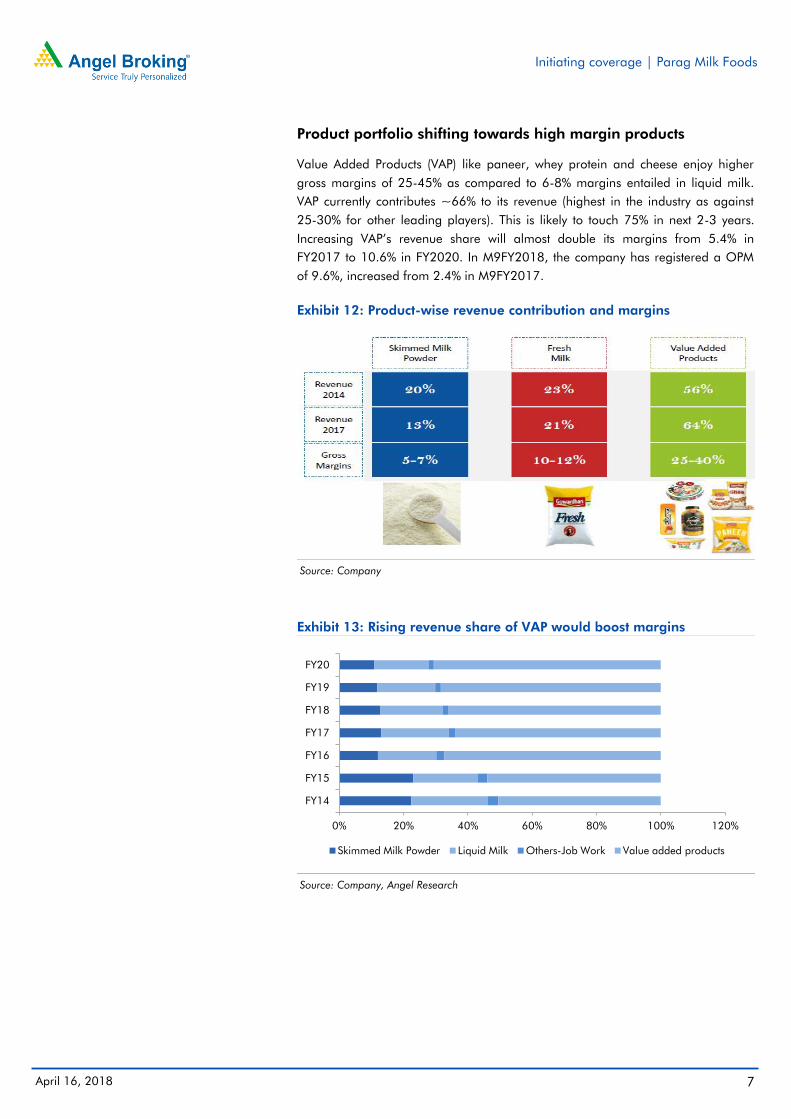
Value Added Products (VAP) like paneer, whey protein and cheese enjoy higher
gross margins of 25-45% as compared to 6-8% margins entailed in liquid milk.
VAP currently contributes ~66% to its revenue (highest in the industry as against
25-30% for other leading players). This is likely to touch 75% in next 2-3 years.
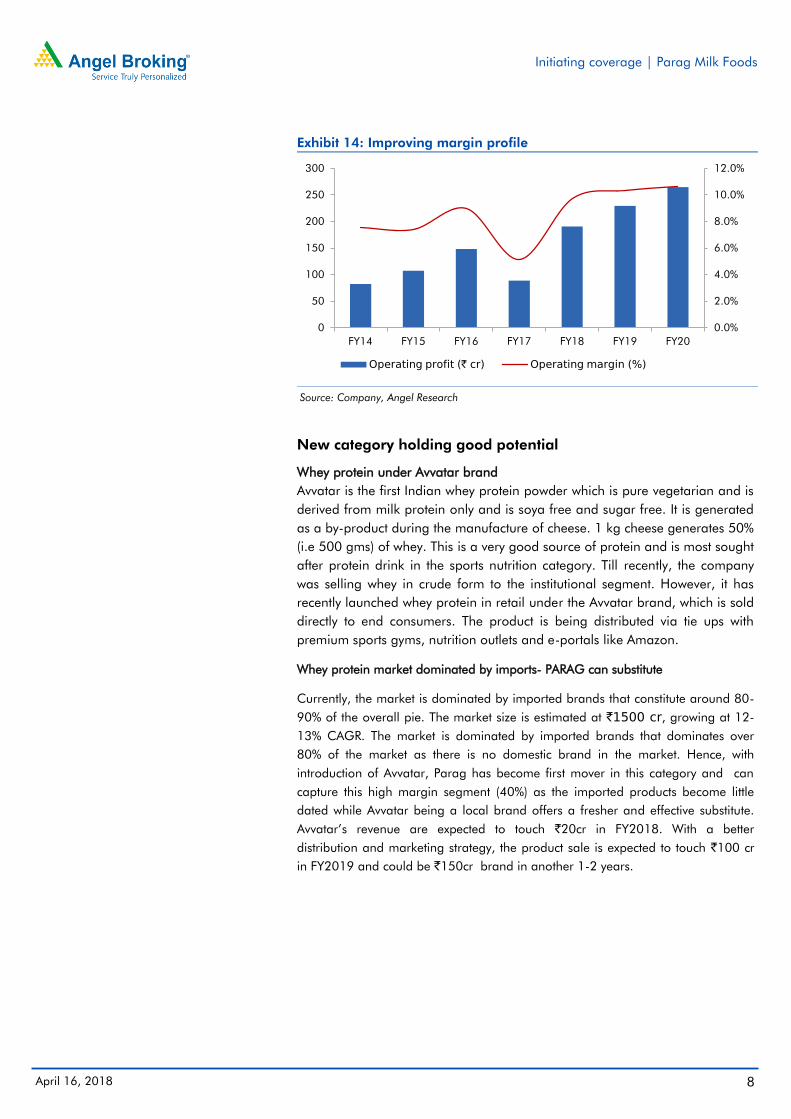
Increasing VAP’s revenue share will almost double its margins from 5.4% in
FY2017 to 10.6% in FY2020. In M9FY2018, the company has registered a OPM
of 9.6%, increased from 2.4% in M9FY2017.
Exhibit 12: Product-wise revenue contribution and margins
Source: Company
Exhibit 13: Rising revenue share of VAP would boost margins
Source: Company, Angel Research
0% 20% 40% 60% 80% 100% 120%
FY14
FY15
FY16
FY17
FY18
FY19
FY20
Skimmed Milk Powder Liquid Milk Others-Job Work Value added products
Initiating coverage | Parag Milk Foods
8
April 16, 2018 8
Exhibit 14: Improving margin profile
Source: Company, Angel Research
New category holding good potential
Whey protein under Avvatar brand
Avvatar is the first Indian whey protein powder which is pure vegetarian and is
derived from milk protein only and is soya free and sugar free. It is generated
as a by-product during the manufacture of cheese. 1 kg cheese generates 50%
(i.e 500 gms) of whey. This is a very good source of protein and is most sought
after protein drink in the sports nutrition category. Till recently, the company
was selling whey in crude form to the institutional segment. However, it has
recently launched whey protein in retail under the Avvatar brand, which is sold
directly to end consumers. The product is being distributed via tie ups with
premium sports gyms, nutrition outlets and e-portals like Amazon.
Whey protein market dominated by imports- PARAG can substitute
Currently, the market is dominated by imported brands that constitute around 80-
90% of the overall pie. The market size is estimated at `1500 cr, growing at 12-
13% CAGR. The market is dominated by imported brands that dominates over
80% of the market as there is no domestic brand in the market. Hence, with
introduction of Avvatar, Parag has become first mover in this category and can
capture this high margin segment (40%) as the imported products become little
dated while Avvatar being a local brand offers a fresher and effective substitute.
Avvatar’s revenue are expected to touch `20cr in FY2018. With a better
distribution and marketing strategy, the product sale is expected to touch `100 cr
in FY2019 and could be `150cr brand in another 1-2 years.
0.0%
2.0%
4.0%
6.0%
8.0%
10.0%
12.0%
0
50
100
150
200
250
300
FY14 FY15 FY16 FY17 FY18 FY19 FY20
Operating profit (` cr) Operating margin (%)
Initiating coverage | Parag Milk Foods
9
April 16, 2018 9
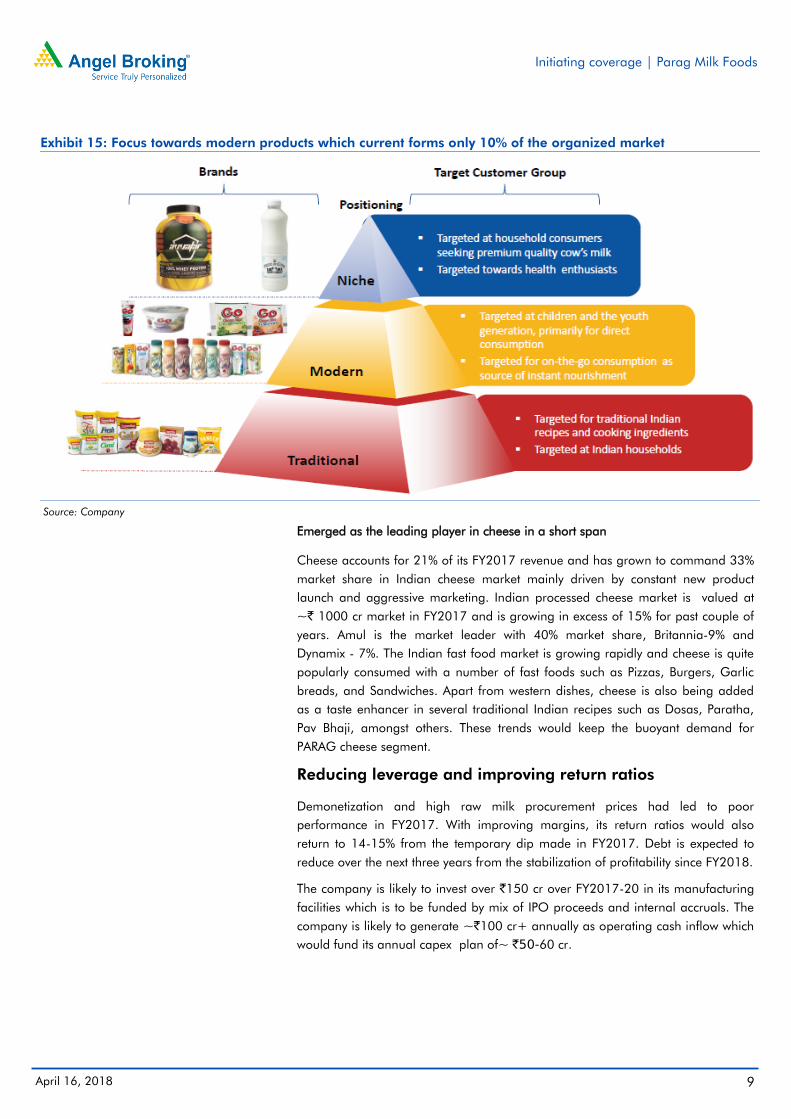
Exhibit 15: Focus towards modern products which current forms only 10% of the organized market
Source: Company
Emerged as the leading player in cheese in a short span
Cheese accounts for 21% of its FY2017 revenue and has grown to command 33%
market share in Indian cheese market mainly driven by constant new product
launch and aggressive marketing. Indian processed cheese market is valued at
~` 1000 cr market in FY2017 and is growing in excess of 15% for past couple of
years. Amul is the market leader with 40% market share, Britannia-9% and
Dynamix - 7%. The Indian fast food market is growing rapidly and cheese is quite
popularly consumed with a number of fast foods such as Pizzas, Burgers, Garlic
breads, and Sandwiches. Apart from western dishes, cheese is also being added
as a taste enhancer in several traditional Indian recipes such as Dosas, Paratha,
Pav Bhaji, amongst others. These trends would keep the buoyant demand for
PARAG cheese segment.
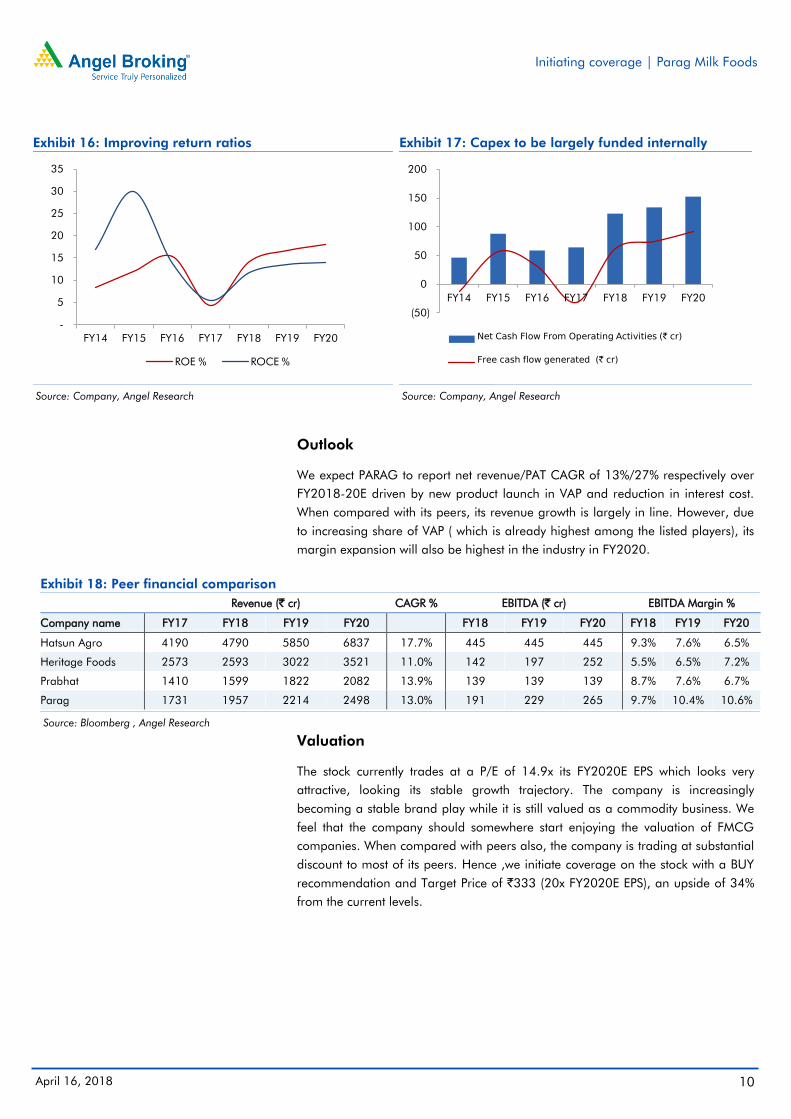
Reducing leverage and improving return ratios
Demonetization and high raw milk procurement prices had led to poor
performance in FY2017. With improving margins, its return ratios would also
return to 14-15% from the temporary dip made in FY2017. Debt is expected to
reduce over the next three years from the stabilization of profitability since FY2018.
The company is likely to invest over `150 cr over FY2017-20 in its manufacturing
facilities which is to be funded by mix of IPO proceeds and internal accruals. The
company is likely to generate ~`100 cr+ annually as operating cash inflow which
would fund its annual capex plan of~ `50-60 cr.
Initiating coverage | Parag Milk Foods
10
April 16, 2018 10
Exhibit 16: Improving return ratios
Source: Company, Angel Research
Exhibit 17: Capex to be largely funded internally
Source: Company, Angel Research
Outlook
We expect PARAG to report net revenue/PAT CAGR of 13%/27% respectively over
FY2018-20E driven by new product launch in VAP and reduction in interest cost.
When compared with its peers, its revenue growth is largely in line. However, due
to increasing share of VAP ( which is already highest among the listed players), its
margin expansion will also be highest in the industry in FY2020.
Exhibit 18: Peer financial comparison
Revenue (` cr) CAGR % EBITDA (` cr) EBITDA Margin %
Company name FY17 FY18 FY19 FY20
FY18 FY19 FY20 FY18 FY19 FY20
Hatsun Agro 4190 4790 5850 6837 17.7% 445 445 445 9.3% 7.6% 6.5%
Heritage Foods 2573 2593 3022 3521 11.0% 142 197 252 5.5% 6.5% 7.2%
Prabhat 1410 1599 1822 2082 13.9% 139 139 139 8.7% 7.6% 6.7%
Parag 1731 1957 2214 2498 13.0% 191 229 265 9.7% 10.4% 10.6%
Source: Bloomberg , Angel Research
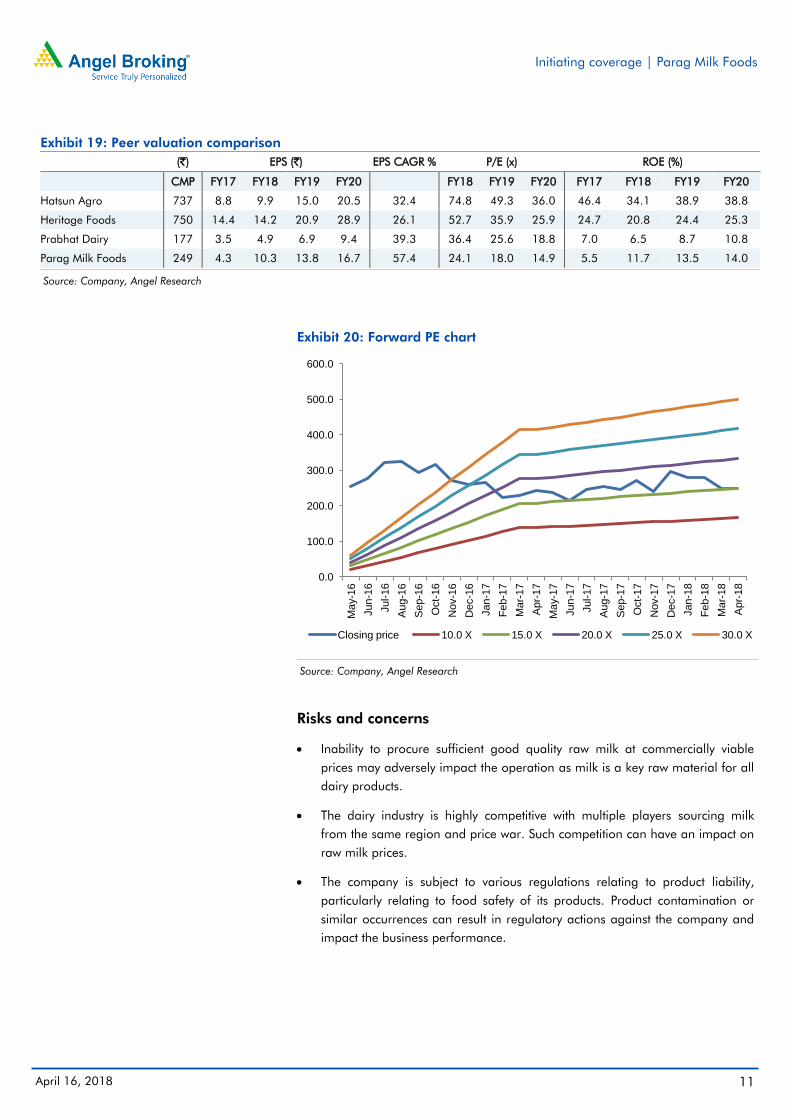
Valuation
The stock currently trades at a P/E of 14.9x its FY2020E EPS which looks very
attractive, looking its stable growth trajectory. The company is increasingly
becoming a stable brand play while it is still valued as a commodity business. We
feel that the company should somewhere start enjoying the valuation of FMCG
companies. When compared with peers also, the company is trading at substantial
discount to most of its peers. Hence ,we initiate coverage on the stock with a BUY
recommendation and Target Price of `333 (20x FY2020E EPS), an upside of 34%
from the current levels.
-
5
10
15
20
25
30
35
FY14 FY15 FY16 FY17 FY18 FY19 FY20
ROE % ROCE %
(50)
0
50
100
150
200
FY14 FY15 FY16 FY17 FY18 FY19 FY20
Net Cash Flow From Operating Activities (` cr)
Free cash flow generated (` cr)
Initiating coverage | Parag Milk Foods
11
April 16, 2018 11
Exhibit 19: Peer valuation comparison
(`) EPS (`) EPS CAGR % P/E (x) ROE (%)
CMP FY17 FY18 FY19 FY20
FY18 FY19 FY20 FY17 FY18 FY19 FY20
Hatsun Agro 737 8.8 9.9 15.0 20.5 32.4 74.8 49.3 36.0 46.4 34.1 38.9 38.8
Heritage Foods 750 14.4 14.2 20.9 28.9 26.1 52.7 35.9 25.9 24.7 20.8 24.4 25.3
Prabhat Dairy 177 3.5 4.9 6.9 9.4 39.3 36.4 25.6 18.8 7.0 6.5 8.7 10.8
Parag Milk Foods 249 4.3 10.3 13.8 16.7 57.4 24.1 18.0 14.9 5.5 11.7 13.5 14.0
Source: Company, Angel Research
Exhibit 20: Forward PE chart
Source: Company, Angel Research
Risks and concerns
Inability to procure sufficient good quality raw milk at commercially viable
prices may adversely impact the operation as milk is a key raw material for all
dairy products.
The dairy industry is highly competitive with multiple players sourcing milk
from the same region and price war. Such competition can have an impact on
raw milk prices.
The company is subject to various regulations relating to product liability,
particularly relating to food safety of its products. Product contamination or
similar occurrences can result in regulatory actions against the company and
impact the business performance.
0.0
100.0
200.0
300.0
400.0
500.0
600.0
Ma
y-1
6
Jun-1
6
Jul-
16
Aug-1
6
Sep-1
6
Oct-
16
Nov-1
6
Dec-1
6
Jan-1
7
Fe
b-1
7
Mar-
17
Apr-
17
Ma
y-1
7
Jun-1
7
Jul-17
Aug-1
7
Sep-1
7
Oct-
17
Nov-1
7
Dec-1
7
Jan-1
8
Fe
b-1
8
Mar-
18
Apr-
18
Closing price 10.0 X 15.0 X 20.0 X 25.0 X 30.0 X
Initiating coverage | Parag Milk Foods
12
April 16, 2018 12
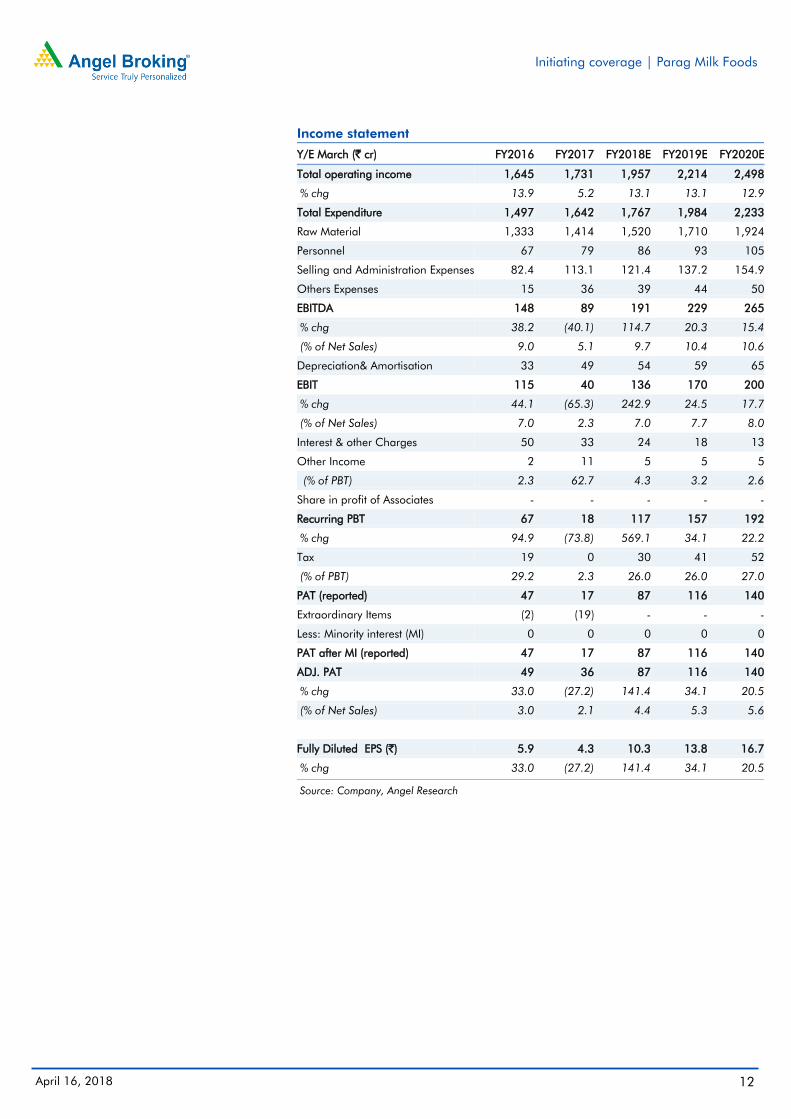
Income statement
Y/E March (` cr) FY2016 FY2017 FY2018E FY2019E FY2020E
Total operating income 1,645 1,731 1,957 2,214 2,498
% chg 13.9 5.2 13.1 13.1 12.9
Total Expenditure 1,497 1,642 1,767 1,984 2,233
Raw Material 1,333 1,414 1,520 1,710 1,924
Personnel 67 79 86 93 105
Selling and Administration Expenses 82.4 113.1 121.4 137.2 154.9
Others Expenses 15 36 39 44 50
EBITDA 148 89 191 229 265
% chg 38.2 (40.1) 114.7 20.3 15.4
(% of Net Sales) 9.0 5.1 9.7 10.4 10.6
Depreciation& Amortisation 33 49 54 59 65
EBIT 115 40 136 170 200
% chg 44.1 (65.3) 242.9 24.5 17.7
(% of Net Sales) 7.0 2.3 7.0 7.7 8.0
Interest & other Charges 50 33 24 18 13
Other Income 2 11 5 5 5
(% of PBT) 2.3 62.7 4.3 3.2 2.6
Share in profit of Associates - - - - -
Recurring PBT 67 18 117 157 192
% chg 94.9 (73.8) 569.1 34.1 22.2
Tax 19 0 30 41 52
(% of PBT) 29.2 2.3 26.0 26.0 27.0
PAT (reported) 47 17 87 116 140
Extraordinary Items (2) (19) - - -
Less: Minority interest (MI) 0 0 0 0 0
PAT after MI (reported) 47 17 87 116 140
ADJ. PAT 49 36 87 116 140
% chg 33.0 (27.2) 141.4 34.1 20.5
(% of Net Sales) 3.0 2.1 4.4 5.3 5.6
Fully Diluted EPS (`) 5.9 4.3 10.3 13.8 16.7
% chg 33.0 (27.2) 141.4 34.1 20.5
Source: Company, Angel Research
Initiating coverage | Parag Milk Foods
13
April 16, 2018 13
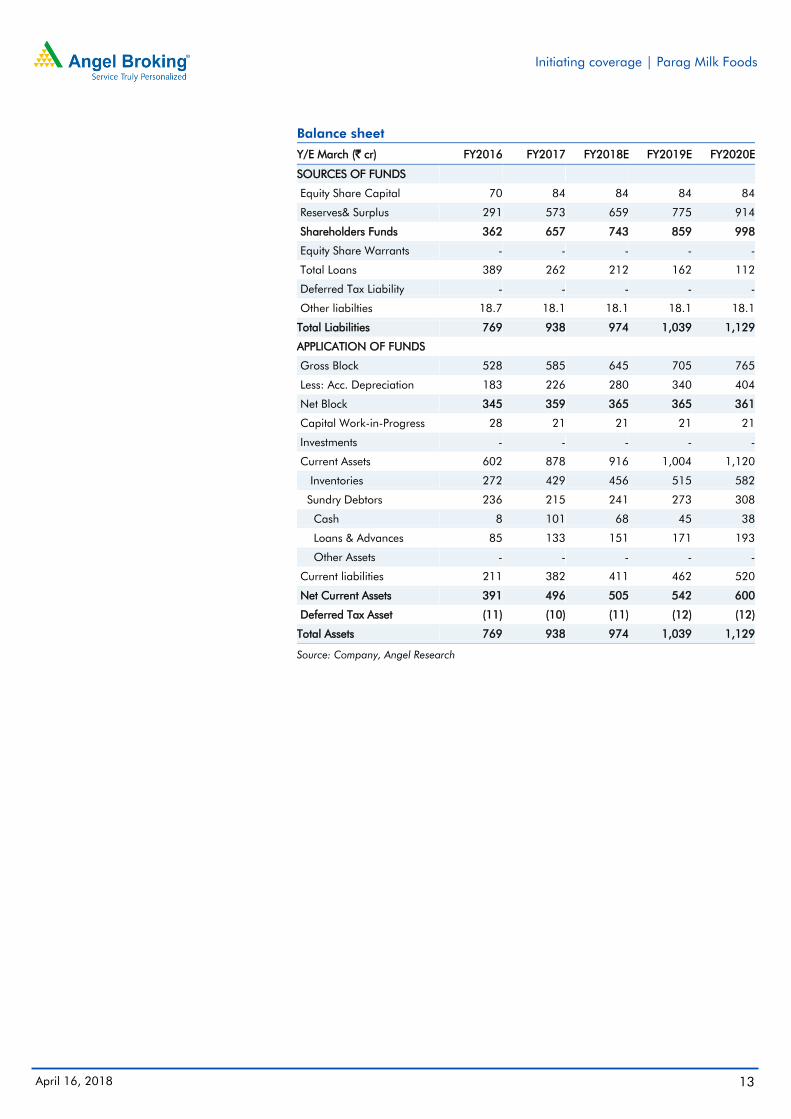
Balance sheet
Y/E March (` cr) FY2016 FY2017 FY2018E FY2019E FY2020E
SOURCES OF FUNDS
Equity Share Capital 70 84 84 84 84
Reserves& Surplus 291 573 659 775 914
Shareholders Funds 362 657 743 859 998
Equity Share Warrants - - - - -
Total Loans 389 262 212 162 112
Deferred Tax Liability - - - - -
Other liabilties 18.7 18.1 18.1 18.1 18.1
Total Liabilities 769 938 974 1,039 1,129
APPLICATION OF FUNDS
Gross Block 528 585 645 705 765
Less: Acc. Depreciation 183 226 280 340 404
Net Block 345 359 365 365 361
Capital Work-in-Progress 28 21 21 21 21
Investments - - - - -
Current Assets 602 878 916 1,004 1,120
Inventories 272 429 456 515 582
Sundry Debtors 236 215 241 273 308
Cash 8 101 68 45 38
Loans & Advances 85 133 151 171 193
Other Assets - - - - -
Current liabilities 211 382 411 462 520
Net Current Assets 391 496 505 542 600
Deferred Tax Asset (11) (10) (11) (12) (12)
Total Assets 769 938 974 1,039 1,129
Source: Company, Angel Research
Initiating coverage | Parag Milk Foods
14
April 16, 2018 14
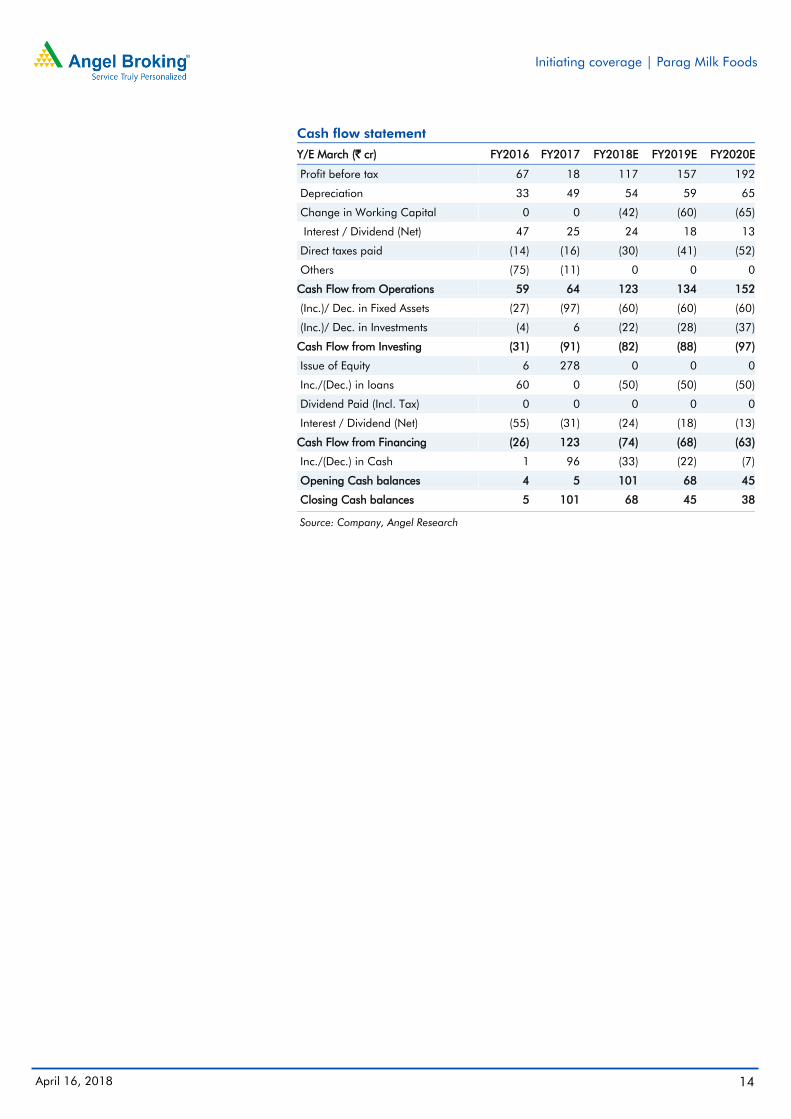
Cash flow statement
Y/E March (` cr) FY2016 FY2017 FY2018E FY2019E FY2020E
Profit before tax 67 18 117 157 192
Depreciation 33 49 54 59 65
Change in Working Capital 0 0 (42) (60) (65)
Interest / Dividend (Net) 47 25 24 18 13
Direct taxes paid (14) (16) (30) (41) (52)
Others (75) (11) 0 0 0
Cash Flow from Operations 59 64 123 134 152
(Inc.)/ Dec. in Fixed Assets (27) (97) (60) (60) (60)
(Inc.)/ Dec. in Investments (4) 6 (22) (28) (37)
Cash Flow from Investing (31) (91) (82) (88) (97)
Issue of Equity 6 278 0 0 0
Inc./(Dec.) in loans 60 0 (50) (50) (50)
Dividend Paid (Incl. Tax) 0 0 0 0 0
Interest / Dividend (Net) (55) (31) (24) (18) (13)
Cash Flow from Financing (26) 123 (74) (68) (63)
Inc./(Dec.) in Cash 1 96 (33) (22) (7)
Opening Cash balances 4 5 101 68 45
Closing Cash balances 5 101 68 45 38
Source: Company, Angel Research
Initiating coverage | Parag Milk Foods
15
April 16, 2018 15
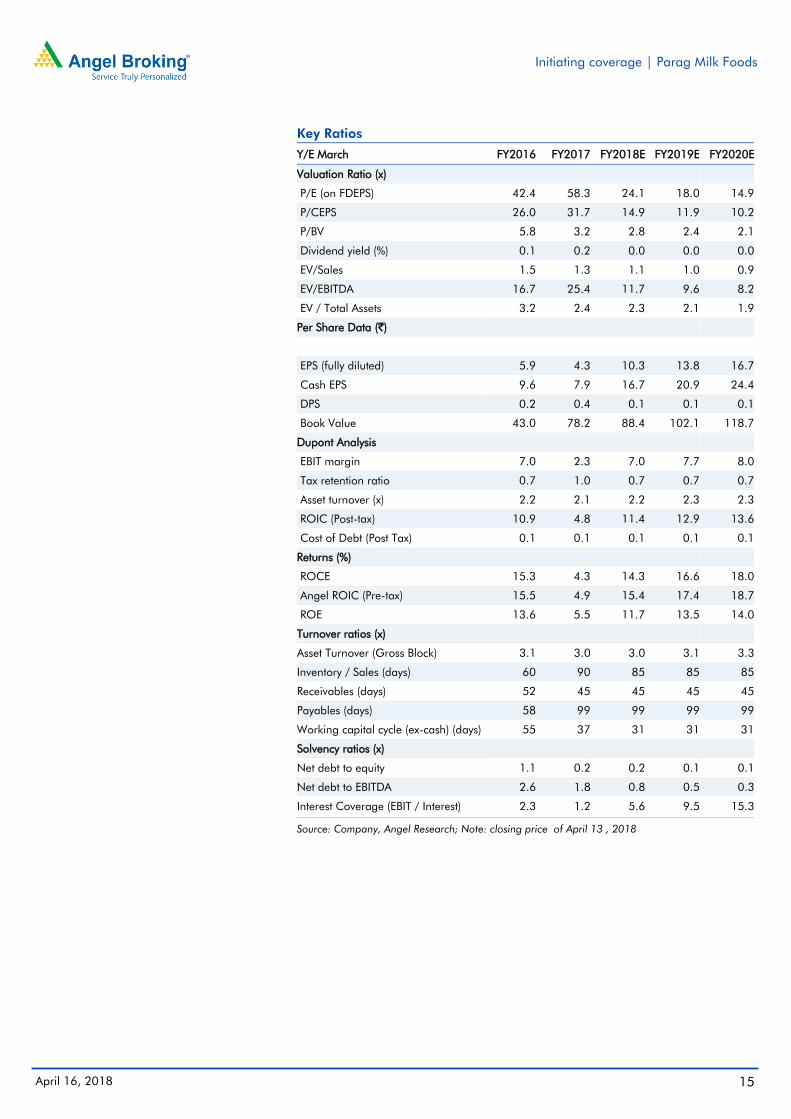
Key Ratios
Y/E March FY2016 FY2017 FY2018E FY2019E FY2020E
Valuation Ratio (x)
P/E (on FDEPS) 42.4 58.3 24.1 18.0 14.9
P/CEPS 26.0 31.7 14.9 11.9 10.2
P/BV 5.8 3.2 2.8 2.4 2.1
Dividend yield (%) 0.1 0.2 0.0 0.0 0.0
EV/Sales 1.5 1.3 1.1 1.0 0.9
EV/EBITDA 16.7 25.4 11.7 9.6 8.2
EV / Total Assets 3.2 2.4 2.3 2.1 1.9
Per Share Data (`)
EPS (fully diluted) 5.9 4.3 10.3 13.8 16.7
Cash EPS 9.6 7.9 16.7 20.9 24.4
DPS 0.2 0.4 0.1 0.1 0.1
Book Value 43.0 78.2 88.4 102.1 118.7
Dupont Analysis
EBIT margin 7.0 2.3 7.0 7.7 8.0
Tax retention ratio 0.7 1.0 0.7 0.7 0.7
Asset turnover (x) 2.2 2.1 2.2 2.3 2.3
ROIC (Post-tax) 10.9 4.8 11.4 12.9 13.6
Cost of Debt (Post Tax) 0.1 0.1 0.1 0.1 0.1
Returns (%)
ROCE 15.3 4.3 14.3 16.6 18.0
Angel ROIC (Pre-tax) 15.5 4.9 15.4 17.4 18.7
ROE 13.6 5.5 11.7 13.5 14.0
Turnover ratios (x)
Asset Turnover (Gross Block) 3.1 3.0 3.0 3.1 3.3
Inventory / Sales (days) 60 90 85 85 85
Receivables (days) 52 45 45 45 45
Payables (days) 58 99 99 99 99
Working capital cycle (ex-cash) (days) 55 37 31 31 31
Solvency ratios (x)
Net debt to equity 1.1 0.2 0.2 0.1 0.1
Net debt to EBITDA 2.6 1.8 0.8 0.5 0.3
Interest Coverage (EBIT / Interest) 2.3 1.2 5.6 9.5 15.3
Source: Company, Angel Research; Note: closing price of April 13 , 2018
Initiating coverage | Parag Milk Foods
16
April 16, 2018 16
-
Research Team Tel: 022 - 39357800 E-mail: [email protected] Website: www.angelbroking.com
DISCLAIMER
Angel Broking Private Limited (hereinafter referred to as “Angel”) is a registered Member of National Stock Exchange of India Limited,
Bombay Stock Exchange Limited and Metropolitan Stock Exchange Limited. It is also registered as a Depository Participant with CDSL
and Portfolio Manager and Investment Adviser with SEBI. It also has registration with AMFI as a Mutual Fund Distributor. Angel Broking
Private Limited is a registered entity with SEBI for Research Analyst in terms of SEBI (Research Analyst) Regulations, 2014 vide
registration number INH000000164. Angel or its associates has not been debarred/ suspended by SEBI or any other regulatory
authority for accessing /dealing in securities Market. Angel or its associates/analyst has not received any compensation / managed or
co-managed public offering of securities of the company covered by Analyst during the past twelve months.
This document is solely for the personal information of the recipient, and must not be singularly used as the basis of any investment
decision. Nothing in this document should be construed as investment or financial advice. Each recipient of this document should
make such investigations as they deem necessary to arrive at an independent evaluation of an investment in the securities of the
companies referred to in this document (including the merits and risks involved), and should consult their own advisors to determine
the merits and risks of such an investment.
Reports based on technical and derivative analysis center on studying charts of a stock's price movement, outstanding positions and
trading volume, as opposed to focusing on a company's fundamentals and, as such, may not match with a report on a company's
fundamentals. Investors are advised to refer the Fundamental and Technical Research Reports available on our website to evaluate the
contrary view, if any
The information in this document has been printed on the basis of publicly available information, internal data and other reliable
sources believed to be true, but we do not represent that it is accurate or complete and it should not be relied on as such, as this
document is for general guidance only. Angel Broking Pvt. Limited or any of its affiliates/ group companies shall not be in any way
responsible for any loss or damage that may arise to any person from any inadvertent error in the information contained in this report.
Angel Broking Pvt. Limited has not independently verified all the information contained within this document. Accordingly, we cannot
testify, nor make any representation or warranty, express or implied, to the accuracy, contents or data contained within this document.
While Angel Broking Pvt. Limited endeavors to update on a reasonable basis the information discussed in this material, there may be
regulatory, compliance, or other reasons that prevent us from doing so.
This document is being supplied to you solely for your information, and its contents, information or data may not be reproduced,
redistributed or passed on, directly or indirectly.
Neither Angel Broking Pvt. Limited, nor its directors, employees or affiliates shall be liable for any loss or damage that may arise from
or in connection with the use of this information.
Note: Please refer to the important ‘Stock Holding Disclosure' report on the Angel website (Research Section). Also, please refer to the
latest update on respective stocks for the disclosure status in respect of those stocks. Angel Broking Pvt. Limited and its affiliates may
have investment positions in the stocks recommended in this report.
Disclosure of Interest Statement Parag Milk Foods Ltd.
1. Financial interest of research analyst or Angel or his Associate or his relative No
2. Ownership of 1% or more of the stock by research analyst or Angel or associates or relatives No
3. Served as an officer, director or employee of the company covered under Research No
4. Broking relationship with company covered under Research No
Ratings (Based on expected returns Buy (> 15%) Accumulate (5% to 15%) Neutral (-5 to 5%)
over 12 months investment period): Reduce (-5% to -15%) Sell (< -15)