Initiating Coverage (Buy) Turbo-charged for next up-cycle...
34
Amtek Auto Ltd Initiating Coverage (Buy) Turbo-charged for next up-cycle around 11 Feb 2013 CMP – Rs 72.30 Price Target- Rs129 Upside Potential: 78% Index Constituent CNXAuto, CNX200, CNXMidcap, BSE200 Equity Share Data BSE -520077, NSE -AMTEKAUTO Market Capitalization-Rs15.95bn Face Value- Rs2 O/s Shares- 220mn # of shares pledged -- NIL # of shares pledged in any group company – NIL Shareholding Pattern Share Trading Data 3month avg Vol. (NSE & BSE) – 0.73 mn Month H/L- Rs91.90 / Rs 72.85 Year H/L - Rs146.70 / Rs 69.05 Historic High- Rs525 (6Nov‟07) Historic Low- Rs42 (24 Nov‟08) Amtek Auto vs. CNXAuto Pending FCCB 5.625%,due July‟14 Conv Price (Rs148/sh) - $6.9mn Debt Paper Ratings Long Term Debt- AA Comm. Paper - A1+ Short Term Debt - A1+ NCDs - AA Operating sustainably at highest profit margin in the industry with entrenched position, Amtek Auto Ltd (AAL) is set to get the much desired raw material support on favorable terms from two newly established plants by a group company, which would offer better value propositions to its marquee clients to expand market share, improve asset turnover, resulting in improvement of return ratios and expansion in valuation metrics. The Company has two listed and four operating closely-held subsidiaries having profitable track-record. In challenging times it has not digressed from domain auto sector, and diversified in the realm of its activities into non-automotive sectors of railway and defense having promising prospects. We believe, the heightened expansion in response to global OEMs plan is behind us. AAL has successfully, demonstrated the art of acquisition and integration in last decade, which, we believe is key to success as the industry is heading for consolidation, and natural demise of marginal players is imperative in days ahead. We estimate its consolidated income to grow at 10% CAGR and net income at 18% CAGR during FY12-15e. Our estimation of base case SOTP equity valuation of AAL for FY14e turns out to be Rs 129/share (Rs175 for FY15e) which is huge discount to ruling level of Rs 72 leaving 78% upside potential. Key Investment Rationale Rapidly evolving supply chain management likely to prove nemesis to peers AAL‟s RMC/Sales remained steep high level at ~60% against industry average of ~50%, even as its EBIDTA margin for years has remained defiantly higher than peers, thanks to its focus on value added products & unmatched machining capability. We believe, with sourcing of key raw materials (Steel 95%) from a group company on favorable terms akin to its peers, AAL would be in an inimitable position to offer better value propositions to its marquee clients, which would be a game-changer for the company. Value added Machining & Sub-assembly production constitute more than half (51%). As AAL strives to churn out more value added components, margin improvement seems natural corollary. Large scale Capex funded by cheaper debt likely to bear fruit AAL‟s large scale debt laden capex program of Rs87.1bn (FY09-12) since last auto-slowdown in FY09, we believe, is just behind us. The Company is likely to see turnaround in FCF, which would boost financial outlook and valuation going forward. Further, AAL is mulling a captive EPC division to reduce Capex execution costs in future. The cost of debt stayed at ~7.5%. Kicker from fresh global OEMs’ move to sustain momentum Leading global OEMs like Audi, VW, GM, Ford, JLR, Ranault etc which have set up shops here (on cost arbitrage) as regional hub, is getting encouraging local demands as well. Their overall plan to expand Indian operations is fast changing, resulting in incremental demand. Focused on promising Passenger Vehicle segment, fortified with Capex, will enable it to cater to the evolving fashion of cars, and SUVs, which is witnessing supra-average industry demand. Monetary & Fiscal impetus would revive auto demand in 2HFY14e with clear-cut fuel policy to clear buyers‟ confusion, which will set growth momentum of AAL. Inexpensive valuation untenable of a leading player, sustaining pricing power for years: Prolonged Aberration Set To Reverse AAL is the 2 nd largest forging company, focused on progressive value addition, introduction of new products to improve margins and retain pricing power. Ability to raise cheaper debts for growth is assuring. We believe, the expected return far outweighs the inherent risk and AAL‟s extant valuation has hefty upside potential. Valuation Summary Analyst: Surya Narayan Nayak, AVP, Equity Research [email protected] Investor Cat. % Promoters 39.93 DII 6.99 FII 30.57 Public 22.51 Item Particulars (Figs in Rs mn) Net Income FY14e (Rs mn) Bear Case PEM (x) Bull Case PEM (x) Net Equity Value (Bear Case) Net Equity Value (Bull Case) Net Inc of AAL (Standalone) 3,237 5 8 16,183 25,892 Net Inc of Subsidiaries after Minority Int 5,462 5 8 19,214 30,742 JVs Investment at Book Value 1,387 1,387 GrossEq Value of Subs&JVs 20,601 32,129 Holding Co. Discount (40%) (8,240) (12,852) Net Eq Value of Subs & JVs 12,361 19,277 Gross Eq Valuation of AAL 28,543 45,170 Per Share Value (Rs) 129 205 Period AAL CNXAuto 3m 1% 2% 6m -16% 16% 9m -37% 12% 12m -38% 15%
Transcript of Initiating Coverage (Buy) Turbo-charged for next up-cycle...

Amtek Auto Ltd Initiating Coverage (Buy) Turbo-charged for next up-cycle around
11 Feb 2013
CMP – Rs 72.30
Price Target- Rs129
Upside Potential: 78%
Index Constituent
CNXAuto, CNX200,
CNXMidcap, BSE200
Equity Share Data
BSE -520077, NSE -AMTEKAUTO Market Capitalization-Rs15.95bn
Face Value- Rs2
O/s Shares- 220mn
# of shares pledged -- NIL
# of shares pledged in any group company – NIL
Shareholding Pattern
Share Trading Data 3month avg Vol.
(NSE & BSE) – 0.73 mn
Month H/L- Rs91.90 / Rs 72.85
Year H/L - Rs146.70 / Rs 69.05
Historic High- Rs525 (6Nov‟07)
Historic Low- Rs42 (24 Nov‟08)
Amtek Auto vs. CNXAuto Pending FCCB
5.625%,due July‟14 Conv Price (Rs148/sh) - $6.9mn
Debt Paper Ratings
Long Term Debt- AA
Comm. Paper - A1+
Short Term Debt - A1+
NCDs - AA
Operating sustainably at highest profit margin in the industry with entrenched position, Amtek Auto Ltd (AAL) is set to get the much desired raw material support on favorable terms from two newly established plants by a group company, which would offer better value propositions to its marquee clients to expand market share, improve asset turnover, resulting in improvement of return ratios and expansion in valuation metrics. The Company has two listed and four operating closely-held subsidiaries having profitable track-record. In challenging times it has not digressed from domain auto sector, and diversified in the realm of its activities into non-automotive sectors of railway and defense having promising prospects. We believe, the heightened expansion in response to global OEMs plan is behind us. AAL has successfully, demonstrated the art of acquisition and integration in last decade, which, we believe is key to success as the industry is heading for consolidation, and natural demise of marginal players is imperative in days ahead. We estimate its consolidated income to grow at 10% CAGR and net income at 18% CAGR during FY12-15e. Our estimation of base case SOTP equity valuation of AAL for FY14e turns out to be Rs 129/share (Rs175 for FY15e) which is huge discount to ruling level of Rs 72 leaving 78% upside potential.
Key Investment Rationale Rapidly evolving supply chain management likely to prove nemesis to peers
AAL‟s RMC/Sales remained steep high level at ~60% against industry average of ~50%, even as its EBIDTA margin for years has remained defiantly higher than peers, thanks to its focus on value added products & unmatched machining capability. We believe, with sourcing of key raw materials (Steel 95%) from a group company on favorable terms akin to its peers, AAL would be in an inimitable position to offer better value propositions to its marquee clients, which would be a game-changer for the company. Value added Machining & Sub-assembly production constitute more than half (51%). As AAL strives to churn out more value added
components, margin improvement seems natural corollary.
Large scale Capex funded by cheaper debt likely to bear fruit
AAL‟s large scale debt laden capex program of Rs87.1bn (FY09-12) since last auto-slowdown in FY09, we believe, is just behind us. The Company is likely to see turnaround in FCF, which would boost financial outlook and valuation going forward. Further, AAL is mulling a captive EPC division to reduce Capex execution costs in future. The cost of debt stayed at ~7.5%.
Kicker from fresh global OEMs’ move to sustain momentum
Leading global OEMs like Audi, VW, GM, Ford, JLR, Ranault etc which have set up shops here (on cost arbitrage) as regional hub, is getting encouraging local demands as well. Their overall plan to expand Indian operations is fast changing, resulting in incremental demand. Focused on promising Passenger Vehicle segment, fortified with Capex, will enable it to cater to the evolving fashion of cars, and SUVs, which is witnessing supra-average industry demand. Monetary & Fiscal impetus would revive auto demand in 2HFY14e with clear-cut fuel policy to clear buyers‟ confusion, which will set growth momentum of AAL.
Inexpensive valuation untenable of a leading player, sustaining pricing power for years: Prolonged Aberration Set To Reverse
AAL is the 2nd
largest forging company, focused on progressive value addition, introduction of new products to improve margins and retain pricing power. Ability to raise cheaper debts for growth is assuring. We believe, the expected return far outweighs the inherent risk and AAL‟s extant valuation has hefty upside potential.
Valuation Summary
Analyst:
Surya Narayan Nayak,
AVP, Equity Research
Investor Cat. %
Promoters 39.93
DII 6.99
FII 30.57
Public 22.51
Item Particulars
(Figs in Rs mn)
Net
Income
FY14e
(Rs mn)
Bear
Case
PEM (x)
Bull
Case
PEM (x)
Net
Equity
Value
(Bear
Case)
Net
Equity
Value
(Bull
Case)
Net Inc of AAL (Standalone) 3,237 5 8 16,183 25,892
Net Inc of Subsidiaries after Minority Int 5,462 5 8 19,214 30,742
JVs Investment at Book Value 1,387 1,387
GrossEq Value of Subs&JVs 20,601 32,129
Holding Co. Discount (40%) (8,240) (12,852)
Net Eq Value of Subs & JVs 12,361 19,277
Gross Eq Valuation of AAL 28,543 45,170
Per Share Value (Rs) 129 205
Period AAL CNXAuto
3m 1% 2%
6m -16% 16%
9m -37% 12%
12m -38% 15%

Amtek Auto Ltd: Initiating Coverage (Buy) Turbo-charged for next up-cycle around
[email protected] Strictly Confidential: Only for internal circulation 2
Fresh Raw Material Linkage, the big game changer
We analyzed raw material (RM) intensity across industry peers and found that the average RM cost has been hovering around 50% of sales. Further, we noticed that players have either advantage of backward linkage from a group entity OR proximity to RM sources. AAL has for years been in a disadvantage position, sourcing key RM (chiefly alloy steel and scrap 90%) from open market, is set to derive big advantage as, we believe, is likely to source key RMs from OCL Iron & Steel Ltd, which has set up a cold rolling (CR) mill purportedly for AAL and is on the verge of commissioning another state-of-the art casting unit in Rajasthan. AAL‟s manufacturing cost is the least among peers, while RMC/Sales stood highest at 60%. We envisage ~10% margin buffer, which would prove nemesis to its peers. Though we have not modeled possible cost benefit of this arrangement, we await management‟s clarification on the same. However, the 2012 Annual Report of AAL and OCLISL left many indications for our prognosis coming true in medium term. We believe, AAL could partially transmit benefit to OEM clients, while keeping maximum gains for it. This would, we envisage, result in expansion in market share, improvement in asset turnover and return parameters going ahead.
Source: Networth Research, Annual Reports
Better terms of RM sourcing : +ve impact on WC
We also observed that Cash Conversion Cycle (CCC) highest in case of AAL, which is set to improve even on modest favorable terms by RM supplier as the DPO is the least (27days) at 50% lower than the industry average. We expect 25-30 days enhancement of DPO going ahead, which would sweeten CCC by equal margin. We envisage status quo to modest improvement for DSO & DIO. However, we‟ve not modeled any possible enhancement in DPO, which will greatly influence Operating Cash Flow.
DPO-Days Payable o/s, DSO- Days Sales O/s, DIO-Days Inventory o/s
25%
3%
6%
1%
2%
3%
60%
16%
6%
13%
6%
5%
8%
46%
9%
6%
21%
9%
2%
7%
47%
16%
5%
5%
4%
5%
9%
55%
EBIDTA
SG & A Exp
Personnel Exp
Other Mfg Exp
Consumables
Power & Fuel
RM/Sales
Amtek Auto (cons) Bharat Forge Mahindra Forging Ramakrishna Forging
Exhibit: 1 Raw Material cost highest, so as EBIDTA margin
113
47
-55
105
53
53
-49
57
76
46
-59
63
110
72
-27
155
DIO
DSO
DPO
CCC
Amtek Auto (cons) Bharat Forge (cons) Mahindra Forging (cons) Ramakrishna Forging
Avg. DPO (ex-AAL) at
54 days.
Scope for
rise
Avg. CCC (ex-AAL) at
75 days.
High Scope
for fall
Key Investment
Triggers/Rationale
Exhibit :2a CCC trend of peers, High Scope of Improvement

Amtek Auto Ltd: Initiating Coverage (Buy) Turbo-charged for next up-cycle around
[email protected] Strictly Confidential: Only for internal circulation 3
Large-scale Capex targeted towards more machining & products, behind us; pricing power intact; spike in asset utilization to boost RoE
We believe, the negative FCF thanks to large capex (Rs37.5bn in FY11, Rs12.9bn in FY12), could be one the prime reason for subdued stock undervaluation, as the business was requiring massive lift up to match the OEM‟s plans as well as investment necessitated to cater to new tastes of luxury cars, SUVs, even as it strives to deliver more value added products However, key point stands apart over the years, which we believe, the street ignored all along, is its sustainable pricing power, reflected in the margins. We see the asset turnover to look up in future, which would positively boost RoE. The FY06-12 Capex amounted to Rs109.5bn vs Rs44.3bn in peer firm Bharat Forge Ltd (~2.5x)
Source: Networth Research
Presence across nearly all sub-segments and benign govt policies: Big +ve
Exim data reveals that, India is net importer of auto components for years and the trend is estimated to continue in future due to OEMs not finding right kind of vendors, complying their scale and quality parameters. AAL, which has been supplying critical auto components to OEMs, is progressively striving to introduce more products per vehicles. From the product portfolio (>>) of Amtek and the industry structure (see Exhibit-3) (Souce: ACMA), we understand that Amtek has positioned itself (partially /fully) in nearly all segments (84%) of the industry (sans Auto Electrical). Industry sources relay that OEMs are fast adopting localization on cost consideration.AAL to gain larger market share in each segment going ahead. Industry consultants opine that global OEMs have already started the process of mending local vendors, with a view to reduce import content. Further, Centre‟s CAD (current a/c deficit) reduction drive would result in benign fiscal policies encouraging localization.
Source: Networth Research, ACMA
31%
19%
12%
12%
10%
9%7%
Engine Parts Drive Transmission
& Steering Parts
Body & Chassis
Suspension & Braking
Parts
Equipments Electrical Parts
Others
Amtek Auto Ltd’s Presence
11,72111,35214,334
-345
-37,696
-7,238-8,869-9,192-7,989-8,147
FY15eFY14eFY13eFY12FY11FY10FY09FY08FY07FY06
Turnaround in FCF is beginning to look up, fresh RM linkage
could hasten it
Exhibit: 2b Turnaround in FCF
Exhibit:3 Industry Structure by Product Range & AAL’s Presence

Amtek Auto Ltd: Initiating Coverage (Buy) Turbo-charged for next up-cycle around
[email protected] Strictly Confidential: Only for internal circulation 4
Global OEMs are now more bullish on India; SUVs & Luxury Cars shining We noticed in recent times that the management of global OEMs have turned more bullish on India, as a great consumption story, which earlier thought of as only an export hub. Companies, like VW along with sister concerns SKODA, GM, Ford, JLR, Volvo etc in recent times evinced interest to ramp up their marketing set up in response to the encouraging sales trend in recent times even in the backdrop of tepid demand from compact car segment. OEM majors opined that, changing fuel price regime has impacted compact car volume in the lower end segment, which will eventually look up. Also, clarity on fuel policy was hindering investments from OEM side. With clarity on diesel pricing policy, OEMs‟ investments are now expected to gear up boosting volume prospect of AAL in medium to long term. .
Expected Return far outweighs the Risks, big time capex behind us: Buy The stock is lying low at near multi-year low, though we found apparently no fundamental reason which could have triggered such price capitulation. We believe, street is becoming unjustifiably circumspect of its acquisition drive and aggressive capex in the past to improve its product portfolio on larger scale and reduce risk. However, we understand that acquisition is imperative, given smaller players face extinction on lack of technological and financial wherewithal to grow, and appropriate to come under a bigger umbrella to contribute meaningfully to growth. We believe big-time capex are behind us, and asset utilization level to progressively improve. Amtek has been successfully grown the acquired companies, Ahmednagar Forging, a case in point. (>> promoter track record). Our estimation for FY14e suggests a price objective of Rs126 even for Bear Case Scenario. For Bull Case, the same is Rs200 for a 1 year price objective (>>valuation) We further noted that the promoters have contributed Rs10.13-bn so far in last decade, at an average cost of Rs257/share. (>>promoter’s equity infusion history)

Amtek Auto Ltd: Initiating Coverage (Buy) Turbo-charged for next up-cycle around
[email protected] Strictly Confidential: Only for internal circulation 5
Company Background, Organization Structure ……………………………………....Page 6
Income & Net Income mix of entities, Segmental Income ……………....................Page8
Auto Component Sector Trend & Long-term Outlook ……………………………….Page 9
Automobile Sector FY13 outlook & Beyond ………………………………………….Page 9
Amtek Auto Ltd: Financial Review , Key Assumptions & Outlook…….... …………Page 10
Valuation, Inter-firm Comparison, Price Outlook, Stock Performance ..................Page 17
Quarterly Momentum ……………………………………..…………………………….Page 21
Glance at Subsidiaries …………………………………………………………………Page 22
Associate Companies: Hidden Triggers ………………………………….................Page 26
Key Management Personnel ……………………………………………....................Page 27
Promoters‟ Track Record ……………………………………………………………...Page 28
Corporate Governance Review ……………………………………………………….Page 29
Fund holding, Recent Equity Deals in Industry, Plant Locations ………………….Page 30
Product Profile & Application Illustration ……………………………………………..Page 31
Clientele ………………………………………………………………………………..Page 32
Notable JVs ...…………………………………………………………………………..Page 33
(Note: We have obtained all financial data from the primary sources of respective Company Annual Reports and websites for this report)
Index of Contents

Amtek Auto Ltd: Initiating Coverage (Buy) Turbo-charged for next up-cycle around
[email protected] Strictly Confidential: Only for internal circulation 6
Amtek Auto is one of the largest integrated component manufacturers in India with a strong global presence. It has world class technical and operational expertise in the manufacturing of both auto and non-auto components. Given the global manufacturing base (India, UK, & Germany), broad product range and focus on quality, the Company is a preferred supplier to many domestic and global marquee blue-chip OEM‟s/ Tier-1 vendors. It is a market leader in a variety of powertrain and drivetrain components and assemblies. It has 43 world class manufacturing facilities located in India (39) and Europe (4). With the infrastructure and technology platform developed over 25 years, the Group is well positioned in the Indian Auto and Non-Auto component markets. In the Auto segment, it has proven capabilities in iron casting and forging, high pressure die aluminum casting, machining and sub-assemblies. This has enabled the development of a highly engineered component product portfolio including the manufacturing of complex components for engines, transmissions, suspensions and chassis for passenger cars, 2/3 wheelers, light and heavy commercial vehicles (LHCV). AAL is one of the largest manufacturers of engine components including Cylinder blocks & heads, Crankshafts, Piston-Connecting rod modules, flywheel ring gears, etc. The Non-Auto segment currently manufactures components for tractors, earth moving, construction and locomotive segments
Source: Networth Research, Financial Figures as on FY12
Amtek Auto (AAL) Sales Rs76.2bn / PAT Rs5.82bn (con)
Sales Rs24.5bn / PAT Rs 2.91bn (SA)(Market Cap- Rs 15.95 bn)
Overseas Subsidiries
Alliance Hydro Power (AHPL) Start up: Yet to start business
Smith Jones Inc USA (SJI)Insignificant financials
Amtek Investments Inc US(AIUSL) No operations
Amtek Crankshaft (ACL) Sales Rs 5.7bn / PAT Rs 0.37bn
Ahmednagar Forging (AFL)
Sales Rs 12.2bn / PAT Rs 1.2bn (Market Cap- Rs 4.77 bn)
Amtek Transportation System (ATSL)
Sales Rs 21mn / PAT (Rs 38mn)
Amtek Investments (UK) (AIUKL) Sales Rs 6.54bn / PAT Rs 0.46bn
Amtek Deutschand GbMHGermany (ADG)
Sales Rs 3.5bn / PAT Rs 0.13bn
Amtek Defence Tech. (ADTL) Start up: Yet to start business
Amtek Ring Gears (ARGL) Sales Rs 5.5bn / PAT Rs 0.32bn
Amtek India (AIL) Sales Rs 18.8bn / PAT Rs 1.56bn
(Market Cap- Rs 26.78 bn)
62%
97%
55%
100%
100%
100%
100%
100%
100%
100%
100%
Indian Subsidiries
Amtek ARI Railcar Industries Ltd(spl railcar)
Amertec Systems Pvt. Ltd. (Defense Electronics products)
50%
74%
JV
JV
Company
Background
Exhibit:4 Organization Structure (part-1)
Annual Capacity:
Iron & Aluminum
Casting & Forging:
645,000MT
Machining:
92-million units
Amtek Auto Ltd: Initiating Coverage (Buy) Turbo-charged for next up-cycle around
[email protected] Strictly Confidential: Only for internal circulation 7
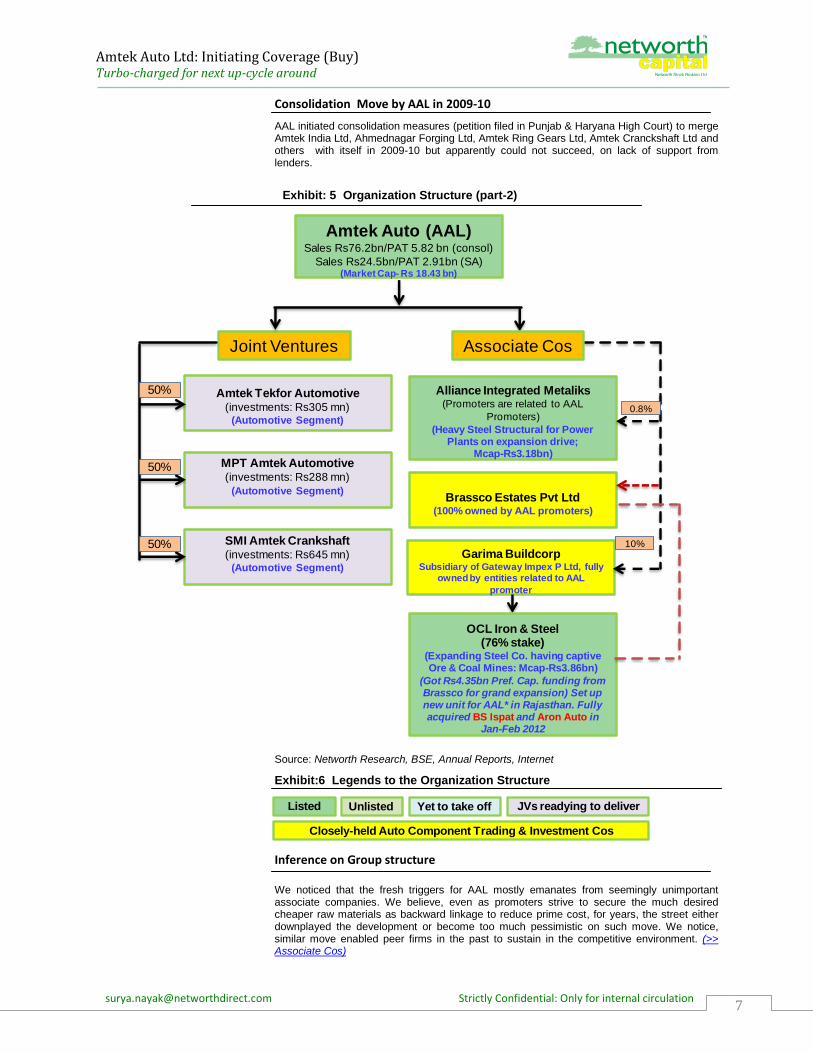
Consolidation Move by AAL in 2009-10
AAL initiated consolidation measures (petition filed in Punjab & Haryana High Court) to merge Amtek India Ltd, Ahmednagar Forging Ltd, Amtek Ring Gears Ltd, Amtek Cranckshaft Ltd and others with itself in 2009-10 but apparently could not succeed, on lack of support from lenders.
Source: Networth Research, BSE, Annual Reports, Internet
Exhibit:6 Legends to the Organization Structure
Inference on Group structure
We noticed that the fresh triggers for AAL mostly emanates from seemingly unimportant associate companies. We believe, even as promoters strive to secure the much desired cheaper raw materials as backward linkage to reduce prime cost, for years, the street either downplayed the development or become too much pessimistic on such move. We notice, similar move enabled peer firms in the past to sustain in the competitive environment. (>> Associate Cos)
Amtek Tekfor Automotive (investments: Rs305 mn)
(Automotive Segment)
Joint Ventures
MPT Amtek Automotive (investments: Rs288 mn)
(Automotive Segment)
SMI Amtek Crankshaft(investments: Rs645 mn)
(Automotive Segment)
Garima BuildcorpSubsidiary of Gateway Impex P Ltd, fully
owned by entities related to AAL
promoter
Brassco Estates Pvt Ltd(100% owned by AAL promoters)
Alliance Integrated Metaliks(Promoters are related to AAL
Promoters)
(Heavy Steel Structural for Power Plants on expansion drive;
Mcap-Rs3.18bn)
OCL Iron & Steel(76% stake)
(Expanding Steel Co. having captive Ore & Coal Mines: Mcap-Rs3.86bn)
(Got Rs4.35bn Pref. Cap. funding from Brassco for grand expansion) Set up new unit for AAL* in Rajasthan. Fully acquired BS Ispat and Aron Auto in
Jan-Feb 2012
Associate Cos
Amtek Auto (AAL) Sales Rs76.2bn/PAT 5.82 bn (consol)
Sales Rs24.5bn/PAT 2.91bn (SA)(Market Cap- Rs 18.43 bn)
0.8%
10%50%
50%
50%
UnlistedListed Yet to take off JVs readying to deliver
Closely-held Auto Component Trading & Investment Cos
Exhibit: 5 Organization Structure (part-2)

Amtek Auto Ltd: Initiating Coverage (Buy) Turbo-charged for next up-cycle around
[email protected] Strictly Confidential: Only for internal circulation 8
Income and Net Income Mix of Standalone and Subsidiaries Note: Non-automotive segment constitutes, Tractors, Railway Wagons, Locomotive
Components, Specialty Vehicles, Construction & Earth Moving Equipments & Aerospace Components ; FY12 data not available Source: Networth Research, Company
Exhibit:8 Net Income Mix (%) (FY12)
32.2
24.6
16.0
7.27.4
8.64.6
-0.6
Passenger Vehicles
45%
Light-Heavy CVs
16%
2/3 Wheelers
14%
Non-Auto25%
Amtek India Ltd17%
Ahmednagar Forging
11%
Amtek Ring Gears Ltd
5%
Amtek Crankshafts Ltd
7%
Amtek Investments
(UK) 8%
Amtek Deutschland
GmbH2%
Amtek Auto SA50%
Exhibit:7 Income Mix (%) of Amtek Auto Ltd (SA) and subsidiaries (FY12)
Exhibit: 9 Revenue-mix by segment (FY11)
Domestic : Overseas Sales
87:13

Amtek Auto Ltd: Initiating Coverage (Buy) Turbo-charged for next up-cycle around
[email protected] Strictly Confidential: Only for internal circulation 9
Industry Trend
As per Auto-Component Industry body ACMA, the size of the industry was pegged at USD43.5bn in FY12. Further, as per its estimate the size of the same would grow 2.6x over next 8 years at a CAGR of 11.2%. Figures are in USD bn (Source: ACMA)
26.5 2330.1
39.9 43.5
66.3
113
FY8 FY09 FY10 FY11 FY12 FY16e FY21e
CAGR @ 13% (FY07-12)
CAGR @ 11% (FY12-21e)
FY
3.8 4.00 3.45.2
6.8
12.3
29.0
6.2 6.8 6.58.5
10.6
17.5
35.0
-2.4 -2.8 -3.1 -3.30 -3.8 -5.2 -6.0
FY8 FY09 FY10 FY11 FY12 FY16e FY21e
Export Imports Net Export
Exhibit: 11 EXIM trend: sustained scope of export and import substitution
Import
CAGR @ 11% (FY07-11)
CAGR @14% (FY12-21e)
Export
CAGR @ 16% (FY07-12)
CAGR @ 17.5% (FY12-21e)
Net Export
CAGR @ 5.21% (FY12-21e)
Europe36%
North America
23%
Asia28%
Africa7%
South America
5%Australia1%
Export Destinations
Asia56%
Europe35%
North America
7%
South America
0.63%Africa0.48%
Australia0.21%
Import Sources
Auto-Component
Industry: Past trend
& Future Outlook
Exhibit: 10 Indian Auto Comp. Industry Size and Future Estimates
Exhibit: 12 EXIM trade movements across continents

Amtek Auto Ltd: Initiating Coverage (Buy) Turbo-charged for next up-cycle around
[email protected] Strictly Confidential: Only for internal circulation 10
Near Term (2013) Automobile Sectoral Outlook: Temporary Flux
Stable Outlook for 2013:
We expect muted volume growth in the passenger vehicle (PV) and negative volume growth in commercial vehicle (CV) segments to continue in FY14e till improvement in macro-economic situations are visible. PV volumes are expected to perk up post budget and transmission of monetary measures by banks, adopted by RBI of late in Jan-end. We see much of the pre-December‟12 deferment demand on diesel price stalemate to translate post budget. Also, we expect, the Centre to pare excise duty in sub-C segment PVs to boost demand.
LCVs to drive CV volumes:
We envisage overall growth in CVs to be 10%-11% in FY14e, driven by the light commercial vehicle (LCVs) segment which is expected to post volume growth of ~15-20% YoY. The projected LCV volume growth rate is lower than the growth rate of ~26% posted in the Apr-Dec‟12 period, with the moderation attributed to the likely increase in diesel prices.
Fiscal, Monetary Policies to Drive MHCVs:
The sales of medium and heavy CVs (MHCVs) would critically hinge on monetary and fiscal policy changes in FY14e if any. A continuation of industrial activity at the current level is likely to lead to negative growth of 6%-9% in MHCV domestic volumes. However, we believe policies conducive to capital/Infra investment in the Budget, could possibly drive MHCV sales
volumes up by 3%-4% in FY14e. Also, annulment of mining ban in key mineral rich states
possibly in 2HFY14e, could revive MHCV demand as well. LCV demand as such would be higher in medium to long-term on structural issues. (India: LCV: MHCV Ratio ~4 vs 2 in developed markets)
Utility Vehicles continue to propel PV Growth:
We expect domestic PV volumes to grow 8%-9% YoY in 2013. Utility vehicles (UVs) with projected growth of 30%-35% would be the driver for overall PV volumes on the backdrop of 38% growth registered during Apr-Dec‟12 period. The growth moderation could be on diesel price hike. However, general election could propel sales growth in UVs as political circles buy generally for poll campaigning. However, cars and vans are likely to display lower growth rates of around 3-4%.
Capacity Build-up by OEMs to persist in spite of slowdown:
From industry sources we note that, production capacity in PVs and CVs to grow by ~15% and 3%, respectively, in FY14e. Capacity additions in PVs would be prompted by the need to protect market share and for building a large production base for exports.
Govt’s move to diesel price rationalization may not matter much in long run
Diesel variants of small cars are priced 20%-25% higher than their petrol counterparts and that of mid-sized cars are priced 15%-20% higher. Thus, it makes economic sense for buyers to opt for diesel cars so long as the price differential between the two fuels is substantial, exceeding Rs20/l. However, we believe, if fuel price differential to reduce going forward, it may not impact the higher echelon consumers preferring diesel for its superior performance, but initially some resistance to come from low end consumers, which may shift to petrol variants, thus keeping the overall demand intact. Also, we notice, consumers are preferring hybrid vehicles (petrol + CNG) which at the moment economic than Diesel variants too.
2-3 Wheeler demand stable
Due to depressed rural income on lower than average Kharif agricultural output, along with insignificant MSP (minimum support price) hike in different crops by Centre, demand for 2-wheelers has affected, but the situation could improve in FY14e. Three wheeler demands have been more or less mirrors that of 2-wheelers.
Tractor Demand currently subdued would pick up momentum in FY14e
Only 5% of agricultural households own tractors and given the govt‟s focus on improving agricultural production to alleviate the rural economy, we believe tractor demand will be boosted by shortage of farm labor, rising cost of labor and livestocks, the need to raise crop yields and increase in non-agricultural purposes (construction etc) (~25% of total demand).
Automobile Industry
Demand Outlook:
Short & Long Term

Amtek Auto Ltd: Initiating Coverage (Buy) Turbo-charged for next up-cycle around
[email protected] Strictly Confidential: Only for internal circulation 11
18392357
2983 3124
5100
9700
FY09 FY10 FY11 FY12 FY16e FY21e
417568
761912
1420
2350
FY09 FY10 FY11 FY12 FY16e FY21e
891711132
1417616330
20974
30231
FY09 FY10 FY11 FY12 FY16e FY21e
420
545640
710
1000
FY10 FY11 FY12 FY16e FY21e
40 48 54
100
180
FY10 FY11 FY12 FY16e FY21e
Passenger Vehicles CAGR @ 14%
(FY08-12);CAGR @ 13% (FY12-21e)
Comm. Vehicles CAGR @ 11.5%
FY08-12; CAGR @ 11% (FY12-21e)
2/3 Wheelers CAGR @ 16% (FY08-
12), CAGR @ 7% (FY12-21e)
Tractors CAGR @ 23% (FY10-12);
CAGR @ 5% (FY12-21e)
Construction Vehicles: CAGR @ 16%
(FY10-12) CAGR@14% (FY12-21e)
Exhibit:14 Long-term Projections by OEM Industry body SIAM
Exhibit:13 Vehicle Production Past Trend and FY13 projections by SIAM in Jan13
(Figures in „000) Source: SIAM
Category (Fig '000) FY06 FY07 FY08 FY09 FY10 FY11 FY12 FY13*
Passenger Vehicles 1,309 1,545 1,778 1,839 2,357 2,983 3,124
YoY Growth 18.0% 15.0% 3.4% 28.2% 26.5% 4.7% 7-10%
Commercial Vehicles 391 520 549 417 568 761 912
YoY Growth 33.0% 5.6% -24.1% 36.1% 34.0% 19.8% 0-2%
Three Wheelers 434 556 501 497 619 800 878
YoY Growth 28.0% -10.0% -0.7% 24.6% 29.1% 9.8% 3-5%
Two Wheelers 7,609 8,467 8,027 8,420 10,513 13,349 15,454
YoY Growth 11.3% -5.2% 4.9% 24.9% 27.0% 15.8% 4-7%
Grand Total 9,744 11,088 10,854 11,172 14,057 17,892 20,366
YoY Growth 13.8% -2.1% 2.9% 25.8% 27.3% 13.8% 3-5%

Amtek Auto Ltd: Initiating Coverage (Buy) Turbo-charged for next up-cycle around
[email protected] Strictly Confidential: Only for internal circulation 12
Key Assumption for Growth We envisage near-term moderate de-growth (7%) in revenue for the group on current slump state in demand. However, we visualize growth to recover from 2HFY14e onwards on monetary policy stimulus and government‟s reform measures alleviating the economy, which could revive the crucial mining/infra sectors. Revival in mining sector on annulment of ban on mining that exists now on Apex Court directive over three crucial mineral rich States of Odisha, Karnataka and Goa, would resuscitate MHCV segment, which currently witnessing tepid demand. We assume 15% growth for FY14e and 20% in FY15e. Note that our projections are conservative on the backdrop of 48% & 36% growth in revenue in FY12 and FY11 respectively. We expect raw material prices to be soft to stable over medium term. And power cost to rise moderately YoY. Elongated sector slowdown could be most potential downside risk to our estimates.
Source: Networth Research
50,333
74,388 72,901
83,653
100,384
12,26918,467 18,808 21,123
25,447
2,595 5,819 5,239 7,100 9,601
FY11 FY12 FY13e FY14e FY15e
Income EBIDTA Net Income
24.4% 24.8% 25.8% 25.3% 25.4%
5.2%7.8% 7.2%
8.5%9.6%
FY11 FY12 FY13e FY14e FY15e
EBIDTA % Net Income %
CAGR: Income @ 10.5%,
EBIDTA @ 11% &
Net Income @ 18%
over FY12-15e
36% 48%
-2%
15%20%
35%
51%
2%12%
20%
8%
124%
-9.97%
36% 35%
FY11 FY12 FY13e FY14e FY15e
Income (core) EBIDTA Net Income
Amtek Auto Ltd
(Consolidated)
Financial Review &
Outlook
Exhibit: 15 Inc & Net Inc (cons) to grow at 13% & 31% CAGR over FY12-15e
Exhibit: 17 Profit margins to progressively improve
Exhibit: 16 Growth in Income, EBIDTA, Net Inc -- Past trend & Future est.

Amtek Auto Ltd: Initiating Coverage (Buy) Turbo-charged for next up-cycle around
[email protected] Strictly Confidential: Only for internal circulation 13
Figs are in Days; DIO-Days Inventory O/s ; DSO: Days Sales o/s; DPO-Days Payable o/s *Cost of Debt : excl-FCCB of $200mn raised in 2012 by subsidiary Amtek india Ltd, but gearing is inclusive of FCCBs
8.8%
10.1%
9.5%
10.7%
12.9%
5.0%
9.7%
8.1%
10.1%
12.2%
2.5%
4.4% 3.7%
4.9%
6.4%
FY11 FY12 FY13e FY14e FY15e
RoCE RoE RoA
113 110 110 110 110
69 72 74 70 68
-31 -27 -30 -30 -35
151 155 154 150143
FY11 FY12 FY13e FY14e FY15e
DIO DSO DPO CCC
1.081.33
1.10 0.990.82
3.062.61 2.71
3.39
4.75
4.52%
7.36% 7.75%7.25%
7.00%
0.00%
1.00%
2.00%
3.00%
4.00%
5.00%
6.00%
7.00%
8.00%
9.00%
0.00
0.50
1.00
1.50
2.00
2.50
3.00
3.50
4.00
4.50
5.00
FY11 FY12 FY13e FY14e FY15e
Debt/Equity (x) Interest Coverage (x) Cost of Debt* --->
Exhibit: 19 Cash Conversion Cycle (CCC) to improve
Exhibit: 18 Climbing Return Ratios
Exhibit: 20 Comfortable Gearing Level

Amtek Auto Ltd: Initiating Coverage (Buy) Turbo-charged for next up-cycle around
[email protected] Strictly Confidential: Only for internal circulation 14
Exhibit: 23 Cash Flow Summary // Amtek Auto Ltd (Consolidated)
Exhibit: 22 Balance Sheet // Amtek Auto Ltd (Consolidated)
Exhibit: 21 Income Statement Summary // Amtek Auto Ltd (Consol) (June-ending)
Summary // Amtek Auto Ltd (Consolidated) Particulars (Rs mn) FY11 FY12 FY13e FY14e FY15e
Income 50,333 74,388 72,901 83,653 100,384
COGS 36,538 53,697 51,905 60,021 71,875
Gross Profit 13,795 20,692 20,995 23,632 28,509
EBIDTA 12,269 18,467 18,808 21,123 25,447
EBIT 8,659 13,192 13,040 15,052 19,004
Other Income 786 1,834 729 1,673 2,008
Pre-Tax Income 4,751 9,742 8,956 12,281 17,012
Tax Expenses 1,525 2,768 2,552 3,561 5,104
Net Income 2,595 5,819 5,239 7,100 9,601
Particulars (Rs mn) FY11 FY12 FY13e FY14e FY15e
Share Capital 466 441 442 446 446
Reserve & Surplus 57,545 61,316 66,388 73,294 82,701
Networth 58,012 61,757 66,830 73,740 83,147
Minority Interest 10,144 11,152 12,317 13,936 16,243
Loans 62,918 82,286 73,749 72,956 68,431
Others LT Libilites & Prov 6,398 6,378 6,378 6,378 6,378
Sources of Funds 137,471 161,573 159,273 167,010 174,200
Net Block 84,476 96,087 96,765 97,807 98,577
Other Assets 7,903 24,232 24,232 24,232 24,232
Inventories 14,508 17,845 15,913 16,866 19,875
Receivables 12,623 16,723 14,931 15,012 17,143
Cash & Cash Eq 13,896 12,153 12,970 18,891 21,894
Other Current Assetss 12,537 17,510 17,510 17,510 17,510
Accounts Payble 3,693 4,302 4,340 4,600 6,324
Other Current Liabilites 4,844 18,734 18,767 18,767 18,767
Uses of Funds 137,471 161,573 159,273 167,010 174,200
Particulars (Rs mn) FY11 FY12 FY13e FY14e FY15e
Pre-Tax Income 4,751 9,742 8,956 12,281 17,012
Change in Cur/Non Cur Assets & Liab 5,802 8,733 9,853 8,847 8,435
WC Changes -12,707 -3,669 3,796 -774 -3,416
Tax & Others 1,585 -1,063 -1,823 -1,888 -3,096
Net cash from operating activities -569 13,742 20,782 18,464 18,935
Free Cash Flow -37,696 -345 14,334 11,352 11,721
Addition to fixed assets -37,127 -14,088 -6,448 -7,112 -7,214
Others 5,299 -14,290 0 0 0
Net Cash from Investing activities -31,828 -28,377 -6,448 -7,112 -7,214
Proceeds from new borrowings (net) 33,878 21,919 -8,537 -792 -4,525
Financial Charges Paid -4,637 -4,908 -4,813 -4,445 -3,999
Dividend & Dividend Tax -292 -399 -167 -195 -195
Others 9,096 -3,721 0 0 0
Net Cash from financing activities 38,045 12,892 -13,517 -5,432 -8,718
Net cash flows during the year 5,649 -1,743 818 5,921 3,003
Opening Cash & Cash Eq 8,247 13,896 12,153 12,970 18,891
Closing Cash & Cash Eq 13,896 12,153 12,970 18,891 21,894

Amtek Auto Ltd: Initiating Coverage (Buy) Turbo-charged for next up-cycle around
[email protected] Strictly Confidential: Only for internal circulation 15
Source: Networth Research
Exhibit:24 Ratios //Amtek Auto Ltd (Consolidated)
Exhibit:26 DuPont Analysis
Exhibit:25 Common-size Analaysis and Other Ratios
Ratios FY11 FY12 FY13e FY14e FY15e
EPS (Rs) 11.13 26.38 23.72 31.81 43.02
RoCE 8.8% 10.1% 9.5% 10.7% 12.9%
RoE 5.0% 9.7% 8.1% 10.1% 12.2%
RoA 2.5% 4.4% 3.7% 4.9% 6.4%
Debt: Equity (x) 1.08 1.33 1.10 0.99 0.82
Debt/Assets (x) 0.46 0.51 0.46 0.44 0.39
Proprietary Ratio 54.2% 49.1% 53.7% 56.3% 60.7%
Days Inventory O/s (Days) 113.0 110.0 110 110 110
Days Sales O/s (Days) 69 72 74 70 68
Days Payable O/s (Days) -31 -27 -30 -30 -35
Cash Conversion Cycle (Days) 151 155 154 150 143
Fixed Asset Turnover (x) 0.92 0.88 0.76 0.86 1.03
Total Asset Turnover (x) 0.46 0.51 0.46 0.52 0.60
Working Capital Turnover (x) 1.42 1.70 1.81 1.98 2.06
Particulars FY11 FY12 FY13e FY14e FY15e
RMC 60.2% 60.4% 59.0% 59.0% 58.8%
Power & Fuel 2.6% 2.7% 3.0% 3.2% 3.2%
Consumables 1.7% 2.0% 1.9% 1.9% 1.9%
Other Mfg Expenses 0.7% 0.8% 0.8% 0.8% 0.8%
Personnel Expenses 7.4% 6.4% 6.5% 6.9% 7.0%
COGS 72.6% 72.2% 71.2% 71.8% 71.6%
Gross Profit 27.4% 27.8% 28.8% 28.3% 28.4%
SG & A Expenses 3.0% 3.0% 3.0% 3.0% 3.1%
EBIDTA 24.4% 24.8% 25.8% 25.3% 25.4%
Depreciation 7.2% 7.1% 7.9% 7.3% 6.4%
EBIT 17.2% 17.7% 17.9% 18.0% 18.9%
Financial Cost 5.6% 6.8% 6.6% 5.3% 4.0%
Pre-tax profit before Other Inc 11.6% 10.9% 11.3% 12.7% 14.9%
Other Income 1.6% 2.5% 1.0% 2.0% 2.0%
Pre-tax profit before Extra Ord Inc 13.1% 13.4% 12.3% 14.7% 16.9%
Exceptional Items 3.7% 0.3% 0.0% 0.0% 0.0%
Pre-tax Profit 9.4% 13.1% 12.3% 14.7% 16.9%
Tax Expenses 3.0% 3.7% 3.5% 4.3% 5.1%
PAT 6.4% 9.4% 8.8% 10.4% 11.9%
Minority Int 1.3% 1.6% 1.7% 1.7% 1.7%
Net Profit 5.2% 7.8% 7.2% 8.5% 9.6%
Other Inc / Pre Tax Income 13.5% 22.5% 8.9% 15.8% 13.4%
Effective taxation 32.1% 28.4% 28.5% 29.0% 30.0%
Particulars FY11 FY12 FY13e FY14e FY15e
NPM% 5.1% 7.6% 7.1% 8.3% 9.4%
Asset TO (x) 0.46 0.51 0.46 0.52 0.60
Equity Multiplier (x) 2.15 2.50 2.50 2.32 2.17
RoE (%) 5.0% 9.7% 8.1% 10.1% 12.2%

Amtek Auto Ltd: Initiating Coverage (Buy) Turbo-charged for next up-cycle around
[email protected] Strictly Confidential: Only for internal circulation 16
Source: Networth Research
Exhibit:27 Amtek Auto Ltd (Standalone) Financial Summary
Income Summary (Rs mn) FY11 FY12 FY13e FY14e FY15e
Income 19,132 23,107 21,720 24,761 29,218
EBIDTA 6,023 6,639 6,755 7,924 9,700
Net Income 818 2,916 2,265 3,237 4,420
Balance Sheet Summary FY11 FY12 FY13e FY14e FY15e
Networth 42,657 43,833 45,980 49,078 53,307
Loans 32,679 34,999 33,878 27,444 25,320
Sources of Funds 78,171 81,996 83,022 79,686 81,791
Net Block 34,605 43,642 44,909 45,937 46,801
Other Assets 20,811 29,396 29,396 29,396 29,396
Current Assets 24,364 23,129 22,669 18,687 20,103
Curr Liabilities 1,609 14,171 13,951 14,332 14,509
Uses of Funds 78,171 81,996 83,022 79,686 81,791
Key Ratios & othes stats FY11 FY12 FY13e FY14e FY15e
EPS (Rs) 3.51 13.22 10.25 14.50 19.81
RoCE 8.4% 8.3% 7.9% 10.3% 13.6%
RoE 2.0% 6.7% 5.0% 6.8% 8.6%
RoA 1.2% 3.8% 2.9% 4.1% 5.7%
Debt: Eq (x) 0.77 0.80 0.74 0.56 0.47
Particulars (Rs mn) FY11 FY12 FY13e FY14e FY15e
Profit Before Tax 1,330 4,098 3,190 4,624 6,315
Cash From Operating Activities 1,640 13,548 7,788 7,641 7,632
Free Cash Flow -2,338 5,323 4,146 4,059 4,039
Net Cash From Investing Activities -6,015 -15,073 -3,642 -3,582 -3,593
Net Cash From Financing Activities 5,976 -3,714 -3,081 -8,065 -3,849
Net Inc/(Dec) in cash or cash eq 1,601 -5,239 1,065 -4,006 190
Opening Cash and cash equivalents 6,784 8,386 3,147 4,211 205
Closing Cash and cash equivalents 8,386 3,147 4,211 205 395
Exhibit:28 Amtek Auto Ltd (Standalone) Cash Flow summary

Amtek Auto Ltd: Initiating Coverage (Buy) Turbo-charged for next up-cycle around
[email protected] Strictly Confidential: Only for internal circulation 17
We value the Company on relative methodology of applying Price Earning Multiples (PEMs) to the respective net income estimates of each of the performing subsidiaries to arrive at equity value of each entity. We have considered the JV investments at book value. We have applied 40% holding company discount. However, we note that, since, control of the parent over subsidiaries have been substantial, the discount should have been lower. To get a range of equity valuation we have considered two extremes one for Base Case and the other one for Bull Case. Even for Base Case scenario, the applied PEM of 5x is 1/3
rd of the comparable
peer company‟s (in terms of manufacturing scale & financials etc) valuation (15x Bharat Forge Standalone on FY12 earnings) For conservative assessment, we have considered the least of the two valuations scenario, and arrived at per share value for our price objective. .
Exhibit:30 Valuation Summary (Based on FY14e earnings estimates)
Sl No Entities FY14e
Net
Income
Base
Case
PEM1
(x)
Bull
Case
PEM2
(x)
Eq.
Value
(Base
Case)
Eq.
Value
(Bull
Case)
Degree
of
Control
Net Eq
Value
(Base
Case)
Net Eq
Value
(Bull
Case)
1 Amtek Auto Ltd (Standalone) 3,237 5 8 16,183 25,892 16,183 25,892
Subsidiaries
2 Amtek India Ltd 2,237 5 8 11,185 17,896 61.64% 6,895 11,031
3 Ahmednagar Forging Ltd 1,592 5 8 7,962 12,740 54.96% 4,376 7,002
4 Amtek Ring Gears Ltd 345 5 8 1,724 2,759 96.63% 1,666 2,666
5 Amtek Crackshafts Ltd 425 5 8 2,125 3,400 92.50% 1,966 3,145
6 Amtek Inv UK Ltd 744 5 8 3,721 5,953 100.0% 3,721 5,953
7 Amtek Deutchland GmbH 118 5 8 590 944 100.0% 590 944
8 Subs Valuation _sum(2:7) 19,214 30,742
JV s
9 Amtek Tekfor 430 430
10 MPT Amtek Automotive 220 220
11 SMI Amtek Crankshaft 738 738
12 JV valuation at BV (9+10+11) 1,387 1,387
13 Gross Val of Subs & JVs(8+12) 20,601 32,129
14 Holding Co. Discount (40%) (8,240) (12,852)
15 Net Subs & JV Valuation(13+14) 12,361 19,277
16 Total Equity Valuation (1+15) 28,543 45,170
17 Per share Value (Rs) 129 205
Valuation
Methodology &
Recommendation
2.0 X
Base Case 5.0 X
Bull Case 8.0 X
11.0 X
14.0 X
0
50
100
150
200
250
300
350
400
450
500
550
600
650
Jul-
07
Jan
-08
Jul-
08
Jan
-09
Jul-
09
Jan
-10
Jul-
10
Jan
-11
Jul-
11
Jan
-12
Jul-
12
Jan
-13
Jul-
13
PR
ICE
Ruling P/E range slipped below 5, which was holding
above it (5) even during last recession in 2009
Exhibit:29 P/E Bands (AAL Consol) and Stock Price Movement: Past 6-yrs

Amtek Auto Ltd: Initiating Coverage (Buy) Turbo-charged for next up-cycle around
[email protected] Strictly Confidential: Only for internal circulation 18
Source: Networth Research Source: Networth Research, Company & Annual Reports
Note:
Bharat Forge Ltd (BFL) categorizes 99.5% of its consolidated revenue as “Forging”.
BFL‟s standalone entity accounted for 58% & 88% of consolidated core income and net income respectively as on FY12.
Machining portion in case of BFL stood at 44% & 39% respectively for FY12 &
FY11, whereas for AAL its 51% for FY11 (FY12 data not available). AAL capacity consists of Forging & Casting (Steel-95% & Aluminum-5%)
BFL‟s (consolidated) capex during FY06-12 stood at Rs44.37bn whereas Amtek
Auto Ltd‟s (consolidated) over the same period remained Rs109.6bn (~2.5x)
Annual Capacity of other companies in the industry (as per FY11 & FY12 Annual
Reports) Mahindra Forging 85,000mtpa, MM Forging 40,000mtpa, Ramakrishna Forging 35,000mtpa
Exhibit:32 Inter-firm Comparison (FY12 Financials)
Sl No Entities FY15e
Net
Income
Base
Case
PEM1
(x)
Bull
Case
PEM2
(x)
Eq.
Value
(Base
Case)
Eq.
Value
(Bull
Case)
Degree
of
Control
Net Eq
Value
(Base
Case)
Net Eq
Value
(Bull
Case)
1 Amtek Auto Ltd (Standalone) 4,420 5 8 22,102 35,363 22,102 35,363
Subsidiaries
2 Amtek India Ltd 3,295 5 8 16,475 26,360 61.64% 10,155 16,249
3 Ahmednagar Forging Ltd 2,204 5 8 11,019 17,631 54.96% 6,056 9,690
4 Amtek Ring Gears Ltd 404 5 8 2,018 3,228 96.63% 1,950 3,119
5 Amtek Crackshafts Ltd 497 5 8 2,486 3,978 92.50% 2,300 3,680
6 Amtek Inv UK Ltd 967 5 8 4,837 7,739 100.00% 4,837 7,739
7 Amtek Deutchland GmbH 136 5 8 678 1,086 100.00% 678 1,086
8 Subs Valuation _sum(2:7) 25,976 41,562
JV s
9 Amtek Tekfor 430 430
10 MPT Amtek Automotive 220 220
11 SMI Amtek Crankshaft 738 738
12 JV valuation at BV (9+10+11) 1,387 1,387
13 Gross Val of Subs & JVs(8+12) 27,364 42,950
14 Holding Co. Discount (40%) (10,946) (17,180)
15 Net Subs & JV Valuation(13+14) 16,418 25,770
16 Total Equity Valuation (1+15) 38,520 61,133
17 Per share Value (Rs) 175 277
Company Capacity
(mtpa)
Income
(Rs mn)
EBIDTA
(Rs mn)
Net
Inc
(Rs
mn)
EBIDTA Net Inc
Margin
RoCE RoE EV/
EBIDTA
(X)
P/E
(X)
Bharat Forge Ltd (Consol) 750,000 62,791 9,961 4,130 15.9% 6.6% 16.8% 19.9% 6.99 12.63
Amtek Auto Ltd (Consol) 645,000 74,388 18,467 5,819 24.8% 7.8% 10.1% 9.7% 4.68 2.81
Exhibit :31 Valuation Summary Based on FY15e earnings estimates

Amtek Auto Ltd: Initiating Coverage (Buy) Turbo-charged for next up-cycle around
[email protected] Strictly Confidential: Only for internal circulation 19
Focus on higher value addition led to high capex in recent past, crimped RoE, RoCE in the interim We noticed that AAL‟s huge Capex plans in last few years depressed the Asset Turnover parameters, (off 45% from peak in FY07). However, the Company is now capacitated with generating 2.5X current turnover in future without any incremental capex (Bharat Forge FY12 Asset Turnover stood at 1.37x). The Company‟s focus to introduce more value added products through higher machining can be attributed to massive capex, which is behind us. With pricing power intact, the return parameters (RoE & RoCE) are set to improve once the auto sector down-cycle reverses and asset turnover bettered. The raw material linkage, (as discussed earlier) would render it flexibility in strategizing improving volume (asset turnover) and simultaneously expanding margins.
Conclusion & Recommendation
We firmly believe that, such high valuation discount to mean is not untenable for a leading company in the industry, having sustained pricing power and ability to move up in value chain. In due course, the valuation should revert back to mean. We recommend “Buy” in the stock, for rich appreciation in long-term, as in the short-term prices are expected to be tempered on prevailing slowdown in the domestic auto sector, which is likely to look up from 2HFY14 on improvement in macro-economic environment and replacement cycle of MHCVs to kick in once the prevailing mining issues are sorted out.
Financials & Price Movements : Disconnect is visible, not warranted for years We observed that the stock is incessantly underperforming the broader market indices for last 6 years, marked by high degree of volatility despite bettering its financials barring FY09 due to auto-sector recession, the year which it saw along with broad market, massive price capitulation. We found that partly, the sell-off by bankrupt Lehman Brothers‟ in 2008-09, could be one of the reasons for massive correction in stock prices on that year. We notice too that 90% price fall in that year, is devoid of huge volume actions. In spite of price meltdown, key PE investors and other Funds reposed confidence on fundamental and have stayed put. (>> Fund Holding) We provide other Auto-component stalwarts’ performances for comparison with AAL, although barring BFL, the other two firms’ operational metrics are incomparable with AAL.
Stock Performance
vs. Financials
(Past 6 yrs)
Outlook &
Recommendation
Nifty +95.47%
Amtek Auto Ltd(- 76%)
Exhibit:33 Amtek Auto Ltd vs Nifty -- Last 7years’ Price Performance: Sustained Underperformance

Amtek Auto Ltd: Initiating Coverage (Buy) Turbo-charged for next up-cycle around
[email protected] Strictly Confidential: Only for internal circulation 20
Amtek
Auto Ltd
(cons)
FY08 & FY09
marked by auto-
sector recession
Particulars (Fig Rs mn) FY06 FY07 FY08 FY09 FY10 FY11 FY12 CAGR---7yrs
Income 26,451 37,206 46,568 34,386 36,908 51,119 76,222 19.3%
YoY Change 40.7% 25.2% -26.2% 7.3% 38.5% 49.1%
EBIDTA 5,105 8,059 9,599 7,005 9,077 12,269 18,467 23.9%
YoY Change 57.9% 19.1% -27.0% 29.6% 35.2% 50.5%
Net Profit 2,564 4,085 4,274 1,728 2,405 2,595 5,819 14.6%
YoY Change 59.3% 4.6% -59.6% 39.2% 7.9% 124.3%
Key Common-size Stats
COGS 75.9% 74.2% 73.9% 71.0% 71.2% 72.6% 72.2%
Gross Profit 24.1% 25.8% 26.1% 29.0% 28.8% 27.4% 27.8%
SG & A Expenses 4.8% 4.1% 5.5% 8.7% 4.2% 3.0% 3.0%
Depreciation 4.0% 3.9% 4.5% 7.9% 8.4% 7.2% 7.1%
Networth 16,292 21,604 30,213 32,486 46,152 58,012 61,316 24.7%
Net Block 15,684 28,004 40,351 49,080 54,462 84,476 96,087 35.3%
YoY Change 78.5% 44.1% 21.6% 11.0% 55.1% 13.7%
Asset Turnover 0.67 0.92 0.90 0.51 0.46 0.46 0.51
Net Income Margin 9.7% 11.0% 9.2% 5.0% 6.5% 5.1% 7.6%
Equity Multiplier 2.42 2.14 1.99 2.16 2.04 2.15 2.50
RoE 15.7% 21.6% 16.5% 5.5% 6.1% 5.0% 9.7%
Bharat
Forge Ltd
(Consol)
(Auto Forging,
Machining,
Allied Industrial
Products
Particulars (Fig Rs mn) FY06 FY07 FY08 FY09 FY10 FY11 FY12 CAGR---7yrs
Income 30,850 42,752 47,516 48,425 33,787 51,544 63,684 12.8%
YoY Change 39% 11% 2% -30% 53% 24%
Net Income 2,505 2,906 3,015 583 -634 2,902 4,130 8.7%
YoY Change 16% 4% -81% PL -558% 42%
Networth 12,655 14,898 16,541 16,669 14,630 19,529 21,902 9.6%
YoY Change 18% 11% 1% -12% 33% 12%
RoE 19.8% 19.5% 18.2% 3.5% -4.3% 14.9% 18.9%
DuPont Analysis (FY12)
Asset Turnover 1.26
Net Income Margin 6.6%
Equity Multiplier 2.28
CMP 219.00
P/E (FY12 EPS based) 12.35
Mother-
son Sumi
Systems
Ltd (consl)
(Wiring
Harnesses,
Mirror,Plastic
components)
Particulars (Fig Rs mn) FY06 FY07 FY08 FY09 FY10* FY11 FY12 CAGR---7yrs
Income 10,440 15,481 20,792 27,566 70,353 84,178 149,211 55.8%
YoY Change 48% 34% 33% 155% 20% 77%
Net Income 1,071 1,295 1,779 1,763 2,428 3,908 2,596 15.9%
YoY Change 21% 37% -1% 38% 61% -34%
Networth 2,939 3,796 5,359 7,831 11,649 16,087 18,713 36.1%
YoY Change 29% 41% 46% 49% 38% 16%
RoE 36.4% 34.1% 33.2% 22.5% 20.8% 24.3% 13.9%
DuPont Analysis (FY12)
Asset Turnover 2.16
Net Income Margin 1.7%
Equity Multiplier 3.70
CMP 191.05
P/E (TTM EPS based) 35.30
Particulars (Fig Rs mn) CY05 CY06 CY07 CY08 CY09 CY10 CY11 CAGR-7yrs
Income 29,775 37,837 42,796 45,416 47,498 66,305 79,725 17.8%
YoY Change 27.9% 27.1% 13.1% 6.1% 4.6% 39.6% 20.2%
Net Income 3,431 5,480 6,092 6,339 5,906 8,589 11,226 21.8%
YoY Change -8.5% 59.7% 11.2% 4.1% -6.8% 45.4% 30.7%
Networth 15,528 20,420 25,634 30,955 33,852 40,980 47,284 20.4%
YoY Change 23.8% 31.5% 25.5% 20.8% 9.4% 21.1% 15.4%
RoE 22.1% 26.8% 23.8% 20.5% 17.4% 21.0% 23.7%
Du-Pont Analysis (CY11)
Asset Turnover 1.58
Net Income Margin 14.1%
Equity Multiplier 1.06
CMP 9000.00
P/E (TTM EPS based) 26.48
Bosch Ltd
(Auto Fuel
Injection
Systems, Auto
Electrical &
Electronic,
Power tooling
systems)
Exhibit:34 Financial Review 7-years - Amtek Auto Ltd (cons) & Other Ind. Stalwarts

Amtek Auto Ltd: Initiating Coverage (Buy) Turbo-charged for next up-cycle around
[email protected] Strictly Confidential: Only for internal circulation 21
Source: Capitaline
Growth Outlook
We infer from past growth trends and recent trend-reversal in sequential income growth
trajectory of Amtek Group (listed) firms that, the sagging growth could last for 1-2 more
quarters before making a recovery. The recent expansionary monetary stance of RBI & Union
Budget 2014 could have 1-quarter lag effect of pushing the consumer demand. We believe,
auto sector down-cycle is about to tapering off and Amtek Auto Ltd (Standalone & Indian
subsidiaries) could finish FY13e (June ending) with flat to marginal de-growth, with rebound in
demand from middle of FY14e (Sept‟13 onwards). However, its UK subsidiary would continue
to perform well through FY13e on robust sales growth in JLR and D, E & F segment cars.
Exhibit 35: Quarterly Income Trend // YoY & QoQ: Last 40 quarters // Down-cycle tapering off
-25%
-20%
-15%
-10%
-5%
0%
5%
10%
15%
20%
25%
30%
3Q
03
1Q
04
3Q
04
1Q
05
3Q
05
1Q
06
3Q
06
1Q
07
3Q
07
1Q
08
3Q
08
1Q
09
3Q
09
1Q
10
3Q
10
1Q
11
3Q
11
1Q
12
3Q
12
1Q
13
-30%
-25%
-20%
-15%
-10%
-5%
0%
5%
10%
15%
20%
25%
3Q
03
1Q
04
3Q
04
1Q
05
3Q
05
1Q
06
3Q
06
1Q
07
3Q
07
1Q
08
3Q
08
1Q
09
3Q
09
1Q
10
3Q
10
1Q
11
3Q
11
1Q
12
3Q
12
1Q
13
-30%
-20%
-10%
0%
10%
20%
30%
40%
50%
1Q
04
3Q
04
1Q
05
3Q
05
1Q
06
3Q
06
1Q
07
3Q
07
1Q
08
3Q
08
1Q
09
3Q
09
1Q
10
3Q
10
1Q
11
3Q
11
1Q
12
3Q
12
1Q
13
-40%
-30%
-20%
-10%
0%
10%
20%
30%
40%
50%
60%
70%
80%1Q
04
3Q
04
1Q
05
3Q
05
1Q
06
3Q
06
1Q
07
3Q
07
1Q
08
3Q
08
1Q
09
3Q
09
1Q
10
3Q
10
1Q
11
3Q
11
1Q
12
3Q
12
1Q
13
-30%
-20%
-10%
0%
10%
20%
30%
40%
50%
3Q
03
1Q
04
3Q
04
1Q
05
3Q
05
1Q
06
3Q
06
1Q
07
3Q
07
1Q
08
3Q
08
1Q
09
3Q
09
1Q
10
3Q
10
1Q
11
3Q
11
1Q
12
3Q
12
1Q
13
-60%
-40%
-20%
0%
20%
40%
60%
80%
100%
120%
1Q
04
3Q
04
1Q
05
3Q
05
1Q
06
3Q
06
1Q
07
3Q
07
1Q
08
3Q
08
1Q
09
3Q
09
1Q
10
3Q
10
1Q
11
3Q
11
1Q
12
3Q
12
1Q
13
AMTEK AUTO LTD (Standalone) (QoQ Growth)
3QFY03 to 1QFY13
AMTEK INDIA LTD (QoQ growth) 3QFY03-1QFY13
AMTEK INDIA LTD (YoY growth) 1QFY04-1QFY13
AMTEK AUTO LTD (Standalone)(YoY Growth) 1QFY04
to 1QFY13
AHMEDNAGAR FORGING (YoY Growth)
1QFY04 to 1QFY13
AHMEDNAGAR FORGING (QoQ Growth)
3QFY03 to 1QFY13

Amtek Auto Ltd: Initiating Coverage (Buy) Turbo-charged for next up-cycle around
[email protected] Strictly Confidential: Only for internal circulation 22
S1. Amtek India Ltd (AIL) AIL is the largest iron casting Company in India with 5 world class manufacturing facilities. The Company has significant expertise in the auto components space with proven capabilities in vertical and horizontal moulding foundry, machining and assembly. It has an extensive product portfolio with a range of highly engineered components including cylinder head, cylinder blocks and turbo charger housing. The Company is a major supplier to OEMs for passenger cars (PC), L& HCVs and tractors, in the casting segment; and PCs, L& HCVs, 2/3 wheelers and tractors in the machining segment. The Company now services a global client base. It is well positioned in the Indian auto component market. It is one of the largest manufacturers of cylinder blocks in India and the only Indian casting Company to use latest “Thin Wall” technology. The Company remains focused on improving operational productivity and implementing quality excellence programs such as lean Six Sigma across the manufacturing facilities.
Raised $200mn FCCB in FY12 for acquisition & Capex The Company has issued in FY12 in two tranches (Apr & Sept) 5yr tenor FCCBs worth $200mn (6%-$130mn, 2%-$70mn) having conversion clause @ Rs103.005/sh. The proceeds are aimed at two acquisitions (one Indian & another overseas),expansion of capacity for casting components for non-auto sectors and increasing machining capacity.
Source: Networth Research
Exhibit: 36 Financial Trends & Projections (Amtek India Ltd)
Annexure -I
Subsidiaries
At a glance
Income Summary (Figs Rs mn) FY11 FY12 FY13e FY14e FY15e
Income 14,285 18,746 17,433 20,048 24,058
EBIDTA 3,917 5,521 5,343 6,446 7,939
Net Income 1,138 1,563 1,485 2,237 3,295
Balance Sheet Summary FY11 FY12 FY13e FY14e FY15eEquity Capital 277 554 554 554 554
Networth 18,701 20,168 21,620 23,793 26,959
Loans 18,879 28,077 31,599 31,307 30,540
Sources of Funds 39,177 50,372 55,347 57,228 59,627
Net Block 26,260 27,516 28,188 27,641 27,258
Other Assets 1,248 7,028 7,027 7,027 7,027
Current Assets 13,895 19,008 23,300 25,777 28,752
Curr Liabilities 2,226 3,180 3,169 3,217 3,411
Uses of Funds 39,177 50,372 55,347 57,228 59,627
Key Ratios & othes stats FY11 FY12 FY13e FY14e FY15eEPS (Rs) 8.23 5.65 5.36 8.08 11.91
RoCE 7.3% 10.3% 8.4% 9.8% 12.2%
RoE 6.5% 8.0% 7.1% 9.9% 13.0%
RoA 3.1% 3.6% 2.9% 4.1% 5.9%
Debt: Eq (x) 1.01 1.39 1.46 1.32 1.13
Cash Flow Summary FY11 FY12 FY13e FY14e FY15e
Profit Before Tax 1,627 2,257 2,152 3,242 4,775
Cash From Operating Activities 1,964 2,472 4,101 4,330 4,664
Free Cash Flow -2,502 323 1,866 3,261 3,375
Net Cash From Investing Activities -2,102 -8,632 -2,235 -1,069 -1,289
Net Cash From Financing Activities -869 7,725 3,549 -784 -1,561
Net Inc/(Dec) in cash or cash eq -1,007 1,565 5,415 2,477 1,813
Opening Cash and cash equivalents 5,092 4,085 5,650 11,065 13,542
Closing Cash and cash equivalents 4,085 5,650 11,065 13,542 15,356

Amtek Auto Ltd: Initiating Coverage (Buy) Turbo-charged for next up-cycle around
[email protected] Strictly Confidential: Only for internal circulation 23
S2. Ahmednagar Forging Ltd (AFL) Amtek Auto acquired AFL in order to establish a manufacturing business in Western India, as there were number of automotive companies which were being supplied by AFL in that region. In FY02 the acquisition was consummated @Rs34.50/sh.
Business Overview AFL is one of the largest forging companies in India with world class manufacturing facilities. It has an extensive product portfolio with a range of highly engineered components including camshafts, connecting rods, crankshaft, crown wheel pinion and front axle beam. The Company supplies components for passenger cars, light and heavy commercial vehicles, 2/3 wheelers and tractors. It also manufactures components for non-auto industry such as the
railways and specialty vehicles.
Source: Networth Research
Exhibit: 37 Financial Trends & Projections (Ahmednagar Forging Ltd)
Income Summary (Figs Rs mn) FY11 FY12 FY13e FY14e FY15eIncome 9,352 12,140 11,412 13,010 15,612
EBIDTA 2,454 2,931 2,933 3,435 4,309
Net Income 1,082 1,209 1,237 1,592 2,204
Balance Sheet Summary FY11 FY12 FY13e FY14e FY15eEquity Capital 368 368 368 368 368
Networth 6,217 7,383 8,577 10,084 12,160
Loans 4,829 6,446 5,231 4,624 3,837
Sources of Funds 12,182 15,023 14,883 15,782 17,071
Net Block 9,513 10,133 10,504 11,165 12,221
Other Assets 29 921 921 921 921
Current Assets 5,021 6,729 6,015 6,350 6,857
Curr Liabilities 2,381 2,761 2,557 2,653 2,928
Uses of Funds 12,182 15,023 14,883 15,782 17,071
Key Ratios & othes stats FY11 FY12 FY13e FY14e FY15eEPS (Rs) 29.43 32.89 33.66 43.33 59.97
RoCE 15.5% 15.9% 15.6% 19.0% 22.8%
RoE 18.9% 17.8% 15.5% 17.1% 19.8%
RoA 10.0% 9.7% 9.0% 11.2% 14.4%
Debt: Eq (x) 0.78 0.87 0.61 0.46 0.32
Cash Flow Summary FY11 FY12 FY13e FY14e FY15eProfit Before Tax 1,523 1,714 1,767 2,275 3,148
Cash From Operating Activities 1,948 620 2,612 2,921 2,887
Free Cash Flow 840 -396 1,602 1,566 1,056
Net Cash From Investing Activities -1,106 -1,227 -1,010 -1,356 -1,831
Net Cash From Financing Activities -844 883 -1,771 -1,134 -1,265
Net Inc/(Dec) in cash or cash eq -2 275 -169 431 -209
Opening Cash and cash equivalents 471 468 744 574 1,006
Closing Cash and cash equivalents 468 744 574 1,006 797
Amtek Auto Ltd: Initiating Coverage (Buy) Turbo-charged for next up-cycle around
[email protected] Strictly Confidential: Only for internal circulation 24
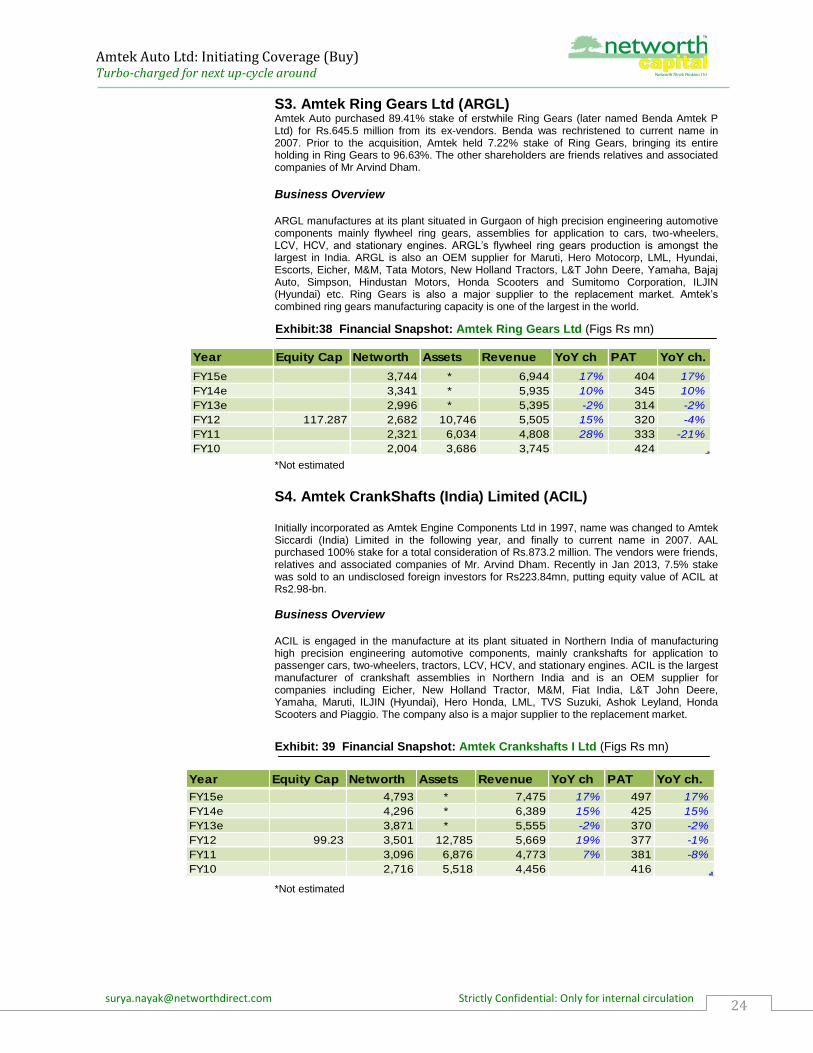
S3. Amtek Ring Gears Ltd (ARGL) Amtek Auto purchased 89.41% stake of erstwhile Ring Gears (later named Benda Amtek P Ltd) for Rs.645.5 million from its ex-vendors. Benda was rechristened to current name in 2007. Prior to the acquisition, Amtek held 7.22% stake of Ring Gears, bringing its entire holding in Ring Gears to 96.63%. The other shareholders are friends relatives and associated companies of Mr Arvind Dham. Business Overview ARGL manufactures at its plant situated in Gurgaon of high precision engineering automotive components mainly flywheel ring gears, assemblies for application to cars, two-wheelers, LCV, HCV, and stationary engines. ARGL‟s flywheel ring gears production is amongst the largest in India. ARGL is also an OEM supplier for Maruti, Hero Motocorp, LML, Hyundai, Escorts, Eicher, M&M, Tata Motors, New Holland Tractors, L&T John Deere, Yamaha, Bajaj Auto, Simpson, Hindustan Motors, Honda Scooters and Sumitomo Corporation, ILJIN (Hyundai) etc. Ring Gears is also a major supplier to the replacement market. Amtek‟s combined ring gears manufacturing capacity is one of the largest in the world.
*Not estimated
S4. Amtek CrankShafts (India) Limited (ACIL) Initially incorporated as Amtek Engine Components Ltd in 1997, name was changed to Amtek Siccardi (India) Limited in the following year, and finally to current name in 2007. AAL purchased 100% stake for a total consideration of Rs.873.2 million. The vendors were friends, relatives and associated companies of Mr. Arvind Dham. Recently in Jan 2013, 7.5% stake was sold to an undisclosed foreign investors for Rs223.84mn, putting equity value of ACIL at Rs2.98-bn.
Business Overview ACIL is engaged in the manufacture at its plant situated in Northern India of manufacturing high precision engineering automotive components, mainly crankshafts for application to passenger cars, two-wheelers, tractors, LCV, HCV, and stationary engines. ACIL is the largest manufacturer of crankshaft assemblies in Northern India and is an OEM supplier for companies including Eicher, New Holland Tractor, M&M, Fiat India, L&T John Deere, Yamaha, Maruti, ILJIN (Hyundai), Hero Honda, LML, TVS Suzuki, Ashok Leyland, Honda Scooters and Piaggio. The company also is a major supplier to the replacement market.
*Not estimated
Year Equity Cap Networth Assets Revenue YoY ch PAT YoY ch.
FY15e 4,793 * 7,475 17% 497 17%
FY14e 4,296 * 6,389 15% 425 15%
FY13e 3,871 * 5,555 -2% 370 -2%
FY12 99.23 3,501 12,785 5,669 19% 377 -1%
FY11 3,096 6,876 4,773 7% 381 -8%
FY10 2,716 5,518 4,456 416
Exhibit: 39 Financial Snapshot: Amtek Crankshafts I Ltd (Figs Rs mn)
Exhibit:38 Financial Snapshot: Amtek Ring Gears Ltd (Figs Rs mn)
Year Equity Cap Networth Assets Revenue YoY ch PAT YoY ch.
FY15e 3,744 * 6,944 17% 404 17%
FY14e 3,341 * 5,935 10% 345 10%
FY13e 2,996 * 5,395 -2% 314 -2%
FY12 117.287 2,682 10,746 5,505 15% 320 -4%
FY11 2,321 6,034 4,808 28% 333 -21%
FY10 2,004 3,686 3,745 424

Amtek Auto Ltd: Initiating Coverage (Buy) Turbo-charged for next up-cycle around
[email protected] Strictly Confidential: Only for internal circulation 25
S5. Amtek Investments (UK) Limited The UK operations of AAL are held through its WOS Amtek Investments (UK) Ltd. The 85% holding in GWK was acquired by Amtek Crankshafts India Limited on 24 Oct 2003 (the “Initial Acquisition”) through its then WOS, Amtek UK for a consideration of £13.25-mn. Amtek Crankshafts subsequently sold Amtek UK to AAL on 24 June 2004 for £5.0-mn (the “Subsequent Acquisition”). During January 2006, the Company invested £ 0.74-mn in Amtek UK to further acquire 3.40% equity stake in GWK. AAL bought the remaining stake of 11.60% in GWK in July 2006, for a consideration of £ 2.3 million.
Business Overview
The GWK Group is a Tier-1 company involved in the assembly and machining of components for the automotive industry. The GWK Group buys in aluminum and cast iron castings, and machines them to a pre-defined specification. It also undertakes a substantial amount of assembly work, where it buys in all or nearly all of the components for an automotive assembly, and assembles them. The group has two sites, one in Letchworth, Hertfordshire, and the other in Coventry.
*Not estimated
S6. Amtek Deutschland GmbH The German operations of AAL are held through its wholly-owned subsidiary (WOS) Amtek Deutschland GmbH, which in turn owns 70% stake of Zelter (http://www.zelter.de). The consideration for the acquisition was €3-mn.
Principal Terms of the Acquisition
Pursuant to the Zelter Purchase Agreement, Amtek Deutschland purchased 70% stake of Zelter. The majority of vendors under the Acquisition Agreement were a number of individuals, who were and continue to be part of the management team of Zelter. The acquisition was structured as a share purchase of 70 per cent. of the issued share capital of Zelter pursuant to the Acquisition Agreement with the remaining 30% to be sold to Amtek Auto on 15 April 2008.
Business Overview
Zelter is one of the three largest manufacturers of turbocharger housings in Germany and boasts a bluechip customer list which includes Ford, Audi, Volkswagen, BorgWarner, Honeywell, Hasenclever & Sohn, Dieckerhoff, Schubert & Sulzer, Visteon and MHI Equipment. It has global scale manufacturing capacities at its two facilities located in Cologne, Germany. Zelter is an established Tier-1 supplier to the automotive industry globally and is recognized as a leader in the turbocharger industry segment.
*Not estimated
Year Equity Cap Networth Assets Revenue YoY ch PAT YoY ch..
FY15e 5,980 * 13,820 30% 967 30%
FY14e 5,013 * 10,631 25% 744 25%
FY13e 4,268 * 8,505 30% 595 29%
FY12 1,665.78 3,673 8,898 6,542 34% 462 -2%
FY11 3,674 8,508 4,891 25% 474 2665%
FY10 3,200 8,096 3,926 17
Year Equity Cap Networth Assets Revenue YoY ch PAT YoY ch..
FY15e 1,054 * 4,523 15% 136 15%
FY14e 918 * 3,933 7% 118 7%
FY13e 800 * 3,676 5% 110 -12%
FY12 1.30 690 3,055 3,501 6% 125 -319%
FY11 492 2,074 3,299 -3% -57 -50%
FY10 549 2,215 3,418 -115
Exhibit: 41 Financial Snapshot: Amtek Deutschland GmbH (Figs Rs mn)
Exhibit: 40 Financial Snapshot: Amtek Investments (UK) Ltd (Figs Rs mn)

Amtek Auto Ltd: Initiating Coverage (Buy) Turbo-charged for next up-cycle around
[email protected] Strictly Confidential: Only for internal circulation 26
Associate Cos: Interesting Case of Supply Chain Management
AAL- Brassco Estates - OCL Iron & Steel Ltd connection
Brassco Estates Pvt Ltd, fully owned by AAL‟s core promoter Mr. Arvind Dham and family, had issued NCDs worth Rs4.35bn (Care Rating AA (SO)) on 3 Aug 2010 (Click Here) to subscribe to the 2%-Redeemable Non-Cumulative Preferential shares @ Rs100/share (FV Rs10) in OCL Iron & Steel Ltd (OCLISL), to enable it to leverage adequately and expand its core steel making business in Odisha besides setting up of auto-grade value added product facilities in Rajasthan.
OCLISL’s grand plan
OCLISL is having 120KTPA sponge iron facility at Rajgangpur, Odisha with 14MW captive power plant. Capacity utilisation stood at 96% (Prodn-106KTPA vs Capacity 120KTPA) in FY12 is set to rise further, with the addition of value added steel products, says the Annual Report of OCLISL. OCLISL produced 81.9KT of steel in FY12 and is setting up a 700KTPA greenfield integrated steel project at Sundergarh, Odisha (Click Here) OCLISL has set up recently, a 3-Station Cold Rolling (CR) mill at Chopanki, Rajasthan. This facility is loaded with imported machineries. Besides it is currently setting up another state-of-the art Casting Manufacturing Unit at 14 acre unit at Kaharani (Bhiwadi Extn), RIICO industrial Area, Rajasthan equipped with machineries and knowhow from globally reputed firms from Germany, China and India. OCLISL possess captive Iron Ore and Coal Mining (Click Here ).
OCLISL, in Jan‟12 also fully taken over Chandrapur (Maharashtra) based BS Ispat Ltd (BSIL) having capacity of 200TPD sponge iron and captive power plant though a SPV, Oriental Iron Casting Ltd in which OCLISL‟s equity investment stood at Rs1,985mn. BSIL is engaged in sponge iron manufacturing having captive coal mining (Click Here). Also, OCLISL has taken over Delhi based Aron Auto Ltd. Investment in the equity of Aron Auto stood at Rs0.5mn.
Arrangement to avert debt burden of AAL
OCLISL was bought by Garima Buildcorp (75% stake) (along with Gateway Impex P Ltd) from erstwhile promoters of OCL India Ltd @21/sh (FV Re1) (Click Here) in FY10. Garima Buildcorp is the subsidiary of Gateway Impex P Ltd, fully owned by entities related to AAL promoters. We believe, this arrangement is just to avert debt burden on AAL and (possibly) legal constraint of transfer of mining assets to other companies. The indications made in 2012 Annual Reports of AAL (page-35) and OCLISL (page-21) amply led us to believe that, OCLISL is most likely to supply raw materials to AAL group companies from its newly functional CR Mill facilities at Chopanki and upcoming casting unit at Rajasthan. BSIL acquisition is, we believe, is intended to supply steel to Western India facilities of Ahemednagar Forging Ltd (AFL). This we believe would prove a great value driver to AAL going forward.
Alliance Integrated Metaliks Ltd - AAL link
We understood from BSE Listed (last year listed, earlier listed in DSE) Delhi based Alliance Integrated Metaliks Ltd (AIML) (Click Here), whose website says of being promoted by an un-named $1.4bn automotive conglomerate (we believe it’s Amtek Auto Ltd ), currently engaged in large steel power plant structurals and Balance of Plants (BoP) for thermal power companies (capacity 100KTPA) aiming to cater to power developers in the North India belt (click for AIML// IM). We believe, AIML could also supply products to other JVs, particularly, American Railcar Industries in Punjab. Though AAL along with other two listed subsidiaries hold only 2.02% stake in AIML, the Board of AIML is replete with Directors of other Amtek Group Companies. AIML is currently controlled by WLD Investments (48.64%), who in 2008 bought ailing Rollatainers (see later) and turned around. AIML is currently expanding its operations at its 40 acre plant housing modern equipments.(Click Here) Both OCLISL and AIML are currently undertaking massive expansion plans by raising debt.
Source: Networth Research, BSE, SEBI, Odisha Govt Website, Internet
Exhibit:42 Long-term debt raising program of Associate Companies
Annexure -II
Associate
Companies
Hidden Triggers
Company (Fig in INR mn) FY11 FY12 % change
OCL Iron & Steel Ltd 3,100 14,097 355%
Alliance Integrated Metaliks 370 3,072 730%

Amtek Auto Ltd: Initiating Coverage (Buy) Turbo-charged for next up-cycle around
[email protected] Strictly Confidential: Only for internal circulation 27
Mr. Arvind Dham We understand from available information in the public domain that the track record of main promoter, 52 year old Mr. Arvind Dham, as a master strategist, entrepreneur having strong vision and turnaround skill. He, along with his team of specialists has demonstrated solid cases of implementing new projects and successful implementation of the same. He has also, successful track record of acquisition and integration, a prerequisite trait for auto-component industry, which would see lot of consolidation going ahead. His qualifications are B Arch, MBA. His wife Mrs Anita Dham, is also participating in management activities of group companies, having qualification of B Arch.
Other Key Management Personnel Mr John Ernest Flintham: A British citizen, Mr. Flintham is Senior Managing Director,
Amtek Auto Limited. He has HNB in Mech. Engineering from Technical College, Lincolin having more than 26 years experience in the field of Manufacturing in Automotive Components & Commercial Sales.
Mr. Deshpal Singh Malik: Mr Malik is Managing Director, Executive Director of Amtek
Auto Ltd. He is a Mechanical Engineer, from BITS Pilani and a Business management graduate. He has prior experience in Projects and Operations with companies like DCM, Piaggio, Eicher, Escorts.
Mr. Gautam Malhotra (34yr): Specialties in M&A, Strategy, Finance, General
Management, Operations, Supply Chain Management. Managing Director, Amtek India Limited. His Other Directorships include: Ahmednagar Forgings Limited, Alliance Integrated Metaliks Limited and W.L.D. Investment Pvt. Ltd. His qualifications are B.E. (Comp. Sc). MBA from Manchester Business School.
Mr. Vinod Kumar Uppal: VP, Finance & Accounts, Amtek Auto. A Commerce Graduate.
Mr. Santosh Singhi: CFO, He is a FCA.
Mr. Sowmya Narayanan Rajagopalan: CEO, MD, Ahmednagar Forging (AFL). He has
been a Whole Time Director for AFL since 2008. He is a Mechanical Engineer with a PG in Statistical & QC, O&R and PGDM. He has vast experience in the field of setting of new auto component projects, Marketing, Materials Management, production, quality control and R&D.
Key Non-executive Directors: Mr. Rajeev Thakur (62yr): A qualified marine engineer. He has Vast Experience in the
field of Management Consultancy.
Mr. KT James (56yr): (Amtek India) Vast experience in Accounts & Finance matters. A
MCom by qualification.
Mr. B Lugani (58yr): A CA, by qualification, but Financial and Management Consultant by
profession. He has 33 years experience in the field of Accounts, Finance, Management Consultancy, Income Tax, Setting up of new projects etc.
Mr. Raj Narain Bhardwaj (67yr): Ex Chairman LIC of India We present below two instances of turnaround, which goes to prove the able management capabilities of Team-AAL
Annexure -III
Key Management

Amtek Auto Ltd: Initiating Coverage (Buy) Turbo-charged for next up-cycle around
[email protected] Strictly Confidential: Only for internal circulation 28
Amtek has all along adopted inorganic growth strategy of growth, which has been met with reasonable success. We present two cases of wealth creation. We noticed that, these apart, all other acquisitions have been successful in terms of integration, growth. Also, we did not notice any labour unrest usually the scene in auto industry, observed in many a cases, including reputed ones.
Case 1: Ahmednagar Forging Ltd (AFL)
Amtek Auto bought controling stake from erstwhile promoters of AFL in 2002 @34.50/sh when it was in red with stagnating revenue and low profitability. Since, Management Buy-Out (MBO), Revenue and market capitalisation swelled 14x and 18x to-date respectively. (See Financial Review and projections)
Case 2: Rollatainers Ltd: out of the woods
Mr Dham backed WLD investments had acquired ailing packaging firm Rollatainers in 2007 for Rs90mn from CDR cell through a BIFR package. Through management change and financial backing the Company has in Nov 2012, came out of SICA. Market Capitalization then was mere Rs900mn, which swelled to the current level of Rs4,348 mn (4.8x rise). It‟s worth noting here that, in 1999 FMCG major ITC evinced interest buying out Rollatainers, but backed out on valuation disagreement.
Exhibit:44 Rollatainers price performance since management MBO
WLD
Investment
bought stake
from CDR Cell
on BIFR
Package for
Rs90mn
Annexure - IV
Promoters’ Track
Record
Exhibit: 43 Ahmednagar Forging Ltd, MBO - Then & Now
Item Particulars (Fig Rs mn) FY02 FY12 Change (x)
Income 848 12,184 14.4
Net Income -7.97 1,209 LP
Equity capital 80 368 4.6
Market Price /share 34.5 130
Market Capitalisation 276 4,778 17.3

Amtek Auto Ltd: Initiating Coverage (Buy) Turbo-charged for next up-cycle around
[email protected] Strictly Confidential: Only for internal circulation 29
Our inference on corporate governance : We inferred that all the ventures (in the public domain), undertaken apparently under the banner of Mr Dham, have met with reasonable success. They are primarily funded through bank (INR) borrowings and infusion of preference capital by entities seemingly under him. We further noticed from market circles that, deep pessimism has developed regarding management functioning (opacity) of AAL. We deciphered the reasons, and found that pessimism might have been developed over floating of many private companies by Mr Dham, and his stoic silence on such ventures. But, in comparison, we observed that peers in the industry has also have track record of floating myriad subsidiaries (in one instance even touching 75nos) yet enjoy good investor backing on management‟s media/investor activism. We believe, though AAL‟s performance is reasonably satisfactory, but lot of groundwork has to be made on the part of the management to allay apprehension of the investor community. We reiterate that robust, timely and effective Corporate Communication along with reporting standards has to improve drastically from the present level to quell such pessimism. Also, more investor friendly/rewarding measures, like minimum 20% dividend payout (rather buyback of shares) have to be considered to negate the investor-apathetic corporate behavior. We find the corporate presentations (should be quarterly rather than once a year) stereotypic (rather dynamic) lacking details on JV‟s performance and other facets of the business, befitting to the stature of a corporate belonging to larger broader indices such as CNX200, CNX Auto etc.
10 years’ Promoters’ Equity Contribution Trend Sounds Commitment To Growth We tracked the equity issuance history of the Company to core promoters, and ascertained that a cumulative amount of Rs10.13-bn has been infused by them for 39.4 mn aggregate shares of Rs2 each at an average price of Rs 257.22/share adjusting for past 1:1 bonus issue and 5:1 stock split. We observed that most of the times the funds were infused to supplement acquisition funding of AAL, which, we think goes to prove the commitment of the promoters for the growth cause of the Company.
*warrant money forfeited (Source: BSE)
Exhibit 45b : Promoters’ equity infusion track record in last decade
354
1,266
2,909
7,854
8,838
10,134
46
101
163
317 274
257
0
50
100
150
200
250
300
350
0
1,000
2,000
3,000
4,000
5,000
6,000
7,000
8,000
9,000
10,000
11,000
2002 2005 2006 2008 2010 2011
Cum Eq Infusion (Rs mn) Avg Cost /share (Rs) (RHS)--->
Date Issue # Shares FV
(Rs)
Isue
Price
(Rs)
Adj
Price
(Rs)
Cum.
Shares
Value
(Rs mn)
Cum.
Value
(Rs mn)
Avg
Rate
/p.s.
(Rs)
2/4/2002 Pref. Shares Allotment 770,000 10 460 230
12/12/2002 1:1 Bonus 1540000 10 0 0
13/09/2004 5:1 Split 7700000 2 0 46 7,700,000 354 354 46.00
28/02/2005 Pref. Shares Allotment 4,800,000 2 190 190 12,500,000 912 1,266 101.30
2/3/2006 Pref. Shares Allotment 5,300,000 2 310 310 17,800,000 1,643 2,909 163.44
15/01/2008 Pref. Shares Allotment 7,000,000 2 460 460 24,800,000 3,220 6,129 247.15
Warrant Money* 15,000,000 2 460 460 24,800,000 1,725 7,854 316.70
31/05/2010 Pref Warrant Conv 7,400,000 2 133 133 32,200,000 984 8,838 274.48
22/02/2011 Pref Warrant Conv 7,200,000 2 180 180 39,400,000 1,296 10,134 257.22
Exhibit: 45a Promoters’ equity infusion track record in last decade
Annexure -V
Observation on
Corporate
Governance
Effective Management
Communication needs
drastic improvement
from current level
BoD Composition (8)
Promoter Dir -13%
Executive Dir -13%
Non-exc Dir -12%
Ind Dir -62%

Amtek Auto Ltd: Initiating Coverage (Buy) Turbo-charged for next up-cycle around
[email protected] Strictly Confidential: Only for internal circulation 30
Note: Chrys Capital backed Warrol Ltd & Warbug Pincus are stakeholders since FY08 & FY06
respectively. CITI & HDFC MF are since FY04.Goldman Sachs-FY05, LIC - FY10, Copthall Mauritius- FY07. Swiss Finance Corp-FY08
Ramkrishna Forging Ltd Recently on 19 Jan 2013, International Finance Corporation (IFC) has subscribed to 2.15mn equity shares in peer group company Ramkrishna Forging Ltd, a relatively smaller player at Rs128 a share. Separately promoters too subscribed to 0.78mn shares at the same price and 3.08mn warrants at conversion price of Rs130 a share. Issue price implies discounting of 12.3x the TTM net income of Rs220mn on expanded equity capital.
Amtek Crankshaft Ltd Recently on 21 Jan 2013, Amtek Auto Ltd, divested 746,124 shares (FV Rs10) representing 7.5% of equity capital (Rs99.23mn) of Amtek Crankshaft Ltd to an undisclosed foreign investors at Rs300 per share, amounting an equity value of Rs2,977mn, which discounts 7.9x its FY12 (June ending) net income of Rs377mn.
Annexure – VII
Recent Equity Deals
in the Industry
Unit Plant Locations of Amtek Auto Ltd (excl. JVs, Asso. Cos, Intl. Subs)
1 16, Industrial Estate, Rozka Meo, Sohna, Distt.- Mewat, Haryana.
2 Bagumpur Khataula, P.O. - Khandsa, Distt.- Gurgaon, Haryana.
3 Vill.- Mohammadpur, Jharsa, Distt. - Gurgaon, Haryana.
4 Shed No. 1, 2, 3, 4 & 5, Village-Malpura, Dharuhera, Distt. - Rewari, Haryana.
5 Plot No. -1, Sector –II, New Industrial Area, Distt.- Raisen, Mandideep, MP
6 Plot No.- 1, Industrial Area, Dharuhera, Distt. - Rewari, Haryana
7 Plot No. - 53, Sector – III, Industrial Area, IMT Manesar, Gurgaon, Haryana
8 Gat No.- 1074-1085, Sanaswadi Shikrapur, Chakan Road, Taluka Shirpur, Pune, M'stra.
9 Dadi Bhola, Opposite Peer Sthan, Nalagarh, Distt. - Solan, Himachal Pradesh
10 Dadi Bhola, Opposite Peer Sthan, Nalagarh Unit 2, Distt. - Solan, Himachal Pradesh
11 B-6, MIDC Area, Ranjangaon, Pune, Maharashtra
12 Survey No.1, C-2, VR-5, Tata Nano Vendor Park, Sanand, Gujrat
13 Plot No.-73, Tata Nano Vendor Park, Distt.-Udham Singh Nagar, U'Khand
14 Narsingpur Road, Begampur Khautola, Gurgaon, Haryana
15 RNS-21, SPICOT Indl Growth Center, Sriperumbudur,Oragadam, Kencheepuram, TN
16 Gat No.-251, Telegaon, Chaken Road, Kharabwadi, Khed, Pune, Maharashtra.
17 Plot No. 1, Industrial Area, Dharuhera, Distt. - Rewari, Haryana
18 Gat No.1081/1 & 1079, Shikrapur Chakan Rd, Talegaon Dhamdhere, Sanaswadi, M'stra
19 Plot No. 191, Sector-4, Bawal, Distt. - Rewari, Haryana
20 Autoswift Division, GGN, Delhi, Gzb, Bhiwadi & Pune. Unit Plant Locations of Amtek India Ltd
1 Village Narsinghpur, Mohammadpur, Old Manesar Road, District Gurgaon, Haryana
2 SPA 1195, Phase-IV, RIICO Industrial Area,District Bhiwadi, (Rajasthan)
3 SPA 502, Phase-I, RIICO Industrial Area,District Bhiwadi, (Rajasthan)
4 Nalagarh, Distt. Solan (Himachal Pradesh)
Unit Plant Locations of Ahmednagar Forging Ltd
1 MIDC Area, Ahmednagar
2 Chakan, Dist. Pune
3 Kuruli, Dist. Pune
4 Nalagarh, Distt. Solan, Himachal Pradesh
Annexure – VIII
Plant Locations
(India)
Annexure – VI
Fund Holding Trend Source: BSE
Stable in recent years
Fund Holding (%) June'11 June'12 Sept'12 Dec'12
LIC of India 4.38 4.63 4.67 4.67
HDFC MF 1.21 1.28 1.29 1.29
Warrol Ltd 7.42 7.85 7.92 7.92
Warbug Pincus 5.18 5.48 5.53 5.53
Goldman Sachs 2.44 4.13 4.16 2.58
Mackenzie Cundill 2.63 3.54 3.57 3.57
CITI Group 3.07 3.25 3.27 3.27
Copthall Mauritus 2.85 3.02 3.04 3.04
Pineridge Investments 1.89 2.00 2.02 2.02
Feedbridge Equity 1.42 1.50 1.51 1.51
Swiss Finance Corp 1.19 1.12 1.13 1.13
India Fund Inc 1.99 1.61 - -
Religare Finvest - 1.07 - 1.03
Ndmr B V 1.67 - - -
BT Pension 1.41 - - -
Total 38.75 40.48 38.11 37.56

Amtek Auto Ltd: Initiating Coverage (Buy) Turbo-charged for next up-cycle around
[email protected] Strictly Confidential: Only for internal circulation 31
Product
Specialisation Area
Products
Iron Casting
(High Pressure & Gravity)
Cylinder Block & Head, Transmission Housings, Brake Carriers & Caliper,
Trumpet casings, Crankshafts, Intake and Exhaust Manifolds, Flywheels
& Flywheel Housings, Turbo Charger, Bell Housings, Linkshafts
Aluminium Die Casting
(High Pressure & Gravity)
Clutch Cases, Transmission cases, Timing Chain Covers, Mounting
Brackets, Camshaft Covers / Carriers, Bearing Ladders / Sumps,
Structural Covers, Differential Flange
Forging Connecting rods & Caps, Crankshafts & Camshafts, Steering Levers,
Gear shifter forks, Sector gears & shafts, Front Impact Beams Drive
Shafts, Spindlers, Hubs & Flanges, Transmission Components, Steering
Parts, Pistons, Propeller Fork Shafts, Stub – Axle, Front Axle Beam,
Front & Rear Axle Shaft
Machining Steering Knuckles, Ladder frames, Engine bearing ladders, Exhaust
manifolds, Aluminium Case Housings, Bridge Fork Assemblies, Hubs,
Spindles, Connecting Rods, Crankshaft, Housings, Gear Shifter Forks,
Front Axle Beam Assembly, Crankshaft Assembly, Conrod Piston Sub
Assembly, Pivot Arms, Flywheel Housing & Assembly, Wheel Hubs, PTO
Casing, Front & Rear Axle
Ring Gears Starter Ring Gear, Flex plate Assemblies (2 Piece), Flywheel Assemblies,
Conrod Piston Sub Assembly
Machining
Annexure – IX
Product Profile
Illustrative Product
Applications (not
exhaustive) >> Products

Amtek Auto Ltd: Initiating Coverage (Buy) Turbo-charged for next up-cycle around
[email protected] Strictly Confidential: Only for internal circulation 32
Annexure: X
Clientele

Amtek Auto Ltd: Initiating Coverage (Buy) Turbo-charged for next up-cycle around
[email protected] Strictly Confidential: Only for internal circulation 33
JV with Sumitomo Metal, Japan for advanced cranckshaft AAL forged a 50:50 JV with Sumitomo Metal, Japan, one of the largest crankshaft manufacturers of the world. The plant is located in Daruhera, Haryana, with an initial capacity of 0.8-mn units, which was scheduled to have been increased to 2.2mn units by Nov 2012 ( >>click) at an additional investment of Rs1-bn. Sumitomo Metals, Sumitomo Corporation, and Amtek started up a 4,000-ton press line in April 2010. The No. 1 forging line as per Sumitomo sources, expected to reach full production capacity in the second half of 2012. Hence the JV had decided to install a second forging line to meet rising demand. The No. 2 forging line that was scheduled to be installed will introduce Sumitomo Metals' latest crankshaft forging technologies such as high speed and automation. Through the JV Sumitomo aspires to have 10% global share in crankshaft. The finance details of the JV are not available. JV with American Railcar Inc, US AAL through its wholly owned subsidiary Amtek Transportation System, has forged a 50:50 JV with Nasdaq listed Amerian Railcar Inc (American Railcar JV) in the style of Amtek Railcar Industries Private Limited which will manufacture railcar products from a new facility located in Sarai Banjara, Fatehgarh Sahib, Punjab. The JV aims to provide railcars to a wide spectrum of users to carry commodities such as oil, chemicals, grain, food, iron ore fine slurry, Cement clinkers and aggregates. The JV has been audited by the Indian Railways to manufacture railcars in India. During 2011 the JV was selected by the Indian Railways Research Designs and Standards Organization to design and build four different higher axle load carrying freight railcars for the Indian market. Furthermore, this should enable it to provide the Indian railcar marketplace with the newest and most sought after products. The JV has produced in Jan 2012 the first prototype of railway wagons which has been accepted by the Indian Railways. Indian Railways is undergoing an extensive upgrade of the rail infrastructure (DFC noted below) to increase volume by increasing train speeds, reducing dwell times and increasing the carrying capacity of their railcar fleet. The railcars will be the first to be certified for the 25t and 32.5t heavy axle load service. We expect with the advent of railcars, several key industries are set to adopt cost-effective railway transport systems shunning road cargo. We envisage better prospects for railcars in the long-term.
Picture : Specialized rail-cars (Source: American Railcar Industries Inc, JV Partner)
Annexure – XI
Notable JVs

Amtek Auto Ltd: Initiating Coverage (Buy) Turbo-charged for next up-cycle around
[email protected] Strictly Confidential: Only for internal circulation 34
Disclaimer
Analyst: Surya Narayan Nayak, AVP Research,
Phone: +91 932497204, 022-22836307, 30772468
Institution Sales : [email protected] , 022-3064-1741, 1742, 1727,1771
Networth Research: E-mail- [email protected]
022-30225902
Key to NETWORTH Investment Rankings
Buy: Upside by>15, Accumulate: Upside by +5 to 15, Hold: Upside/Downside by -5 to +5, Reduce:
Downside by 5 to 15, Sell: Downside by>15
Disclaimer: This document has been prepared by Networth Stock Broking Ltd. (NSBL). NSBL is a full service, integrated investment
banking, portfolio management and brokerage group. Our research analysts and sales persons provide important input into our
investment banking activities. This document does not constitute an offer or solicitation for the purchase or sale of any financial
instrument or as an official confirmation of any transaction. The information contained herein is from publicly available data or other
sources believed to be reliable, but we do not represent that it is accurate or complete and it should not be relied on as such. NSBL or
any of its affiliates shall not be in any way responsible for any loss or damage that may arise to any person from any inadvertent error
in the information contained in this report. This document is provided for assistance only and is not intended to be and must not alone
be taken as the basis for an investment decision. The user assumes the entire risk of any use made of this information. Each recipient
of this document should make such investigation as it deems necessary to arrive at an independent evaluation of an investment in the
securities of companies referred to in this document (including the merits and risks involved), and should consult his own advisors to
determine the merits and risks of such investment. The investment discussed or views expressed may not be suitable for all investors.
We and our affiliates, officers, directors, and employees may: (a) from time to time, have long or short positions in, and buy or sell the
securities thereof, of company (ies) mentioned herein or (b) be engaged in any other transaction involving such securities and earn
brokerage or other compensation or act as advisor or lender / borrower to such company (ies) or have other potential conflict of
interest with respect to any recommendation and related information and opinions. This information is strictly confidential and is being
furnished to you solely for your information. This information should not be reproduced or redistributed or passed on directly or
indirectly in any form to any other person or published, copied, in whole or in part, for any purpose. This report is not directed or
intended for distribution to, or use by, any person or entity who is a citizen or resident of or located in any locality, state, country or
other jurisdiction, where such distribution, publication, availability or use would be contrary to law, regulation or which would subject
NSBL and affiliates to any registration or licensing requirements within such jurisdiction. The distribution of this document in certain
jurisdictions may be restricted by law, and persons in whose possession this document comes, should inform themselves about and
observe, any such restrictions. The information given in this document is as of the date of this report and there can be no assurance
that future results or events will be consistent with this information. This information is subject to change without any prior notice.
NSBL reserves the right to make modifications and alterations to this statement as may be required from time to time. However, NSBL
is under no obligation to update or keep the information current. Nevertheless, NSBL is committed to providing independent and
transparent recommendation to its client and would be happy to provide any information in response to specific client queries. Neither
NSBL nor any of its affiliates, directors, employees, agents or representatives shall be liable for any damages whether direct, indirect,
special or consequential including lost revenue or lost profits that may arise from or in connection with the use of the information. The
analyst for this report certifies that all of the views expressed in this report accurately reflect his or her personal views about the
subject company or companies and its or their securities, and no part of his or her compensation was, is or will be, directly or indirectly
related to specific recommendations or views expressed in this report. Analyst holding in stock: no.