Initial Management of Septic Patients with … · partment and all subsequent measurements during...
9
CLINICAL RESEARCH STUDY Initial Management of Septic Patients with Hyperglycemia in the Noncritical Care Inpatient Setting Philipp Schuetz, MD, a Maura Kennedy, MD, a Jason M. Lucas, MD, MPH, a Michael D. Howell, MD, MPH, b William C. Aird, MD, c Donald M. Yealy, MD, d Nathan I. Shapiro, MD, MPH a,c a Department of Emergency Medicine, Beth Israel Deaconess Medical Center, Boston, Mass; b Silverman Institute for Healthcare Quality and Safety (Pulmonary and Critical Care Division), Beth Israel Deaconess Medical Center, Boston, Mass; c Center for Vascular Biology Research, Boston, Mass; d Department of Emergency Medicine, University of Pittsburgh School of Medicine, Pittsburgh, Pa. ABSTRACT BACKGROUND: Previous research on the management of hyperglycemia in patients with sepsis has focused primarily on those with established organ failure in the critical care setting. The impact of hyperglycemia and glycemic control in patients with infection before developing severe sepsis or shock remains undefined. METHODS: This observational, prospective, cohort study investigated the relationship between initial 72-hour time-weighted mean glucose concentrations and in-hospital mortality, intensive care unit transfer, and hospital length of stay in a cohort of patients with an acute infection who were admitted from the emergency department to a non-intensive care unit hospital ward. We used multivariate regression models adjusted for age, diabetes, and disease severity. RESULTS: A total of 1849 patients were included, of whom 29% had diabetes. In the 1310 nondiabetic patients, we observed hyperglycemia using time-weighted glucose concentrations: 121 to 150 mg/dL (n 204, 16%), 151 to 180 mg/dL (n 32, 2.4%), and greater than 180 mg/dL (n 21, 1.6%). Insulin treatment was infrequent in nondiabetic patients, with 9%, 13%, and 29% of nondiabetic patients in these ranges receiving insulin, respectively. As patient glucose values increased, in-hospital mortality increased in nondiabetic patients, with odds ratios (ORs) of 4.4 (95% confidence interval [CI], 1.8-11), 10.0 (95% CI, 2.5-40), and 9.3 (95% CI, 1.9-44.0). Conversely, hyperglycemia did not confer an increased risk of adverse outcomes in diabetic patients. Likewise, increased risk for unplanned intensive care unit admission from the floor demonstrated ORs of 2.2 (95% CI, 1.1-4.3), 2.0 (95% CI, 0.45-8.9), and 6.3 (95% CI, 1.9-20.6) in nondiabetic patients, whereas no increased risk was found in diabetic patients. CONCLUSIONS: In this cohort of acutely infected patients without established severe sepsis or shock, higher glucose concentrations within the first 72 hours in the nondiabetic population were associated with worse hospital outcomes and were less likely to be treated with insulin compared with diabetic patients. © 2012 Elsevier Inc. All rights reserved. • The American Journal of Medicine (2012) 125, 670-678 KEYWORDS: Diabetes; Hyperglycemia; Sepsis; Severe sepsis; Noncritical care Recent randomized controlled trials performed in the inten- sive care unit setting have assessed the efficacy of impact of preventing or treating hyperglycemia compared with toler- ating hyperglycemia. 1-4 Although these studies have pro- duced mixed results, most experts agree that pending further research, targeting moderate glucose values in the range of 140 to 180 mg/dL is the best method to optimize the short term. 5 However, these studies were performed in intensive care unit populations, in whom illness is established and often more severe, but the effect of hyperglycemia in a broader group of infected hospitalized patients remains unan- swered. The optimal glucose ranges and risk/benefit of insulin Funding: Dr Schuetz was supported by a research grant from the Swiss Foundation for Grants in Biology and Medicine (Schweizerische Stiftung für medizinisch-biologische Stipendien, SSMBS, PASMP3-127684/1). Dr Shapiro was supported in part byNational Institutes of Health GrantsHL- 091757 and GM-076659. Conflict of Interest: None. Authorship: All authors had access to the data and played a role in writing this manuscript. Requests for reprints should be addressed to Philipp Schuetz, MD, Department of Emergency Medicine, Beth Israel Deaconess Medical Cen- ter, 1 Deaconess Road, CC2-W, Boston, MA 02215. E-mail address: [email protected] 0002-9343/$ -see front matter © 2012 Elsevier Inc. All rights reserved. http://dx.doi.org/10.1016/j.amjmed.2012.03.001
-
Upload
truongmien -
Category
Documents
-
view
219 -
download
0
Transcript of Initial Management of Septic Patients with … · partment and all subsequent measurements during...

B
CLINICAL RESEARCH STUDY
Initial Management of Septic Patients withHyperglycemia in the Noncritical Care Inpatient SettingPhilipp Schuetz, MD,a Maura Kennedy, MD,a Jason M. Lucas, MD, MPH,a Michael D. Howell, MD, MPH,b
William C. Aird, MD,c Donald M. Yealy, MD,d Nathan I. Shapiro, MD, MPHa,c
aDepartment of Emergency Medicine, Beth Israel Deaconess Medical Center, Boston, Mass; bSilverman Institute for Healthcare Qualityand Safety (Pulmonary and Critical Care Division), Beth Israel Deaconess Medical Center, Boston, Mass; cCenter for Vascular
iology Research, Boston, Mass; dDepartment of Emergency Medicine, University of Pittsburgh School of Medicine, Pittsburgh, Pa.
Conflict of Int
0002-9343/$ -see fhttp://dx.doi.org/10
ABSTRACT
BACKGROUND: Previous research on the management of hyperglycemia in patients with sepsis has focusedprimarily on those with established organ failure in the critical care setting. The impact of hyperglycemia andglycemic control in patients with infection before developing severe sepsis or shock remains undefined.METHODS: This observational, prospective, cohort study investigated the relationship between initial72-hour time-weighted mean glucose concentrations and in-hospital mortality, intensive care unit transfer,and hospital length of stay in a cohort of patients with an acute infection who were admitted from theemergency department to a non-intensive care unit hospital ward. We used multivariate regression modelsadjusted for age, diabetes, and disease severity.RESULTS: A total of 1849 patients were included, of whom 29% had diabetes. In the 1310 nondiabeticpatients, we observed hyperglycemia using time-weighted glucose concentrations: 121 to 150 mg/dL(n � 204, 16%), 151 to 180 mg/dL (n � 32, 2.4%), and greater than 180 mg/dL (n � 21, 1.6%). Insulintreatment was infrequent in nondiabetic patients, with 9%, 13%, and 29% of nondiabetic patients in theseranges receiving insulin, respectively. As patient glucose values increased, in-hospital mortality increasedin nondiabetic patients, with odds ratios (ORs) of 4.4 (95% confidence interval [CI], 1.8-11), 10.0 (95%CI, 2.5-40), and 9.3 (95% CI, 1.9-44.0). Conversely, hyperglycemia did not confer an increased risk ofadverse outcomes in diabetic patients. Likewise, increased risk for unplanned intensive care unit admissionfrom the floor demonstrated ORs of 2.2 (95% CI, 1.1-4.3), 2.0 (95% CI, 0.45-8.9), and 6.3 (95% CI,1.9-20.6) in nondiabetic patients, whereas no increased risk was found in diabetic patients.CONCLUSIONS: In this cohort of acutely infected patients without established severe sepsis or shock, higherglucose concentrations within the first 72 hours in the nondiabetic population were associated with worsehospital outcomes and were less likely to be treated with insulin compared with diabetic patients.© 2012 Elsevier Inc. All rights reserved. • The American Journal of Medicine (2012) 125, 670-678
KEYWORDS: Diabetes; Hyperglycemia; Sepsis; Severe sepsis; Noncritical care
cobs
Recent randomized controlled trials performed in the inten-sive care unit setting have assessed the efficacy of impact ofpreventing or treating hyperglycemia compared with toler-ating hyperglycemia.1-4 Although these studies have pro-duced mixed results, most experts agree that pending furtherresearch, targeting moderate glucose values in the range of
Funding: Dr Schuetz was supported by a research grant from the SwissFoundation for Grants in Biology and Medicine (Schweizerische Stiftungfür medizinisch-biologische Stipendien, SSMBS, PASMP3-127684/1). DrShapiro was supported in part byNational Institutes of Health GrantsHL-091757 and GM-076659.
erest: None.
ront matter © 2012 Elsevier Inc. All rights reserved..1016/j.amjmed.2012.03.001
140 to 180 mg/dL is the best method to optimize the shortterm.5 However, these studies were performed in intensiveare unit populations, in whom illness is established andften more severe, but the effect of hyperglycemia in aroader group of infected hospitalized patients remains unan-wered. The optimal glucose ranges and risk/benefit of insulin
Authorship: All authors had access to the data and played a role inwriting this manuscript.
Requests for reprints should be addressed to Philipp Schuetz, MD,Department of Emergency Medicine, Beth Israel Deaconess Medical Cen-ter, 1 Deaconess Road, CC2-W, Boston, MA 02215.
E-mail address: [email protected]
bc
p
gwit(
.
671Schuetz et al Hyperglycemia and Suspected Sepsis
therapy remain undefined in these patients. Observational stud-ies6,7 and 1 randomized trial8 reported lower rates of woundinfections in surgical patients managed with tighter glucosecontrol. Observational studies have found an associationbetween initial glucose values and higher rates of adverseoutcomes, such as in-hospitalmortality, in-hospital complica-tions, and a longer hospital lengthof stay.9 Similar results also haveeen reported in patients withommunity-acquired pneumonia,10,11
noncardiac surgical patients withhyperglycemia in the periopera-tive period,12 and medical pa-tients admitted to general hospitalwards.13 Furthermore, we recentlyfound an association between initialhyperglycemia in the emergencydepartment and higher rates of in-hospital mortality in a cohort of pa-tients with suspected infection, evenafter adjusting for disease sever-ity.14 This association was notapparent in diabetic patients, suggesting an altered re-sponse from antecedent hyperglycemic exposure. How-ever, much of the previous data were limited by their useof singular glucose measurements, which is likely not asimportant as a patient’s glycemic state over time.
We sought to investigate the relationship between time-weighted blood glucose measurements during the first 72hours of a patient’s hospitalization and adverse outcomes(in-hospital mortality, unplanned transfers to the intensivecare unit, and hospital length of stay) from a cohort ofacutely infected patients initially admitted from the emer-gency department to a non-intensive care unit hospital ward.We hypothesized that hyperglycemia would affect patientoutcomes, and that the temporal exposure to hyperglycemiaand whether or not a patient had preexisting diabetes wouldbe important factors in determining the extent to whichpatient outcomes were affected.
MATERIALS AND METHODS
Setting and Study DesignThis is a secondary analysis of a prospective, observationalcohort study reported previously.15 We included patientswith suspected infection in the emergency department whowere admitted to a non-intensive care unit hospital ward(between December 10, 2003, and September 30, 2004) atBeth Israel Deaconess Medical Center, a 600-bed urban, ter-tiary care, academic medical center in Boston, Massachusetts,with approximately 50,000 annual emergency department vis-its. The institutional review board at Beth Israel DeaconessMedical Center approved the study and granted waiver ofinformed consent. The study is in compliance with the
CLINICAL SIGNIF
● As patient glucohospital mortalioutcomes increatients but not in
● Nondiabetic patibe treated with
● Clinicians and fucus on nondiabeglycemia as a partient population
Helsinki Declaration.
Selection of Participants, Data Collection, andProcessingWe prospectively screened and enrolled patients on presen-tation to the emergency department. The inclusion criteriawere age 18 years or more, a suspected infection (as indi-
cated by an admitting diagnosisand a confirmatory chart review),and initial admission from theemergency department to a non-intensive care unit hospital ward.All records of patients with in-fection or possible infection un-derwent a review to confirm asuspicion of infection based onemergency department presenta-tion as documented in the medicaldecision-making portion of thechart. We defined a clinically sus-pected infection in patients withany of the following criteria: adocumented source of infection,such as a radiologic evidence ofpneumonia on a chest x-ray or
intra-abdominal infection on a computed tomography scanor urinalysis with greater than 5 white blood cells perhigh-power field; a documentation of infection by the cli-nician in the medical decision-making portion of the chart;or administration of antibiotics in the emergency depart-ment. Chart abstraction occurred on the basis of emergencydepartment information only and without any subsequentknowledge of the hospital course.
Because we were interested in analyzing mean glucoseconcentrations in patients admitted from the emergencydepartment to a non-intensive care unit hospital ward, weexcluded emergency department patients who were dis-charged to home, who were admitted directly to an in-tensive care unit, and without at least 3 blood glucosemeasurements during their hospitalization. Figure 1 details theatient selection process for the study population.
Trained research assistants reviewed the daily emer-ency department log for an admission diagnosis consistentith infection (ie, pneumonia) or possibly related to an
nfectious process (ie, shortness of breath) to identify pa-ients. Inter-rater reliability for this approach was excellentCohen’s kappa � 0.9).15 All medical records of patients
with infection or possible infection underwent a confirma-tory review to affirm a suspicion of infection based onemergency department presentation as documented in themedical decision-making portion of the chart.
Definition of Diabetes, 72-HourTime-Averaged Glucose Concentrations, andOutcome MeasuresWe classified patients as having preexisting diabetes basedon self-report or documentation in their medical record. We
CE
ges increased, in-d other adversenondiabetic pa-
etic patients.
were less likely ton.
esearch should fo-tients with hyper-rly vulnerable pa-
ICAN
se ranty ansed indiab
entsinsuli
ture rtic paticula
recorded initial blood glucose values in the emergency de-

an
iftlwati
pf
C
P
Dh
U
O
672 The American Journal of Medicine, Vol 125, No 7, July 2012
partment and all subsequent measurements during the first72 hours of the hospital course. For each patient, we calcu-lated the time-weighted mean glucose concentration (meanglucose) with a previously reported method.16,17 We used allmeasured blood glucose concentrations for the calculations.We assumed a linear trend to calculate the mean glucose andby correlating that measurement to a time value.
The primary end point for this analysis was all causein-hospital mortality, and the secondary outcome measureswere transfer to the intensive care unit and total hospitallength of stay in days.
Statistical AnalysisValues are expressed as means with standard deviation andfrequencies with percentages to describe the populations, asappropriate. We investigated the association of time-weighted glucose values over the first 72 hours and out-comes in patients with and without diabetes in a stratifiedanalysis. Time-weighted mean glucose values were ana-lyzed as categoric variables using the following blood glu-cose ranges: less than 80 mg/dL, 80 to 120 mg/dL, 121 to150 mg/dL, 151 to 180 mg/dL, and greater than 180 mg/dL.
Next, we investigated the association between time-weighted mean glucose concentrations and adverse out-comes (in-hospital mortality and unplanned transfer to theintensive care unit) using logistic regression analysis andreported the results using odds ratios (ORs) and 95% con-fidence intervals (CIs). We used the glucose range of 80 to120 mg/dL as our reference range. We adjusted the analysisfor age, gender, and disease severity according to the Mor-tality in Emergency Department Sepsis score.18 This score is
validated instrument that incorporates covariates such as
Figure 1 Patient flow. ED � emergency depart-ment; ICU � intensive care unit.
ursing home residency, terminal comorbid illness, type of
nfection, bandemia greater than 5%, and signs of organ dys-unction (tachypnea, septic shock, thrombocytopenia, or al-ered mental status). We performed a similar analysis forength of hospital stay using a linear regression model. Finally,e investigated whether there was effect modification for the
ssociation between time-weighted mean glucose concentra-ions and patient outcomes based on preexisting diabetes bynclusion of an interaction term into our multivariate models.
All reported CIs are 2-sided 95% intervals with 2-sideder-comparison alpha set at 0.05. All analyses were per-ormed with SAS 9.2 (SAS Institute, Inc, Cary, NC).
RESULTS
Baseline Characteristics of PatientsFrom a total of 2161 eligible emergency department visits,1849 patients were admitted to a non-intensive care unit hos-pital ward and included in this analysis (Figure 1). The mean
Table 1 Patient Characteristics and Hospital Outcomes
Parameter n � 1849
DemographicsAge (y), mean (SD) 59.9 (19.9)Female gender, n (%) 883 (48)
Race, n (%)White 1408 (76)African American 252 (14)Asian 51 (3)Other 138 (7)
omorbidities, n (%)Coronary artery disease 135 (7)Congestive heart failure 209 (11)Cerebrovascular disease 145 (8)Chronic obstructive pulmonary disease 229 (12)Dementia 111 (6)Chronic kidney disease 222 (12)History of malignant disease 220 (12)
reexisting diabetes, n (%)Any type of diabetes 539 (29)Type 1 diabetes 69 (4)Type 2 diabetes 470 (25)
iabetes-associated medication beforeospital admission, n (%)
Insulin therapy 238 (13)Oral hypoglycemic agents 182 (10)Statin therapy 256 (14)
nderlying infection, n (%)Pneumonia 405 (22)Urinary tract infection 212 (11)Skin or soft tissue infection 496 (27)Surgical wound infection 67 (4)Intra-abdominal infection 301 (16)
utcomes of the hospital stayLength of hospital stay (d), mean (SD) 4.9 (5.8)Transfer to ICU, n (%) 58 (3.1)Mortality, n (%) 34 (1.8)
ICU � intensive care unit; SD � standard deviation.
I
673Schuetz et al Hyperglycemia and Suspected Sepsis
(standard deviation) age of the cohort was 60 (20) years, and48% were women. Twenty-nine percent of the patients(n�539) had preexisting diabetes, the majority of whom hadtype II diabetes. Table 1 shows patient characteristics at base-line and hospital outcomes for the total patient cohort.
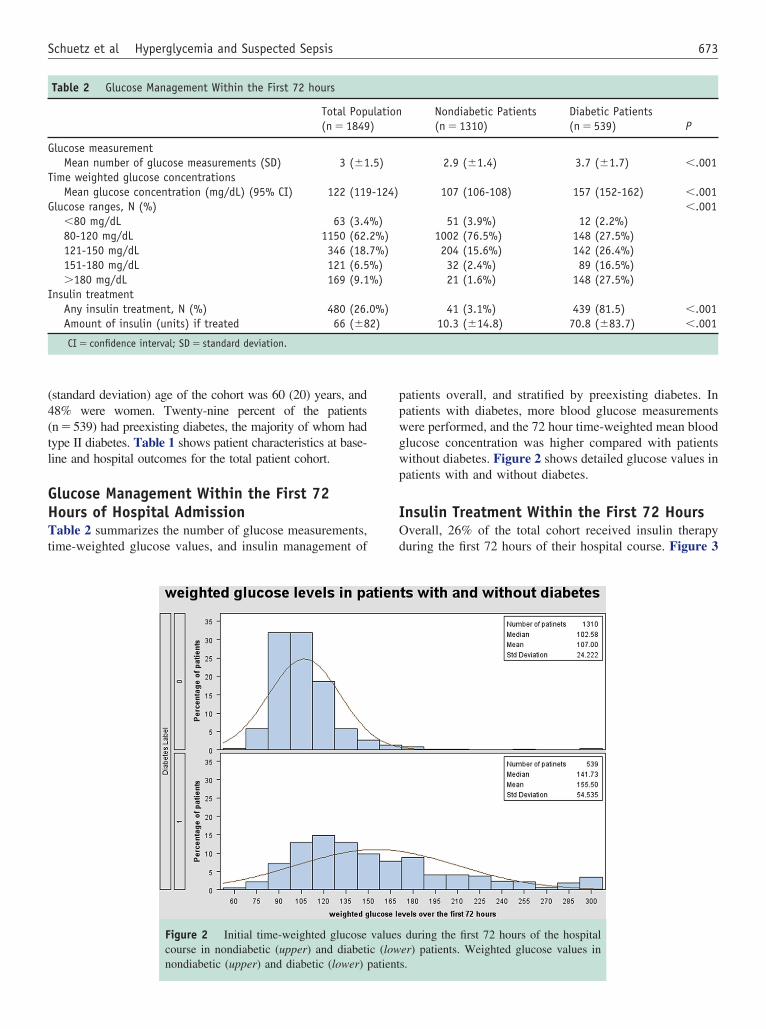
Glucose Management Within the First 72Hours of Hospital AdmissionTable 2 summarizes the number of glucose measurements,time-weighted glucose values, and insulin management of
Figure 2 Initial time-weighted glucosecourse in nondiabetic (upper) and diabeti
Table 2 Glucose Management Within the First 72 hours
Total Pop(n � 1849
Glucose measurementMean number of glucose measurements (SD) 3 (�1
Time weighted glucose concentrationsMean glucose concentration (mg/dL) (95% CI) 122 (119
Glucose ranges, N (%)�80 mg/dL 63 (3.480-120 mg/dL 1150 (62.121-150 mg/dL 346 (18.151-180 mg/dL 121 (6.5�180 mg/dL 169 (9.1
nsulin treatmentAny insulin treatment, N (%) 480 (26.Amount of insulin (units) if treated 66 (�8
CI � confidence interval; SD � standard deviation.
nondiabetic (upper) and diabetic (lower) patient
patients overall, and stratified by preexisting diabetes. Inpatients with diabetes, more blood glucose measurementswere performed, and the 72 hour time-weighted mean bloodglucose concentration was higher compared with patientswithout diabetes. Figure 2 shows detailed glucose values inpatients with and without diabetes.
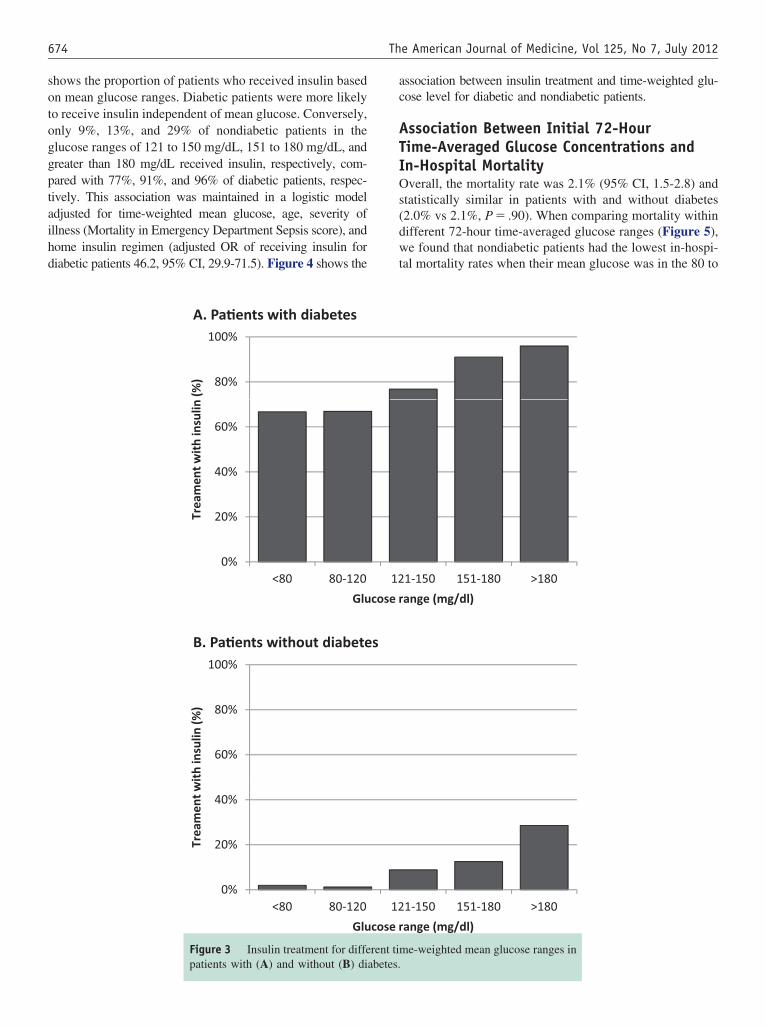
Insulin Treatment Within the First 72 HoursOverall, 26% of the total cohort received insulin therapyduring the first 72 hours of their hospital course. Figure 3
during the first 72 hours of the hospitaler) patients. Weighted glucose values in
Nondiabetic Patients(n � 1310)
Diabetic Patients(n � 539) P
2.9 (�1.4) 3.7 (�1.7) �.001
107 (106-108) 157 (152-162) �.001�.001
51 (3.9%) 12 (2.2%)1002 (76.5%) 148 (27.5%)204 (15.6%) 142 (26.4%)32 (2.4%) 89 (16.5%)21 (1.6%) 148 (27.5%)
41 (3.1%) 439 (81.5) �.00110.3 (�14.8) 70.8 (�83.7) �.001
valuesc (low
ulation)
.5)
-124)
%)2%)7%)%)%)
0%)2)
s.
674 The American Journal of Medicine, Vol 125, No 7, July 2012
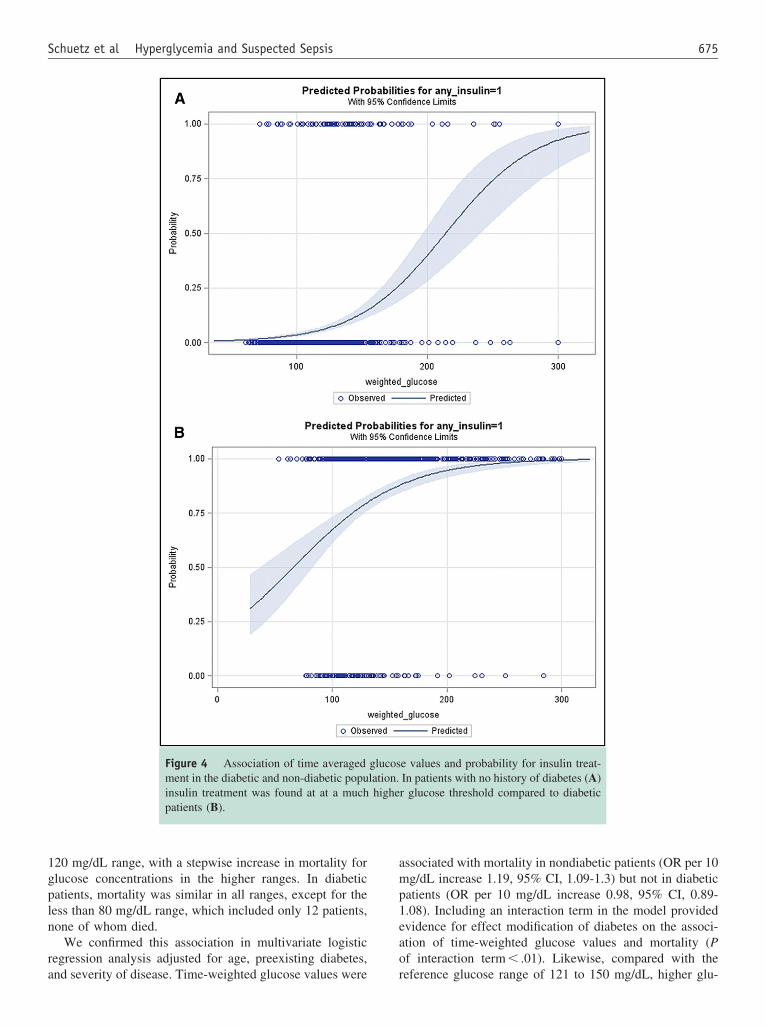
shows the proportion of patients who received insulin basedon mean glucose ranges. Diabetic patients were more likelyto receive insulin independent of mean glucose. Conversely,only 9%, 13%, and 29% of nondiabetic patients in theglucose ranges of 121 to 150 mg/dL, 151 to 180 mg/dL, andgreater than 180 mg/dL received insulin, respectively, com-pared with 77%, 91%, and 96% of diabetic patients, respec-tively. This association was maintained in a logistic modeladjusted for time-weighted mean glucose, age, severity ofillness (Mortality in Emergency Department Sepsis score), andhome insulin regimen (adjusted OR of receiving insulin fordiabetic patients 46.2, 95% CI, 29.9-71.5). Figure 4 shows the
A. Pa�ents with diabetes
80%
100%
(%)
20%
40%
60%
Trea
men
t wit
h in
sulin
B. Pa�ents without diabete
0%<80 80-120
Glu
60%
80%
100%
th in
sulin
(%)
0%
20%
40%
<80 80 120
Trea
men
t wi
<80 80-120
Glu
Figure 3 Insulin treatment for diffe
patients with (A) and without (B) diabetes.association between insulin treatment and time-weighted glu-cose level for diabetic and nondiabetic patients.
Association Between Initial 72-HourTime-Averaged Glucose Concentrations andIn-Hospital MortalityOverall, the mortality rate was 2.1% (95% CI, 1.5-2.8) andstatistically similar in patients with and without diabetes(2.0% vs 2.1%, P � .90). When comparing mortality withindifferent 72-hour time-averaged glucose ranges (Figure 5),we found that nondiabetic patients had the lowest in-hospi-tal mortality rates when their mean glucose was in the 80 to
1-150 151-180 >180
ange (mg/dl)
1 150 151 180 >1801-150 151-180 >180
ange (mg/dl)
me-weighted mean glucose ranges in
s
12
cose r
1212
cose r
rent ti
675Schuetz et al Hyperglycemia and Suspected Sepsis
120 mg/dL range, with a stepwise increase in mortality forglucose concentrations in the higher ranges. In diabeticpatients, mortality was similar in all ranges, except for theless than 80 mg/dL range, which included only 12 patients,none of whom died.
We confirmed this association in multivariate logisticregression analysis adjusted for age, preexisting diabetes,
Figure 4 Association of time averagedment in the diabetic and non-diabetic popuinsulin treatment was found at at a muchpatients (B).
and severity of disease. Time-weighted glucose values were r
associated with mortality in nondiabetic patients (OR per 10mg/dL increase 1.19, 95% CI, 1.09-1.3) but not in diabeticpatients (OR per 10 mg/dL increase 0.98, 95% CI, 0.89-1.08). Including an interaction term in the model providedevidence for effect modification of diabetes on the associ-ation of time-weighted glucose values and mortality (Pof interaction term � .01). Likewise, compared with the
e values and probability for insulin treat-In patients with no history of diabetes (A)r glucose threshold compared to diabetic
glucoslation.highe
eference glucose range of 121 to 150 mg/dL, higher glu-

phf
9a
s. ICU
676 The American Journal of Medicine, Vol 125, No 7, July 2012
cose ranges were associated with higher mortality rates(Table 3).
When investigating the association of glucose ranges andmortality within different types of infection, we found noevidence for significant effect modification; specifically, nointeraction was found for pneumonia, urinary tract infection,intra-abdominal infections, or soft tissue/skin infections.
We also investigated the effect of insulin treatment onmortality. In a propensity-adjusted logistic regressionmodel, we found no association between insulin treatmentand mortality (OR, 1.1; 95% CI, 0.56-2.27; P � .75).
Association Between Initial 72-HourTime-Averaged Glucose Concentrations andUnplanned Transfer to the IntensiveCare UnitThe rate of transfer to the intensive care unit from a non-intensive care unit hospital ward was 3.1% (95% CI, 2.3-3.9) and higher in diabetic patients (4.6%) compared withnondiabetic patients (2.5%, P � .05). Figure 5B shows non-intensive care unit hospital ward to intensive care unittransfer rates for different time-averaged glucose ranges indiabetic and nondiabetic patients. Similar to mortality, therate of intensive care unit admission was lowest in the 80 to120 mg/dL glucose concentration range, with a stepwiseincrease at higher glucose ranges only in nondiabetic pa-tients, whereas in diabetic patients the rates were similar inall glucose ranges, except for the less than 80 mg/dL range.
0
2
4
6
8
10
12
14
16
0
2
4
6
8
10
12
14
16Diabe�c popula�on
Mor
talit
y (%
)
Non-Diabe�c popula�on
Mor
talit
y (%
)
A. Mortality within glucose ranges
Figure 5 Mortality (A) and intensive camean glucose ranges, stratified by diabete
In multivariate logistic regression analysis, mean 72-hour
blood glucose concentrations tended to be associated withintensive care unit transfer only in the nondiabetic patients(OR per 10 mg/dL increase 1.08, 95% CI, 0.98-1.19), butnot in diabetic patients (OR per 10 mg/dL increase 0.98,95% CI, 0.91-1.06). Testing for effect modification did notshow a significant result (P interaction term � 0.13). Com-ared to the reference glucose range of 121 to 150 mg/dL,igher glucose ranges were associated with increased riskor intensive care unit transfer (Table 3).
Association Between Initial 72-HourTime-Averaged Glucose Concentrations andHospital Length of Stay
The mean length of stay was 4.9 days (95% CI, 4.7-5.1) andlonger in diabetic patients compared to nondiabetic patients(6.2 vs 4.4 days, P� .01). In multivariate linear regressionadjusted for age, diabetes, severity of disease (Mortality inEmergency Department Sepsis score), 72-hour mean glucoseconcentrations were associated with longer hospital length ofstay in nondiabetic patients (linear regression coefficient per 10mg/dL increase 0.1, 95% CI, 0.0-0.26), but not in diabeticpatients (linear regression coefficient per 10 mg/dL �0.01,5% CI, �0.09-0.08). Testing for effect modification showedpositive trend (P interaction term� .08).
DISCUSSIONBecause of the growing worldwide epidemic of diabetes,
0123456789
10
0123456789
10
B. ICU admission within glucose ranges
ICU
adm
issi
on (%
)IC
U a
dmis
sion
(%)
Diabe�c popula�on
Non-Diabe�c popula�on
admission (B) in different time-weighted� intensive care unit.
re unit
appropriate management of hyperglycemia in the hospital

titcgtgsgifnsrc
orwpdmrCcnu
nitgwo
677Schuetz et al Hyperglycemia and Suspected Sepsis
setting has become increasingly important. It is estimatedthat diabetic patients are responsible for more than 20% ofall US hospital inpatient days.19 Previous research has notedhat hyperglycemia is associated with adverse outcomes inntensive care unit patients, postoperative patients, and inhose being treated for myocardial infarctions.6,9,20 In theritical care setting, a number of previous studies investi-ated the impact of treating hyperglycemia compared witholerating hyperglycemia. Initial studies from Belgium sug-ested a lower overall mortality rate among patients in theurgical4 and medical intensive care unit3 treated with tightlucose control. The greatest mortality reduction occurredn patients with multiple-organ failure from a proven septicocus, with a 46% reduction in the likelihood of developingew sepsis.4 However, 2 more recent large-scale trials, 1pecifically focused on patients with severe sepsis,1 did noteplicate the initial promising findings and reported higheromplication rates with tighter glucose control.1,2 These
trials differed substantially in their patient populations, nu-tritional support, and, most important, the level of glycemiccontrol within the control arm. For other patient popula-tions, such as those with systemic infections in the non-intensive care unit settings, few data exist in the literature.Consequently, it remains unclear how to best manage hy-perglycemia in diabetic and nondiabetic patients hospital-ized in the non-intensive care unit setting.
In our study, glucose values were relatively well con-trolled overall, particularly in the nondiabetic population.Still, only a minority of nondiabetic patients with hyperglyce-mia were treated with insulin. This also was true when adjust-
Table 3 Outcomes During Hospital Stay According to Glucose
Diabetic Patients
Glucose Ranges Frequency(%, n/total)
MortalityGlucose � 80 mg/dL 0% (0/12)Glucose 80-120 mg/dL 2.03% (3/148)Glucose 121-150 mg/dL 2.82% (4/142)Glucose 151-180 mg/dL 2.25% (2/89)Glucose �180 mg/dL 1.35% (2/148)
ICU admission from the medical floorGlucose � 80 mg/dL 0% (0/12)Glucose 80-120 mg/dL 6.08% (9/148)Glucose 121-150 mg/dL 7.75% (11/142)Glucose 151-180 mg/dL 7.87% (7/89)Glucose �180 mg/dL 3.38% (5/148)
Length of hospital stayGlucose � 80 mg/dL 6.58 (5.18)Glucose 80-120 mg/dL 5.93 (7.91)Glucose 121-150 mg/dL 6.21 (7.39)Glucose 151-180 mg/dL 6.1 (6.03)Glucose � 180 mg/dL 6.6 (8.12)
ICU � intensive care unit; SD � standard deviation; CI � confidence�Adjusted for severity and age.
ing for severity of illness using the Mortality in Emergency d
Department Sepsis score, a well-validated severity of illnessinstrument. Although we did adjust for severity of illness, wecannot exclude that residual confounding explains some ofthese effects. Hyperglycemia is marker of acute stress andoccurs in response to endogenous catecholamines and cortisolproduction independently of preexisting diabetes.
The most recent consensus guidelines by the AmericanAssociation of Clinical Endocrinologists and American Di-abetes Association regarding inpatient glycemic control inthe non-intensive care unit setting specifically states thatblood glucose concentrations should be maintained between140 and 180 mg/dL.20 However, only approximately 25%f the nondiabetic patients in our cohort with mean glucoseanges greater than 180 mg/dL during the first 72 hoursere treated with insulin, which was due to a knowledge orractice translation gap. Furthermore, our finding that non-iabetic patients had the lowest mortality rate when theirean glucose values were in the 80 to 120 mg/dL range
aises some doubt whether the American Association oflinical Endocrinologists/American Diabetes Associationonsensus guideline provides optimum glycemic control forondiabetic patients with sepsis in the non-intensive carenit setting. Unfortunately, outcome studies are lacking.
Although we found that higher mean glucose values inondiabetic patients were associated with higher rates ofn-hospital mortality and intensive care unit transfer, addi-ional studies are needed to confirm whether treating hyper-lycemia translates into better patient outcomes and, if so,hich glucose values should be specifically targeted toptimize patient outcomes. Our study does provide evi-
Nondiabetic Patients
ed OR(95% CI) Frequency(%, n/total) Adjusted OR(95% CI)
1.96% (1/51) 2.91 (0.35-24.37)ce 1% (10/1002) reference
0.30-7.48) 5.39% (11/204) 4.45 (1.79-11.03)0.13-6.04) 9.38% (3/32) 9.95 (2.48-39.94)0.05-4.32) 14.29% (3/21) 9.25 (1.92-44.49)
3.92% (2/51) 1.63 (0.37-7.09)ce 2.79% (28/1002) reference
0.52-3.24) 6.86% (14/204) 2.22 (1.14-4.33)0.46-3.62) 6.25% (2/32) 2.00 (0.45-8.85)0.18-1.77) 19.05% (4/21) 6.32 (1.94-20.63)
�3.95-4.9) 5.49 (7.64) 1.53 (0.19-2.86)ce 4.08 (3.96) reference
�1.52-1.94) 4.93 (5.74) 0.64 (�0.08-1.37)�1.93-2.04) 7.77 (10.45) 3.46 (1.73-5.18)�1.27-2.23) 6.1 (6.78) 1.58 (�0.52-3.68)
. NA � not available; OR � odds ratio.
Range
Adjust
NAreferen1.50 (0.89 (0.45 (
NAreferen1.30 (1.30 (0.57 (
0.47 (referen0.21 (0.06 (0.48 (
interval
ence that hyperglycemia in nondiabetic patients hospital-
678 The American Journal of Medicine, Vol 125, No 7, July 2012
ized in the non-intensive care unit inpatient setting may bea more significant cause of in-hospital complications thanpreviously believed, and that additional focus on improvingglycemic control in this population may not only improvepatient outcomes but also reduce the use of valuable andincreasingly limited healthcare resources.
Although hypoglycemia and its associated complicationswere a major cause of morbidity and mortality in many ofthe previous studies investigating various insulin regimens,mean glucose values in the hypoglycemic range were rare inour cohort and not associated with higher rates of in-hos-pital mortality. However, our study was not specificallydesigned to address this issue, and our sample size lacks thepower to determine whether an association exists betweenhypoglycemia and adverse patient outcomes.
This study has a number of limitations. First, this is asecondary analysis of a prospectively enrolled cohort, andour primary purpose was hypothesis generation for futureresearch. Although we adjusted our regression models forage, diabetes status, and disease severity, it is possible thatadditional factors confounded our results. Furthermore, be-cause we relied on subjective self-report and medical recordreview to determine whether a patient had a diagnosis ofdiabetes or not, we may have erroneously included diabeticpatients in the “nondiabetic” group and vice versa, poten-tially resulting in misclassification bias. The external valid-ity of our findings also is unknown because this study wasperformed at a single institution.
CONCLUSIONSWe observed an association between time-weighted meanglucose concentrations and adverse clinical outcomes innondiabetic patients with acute infection who were admittedto a non-intensive care unit hospital ward, whereas no suchassociations were found in diabetic patients. Physicianswere less likely to administer insulin for hyperglycemia inpatients without preexisting diabetes. Additional studies areneeded to confirm the validity of these findings and tofurther elucidate the most appropriate management of hy-perglycemia in nondiabetic patients hospitalized in the non-intensive care unit inpatient setting.
ACKNOWLEDGMENTThe authors would like to thank the local physicians, the
nursing staff, and the patients who participated in this study.References1. Brunkhorst FM, Engel C, Bloos F, et al. Intensive insulin therapy and
pentastarch resuscitation in severe sepsis. N Engl J Med. 2008;358:125-139.
2. Finfer S, Chittock DR, Su SY, et al. Intensive versus conventionalglucose control in critically ill patients. N Engl J Med. 2009;360:1283-1297.
3. Van den Berghe G, Wilmer A, Hermans G, et al. Intensive insulintherapy in the medical ICU. N Engl J Med. 2006;354:449-461.
4. van den Berghe G, Wouters P, Weekers F, et al. Intensive insulintherapy in the critically ill patients. N Engl J Med. 2001;345:1359-1367.
5. Kavanagh BP, McCowen KC. Clinical practice. Glycemic control inthe ICU. N Engl J Med. 2010;363:2540-2546.
6. Ata A, Lee J, Bestle SL, et al. Postoperative hyperglycemia andsurgical site infection in general surgery patients. Arch Surg. 2010;145:858-864.
7. Patel KL. Impact of tight glucose control on postoperative infectionrates and wound healing in cardiac surgery patients. J Wound OstomyContinence Nurs. 2008;35:397-404; quiz 5-6.
8. Umpierrez GE, Smiley D, Jacobs S, et al. Randomized study ofbasal-bolus insulin therapy in the inpatient management of patientswith type 2 diabetes undergoing general surgery (RABBIT 2 surgery).Diabetes Care. 2011;34:256-261.
9. Schuetz P, Castro P, Shapiro NI. Diabetes and sepsis: preclinicalfindings and clinical relevance. Diabetes Care. 2011;34:771-778.
10. Falguera M, Pifarre R, Martin A, et al. Etiology and outcome ofcommunity-acquired pneumonia in patients with diabetes mellitus.Chest. 2005;128:3233-3239.
11. McAlister FA, Majumdar SR, Blitz S, et al. The relation betweenhyperglycemia and outcomes in 2,471 patients admitted to the hospitalwith community-acquired pneumonia. Diabetes Care. 2005;28:810-815.
12. Frisch A, Chandra P, Smiley D, et al. Prevalence and clinical outcomeof hyperglycemia in the perioperative period in noncardiac surgery.Diabetes Care. 2010;33:1783-1788.
13. Umpierrez GE, Isaacs SD, Bazargan N, et al. Hyperglycemia: anindependent marker of in-hospital mortality in patients with undiag-nosed diabetes. J Clin Endocrinol Metab. 2002;87:978-982.
14. Schuetz P, Jones AE, Howell MD, et al. Diabetes is not associated withincreased mortality in emergency department patients with sepsis. AnnEmerg Med. 2011;58:438-444.
15. Shapiro NI, Howell MD, Talmor D, et al. Serum lactate as a predictorof mortality in emergency department patients with infection. AnnEmerg Med. 2005;45:524-528.
16. Egi M, Bellomo R, Stachowski E, et al. The interaction of chronic andacute glycemia with mortality in critically ill patients with diabetes.Crit Care Med. 2011;39:105-111.
17. Finney SJ, Zekveld C, Elia A, Evans TW. Glucose control and mor-tality in critically ill patients. Jama. 2003;290:2041-2047.
18. Shapiro NI, Wolfe RE, Moore RB, et al. Mortality in EmergencyDepartment Sepsis (MEDS) score: a prospectively derived and vali-dated clinical prediction rule. Crit Care Med. 2003;31:670-675.
19. Economic costs of diabetes in the U.S. In 2007. Diabetes Care.2008;31:596-615.
20. Moghissi ES, Korytkowski MT, DiNardo M, et al. American Associ-ation of Clinical Endocrinologists and American Diabetes Associationconsensus statement on inpatient glycemic control. Diabetes Care.
2009;32:1119-1131.


![Fuzzy rule-based set point weighting for fuzzy PID controller...ventional PID controller is proposed by Visioli [18] where the weighting factor for the proportional term is calcu-lated](https://static.fdocuments.net/doc/165x107/613617970ad5d2067647cbd6/fuzzy-rule-based-set-point-weighting-for-fuzzy-pid-controller-ventional-pid.jpg)