Initial Behavior Outcomes for the PeaceBuilders … · Initial Behavior Outcomes for the...
17
Initial Behavior Outcomes for the PeaceBuilders Universal School-Based Violence Prevention Program Daniel J. Flannery Kent State University Alexander T. Vazsonyi Auburn University Albert K. Liau Kent State University Shenyang Guo University of North Carolina at Chapel Hill Kenneth E. Powell Centers for Disease Control and Prevention Henry Atha Pima County (AZ) Community Services Department Wendy Vesterdal University of Arizona Dennis Embry PAXIS Institute PeaceBuilders is a universal, elementary-school-based violence prevention program that attempts to alter the climate of a school by teaching students and staff simple rules and activities aimed at improving child social competence and reducing aggressive behavior. Eight matched schools (N 4,000 students in Grades K–5) were randomly assigned to either immediate postbaseline intervention (PBI) or to a delayed intervention 1 year later (PBD). Hierarchical linear modeling was used to analyze results from assess- ments in the fall and spring of 2 consecutive school years. In Year 1, significant gains in teacher-rated social competence for students in Grades K–2, in child self-reported peace-building behavior in Grades K–5, and reductions in aggressive behavior in Grades 3–5 were found for PBI but not PBD schools. Differential effects in Year 1 were also observed for aggression and prosocial behavior. Most effects were maintained in Year 2 for PBI schools, including increases in child prosocial behavior in Grades K–2. Implications for early universal school-based prevention and challenges related to evaluating large-scale prevention trials are discussed. Despite recent downturns in national rates of violence perpetra- tion by juveniles, a significant number of young people remain both perpetrators and victims of interpersonal violence (Dahlberg, 1998; Mercy & Potter, 1996; Sickmund, Snyder, & Poe-Yamagata, 1997; Snyder & Sickmund, 1999). For example, though the overall homicide rate in the United States has declined, rates for homicide and nonfatal injuries among children and adolescents remain at significantly high levels (Snyder & Sickmund, 1999). The propor- tion of young people who self-report having committed serious acts of violence has also held steady since peaking in the early 1990s (Snyder, 2000). Violence occurs at home, in neighborhoods, and at school. Many recent studies illustrate the impact that exposure to violence and victimization from violence have on mental health and behav- Daniel J. Flannery and Albert K. Liau, Institute for the Study and Prevention of Violence, Kent State University; Alexander T. Vazsonyi, Department of Human Development and Family Studies, Auburn Univer- sity; Shenyang Guo, School of Social Work, University of North Carolina at Chapel Hill; Kenneth E. Powell, Centers for Disease Control and Prevention, Atlanta, Georgia; Henry Atha, Pima County Community Ser- vices Department, Tucson, Arizona; Wendy Vesterdal, Department of Family and Consumer Resources, University of Arizona; Dennis Embry, PAXIS Institute, Tucson, Arizona. Albert K. Liau is now at the Psychological Studies Group, National Institute of Education, Singapore. Kenneth E. Powell is now at the Georgia Department of Human Resources, Division of Public Health, Atlanta, Georgia. This project was supported in part by Cooperative Agreements U81- CCU010038 – 03 and U81-CCU513508 – 01 from the National Center for Injury Prevention and Control, Centers for Disease Control and Prevention, Atlanta, Georgia. We gratefully acknowledge the contributions of Laura Williams, Kelly Wester, Laurie Biebelhausen, and Lara Belliston to data management and analysis. We also appreciate the comments of Thomas Simon on an earlier version of the manuscript. We are grateful to the students, staff, and parents in the Sunnyside and Tucson unified school districts for their ongoing support and participation. PeaceBuilders is a registered trademark of Heartsprings, Inc. The use of trade names is for identification only and does not constitute endorsement by the U.S. Public Health Service or the U.S. Department of Health and Human Services. Correspondence concerning this article should be addressed to Daniel J. Flannery, Institute for the Study and Prevention of Violence, Kent State University, 230 Auditorium Building, Kent, Ohio 44242. E-mail: [email protected] Developmental Psychology Copyright 2003 by the American Psychological Association, Inc. 2003, Vol. 39, No. 2, 292–308 0012-1649/03/$12.00 DOI: 10.1037/0012-1649.39.2.292 292
Transcript of Initial Behavior Outcomes for the PeaceBuilders … · Initial Behavior Outcomes for the...

Initial Behavior Outcomes for the PeaceBuilders Universal School-BasedViolence Prevention Program
Daniel J. FlanneryKent State University
Alexander T. VazsonyiAuburn University
Albert K. LiauKent State University
Shenyang GuoUniversity of North Carolina at Chapel Hill
Kenneth E. PowellCenters for Disease Control and Prevention
Henry AthaPima County (AZ) Community Services Department
Wendy VesterdalUniversity of Arizona
Dennis EmbryPAXIS Institute
PeaceBuilders is a universal, elementary-school-based violence prevention program that attempts to alterthe climate of a school by teaching students and staff simple rules and activities aimed at improving childsocial competence and reducing aggressive behavior. Eight matched schools (N � 4,000 students inGrades K–5) were randomly assigned to either immediate postbaseline intervention (PBI) or to a delayedintervention 1 year later (PBD). Hierarchical linear modeling was used to analyze results from assess-ments in the fall and spring of 2 consecutive school years. In Year 1, significant gains in teacher-ratedsocial competence for students in Grades K–2, in child self-reported peace-building behavior in GradesK–5, and reductions in aggressive behavior in Grades 3–5 were found for PBI but not PBD schools.Differential effects in Year 1 were also observed for aggression and prosocial behavior. Most effects weremaintained in Year 2 for PBI schools, including increases in child prosocial behavior in Grades K–2.Implications for early universal school-based prevention and challenges related to evaluating large-scaleprevention trials are discussed.
Despite recent downturns in national rates of violence perpetra-tion by juveniles, a significant number of young people remainboth perpetrators and victims of interpersonal violence (Dahlberg,1998; Mercy & Potter, 1996; Sickmund, Snyder, & Poe-Yamagata,1997; Snyder & Sickmund, 1999). For example, though the overallhomicide rate in the United States has declined, rates for homicideand nonfatal injuries among children and adolescents remain at
significantly high levels (Snyder & Sickmund, 1999). The propor-tion of young people who self-report having committed seriousacts of violence has also held steady since peaking in the early1990s (Snyder, 2000).
Violence occurs at home, in neighborhoods, and at school.Many recent studies illustrate the impact that exposure to violenceand victimization from violence have on mental health and behav-
Daniel J. Flannery and Albert K. Liau, Institute for the Study andPrevention of Violence, Kent State University; Alexander T. Vazsonyi,Department of Human Development and Family Studies, Auburn Univer-sity; Shenyang Guo, School of Social Work, University of North Carolinaat Chapel Hill; Kenneth E. Powell, Centers for Disease Control andPrevention, Atlanta, Georgia; Henry Atha, Pima County Community Ser-vices Department, Tucson, Arizona; Wendy Vesterdal, Department ofFamily and Consumer Resources, University of Arizona; Dennis Embry,PAXIS Institute, Tucson, Arizona.
Albert K. Liau is now at the Psychological Studies Group, NationalInstitute of Education, Singapore. Kenneth E. Powell is now at the GeorgiaDepartment of Human Resources, Division of Public Health, Atlanta,Georgia.
This project was supported in part by Cooperative Agreements U81-CCU010038–03 and U81-CCU513508–01 from the National Center for
Injury Prevention and Control, Centers for Disease Control and Prevention,Atlanta, Georgia.
We gratefully acknowledge the contributions of Laura Williams, KellyWester, Laurie Biebelhausen, and Lara Belliston to data management andanalysis. We also appreciate the comments of Thomas Simon on an earlierversion of the manuscript. We are grateful to the students, staff, and parentsin the Sunnyside and Tucson unified school districts for their ongoingsupport and participation.
PeaceBuilders is a registered trademark of Heartsprings, Inc. The use oftrade names is for identification only and does not constitute endorsementby the U.S. Public Health Service or the U.S. Department of Health andHuman Services.
Correspondence concerning this article should be addressed to Daniel J.Flannery, Institute for the Study and Prevention of Violence, Kent StateUniversity, 230 Auditorium Building, Kent, Ohio 44242. E-mail:[email protected]
Developmental Psychology Copyright 2003 by the American Psychological Association, Inc.2003, Vol. 39, No. 2, 292–308 0012-1649/03/$12.00 DOI: 10.1037/0012-1649.39.2.292
292
bgrams
Highlight
bgrams
Highlight
bgrams
Highlight

ior, including an increased risk for engaging in violent behavior(Elliott, Hamburg, & Williams, 1998; Flannery, 1997; Singer,Anglin, Song, & Lunghofer, 1995; Singer et al., 1999). Althoughthe risk of homicide victimization at school remains low (Kachuret al., 1996), levels of exposure to violence and victimization fromviolence at school remain high, particularly for elementary andmiddle school children (Kaufman et al., 2000; Singer et al., 1999).While recent data suggest a decline in the number of studentscarrying weapons to school (7% of high school students werefound to have done so within the previous 30 days; Kann et al.,2000), the use of firearms and other weapons has heightened thelethality of violence among young people (Rushforth & Flannery,1999) and has significantly increased the likelihood that specificconflicts will escalate into lethal exchanges (Fagan & Wilkinson,1997). In fact, despite recent declines in gun use and lethal formsof violence, the proportion of young people involved in nonfatalviolence has not declined (Snyder, 2000). Arrest rates for aggra-vated assaults remain almost 70% higher than they were in 1983,and this is the offense most frequently captured in self-reportsof violence (U.S. Department of Health and Human Services[USDHHS], 2001).
The data are clear. Violence among young people remains asignificant public health problem (USDHHS, 2001). Althoughmany school and community-based violence prevention programsexist, relatively few have been rigorously evaluated (Sherman etal., 1997; Thornton, Craft, Dahlberg, Lynch, & Baer, 2000). Ifpsychologists are to inform public policy and facilitate risk pre-vention for young people, it is imperative that we identify, throughapplied evaluation studies, programs that effectively prevent youthviolent behavior and its associated precursors (i.e., aggression) andrigorously evaluate the behavioral outcomes associated with theseinterventions (Powell & Hawkins, 1996; Satcher, Powell, Mercy,& Rosenberg, 1996; USDHHS, 2001). In the present study, weexamined the potential impact of a universal elementary-school-based violence prevention program on student aggression andsocial competence.
Preventive Interventions
The need to provide early prevention is illustrated by the mul-titude of studies that show that violent behavior occurs along adevelopmental continuum of behavioral severity (e.g., Flannery &Huff, 1999; Flannery & Williams, 1999; Tolan, Guerra, & Ken-dall, 1995; Tremblay, et al., 1992). The precursors to more seriousviolence perpetration in adolescence (e.g., homicide, assault) areyoung children’s aggressive behaviors such as hitting, kicking, andverbal insults and threats (Conduct Problems Prevention ResearchGroup [CPPRG], 1999; Dahlberg, 1998; Huesmann et al., 1996;Huesmann & Moise, 1999; Singer & Flannery, 2000; Stoolmiller,Eddy, & Reid, 2000; Tremblay, Pagani-Kurtz, Masse, Vitaro, &Pihl, 1995). These are the triggers that can escalate interpersonalconflict into violence and are the behaviors that need to be targetedin preventive interventions in elementary schools. Young peoplewithout the skills and competencies to resolve conflicts or solveproblems are at increased risk for violence victimization andperpetration (Lochman & Dodge, 1994). Longitudinal research hasconsistently demonstrated that aggressive, peer-rejected childrenin first grade are at increased risk for engaging in delinquent,violent behavior in adolescence (Hawkins et al., 2000; Loeber &
Farrington, 1998; Tolan & Gorman-Smith, 1998; Tremblay et al.,1992, 1995; Walker, Colvin, & Ramsey, 1995) and for becomingantisocial adults (Eron & Huesmann, 1990).
Promising studies exist showing that the developmental trajec-tory of youth violence may be altered (CPPRG, 1999; Dahlberg,1998; Englander-Golden, Jackson, Crane, Schwarzkopf, & Lyle,1989; Hawkins, 1995; Howard, Flora, & Griffin, 1999; Reid,Eddy, Fetrow, & Stoolmiller, 1999; Stoolmiller et al., 2000; Trem-blay et al., 1991). Several studies have now demonstrated thataggressive behavior can be reduced by altering the social environ-ments at school (Farrell & Meyer, 1997; Gottfredson, 1997;Greenberg, Kusche, Cook, & Quamma, 1995; Grossman etal.,1997; Reid et al., 1999; Stoolmiller et al., 2000), particularly byemphasizing rewards and praise for prosocial behavior (CPPRG,1999; Walker et al., 1995) and improving social competence(Hawkins, Catalano, Kosterman, Abbott, & Hill, 1999; O’Donnell,Hawkins, Catalano, Abbott, & Day, 1995) while reducing cues thatmight increase hostility (Lochman & Dodge, 1994).
The Good Behavior Game (GBG) is one type of school-basedprevention program that has established clear evidence of reducedaggressive behavior and other forms of child and adolescent prob-lem behavior such as tobacco use and poor academic achievement(Kellam & Anthony, 1998; Kellam, Ling, Merisca, Hendricks, &Ialongo, 1998; Salend, Reynolds, & Coyle, 1989). The GBG usesclassroom behavior management as the primary means of reducingaggression and problem behavior. Student teams are rewarded byteachers if no member of a team exhibits undesirable behaviorswhile engaged in game sessions. Teachers begin by rewardingteams with tangible reinforcers and then gradually move to lesstangible rewards.
The Linking the Interests of Families and Teachers (LIFT)program has also used the GBG as a core element of a 10-weekuniversal preventive intervention strategy to reduce aggression andincrease social competence (Reid et al., 1999; Stoolmiller et al.,2000). The overall intervention consisted of parent training, theGBG program, and systematic communication between teachersand parents. The intervention had immediate and significant ef-fects on physical aggression among students on the playground aswell as some impact on increased child social competence. Exam-ination of the LIFT program outcomes has also shown strongdifferential effects of treatment, with children highest on aggres-sion at baseline benefiting the most from the intervention (Reid etal., 1999; Stoolmiller et al., 2000). These short-term and differen-tial effects on aggression are important to consider given thepressure to demonstrate significant behavior change with relativelybrief school-based interventions.
Another program of research has been conducted by the Con-duct Problems Prevention Research Group (CPPRG, 1999). TheCPPRG has implemented and evaluated the Fast Track preventiontrial for conduct problem behavior for elementary school childrenat high risk for long-term antisocial behavior. Fast Track is adevelopmentally based, long-term multicomponent and multisiteintervention that has been evaluated using a randomized designwith a nonintervention control group. After 1 year of intervention(from kindergarten to Grade 1), the group found moderate positiveeffects on children’s social competence and conduct problems,including child aggressive behavior, for children in the interven-tion schools compared with children in the control group.
293SPECIAL ISSUE: VIOLENCE PREVENTION

Several other programs of research have demonstrated childbehavior change in the areas of improved social competence orreductions in aggressive behavior in the classroom or on theplayground (e.g., Grossman et al., 1997; Hawkins et al., 1999;Tremblay et al., 1995; also see Thornton et al., 2000; USDHHS,2001). In the current study, we sought to expand on these studiesby examining the effects of an early elementary-school-baseduniversal preventive intervention program called PeaceBuilders.This program attempts to alter individual child behavior—in par-ticular, to reduce aggressive behavior and increase social compe-tence—by changing the culture or climate of an entire school.There is some evidence that PeaceBuilders affects the incidence ofassault-related and violent injury. Specifically, Krug and col-leagues (Krug, Brener, Dahlberg, Ryan, & Powell, 1997) foundthat the frequency of injuries due to fighting for children in GradesK–5 whose schools were randomized to PeaceBuilders did notincrease over a 1-year period, although the incidence of injuriesdue to fighting for children in control schools increased 56% overthe same period. Although these are meaningful archival data, wereport here on teacher and child self-reports of social competenceand aggression, which have high predictive value for long-termprevention efforts (CPPRG, 1999; Tolan et al., 1995; Tremblay etal., 1995; Vazsonyi, Vesterdal, Flannery, & Belliston, 1999;Walker et al., 1995). School is a logical public health setting forchanging the cognitive, social, and imitative characteristics ofchildren at risk for violence. For example, schools can be thoughtof as large antecedent and reinforcement systems that can increaseor decrease antisocial and prosocial behavior (Mayer & Sulzer-Azaroff, 1990). We still lack consistent evidence of whether arelatively low-cost, widely implemented universal preventive in-tervention approach in the early elementary grades will lead tosignificant and sustainable behavior change.
The PeaceBuilders Program
PeaceBuilders is a universal school-wide violence preventionprogram for elementary schools (Grades K–5) implemented by allstaff and students in a school (Embry, Flannery, Vazsonyi, Powell,& Atha, 1996). PeaceBuilders focuses on individual behaviorchange in proximal interpersonal and social settings (Tolan &Guerra, 1994). The program incorporates an ongoing, long-termstrategy to alter the climate and culture of the entire school (Embry& Flannery, 1999; Embry et al., 1996; Flannery, 1997). Theintervention is purposely woven into the school’s everyday routinerather than presented as a time- or subject-limited curriculum.Thus, PeaceBuilders is not offered as a set number of sessions orhours per week but includes activities that can be implemented ona daily basis in any classroom by any teacher or staff person.Specifically, PeaceBuilders attempts to change characteristics ofthe setting (antecedents) that trigger aggressive, hostile behavior,and it increases the daily frequency and salience of both live andsymbolic prosocial models. If there are more prosocial cues andmodels in a school and these behaviors are consistently reinforcedand rewarded, then over time, child social competence will in-crease and the frequency and intensity of aggressive behaviors willdecline. PeaceBuilders specifically rewards prosocial behaviorsand provides strategies to avoid the differential or accidentalreinforcement of negative behaviors and conflict that sometimeshappens with conflict mediation programs (Webster, 1993).
All children and staff in a school learn five simple rules via acommon language, which makes the intervention easy to learn andmaintain: (a) praise people, (b) avoid put-downs, (c) seek wisepeople as advisers and friends, (d) notice and correct hurts wecause, and (e) right wrongs. To help students learn these principles,PeaceBuilders includes (a) daily rituals related to its language andprinciples that are meant to foster a sense of belonging; (b) cuesand symbols that can be applied to diverse community settings; (c)specific prompts to “transfer” across people, behaviors, and time;and (d) new materials or strategies introduced for times andcircumstances when positive behavior might otherwise decay (Em-bry, 1980; Embry et al., 1996; Stokes & Baer, 1977).
For example, staff and students are encouraged to use “praisenotes” to pay attention to and reinforce positive, prosocial behaviorin the classroom, at school, and at home. “Peace feet” might beplaced by the drinking fountains to encourage children not to cutin line while waiting their turn, and students are sometimes sent tothe principal for kind acts or good deeds rather than just fordiscipline problems (principal “preferrals”). PeaceBuilder rulesand principles are prominently displayed throughout the school,and students complete activities from a specially designed comicbook in which they are the designated hero (see Embry et al.,1996). Adults more actively monitor “hot spots” in school such aslunchrooms and hallways in between activities, praising prosocialbehavior. All of these strategies and activities are geared towardcreating a positive climate and culture in the entire school, with anemphasis on reinforcement of positive behavior rather than simplythe reduction of negative behavior.
The training of teachers in the implementation of the presentintervention had several phases, including a preintervention orien-tation for all faculty and staff of the schools, a half-day trainingworkshop on the basic PeaceBuilders model, and extensive sitecoaching (on average, 2 hr per week) in the first 3 to 4 months ofthe intervention and then on an as-needed basis. All training andcoaching were conducted by the model developer (Embry et al.,1996) as a means of facilitating internal validity. Each participat-ing school also received specific in-service sessions on importantissues identified by staff (e.g., implementing activities with specialneeds children), periodic group forums to discuss successes andchallenges to implementation, and occasional 1-day institutes thatfocused on applying and creating new materials and interventions.Attendance was voluntary at the institutes and forums. Additionaldescription of program materials and training is available else-where (e.g., Embry et al., 1996).
Hypotheses
Our hypothesis was that youth aggressive behavior would bereduced by initiating prevention early in childhood and by increas-ing children’s resilience and social competence. A dual focus onreducing aggression and increasing social skills and competenciesis important because the prognosis for children with a combinationof low social competence, aggressiveness, and poor emotional andcognitive preparation is poor (CPPRG, 1999; Kellam, Mayer,Rebok, & Hawkins, 1998; Tolan et al., 1995; Weissberg & Bell,1997). We also examined the differential effectiveness of theintervention given evidence that treatment outcome effects mayvary depending on a child’s initial behavior status prior to partic-ipating in an intervention (Reid et al., 1999; Stoolmiller et al.,
294 FLANNERY ET AL.
bgrams
Highlight
bgrams
Highlight
bgrams
Highlight
bgrams
Highlight
bgrams
Highlight
bgrams
Highlight
bgrams
Highlight
bgrams
Highlight
bgrams
Highlight
bgrams
Highlight
bgrams
Highlight
2000). We examined both short-term change in aggression andcompetence (compared with controls) over the 1st year of inter-vention and longer-term change in Year 2, when all schoolsreceived intervention. Specifically, in the 1st year, we expectedthat children in the intervention-school group, compared withthose in the control-school group, would report greater improve-ments in social competence and greater reductions in aggressivebehavior. By the end of the 2 school years, when both groups werereceiving the intervention, we expected that, relative to baselinelevels, students in both conditions would exhibit significant in-creases in competence and prosocial behavior and decreases inaggressive behavior.
Method
The study protocol was approved by the Institutional Review Board forHuman Subjects at the University of Arizona in Tucson and by therespective schools’ research review committees. Parents were notified ofthe project through letters mailed to their homes and by school-distributednewsletters. Parents were given the opportunity to withdraw their childfrom any data collection. Students were also informed that their participa-tion was voluntary and were provided an opportunity for alternative class-room activities if they chose not to take part. If a student was engaged inanother activity (e.g., band class), we returned to attempt to gather infor-mation at a later date. At the time of survey administration, students wereasked to give oral assent, and questions were answered regarding theirparticipation. All students received rewards such as stickers or pencils forcompleting the surveys and interviews.
Eight elementary schools (Grades K–5) in Pima County, Arizona, wereselected from two large school districts to participate on the basis of havinghigh rates of juvenile arrests and histories of suspensions and expulsions.After we met with school administrators to discuss the purpose and scopeof the study, all schools that were initially contacted agreed to participate.Schools were located in all areas of town, including some in the central cityand others on the outskirts of town. One of the eight schools consisted ofa pair of schools in the same neighborhood, a school for Grades K–2 anda school for Grades 3–5 (approximately 1 block apart), and was treated asa single school for pairing, intervention, analysis, and discussion (School2A). All of the other schools were self-contained Grades K–5 schools. Oneschool that was randomly assigned to the delayed intervention condition(School 1B) did not gather initial baseline data but joined the study at
Time 2 in the spring of Year 1. All participating schools remained in thestudy through the first 2 intervention years.
Design and Procedure
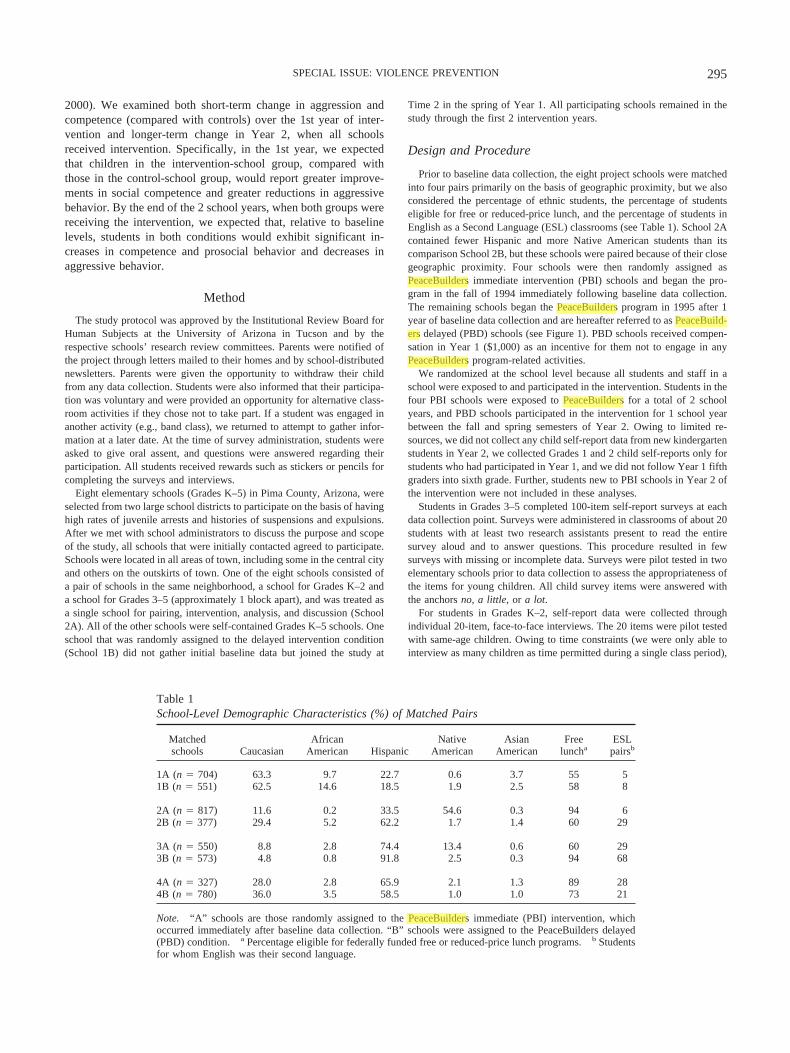
Prior to baseline data collection, the eight project schools were matchedinto four pairs primarily on the basis of geographic proximity, but we alsoconsidered the percentage of ethnic students, the percentage of studentseligible for free or reduced-price lunch, and the percentage of students inEnglish as a Second Language (ESL) classrooms (see Table 1). School 2Acontained fewer Hispanic and more Native American students than itscomparison School 2B, but these schools were paired because of their closegeographic proximity. Four schools were then randomly assigned asPeaceBuilders immediate intervention (PBI) schools and began the pro-gram in the fall of 1994 immediately following baseline data collection.The remaining schools began the PeaceBuilders program in 1995 after 1year of baseline data collection and are hereafter referred to as PeaceBuild-ers delayed (PBD) schools (see Figure 1). PBD schools received compen-sation in Year 1 ($1,000) as an incentive for them not to engage in anyPeaceBuilders program-related activities.
We randomized at the school level because all students and staff in aschool were exposed to and participated in the intervention. Students in thefour PBI schools were exposed to PeaceBuilders for a total of 2 schoolyears, and PBD schools participated in the intervention for 1 school yearbetween the fall and spring semesters of Year 2. Owing to limited re-sources, we did not collect any child self-report data from new kindergartenstudents in Year 2, we collected Grades 1 and 2 child self-reports only forstudents who had participated in Year 1, and we did not follow Year 1 fifthgraders into sixth grade. Further, students new to PBI schools in Year 2 ofthe intervention were not included in these analyses.
Students in Grades 3–5 completed 100-item self-report surveys at eachdata collection point. Surveys were administered in classrooms of about 20students with at least two research assistants present to read the entiresurvey aloud and to answer questions. This procedure resulted in fewsurveys with missing or incomplete data. Surveys were pilot tested in twoelementary schools prior to data collection to assess the appropriateness ofthe items for young children. All child survey items were answered withthe anchors no, a little, or a lot.
For students in Grades K–2, self-report data were collected throughindividual 20-item, face-to-face interviews. The 20 items were pilot testedwith same-age children. Owing to time constraints (we were only able tointerview as many children as time permitted during a single class period),
Table 1School-Level Demographic Characteristics (%) of Matched Pairs
Matchedschools Caucasian
AfricanAmerican Hispanic
NativeAmerican
AsianAmerican
Freeluncha
ESLpairsb
1A (n � 704) 63.3 9.7 22.7 0.6 3.7 55 51B (n � 551) 62.5 14.6 18.5 1.9 2.5 58 8
2A (n � 817) 11.6 0.2 33.5 54.6 0.3 94 62B (n � 377) 29.4 5.2 62.2 1.7 1.4 60 29
3A (n � 550) 8.8 2.8 74.4 13.4 0.6 60 293B (n � 573) 4.8 0.8 91.8 2.5 0.3 94 68
4A (n � 327) 28.0 2.8 65.9 2.1 1.3 89 284B (n � 780) 36.0 3.5 58.5 1.0 1.0 73 21
Note. “A” schools are those randomly assigned to the PeaceBuilders immediate (PBI) intervention, whichoccurred immediately after baseline data collection. “B” schools were assigned to the PeaceBuilders delayed(PBD) condition. a Percentage eligible for federally funded free or reduced-price lunch programs. b Studentsfor whom English was their second language.
295SPECIAL ISSUE: VIOLENCE PREVENTION
bgrams
Highlight
bgrams
Highlight
bgrams
Highlight
bgrams
Highlight
bgrams
Highlight
bgrams
Highlight

we randomly preselected 50% of students in each kindergarten, first-grade,and second-grade class to be interviewed. Individual interviews, whichtook about 5–8 min to complete, were conducted at a table outside of thechild’s classroom in a quiet area. In Grades K–2 in the participatingschools, the classes averaged about 20 students per classroom. By ran-domly preselecting half, we were attempting to target about 10 students perclass. Although there were no refusals of children in Grades K–2 toparticipate, on average we were able to complete 8 interviews per class, foran effective participation rate of 80%. Reasons for not interviewing all 10children included the following: Students were absent on the day of datacollection; students were engaged in an alternative school activity duringthe time interviews were conducted (e.g., band class), or we ran out of time.Limited time and resources precluded our being able to interview childrenat a later date. Self-report interviews in Year 2 were conducted only foravailable students who were interviewed in Year 1. Teachers continued toreport via surveys on all kindergarten, first-, and second-grade children intheir classrooms.
At the time of each data collection, teachers of children in Grades K– 5completed a 45-item instrument for each student in their classes. Teachersprovided written consent prior to participation. For Grades 3–5, bothstudents and teachers answered questions on bubble scan sheets thatcontained preassigned identification codes for data-tracking purposes. Nonames appeared on student data collection instruments. The preassigned IDcode allowed us to distribute numbered surveys to specific students on theday of data collection as well as to link student and teacher data over time.All student and teacher surveys were available in both English and Spanish.Schools received compensation for their general funds depending on thepercentage of teachers who completed surveys (e.g., $300 for 90% teacherparticipation).
Sample
On average, students across the 2 years examined were mostly Hispanic(51%), followed by Caucasians (28%), Native Americans (13%), AfricanAmericans (6%), and Asian Americans (1.5%). Seventy-one percent (n
� 1,101) of students reported that “Mom” took care of them the most, 15%reported “Dad,” 7% reported some other relative, and 2% each reported astepparent or some other adult. According to parent reports at Time 2 (n �809), 63% of children lived in homes with both parents present, 16% werefrom mother-only homes, and 12% lived with “one parent and otheradults.” Parent reports of household incomes, although based on a sub-sample of our families, were evenly distributed among the lower range ofsocioeconomic groups: 22% reported an annual household income of$7,000 or less; 19%, an income between $7,000 and $15,000; 24%, anincome between $15,000 and $25,000; 23%, an income between $25,000and $40,000; and 12%, an income greater than $40,000 per year. Themajority of our parents had completed the equivalent of high school or less:15% completed less than ninth grade; 12% completed less than highschool; 28% completed high school; 38% completed some college; and 7%completed 4 or more years of college. Compared with 1990 U.S. Censusdata, our sample was similar to the population of the metropolitan area(Pima County, AZ) on family composition, household income, and parentlevel of education. The only exception was for child ethnicity. In general,our sample comprised higher percentages of minority children (and thusfewer Caucasians) than were in the greater metropolitan area from whichthe sample was drawn.
Student and teacher sample sizes are reported in Figure 2. Studentresponse rates ranged from 86% to 93%, and teacher response rates from75% to 86%. Fewer than 1% of parents chose to withdraw their child fromany of the data collections. Similarly, fewer than 1% of children availableat each data collection time refused to complete a survey or interview,usually citing disinterest.
Variables and Instrumentation
Demographic variables. Demographic information gathered from stu-dents included age, gender, and grade in school. Teachers reported onchildren’s ethnicity by categorizing them into one of six groups: Hispanic,Caucasian, Native American, African American, Asian American, andother.
Figure 1. Overview of project design, data collection, and intervention schedule.
296 FLANNERY ET AL.

Aggressive behavior. Teachers reported on child aggressive behaviorusing items adapted from the Aggressive Behavior subscale of Achen-bach’s (1991) Teacher Report Form (TRF). The TRF has been usedextensively as both a clinical screening instrument and in large surveyresearch to assess child externalizing behavior problems (Achenbach,
1991; Grossman et al., 1997). The 25-item Aggressive Behavior subscaleasks teachers to rate child behavior on a 3-point scale in which 0 � nottrue, 1 � somewhat or sometimes true, and 2 � very true or often true. Theitems demonstrated high internal reliability (� � .95 at baseline) in oursample.
Figure 2. Student and teacher sample sizes at each data collection point. The unit of randomization was theschool. aOf the children selected to be sampled, only 50% of the students in Grades K–2 were targeted toparticipate in the child self-report portion of the study.
297SPECIAL ISSUE: VIOLENCE PREVENTION

Child self-report of aggressive behavior in Grades 3–5 was assessedusing items generated specifically for this study. The 9-item scale con-tained items such as “I hit someone” or “I put down other kids” that wererated on a 3-point scale ranging from no (1) to a lot (3). The scaledemonstrated adequate internal consistency (� � .86 at baseline). Childrenin Grades K–2 answered yes or no to five items assessing whether they gotinto trouble at school, if they ever got into fights, and if they ever cut in line(� � .66 at baseline).
Social competence. Teachers rated child social competence using theelementary school version (Grades K-6) 19-item short form of the Walker–McConnell (W-M) Scale of Social Competence and School Adjustment(Walker, Irvin, Noell, & Singer, 1992; Walker & McConnell, 1995). TheW-M scale has three subscales: School Adjustment (7 items), Peer-Preferred Behaviors (7 items), and Teacher-Preferred Behaviors (5 items).The School Adjustment subscale assesses adaptive social–behavioral com-petencies highly valued by teachers within classroom instructional con-texts. Peer-Preferred Behaviors reflect peer values concerning forms ofsocial behavior that govern peer dynamics and social relations withinfree-play settings. Teacher-Preferred Behaviors reflect teacher ratings ofsensitivity, empathy, cooperation, self-control, and socially mature formsof behavior in peer relations. Teachers responded to such items as “appro-priately copes with aggression from others” on a 5-point Likert scaleranging from never (1) to frequently (5). The W-M scale has demonstratedhigh internal consistency and test–retest reliability and correlates withother teacher and child self-report measures of social competence (Walker& McConnell, 1995). In the present sample, the internal consistency of theW-M scale was high (� � .95 at baseline). The W-M scale has been usedin other preventive intervention studies with elementary-school-age chil-dren to differentiate behavior outcomes between treatment groups (e.g.,Reid et al., 1999).
Prosocial behavior. Prosocial behavior for children in Grades 3–5 wasmeasured with a 16-item instrument designed for this study. The itemsassessed child self-reported empathy, caring, helpfulness, and support ofothers. Sample items include “I helped adults at school without beingasked” and “I helped other kids.” Children responded to each item using a3-point scale that included no (1), a little (2), and a lot (3). The scale itemsloaded on a single factor (eigenvalue � 6.34) and displayed high internalconsistency (� � .92 at baseline). Children in Grades K–2 answered yes,sometimes or no, not really to six questions assessing sharing, helpfulness,saying “thank you,” and saying “I’m sorry” (� � .51 at baseline).
Peace-building behavior. Child self-report of peace-building behaviorin Grades 3–5 was assessed with three items: “I helped build peace atschool,” “I told other kids they were peace builders,” and “I earned rewardsfor peace building.” Responses on the 3-point scale ranged from no to a lot.The three items loaded on a single factor (eigenvalue � 1.86) and dem-onstrated adequate internal consistency (� � .72 at baseline). Children inGrades K–2 responded yes or no to four items about building peace suchas “I helped build peace at school” and “I earned rewards for peacebuilding.” This yes/no scale demonstrated marginal internal consistency(� � .58 at baseline).
Teacher training. Immediately after teachers participated in an in-service training session, workshop or institute, they completed a 10-itemsurvey designed to assess the clarity and effectiveness of the training andtheir impressions of whether the materials and program would be easy ordifficult to implement. Sample items, rated on a 5-point scale ranging fromstrongly agree to strongly disagree, included “The basic philosophy behindPeaceBuilders is easy to understand”; “The training provided for theprogram was clear, effective and easy to follow”; and “As an interventionprogram, PeaceBuilders will be difficult to implement.”
Implementation and fidelity. In the spring of Year 2 (Time 4), teacherscompleted an 8-item survey that assessed their use and implementation ofprogram materials. Some items assessed frequency of use, such as “I usethe PeaceBuilders curriculum in my classroom” answered on a 5-pointscale including daily (1), occasionally (3), and not at all (5). Other items
assessed degree of satisfaction or effectiveness of the program, such as“PeaceBuilders is easy to use” or “Overall, my school has implemented thePeaceBuilders curriculum,” answered on a 4-point scale ranging fromstrongly agree (1) to strongly disagree (4). Teachers were also asked toindicate the total number of core PeaceBuilders materials they used in theirclassrooms. These included the Action Guide, reproducible binders (sep-arate lessons on PeaceBuilders rules), the “I Help Build Peace” storybook,praise notes in class, praise notes sent home, “First Aid for Anger,” thePlayground Guide, and the Intensive PeaceBuilders Guide.
Analysis Plan
After presenting correlation data on the relationship between teacher-and child-reported outcomes, we provide some descriptive data on the levelof program implementation and teacher training. We then present data onsample attrition within and between school years and its relation to internalvalidity (differential attrition by intervention group) and external validity(characteristics lost to the sample). Then we turn to our main analyticquestions of year-to-year differences in the immediate and delayed inter-ventions’ effects on our outcomes of interest. We conducted two maintypes of analyses to address our specific hypotheses regarding school-yearchanges in behavior outcomes relative to baseline.
First, we constructed a three-level hierarchical linear model (Version 5,Bryk & Raudenbush, 1992) to examine change in behavior assessed at fourpoints in time over 2 school years. The three levels of the model reflectchange over time (Level 1), individual effects (Level 2), and school effects(Level 3). The model was constructed to examine both short-term (Year 1)and longer term (Year 2) change in outcomes after controlling for baselinelevels and student gender. Because there was not continuous interventionover the summer months, we decided to model our effects by creating aseries of dummy variables for each data collection time point (Neter,Wasserman, & Kutner, 1983), with baseline as the reference (spring ofYear 1 � Time 2, fall of Year 2 � Time 3, spring of Year 4 � Time 4).Specifically, we first examined change from baseline to the spring semester(Time 2) in Year 1 for PBI schools and PBD schools. We also examineddifferences in Year 2 between schools with 2 years of intervention (PBIschools) and schools with 1 year of intervention (PBD schools). In PBIschools, we expected the most significant changes to occur at Time 2,after 1 year of intervention.
Hierarchical linear modeling (HLM) has several advantages for theanalysis of longitudinal data. First, responses on any outcome variablefrom the same individual over time will be correlated, thus violating theassumption about independent sample observations embedded in moststatistical models dealing with cross-sectional data, and HLM takes thiscorrelation into account. This intraclass correlation also needs to be takeninto account when school is used as the unit of assignment to condition(Koepke & Flay, 1989; Murray & Wolfinger, 1994; Piper, Moberg, &King, 2000; Rooney & Murray, 1996). Second, when applying conven-tional linear models to analyzing longitudinal data, one generally under-estimates the standard errors of the impacts and therefore may erroneouslyassume statistical significance. HLM effectively handles this problem aswell as others inherent in longitudinal data, such as varying times betweenobservations, unequal groups at each data point over time, and the need tocontrol for the effects of potentially confounding independent variables(Bryk & Raudenbush, 1992; Diggle, Liang, & Zeger, 1994; Lindsey,1993). These advantages make HLM more appropriate than the moreconventional repeated measures analyses used in longitudinal studies.
The second main analytic approach was a differential analysis on Year 1baseline to Time 2 data for all outcome variables. Because of our delayedintervention model, Year 1 was the only period in which we had interven-tion schools compared with nonintervention schools. Our analytic proce-dure followed the protocol developed by Stoolmiller et al. (2000) andexamined the extent to which intervention effectiveness depended on anindividual’s initial (baseline) status on an outcome of interest.
298 FLANNERY ET AL.
bgrams
Highlight
bgrams
Highlight
bgrams
Highlight
bgrams
Highlight
bgrams
Highlight
bgrams
Highlight
bgrams
Highlight
bgrams
Highlight

Although we expected some gender differences between students atbaseline (e.g., boys being more aggressive, girls being more sociallycompetent), we did not expect differences on outcomes between schools atbaseline. In general, we expected the PBI and PBD schools to be signifi-cantly different at Time 2 (spring of Year 1) and perhaps at Time 3 (fall ofYear 2) because PBD schools would have just begun their interventions.We expected that the PBI and PBD schools might be significantly differentfrom each other at Time 4 (spring of Year 2), although we expected allscores at Time 4 to reflect improvement (e.g., in social competence) ordecline (e.g., in aggressive behavior) relative to baseline.
Results
Zero-Order Correlations Among Outcome Variables
In preliminary analyses, we examined the zero-order correla-tions among outcome variables.1 The two main outcomes of in-terest, child social competence and aggression, were significantlyrelated; teacher-rated aggression was negatively related to teacher-rated social competence, r(1613) � �.56, p � .001, at baseline.This relationship was largely unchanged over the four data collec-tion points, and the correlation ranged from �.55 to �.66. Forchildren in Grades K–2, there were small to moderate relationshipsat baseline between child self-reported prosocial behavior andaggression, r(650) � �.03, ns; between aggression and peace-building behaviors, r(650) � �.08, p � .05; and between proso-cial and peace-building behaviors, r(650) � .25, p � .001. Forself-reports of children in Grades 3–5, the strongest relationshipwas between peace building and prosocial behavior, r(1879) �.69, p � .001. Relationships between aggressive behavior andprosocial behavior, r(1886) � �.23, p � .001, and between peacebuilding and aggressive behavior, r(1879) � �.13, p � .001, werenot as strong. Teacher reports of aggression were related to childself-reports of aggression at baseline, r(1316) � .34, p � .001, butrather modestly given the large sample size. The correlationsbetween age and most outcome variables were statistically signif-icant but weak, ranging from r(674) � .01, ns for child self-reportsof peace-building behavior to r(1878) � �.25, p � .001 for childself-reports of prosocial behavior in Grades 3–5. Correlations atbaseline between age and social competence and between age andaggression were significant but low, averaging .08 ( p � .01).
Teacher Satisfaction With Training
All regular and special education teachers in participatingschools participated in the half-day workshops (n � 194). Overthe 2 years of intervention, training questionnaires were gatheredfrom a total of 134 teachers (69%), 57 of whom were from PBIschools (43%) and the remainder of whom (n � 77) were fromPBD schools. Overall, 93% of teachers indicated they “stronglyagreed” or “agreed” that the basic philosophy behind the Peace-Builders intervention was easy to understand. Seventy-seven per-cent agreed or strongly agreed that the training provided was clear,effective, and easy to follow, and 83% agreed or strongly agreedthat the ideas would be easy to use in the classroom. Three of fourteachers who completed surveys believed that “PeaceBuilders willbe very successful as an intervention” and strongly agreed oragreed that “The school administration stands behind this inter-vention effort 100 percent.”
Level of Implementation and Fidelity
A total of 190 teachers (98%) completed a spring 1996 (Time 4)self-assessment of their use of intervention materials in theirclassrooms. Teachers completing the survey were distributedacross all participating schools and grades and represented allparticipating teachers of Grades K–5 in each school. Teacherswere equally divided between immediate- and delayed-intervention schools. The majority of teachers surveyed indicatedthat they used the PeaceBuilders curriculum in their classrooms ona daily (48%) or weekly (32%) basis. Nearly all teachers (98%)strongly agreed or agreed that “Overall, my school has imple-mented the PeaceBuilders curriculum,” 53% rated implementationas “extensive,” and 43% rated implementation as “moderate.”Teachers were also consistent in their agreement that the interven-tion “has decreased the level of violence in our school” (94%) and,conversely, that “PeaceBuilders has increased prosocial interac-tions in my class and in our school” (94%). Regarding the totalnumber of program materials used, teachers reported, on average,that they used at least four of the eight core sets of materials intheir classrooms. Teachers in the PBD schools reported, more thandid teachers in the PBI schools, that during Year 2 they were morelikely to use program materials daily (compared with weekly),�2(4, N � 190) � 14.64, p � .01.
Attrition
We first calculated attrition within each intervention year (frombaseline to Time 2 in Year 1 and from Time 3 to Time 4 in Year2) and between Years 1 and 2 to determine rates of attrition and todetermine whether there was differential attrition by interventiongroup. We also examined differences in outcomes between stu-dents with baseline-only data and those with baseline data plus atleast one additional data point over the 2-year period. In a secondset of analyses, we examined demographic characteristics relatedto attrition between PBI and PBD schools. Finally, we examinedour two main outcomes of interest, teacher-rated social compe-tence and aggression, to determine whether children lost from thesample after baseline were different from those children whoremained part of the sample. All attrition analyses on outcomeswere conducted separately for the Grades K–2 and Grades 3–5samples.2
Within each intervention year, the average rate of attrition (falldata but no spring data) was 12% in Year 1 and 17% in Year 2.Between-years attrition was 32% for students in Grades K–2 (331of 1,037 students) and 28% for students in Grades 3–5 (231 of
1 These zero-order correlations do not take into consideration intragroupcorrelation among students within classes and therefore serve only adescriptive and exploratory purpose.
2 To corroborate our attrition analyses, we also conducted logistic re-gressions with attrition status as the outcome variable. We ran regressionswith grade, gender, intervention-group membership, Grades K–2 teacher-rated social competence and aggression, as well as Grades 3–5 teacher-rated social competence and aggression as independent variables. Theresults of these regression analyses were consistent with the analysis ofvariance and chi-square results reported here. To control for possiblevariation due to grade or gender, we also ran regressions controlling forthose variables, and the results remained the same.
299SPECIAL ISSUE: VIOLENCE PREVENTION
bgrams
Highlight
bgrams
Highlight
bgrams
Highlight
bgrams
Highlight

814). We did not include new kindergarten students in Year 2, nordid we track Year 1 fifth-grade students into Year 2. For allstudents assessed at baseline, 169 (10%) of 1,615 students (GradesK–2) and 120 (9.5%) of 1,140 students (Grades 3–5) had no otherdata over the 2-year period.
Students in Grades K–2 with baseline-only data (those lost toattrition) were rated by teachers at baseline as more aggressive,F(1, 1612) � 11.05, p � .01, and less socially competent, F(1,1611) � 7.09, p � .01, than were students who remained part ofthe study sample. Students in Grades 3–5 with baseline-only datawere also rated by their teachers as more aggressive, F(1,1258) � 14.70, p � .01, and less socially competent, F(1,1258) � 13.60, p � .01, than were students who remained partof the study sample. Rates of attrition from baseline were notsignificantly different by gender, grade, or intervention-groupmembership for either children in Grades K–2, �2(1, N� 1,615) � 0.804, p � .05, or children in Grades 3–5, �2(1,N � 1,260) � 0.389, p � .05.
Behavior Outcomes
HLM was our main analytic approach to examining school-leveleffects. We used a three-level hierarchical linear model, with thefirst level representing change over time, the second level repre-senting individual student differences (gender), and the third levelrepresenting differences between schools. The model examineddifferences between schools after controlling for baseline levels ofbehavior (�0ij) and gender. The Level 1 model was specified as
Yhij � �0ij � �1ijT2 � �2ijT3 � �3ijT4 � ehij.
The Level 2 model was specified as
�0ij � �00j � �01jMALE � r0ij
�1ij � �10j
�2ij � �20j � r2ij
�3ij � �30j � r3ij.
The Level 3 model was specified as
�00j � �000 � �001PBI � u00j
�01j � �010
�10j � �100 � �101PBI
�20j � �200 � �201PBI
�30j � �300 � �301PBI.
�0ij represents the intercept or baseline. T2 represents datacollected in the spring of Year 1 (Time 2), T3 represents datacollected in the fall of Year 2 (Time 3), and T4 represents datacollected in the spring of Year 2 (Time 4). The Level 1 error term,ehij, is assumed to be normally distributed with a zero mean and aconstant variance. At Level 2, MALE is the dichotomous gendervariable equal to 1 if the child was a boy and 0 if the child was agirl. The Level 2 random effects r0ij, r2ij, and r3ij are assumed to benormally distributed with a zero mean and a constant variance. Thevariable PBI represents the PeaceBuilders immediate intervention
(as opposed to the delayed intervention, or PBD). Adding the errorterm (u00j) to the intercept equation at the school level (Level 3)takes into account the autocorrelation within schools—namely, thenonindependence of students within a school.
In determining the specification of our model, we followed therecommendation of Snijder and Bosker (1999) by first testing thesignificance of random effects in our models. The models withsignificant random effects were then compared using Akaike’sinformation criterion (AIC) and Schwarz’s Bayesian criterion(SBC). These criteria measure whether specifying additional ran-dom effects improves fit if the models under comparison have thesame structure of fixed effects. A larger value of AIC or SBC is anindication of better fit (Littell, Milliken, Stroup, & Wolfinger,1996; see also Guo & Hussey, 1999). The model with the randomspecification above emerged most consistently as the model withthe largest likelihood function, and the best fit to the data, com-pared with all the other models that we explored.3
The fixed effects presented in Tables 2 and 3 illustrate semestereffects that reflect differences (not taking into account other fac-tors such as intervention) on outcomes over time. Individual ef-fects reflect Level 2 gender differences at baseline, and the schooleffects reflect differences between PBI and PBD schools at base-line. As shown in Tables 2 and 3, the random effects are statisti-cally significant, which indicates that specifying such extra hetero-geneity to control for intragroup correlation is necessary. Schooleffects reflect baseline differences in outcomes between PBI andPBD schools. The Level 3 effects are Semester � School interac-tion effects. These results show, after controlling for baseline(Level 1) and gender (Level 2), how immediate-interventionschools compared with delayed-intervention schools on the out-comes of interest at each subsequent point in time: spring of Year 1(Time 2), fall of Year 2 (Time 3), and spring of Year 2 (Time 4).
To address the issue of floor effects in the aggression scales, welog-transformed aggression scale scores for both teacher and childreports (Cohen & Cohen, 1983; cf. Stoolmiller et al., 2000). Forexample, at baseline, for Grades K–2 and Grades 3–5 teacher-reported aggression, teachers identified 33% and 37% of the chil-dren, respectively, as not engaging in any aggressive behavior. Atbaseline, for Grades K–2 and Grades 3–5 child self-reported ag-
3 To determine the best Level 2 random effects specification for ourmodel, we ran all possible permutations of random effects for all 10 of theoutcome variables. Following the recommendation of Snijder and Bosker(1999), we started by testing the significance of random effects in ourmodels. We found two models had significant random effects for most ofthe outcome variables. Model A (the model we used) had significantrandom effects for nine of the outcome variables, and Model B (with onlyone random effect at Level 2 for the intercept) had significant randomeffects for all 10 of the outcome variables. To determine which modelprovided a better fit to the data, we then compared the models using theAIC and the SBC. For example, for Grades K–2 teacher-rated competence,for Model A, AIC � �20,936 and SBC � �20,943, and for Model B,AIC � �21,077 and SBC � �21,072. Model A had consistently largerAIC and SBC values than Model B for all 10 outcome variables. Thus,Model A emerged most consistently as the model with the largest likeli-hood function, and the best fit to the data, compared with all the othermodels that we explored. However, for one of the outcome variables,Grades K–2 child-reported peace-building behavior, we used Model B,because two of the random effects at Level 2 for Model A were notsignificant.
300 FLANNERY ET AL.
bgrams
Highlight

Table 2Hierarchical Linear Modeling Results: Teacher Ratings of Child Social Competence andAggressive Behaviors
Fixed effects
Coefficients (standard errors)
Kindergarten–2nd gradeteacher ratings
3rd–5th gradeteacher ratings
Socialcompetence
Logaggression
Socialcompetence
Logaggression
Semester effectsBaseline 72.12*** (1.25) 1.49*** (.008) 73.28*** (0.94) 1.46*** (.007)Spring Year 1 2.52*** (0.51) �0.013** (.004) 1.39** (0.49) 0.020*** (.004)Fall Year 2 0.31 (0.75) �0.017** (.006) �0.08 (0.69) 0.005 (.005)Spring Year 2 2.24** (0.78) �0.011† (.006) �0.12 (0.66) 0.009† (.005)
Individual effectsGender: boy (Reference:
girl)�7.12*** (0.57) 0.061*** (.005) �7.22*** (0.53) 0.070*** (.004)
School effects (baseline)PBI (Reference: PBD) 2.27 (1.77) �0.034* (.010) 0.94 (1.18) 0.006 (.010)
Semester � School interactioneffects
Spring Year 1 � PBI 3.05*** (0.66) 0.006 (.005) 1.06† (0.62) 0.017** (.005)Fall Year 2 � PBI 8.20*** (1.08) �0.014† (.008) 4.98*** (0.95) �0.026*** (.007)Spring Year 2 � PBI 7.17*** (1.10) �0.009 (.008) 6.24*** (0.88) �0.019** (.007)
Random effects varianceLevel 2, r0ij 157*** .011*** 162*** .012***Level 2, r2ij 134*** .009*** 146*** .004***Level 2, r3ij 138*** .008*** 84.6*** .004***Level 3, u00j 4.66*** .000*** 1.71*** .000***
Note. PBI � PeaceBuilders immediate-intervention schools; PBD � PeaceBuilders delayed-intervention schools.† p � .10. * p � .05. ** p � .01. *** p � .001.
Table 3Hierarchical Linear Modeling Results: Child Self-Report of Aggressive, Prosocial, and PeaceBuilding Behaviors
Fixed effects
Coefficients (standard errors)
Kindergarten–2nd grade self-report 3rd–5th grade self-report
Log aggression Prosocial PeaceBuilding Log aggression Prosocial PeaceBuilding
Semester effectsBaseline 0.27*** (.01) 5.71*** (.05) 3.43*** (.06) 1.00*** (.01) 33.60*** (.58) 5.50*** (.13)Spring Year 1 �0.01 (.01) �0.05 (.05) 0.01 (.06) 0.01 (.00) �0.18 (.30) �0.32*** (.07)Fall Year 2 �0.01 (�.02) �0.05 (.06) 0.23** (.07) �0.01** (.00) 1.10** (.35) 0.71*** (.09)Spring Year 2 0.03† (�.02) �0.02 (.06) 0.17* (.10) �0.000 (.01) �1.00** (.37) 0.40*** (.09)
Individual effectsGender: boy (Reference: girl) 0.09*** (.01) �0.11** (.03) �0.11** (.04) 0.06*** (.00) �4.00*** (.26) �0.63*** (.06)
School effects (baseline)PBI (Reference: PBD) �0.02 (.02) �0.02 (.06) �0.03 (.07) �0.02 (.01) 1.40 (.78) 0.03 (.17)
Semester � School interaction effectsSpring Year 1 � PBI 0.02 (.02) 0.10 (.07) 0.19* (.08) �0.003 (.01) �0.77* (.39) 0.71*** (.10)Fall Year 2 � PBI �0.02 (.03) 0.19* (.09) 0.02 (.09) �0.001 (.01) �0.38 (.47) 0.36** (.12)Spring Year 2 � PBI �0.01 (.03) 0.19* (.08) 0.01 (.10) 0.001 (.01) �1.1* (.50) �0.11 (.12)
Random effects varianceLevel 2, r0ij .021*** .108*** .158*** .007*** 36.0*** 1.58***Level 2, r2ij .012*** .120* NA .002*** 14.4*** 1.20***Level 2, r3ij .011*** .087** NA .005*** 24.6*** 1.72***Level 3, u00ij .000 .002* .002* .000*** .947*** .044***
Note. PBI � PeaceBuilders immediate-intervention schools; PBD � PeaceBuilders delayed-intervention schools; NA � not applicable.† p � .10. * p � .05. ** p � .01. *** p � .001.
301SPECIAL ISSUE: VIOLENCE PREVENTION
bgrams
Highlight
bgrams
Highlight
bgrams
Highlight
bgrams
Highlight

gression, 31% and 44% of the students, respectively, reported notengaging in any aggressive behavior.
Baseline effects. With only one exception, students in PBI andPBD schools were not significantly different from each other atbaseline (see school effects for baseline in Tables 2 and 3).Teachers rated students in Grades K-2 in the PBI schools asslightly lower in aggressive behavior overall than students in thePBD schools (see Table 2).
As expected, there were several gender differences at baseline.Teachers rated boys as significantly lower in social competenceand higher in aggressive behavior than girls at baseline. This effectwas consistent for both students in Grades K–2 and students inGrades 3–5 (see Table 2). Child self-reports of gender differencesat baseline showed that among students in Grades K–2 and Grades3–5, boys rated themselves as significantly more aggressive, lessprosocial, and lower in peace-building behavior than did girls (seeTable 3).
Intervention effects. Given the unique design of our evalua-tion, in which the PBI schools received the intervention duringYear 1 and Year 2 but the comparison PBD schools received theintervention only during Year 2, our hierarchical linear modeloutlined above enabled us to examine the effects of the interven-tion at each data collection point (Time 2, Time 3, and Time 4)relative to baseline by examining the cross-level Semester �
School interaction effects. For example, a significant Time 2 �School interaction would indicate that, with baseline and genderdifferences controlled, the PBI schools were significantly differentfrom the PBD schools at Time 2. These effects are illustrated forsignificant outcomes in Figure 3 (teacher data) and Figure 4 (childself-report data).
Time 2. At Time 2 (spring of Year 1), compared with studentsin PBD schools, teachers rated students in PBI schools as signif-icantly higher in social competence (for Grades K–2; effects weremarginal for students in Grades 3–5, p � .10) and significantlylower in log aggression (for Grades 3–5; see Table 2 for coeffi-cients). Compared with students in PBD schools, students in PBIschools reported significantly greater peace-building behavior (forboth Grades K–2 and Grades 3–5; see Table 3 for coefficients) butself-reported less prosocial behavior (Grades 3–5).
Time 3. At Time 3 (fall of Year 2), compared with students inPBD schools, teachers rated students in Grades K–2 and Grades3–5 in PBI schools as significantly higher in social competenceand significantly lower on log aggression, although the effectswere stronger for students in Grades 3–5 ( p � .001) than for thosein Grades K–2 ( p � .10; see Table 2). Compared with students inPBD schools, students in PBI schools reported significantly greaterpeace-building behavior (Grades 3–5) and prosocial behavior(Grades K–2; see Table 3 for coefficients).
Figure 3. Means for teacher-reported social competence and aggression for PeaceBuilders immediate-intervention and PeaceBuilders delayed-intervention schools at baseline, Time 2, Time 3, and Time 4.
302 FLANNERY ET AL.
bgrams
Highlight
bgrams
Highlight

Time 4. At Time 4 (spring of Year 2), compared with studentsin PBD schools, teachers rated the students in PBI schools assignificantly higher in social competence (Grades K–2 and Grades3–5) and lower on log aggression (Grades 3–5 students only; seeTable 2 for coefficients). Compared with students in PBD schools,students in PBI schools reported significantly greater prosocialbehavior in Grades K–2 but lower prosocial behavior in Grades3–5 (see Table 3).
Differential effects. We conducted a series of linear regres-sions to examine the potential for differential effectiveness of theintervention—namely, that treatment effects would vary depend-ing on an individual student’s initial status on an outcome atbaseline. We conducted differential analyses only for Year 1 data(from baseline to Time 2) because this was the only year in whichwe had intervention (PBI) and nonintervention (PBD) comparisongroups. We conducted differential analyses on all main outcomesof interest.
Following the protocol developed by Stoolmiller et al. (2000),we conducted a linear regression of Time 2 (spring of Year 1)scores on baseline scores. We were interested in whether theregression slopes would significantly differ. If the slopes are notparallel, this is evidence that treatment effects vary according toinitial status (or that the treatment is differentially effective). For
teacher-rated dependent variables, we found significantly differentslopes for Grades 3–5 log aggression, t(1174) � 3.84, p � .001.For child self-reported dependent variables, we found significantlydifferent slopes for Grades K–2 peace-building behavior, t(649) ��2.46, p � .05; Grades K–2 prosocial behavior, t(649) � �2.48,p � .05; Grades 3–5 prosocial behavior, t(1494) � 1.97, p � .05;and Grades 3–5 aggression, t(1494) � 14.19, p � .001. There wereno differential effects for social competence, Grades K–2 teacher-reported or child self-reported aggression, or Grades 3–5 childself-reported peace-building behavior.
We can illustrate the difference on aggression by mapping theeffect sizes for aggression scores at four points: �1, 0 (mean), 1,and 2 SDs above the mean for the baseline sample. The meandifference is computed by plugging the preintervention score intothe fitted equation for both groups and then subtracting the pre-dicted intervention mean from the predicted control mean (Stool-miller et al., 2000). The obtained effect sizes for teacher-reportedGrades 3–5 log aggression were .00, .26, .52, and .78, respectively,and those for child self-reported Grades 3–5 log aggression were�.17, �.08, .02, and .12, respectively. Thus, the effect size (i.e.,treatment effect) was larger for students with higher aggressionscores at baseline.
Figure 4. Means for child self-reported peace-building and prosocial behavior for PeaceBuilders immediate-intervention and PeaceBuilders delayed-intervention schools at baseline, Time 2, Time 3, and Time 4.
303SPECIAL ISSUE: VIOLENCE PREVENTION
bgrams
Highlight
bgrams
Highlight

For peace-building and prosocial behavior, we can illustrate theeffect sizes at four points: �2, �1, 0 (mean), and 1 SD above themean, because we would expect children lower at baseline toincrease their positive behavior after intervention. The obtainedeffect sizes were .48, .27, .07 and �.13, respectively, for GradesK–2 child self-reported peace-building behavior. Similarly, forGrades K–2 prosocial behavior, the obtained effect sizes were .57,.38, .18, and �.01, respectively. For Grades 3–5 child self-reportedprosocial behavior, the obtained effect sizes were .27, .16, .05, and�.06, respectively. The effect size was larger for students withlower baseline peace-building and prosocial behavior scores, sug-gesting a bigger treatment effect for increases in positive behaviorfor students who were lower at baseline.
Discussion
This study examined the initial behavior outcomes of Peace-Builders, a universal school-based preventive intervention pro-gram focused on reducing aggressive behavior and increasingsocial competence. We examined behavior change over 1 schoolyear in which half of our randomly assigned schools receivedimmediate intervention and half received no intervention. We alsoexamined change in Year 2, when the immediate-interventionschools continued treatment and the control schools received in-tervention for the first time. In general, we found consistentbehavior effects in Year 1, with students in Grades K–2 in theimmediate-intervention schools being rated significantly higher byteachers on social competence than control students (moderateeffects were obtained for students in Grades 3–5). Third- to fifth-grade students in the immediate-intervention schools were alsorated by teachers as significantly less aggressive than students innonintervention schools. As expected, students in the immediate-intervention condition also rated themselves higher on peace-building behaviors (Grades K–5) than control students. Thesebehavior changes occurred in intervention schools during Year 1,when no significant change in behavior was observed in noninter-vention schools.
Effects for increases in social competence and declines inteacher-reported aggressive behavior were maintained for all stu-dents in Grades K–5 in immediate-intervention schools in the fallof Year 2. Higher levels of peace building (Grades 3–5) andprosocial behavior (Grades K–2) were also maintained at Time 3and at Time 4 (Grades K–2 for prosocial). At Time 4 (spring ofYear 2), students from immediate-intervention schools were stillrated higher on social competence, higher on prosocial behavior(Grades K–2), and lower on aggression (Grades 3–5) relative tostudents in delayed-intervention schools. Our overall findings areconsistent with previous studies that have demonstrated the effi-cacy of elementary-school-based universal prevention programsfor increasing social competence and reducing aggressive behavior(CPPRG, 1999; Grossman et al., 1997; Kellam, Ling, et al., 1998;Reid et al., 1999). The one trend that ran counter to expectationswas for older students’ (Grades 3–5) prosocial behavior. At bothTime 2 and Time 4, students in the immediate-intervention schoolsrated themselves as less prosocial than students in the delayed-intervention schools. In general, however, we found consistentintervention effects for social competence and aggression. Theseeffects were realized using a conservative three-level hierarchical
linear model that accounted for school-level differences and vari-ability in individual student change over time.
From a policy perspective, it is important that early preventiveintervention focus on increasing positive skills and competenciesas well as reducing aggressive and other problem behaviors. Theseskills lay the groundwork for success in school, positive adult–child and peer relations, and long-term child adjustment and resil-iency. Interventions should contain strategies specifically designedto accomplish both of these behavioral goals in order to increasethe chances of sustained behavior change over time (Mayer, But-terworth, Nafpaktitis, & Sulzer-Azaroff, 1983; Tolan et al., 1995;Tremblay et al., 1995). Developmentally, children who displayaggressive and socially incompetent behavior at school are also athigh risk for rejection by their normative peer group. This in-creases their risk of associating with other deviant or rejectedpeers, which in turn increases their risk of subsequent delinquencyand other conduct problems (CPPRG, 1999; Reid et al., 1999).
The fact that we found effects for students both in Grades K–2and Grades 3–5 also underscores the importance of providingpreventive intervention services early in elementary school. Themajority of school-based violence prevention programs are inmiddle schools (e.g., Farrell & Meyer, 1997; Orpinas, Parcel,McAlister, & Frankowski, 1995) or high schools (Howard et al.,1999), but there is ample evidence that intervening earlier inelementary school can have greater effects on both educationaloutcomes and risk behaviors than can waiting to intervene later(CPPRG, 1999; Dolan et al., 1993; Kellam & Anthony, 1998;Tremblay et al., 1995) and that early and continued intervention inthe elementary grades can help put children on a positive devel-opmental course that is maintained through high school (Hawkinset al., 1999).
This study also reinforces the need to consider the potentialdifferential effects of preventive intervention trials (Stoolmiller etal., 2000). Although we found some significant effects for allchildren exposed to the intervention, which is important for uni-versal prevention efforts (compared with targeted interventionsthat focus on high-risk youth), we also found larger treatmenteffects for youth in Grades 3–5 who were higher on aggression atbaseline. We found these differential effects for both teacher-reported and child self-reported aggression. We did not, however,see differential effects for the aggressive behavior of youngerchildren (Grades K–2) even though teacher-rated aggression ofchildren in Grades K–2 was the only significant school-leveldifference at baseline. We did find differential effects for childself-reported prosocial behavior despite finding significant de-clines overall in prosocial behavior for children in Grades 3–5.Children who were the least prosocial at baseline improved themost after 1 year of intervention. In general, effect sizes were inthe moderate range (.27–.78) for the children at highest risk atbaseline, defined here as � 2 SD above the sample mean. Effectsfor children closer to the sample mean at baseline were not asdramatic. As Battistich and colleagues (Battistich, Schaps,Watson, Solomon, & Lewis, 2000) and others (Stoolmiller et al.,2000; Vazsonyi et al., 1999) have pointed out, however, fewchildren in early elementary school have begun to show seriousconduct problems. We adjusted for low base rates of aggression inour models and still found significant effects for aggressive be-havior. Even small early differences may lead to large preventiveeffects as children mature, a position that is consistent with models
304 FLANNERY ET AL.

of the developmental progression of conduct problems and violentbehavior (CPPRG, 1999; Reid et al., 1999; Tolan et al., 1995).
Although a specific focus on variations in the fidelity of treat-ment implementation is beyond the scope of this article, we pro-vide some evidence (a) that the program was implemented asdesigned and was provided by teachers with reasonable intensity,(b) that teachers were satisfied with their training and programmaterials, and (c) that students seemed to acquire the skills thatwere emphasized as part of the school-based program (e.g., peace-building behavior). First, over 90% of teachers who responded tosurveys indicated that the philosophy behind the program was easyto understand, and over 80% believed the ideas would be easy touse in the classroom. It is extremely important that teachers un-derstand the reason they are implementing a particular curriculumor activity and the intended impact of the intervention. If thematerials are difficult to implement, few teachers will take the timeor effort to adapt them. There exist too many demands on alreadybusy teachers for them to implement complicated programs thatthey do not understand or support. It is imperative that psycholo-gists continue to evaluate the implementation and effectiveness ofscientifically based, easy-to-implement, and cost-effective preven-tion programs. Few violence prevention programs systematicallyfocus on the importance of staff training or on assessing thefidelity of program implementation (Flannery & Seaman, 2001).
Another indicator of program implementation was the surveythat teachers completed at the end of the 2nd year of intervention,when all teachers surveyed had been trained and had been imple-menting the curriculum for at least 1 school year. Nearly allteachers in project schools completed the surveys, and 8 of 10reported that they used materials in their classrooms on a regularbasis. In some ways, observed changes in peace-building behavioralso acted as a validity check that the program was being imple-mented as intended. There was also strong consensus that theprogram had been integrated at the school level. In fact, by the endof the 2nd year, both participating school districts had formallyadopted the program as part of their regular curriculum.
For two of our outcomes of interest, peace-building behaviorand prosocial behavior, the data suggest a potential “summereffect” in that students in the delayed-intervention schools self-reported a significant increase in behavior at Time 3 (fall of Year2) relative to baseline. At least two factors may explain these“spikes,” which were not realized for aggression or social compe-tence. First, most teachers in the PBD schools received trainingimmediately at the beginning of the school year (given theirinterest in implementation). Teacher and student survey data weregathered about 1 month into the fall semester, so most students inthe PBD condition had at least some initial exposure to the inter-vention. Second, peace-building and prosocial behaviors are themost intervention-specific behaviors we assessed, so an increase inchild self-reports may reflect a response to initial interventionexposure.
Several important characteristics, particularly those related tothe likelihood of observing systematic behavior change, separatePeaceBuilders from other school-based violence prevention pro-grams. First, the focus of PeaceBuilders was to alter the entireschool climate, not just individual risk factors. Second, Peace-Builders was implemented in the immediate-intervention schoolsfor a longer period than is the case for most other time- orcurriculum-limited prevention programs, and once it was imple-
mented, it was maintained over time with no prespecified end pointto the intervention. Third, PeaceBuilders focused on universalprevention with children beginning in kindergarten. Persistentbehavioral change is more likely to occur when children areyounger, the behavior is more malleable, and the intervention ismaintained over time (Tolan et al., 1995).
Conducting program evaluation on a large number of students inpredominantly urban, mobile school populations presents manyempirical and practical challenges not easily overcome. Attritioncan have an adverse impact on behavioral outcomes, especially iflongitudinal samples are not large enough to provide adequatepower to detect treatment effects over a long period of time.Attrition in our sample was not negligible, although our rates arecomparable to those of other studies conducted with higher risk,frequently mobile students and families (Hansen, Tobler, & Gra-ham, 1990).
Large-scale intervention studies also face attrition by teachers orattrition at the school level, with schools sometimes dropping outof a project. This may occur because of changes in administrators,changes in school district policy, reductions in resources, changingacademic demands (e.g., proficiency testing), or changes in teacherstaff to the point that there no longer exists a majority who arewilling to participate in training, to complete data collection in-struments, or to implement a program (e.g., CPPRG, 1999; Reid etal., 1999). Although we had no schools drop out of our study in thefirst 2 years, we did have one control school delay data collectionuntil the spring of the 1st year. There is a need to balance the gainsfrom doing large-scale preventive interventions with the limita-tions in research design and method that occur when attempting tobridge science and practice (Flannery & Huff, 1999).
Limits also exist on the extent to which one can control a child’sexposure to other school and community programs or events thatmay influence the outcome behavior being examined. We tookseveral steps to limit the cohort’s degree of exposure to theintervention. For example, PBD schools agreed not to implementthe PeaceBuilders program during the 1st year, and we removedfrom our sample children in the PBI condition in Year 2 who werenot also present in Year 1.
Methodologically, there exist significant challenges to doinglarge-scale preventive intervention work. Every school we ap-proached about participating in the project expressed a high needfor immediate intervention and was uneasy about the prospect ofeven a 1-year nonintervention period. Despite our strategy ofoffering monetary incentives to schools to remain in a 1-yearcontrol condition, it was difficult to withhold interventions fromschools that had a need for immediate help. Matters were furthercomplicated when we not only wanted to withhold intervention butalso requested detailed survey data from teachers and students.This influenced our design over the course of the multiyear lon-gitudinal study because of the absence of an ongoing noninterven-tion control or comparison group.
Another methodological challenge is presented by the increasedemphasis on school-level (i.e., climate or culture changing) pre-ventive interventions. Programs limited to a few schools maycompromise their chances of finding significant effects on behav-ior because of problems of limited sample size (e.g., the unit ofanalysis is the school rather than the individual child; see Battistichet al., 2000; Stoolmiller et al., 2000) and because individual
305SPECIAL ISSUE: VIOLENCE PREVENTION
bgrams
Highlight
bgrams
Highlight
bgrams
Highlight
bgrams
Highlight

students in a school are not independent of each other with regardto the potential effects of a universal prevention program.
Despite the limitations inherent in applied evaluation research,this project also had many strengths. The sample was large andethnically diverse and included a significant number of Hispanicand Native American children, two groups rarely sampled inlongitudinal studies of violence prevention programs. The childrenwere younger and covered a broader age range than the childrenfound in many other previous longitudinal evaluations (e.g., Gross-man et al., 1997; but see CPPRG, 1999), and the schools werefrom both urban and nonurban districts. Although our focus herewas on the first 2 years of exposure to the intervention, we havecontinued to gather outcome data from the children as they maturethrough middle school (Grades 6–8), over a 5-year period. As-sessing outcomes such as aggression, delinquent and violent be-havior, and violence exposure/victimization as a function of yearsof exposure to intervention may yield more information about theeffects of age of first exposure, developmental trajectories forsubgroups of children (e.g., high-aggressive youth with low socialcompetence vs. high-aggressive youth with high social compe-tence), or differences in program effectiveness related to childgender or history of exposure to violence (Flannery, 2000).
In sum, this evaluation of a universal preventive interventionprogram for children in Grades K–5 showed significant improve-ments in child social competence and peace-building behavior, aswell as reductions in aggressive behavior, after 1 year of interven-tion relative to students in nonintervention schools. These effectswere largely maintained in a 2nd year of intervention. It is alsoimportant to examine the differential effects of treatment on ag-gression and prosocial behavior so that one does not falsely as-sume that a universal preventive intervention failed because itlacked the power to affect the population as a whole.
References
Achenbach, T. (1991). Manual for the Teacher Report Form and profile.Burlington: University of Vermont, Department of Psychiatry.
Battistich, V., Schaps, E., Watson, M., Solomon, D., & Lewis, C. (2000).Effects of the Child Development Project on students’ drug use andother problem behaviors. Journal of Primary Prevention, 21, 75–99.
Bryk, A. S., & Raudenbush, S. W. (1992). Hierarchical linear models.Newbury Park, CA: Sage.
Cohen, J., & Cohen, P. (1983). Applied multiple regression/correlationanalysis for the behavioral sciences (2nd ed.). Hillsdale, NJ: Erlbaum.
Conduct Problems Prevention Research Group (1999). Initial impact of theFast Track prevention trial for conduct problems: I. The high-risksample. Journal of Consulting and Clinical Psychology, 67, 631–647.
Dahlberg, L. (1998). Youth violence in the United States: Major trends,risk factors and prevention approaches. American Journal of PreventiveMedicine, 14, 259–272.
Diggle, P. J., Liang, K., & Zeger, S. (1994). Analysis of longitudinal data.New York: Oxford University Press.
Dolan, L. J., Kellam, S. G., Brown, C. H., Werthamer-Larsson, L., Rebok,G. W., Mayer, L. S., et al. (1993). The short term impact of twoclassroom-based preventive interventions on aggressive and shy behav-iors and poor achievement. Journal of Applied Developmental Psychol-ogy, 14, 317–345.
Elliott, D., Hamburg, B., & Williams, K. (Eds.). (1998). Violence inAmerican schools: New perspectives and solutions. New York: Cam-bridge University Press.
Embry, D. D. (1980). Designing instructional materials for young children.New Directions for Exceptional Children, 3, 75–99.
Embry, D. D., & Flannery, D. J. (1999). Two sides of the coin: Multilevelprevention and intervention to reduce youth violent behavior. In D.Flannery & C. R. Huff (Eds.), Youth violence: Prevention, interventionand social policy (pp. 47–72). Washington, DC: American PsychiatricPress.
Embry, D. D., Flannery, D. J., Vazsonyi, A. T., Powell, K. E., & Atha, H.(1996). PeaceBuilders: A theoretically driven, school-based model forearly violence prevention. American Journal of Preventive Medicine,Supplement to 12(5), 91–100.
Englander-Golden, P., Jackson, J., Crane, K., Schwarzkopf, A., & Lyle, P.(1989). Communication skills and self-esteem in prevention of destruc-tive behavior. Adolescence, 14, 481–501.
Eron, L., & Huesmann, R. (1990). The stability of aggressive behavior—even unto the third generation. In M. Lewis & S. Miller (Eds.), Hand-book of developmental psychopathology (pp. 147–156). New York:Plenum Press.
Fagan, J., & Wilkinson, D. (1997). Firearms and youth violence. In D.Stoff, J. Breiling, & J. Maser (Eds.), Handbook of antisocial behavior(pp. 551–566). New York: Wiley.
Farrell, A., & Meyer, A. (1997). The effectiveness of a school-basedcurriculum for reducing violence among urban sixth-grade students.American Journal of Public Health, 87, 979–984.
Flannery, D. J. (1997). School violence: Risk, preventive interventions, andpolicy. New York: Columbia University and ERIC Clearinghouse onUrban Education.
Flannery, D. J. (2000, August). Longitudinal effectiveness of the Peace-Builders universal school-based violence prevention program. Paperpresented at the 108th Annual Convention of the American Psycholog-ical Association, Washington, DC.
Flannery, D., & Huff, C. R. (Eds.). (1999). Youth violence: Prevention,intervention and social policy. Washington, DC: American PsychiatricPress.
Flannery, D., & Seaman, M. (2001). Evaluating school and community-based violence prevention resource guides: What to look for, what to do.In E. Flaxman (Ed.), Evaluating school violence programs (UrbanDiversity Series No. 113, pp. 51–75). New York: Columbia University,Institute for Urban and Minority Education, and ERIC Clearinghouse onUrban Education.
Flannery, D., & Williams, L. (1999). Effective youth violence prevention.In T. Gullotta & S. McElhaney (Eds.), Violence in homes and commu-nities: Prevention, intervention and treatment (pp. 207–243). ThousandOaks, CA: Sage.
Gottfredson, D. (1997). School based crime prevention. In Preventingcrime: What works, what doesn’t, what’s promising (Report to the U.S.Congress prepared for the National Institute of Justice by L. Sherman, D.Gottfredson, D. MacKenzie, J. Eck, P. Reuter, & S. Bushway in collab-oration with members of the Graduate Program Department of Crimi-nology and Criminal Justice, University of Maryland, pp. 5-1–5-14).Washington, DC: U.S. Department of Justice, Office of Justice Pro-grams, National Institute of Justice.
Greenberg, M. T., Kusche, C. A., Cook, E. T., & Quamma, J. P. (1995).Promoting emotional competence in school-aged children: The effects ofthe PATHS curriculum. Development and Psychopathology, 7, 117–136.
Grossman, D., Neckerman, H., Koepsell, T., Liu, P. Y., Asher, K. N.,Beland, K., et al. (1997). Effectiveness of a violence prevention curric-ulum among children in elementary school: A randomized controlledtrial. Journal of the American Medical Association, 277, 1605–1611.
Guo, S., & Hussey, D. (1999). Analyzing longitudinal rating data: Athree-level hierarchical linear model. Social Work Research, 23, 258–269.
Hansen, W. B., Tobler, N. S., & Graham, J. W. (1990). Attrition insubstance abuse prevention research: A meta-analysis of 85longitudinally-followed cohorts. Evaluation Review, 14, 677–685.
306 FLANNERY ET AL.
bgrams
Highlight

Hawkins, J. D. (1995). Controlling crime before it happens: Risk-focusedprevention. National Institute of Justice Journal, 229, 10–18.
Hawkins, J. D., Catalano, R. F., Kosterman, R., Abbott, R., & Hill, K. G.(1999). Preventing adolescent health-risk behavior by strengtheningprotection during childhood. Archives of Pediatric Adolescent Medicine,153, 226–234.
Hawkins, J. D., Herrenkohl, T., Farrington, D., Brewer, D., Catalano, R.,Harachi, T., & Cothern, L. (2000, April). Predictors of youth violence(OJJDP Juvenile Justice Bulletin). Washington, DC: U.S. Department ofJustice, Office of Justice Programs, Office of Juvenile Justice andDelinquency Prevention.
Howard, K. A., Flora, J., & Griffin, M. (1999). Violence-preventionprograms in schools: State of the science and implications for futureresearch. Applied & Preventive Psychology, 8, 197–215.
Huesmann, R., Maxwell, C., Eron, L., Dahlberg, L., Guerra, N., Tolan, P.,et al. (1996). Evaluating a cognitive/ecological program for the preven-tion of aggression among urban children. American Journal of Preven-tive Medicine, Supplement to 12(5), 120–128.
Huesmann, R., & Moise, J. (1999). Stability and continuity of aggressionfrom early childhood to young adulthood. In D. Flannery & C. R. Huff(Eds.), Youth violence: Prevention, intervention and social policy (pp.73–98). Washington, DC: American Psychiatric Press.
Kachur, S. P., Stennies, G. M., Kenneth, E. P., Modzeleski, W., Stephen-son, R., Murphy, R., et al. (1996). School associated violent deaths in theUnited States, 1992 to 1994. Journal of the American Medical Associ-ation, 275, 1729–1733.
Kann, L., Kinchen, S. A., Williams, B. I., Ross, J. G., Lowry, R., Grun-baum, J. A., et al. (2000, June 9). Youth risk behavior surveillance—United States, 1999. Morbidity and Mortality Weekly Report Surveil-lance Summary (Centers for Disease Control), 49, 1–96.
Kaufman, P., Chen, X., Choy, S. P., Ruddy, S. A., Miller, A. K., Fleury,J. K., et al. (2000). Indicators of school crime and safety, 2000 (NCES2001–017/NCJ-184176). Washington, DC: U.S. Department of Educa-tion, National Center for Education Statistics and U.S. Department ofJustice, Bureau of Justice Statistics.
Kellam, S. G., & Anthony, J. C. (1998). Targeting early antecedents toprevent tobacco smoking: Findings from an epidemiologically basedrandomized field trial. American Journal of Public Health, 88, 1490–1495.
Kellam, S., Ling, X., Merisca, R., Hendricks, B. C., & Ialongo, N. (1998).The effects of the level of aggression in first grade classrooms on thecourse and malleability of aggressive behavior in middle school. Devel-opment and Psychopathology, 10, 165–185.
Kellam, S., Mayer, L., Rebok, G., & Hawkins, W. (1998). Effects ofimproving achievement on aggressive behavior and of improving ag-gressive behavior on achievement through two preventive interventions:An investigation of causal paths. In B. P. Dohrenwend (Ed.), Adversity,stress and psychopathology (pp. 486–505). New York: Oxford Univer-sity Press.
Koepke, M. D., & Flay, B. (1989). Levels of analysis. In M. T. Braverman(Ed.), New directions for program evaluation: Vol. 43. Evaluatinghealth promotion programs (pp. 75–87). San Francisco: Jossey-Bass.
Krug, E. G., Brener, N. D., Dahlberg, L. L., Ryan, G. W., & Powell, K. E.(1997). The impact of an elementary school-based violence preventionprogram on visits to the school nurse. American Journal of PreventiveMedicine, 13, 459–463.
Lindsey, J. K. (1993). Models for repeated measures. New York: OxfordUniversity Press.
Littell, R. C., Milliken, G. A., Stroup, W. W., & Wolfinger, R. D. (1996).SAS system for mixed models. Cary, NC: SAS Institute.
Lochman, J. E., & Dodge, K. A. (1994). Social-cognitive processes ofseverely violent, moderately aggressive, and nonaggressive boys. Jour-nal of Consulting and Clinical Psychology, 62, 366–374.
Loeber, R., & Farrington, D. P. (1998). Never too early, never too late:
Risk factors and successful interventions for serious and violent juvenileoffenders. Studies on Crime and Crime Prevention, 7, 7–30.
Mayer, G. R., Butterworth, T., Nafpaktitis, M., & Sulzer-Azaroff, B.(1983). Preventing school vandalism and improving discipline: A threeyear study. Applied Behavior Analysis, 16, 355–369.
Mayer, G. R., & Sulzer-Azaroff, B. (1990). Interventions for vandalism. InG. Stoner, M. R. Shinn, & H. M. Walker (Eds.), Interventions forachievement and behavior problems (pp. 559–580). Washington, DC:National Association of School Psychologists.
Mercy, J., & Potter, L. (1996). Combining analysis and action to solve theproblem of youth violence. American Journal of Preventive Medicine,Supplement to 12(5), 1–2.
Murray, D. M., & Wolfinger, R. D. (1994). Analysis issues in the evalu-ation of community trials: Progress toward solutions in SAS/STATMIXED. Journal of Community Psychology (Monograph Series, CSAPSpecial Issue), 140–155.
Neter, J., Wasserman, W., & Kutner, M. H. (1983). Applied linear regres-sion models. Homewood, IL: Richard Irwin.
O’Donnell, J., Hawkins, J. D., Catalano, R. F., Abbott, R. D., & Day, L.(1995). Preventing school failure, drug use, and delinquency amonglow-income children: Long-term intervention in elementary schools.American Journal of Orthopsychiatry, 65, 87–100.
Orpinas, P., Parcel, G. S., McAlister, A., & Frankowski, R. (1995).Violence prevention in middle schools: A pilot evaluation. Journal ofAdolescent Health, 17, 360–371.
Piper, D., Moberg, D. P., & King, M. (2000). The Healthy for Life Project:Behavioral outcomes. Journal of Primary Prevention, 21, 47–73.
Powell, K., & Hawkins, D. (Eds.). (1996). Youth violence prevention:Description and baseline data from 13 evaluation projects. AmericanJournal of Preventive Medicine, Supplement to 12(5), 1–134.
Reid, J., Eddy, J. M., Fetrow, R., & Stoolmiller, M. (1999). Description andimmediate impacts of a preventive intervention for conduct problems.American Journal of Community Psychology, 27, 483–517.
Rooney, B. L., & Murray, D. M. (1996). A meta-analysis of smokingprevention programs after adjustment for errors in the unit of analysis.Health Education Quarterly, 23, 48–64.
Rushforth, N. B., & Flannery, D. J. (1999). Role of firearms in youthviolence. In D. Flannery & C. R. Huff (Eds.), Youth violence: Preven-tion, intervention and social policy (pp. 201–230). Washington, DC:American Psychiatric Press.
Salend, S. J., Reynolds, C. J., & Coyle, E. M. (1989). Individualizing thegood behavior game across type and frequency of behavior with emo-tionally disturbed adolescents. Behavior Modification, 13, 108–126.
Satcher, D., Powell, K., Mercy, J., & Rosenberg, M. (1996). Violenceprevention is as American as apple pie. American Journal of PreventiveMedicine, Supplement to 12(5), v-vi.
Sherman, L. W., Gottfredson, D. C., MacKenzie, D. L., Eck, J., Reuter, P.,& Bushway, S. D. (1997). Preventing crime: What works, what doesn’t,what’s promising. A report to the United States Congress (NCJ 171676).Washington, DC: U. S. Department of Justice, Office of Justice Pro-grams, National Institute of Justice.
Sickmund, M., Snyder, H. N., & Poe-Yamagata, E. (1997). Juvenileoffenders and victims: 1997 update on violence. Washington, DC: U. S.Department of Justice, Office of Justice Programs, Office of JuvenileJustice and Delinquency Prevention.
Singer, M., Anglin, T. M., Song, L., & Lunghofer, L. (1995). Adolescents’exposure to violence and associated symptoms of psychological trauma.Journal of the American Medical Association, 273, 477–482.
Singer, M., & Flannery, D. J. (2000). The relationship between children’sthreats of violence and violent behaviors. Archives of Pediatrics andAdolescent Medicine, 154, 785–790.
Singer, M., Miller, D. B., Guo, S., Flannery, D. J., Frierson, T., & Slovak,K. (1999). Contributors to violent behavior among elementary andmiddle school children. Pediatrics, 104, 878–884.
307SPECIAL ISSUE: VIOLENCE PREVENTION

Snijder, T., & Bosker, R. (1999). Multilevel analysis: An introduction tobasic and advanced multilevel modeling. Thousand Oaks, CA: Sage.
Snyder, H. N. (2000). Special analyses of FBI serious violent crimes data.Pittsburgh, PA: National Center for Juvenile Justice.
Snyder, H. N., & Sickmund, M. (1999). Juvenile offenders and victims:1999 national report. Washington, DC: U. S. Department of Justice,Office of Justice Programs, Office of Juvenile Justice and DelinquencyPrevention.
Stokes, T. F., & Baer, D. M. (1977). An implicit technology of general-ization. Applied Behavior Analysis, 12, 285–310.
Stoolmiller, M., Eddy, J. M., & Reid, J. (2000). Detecting and describingpreventive intervention effects in a universal school-based randomizedtrial targeting delinquent and violent behavior. Journal of Consultingand Clinical Psychology, 68, 296–306.
Thornton, T. N., Craft, C. A., Dahlberg, L. L., Lynch, B. S., & Baer, K.(2000). Best practices of youth violence prevention: A sourcebook forcommunity action. Atlanta, GA: Centers for Disease Control and Pre-vention, National Center for Injury Prevention and Control.
Tolan, P. H., & Gorman-Smith, D. (1998). Development of serious andviolent offending careers. In R. Loeber & D. Farrington (Eds.), Seriousand violent juvenile offenders: Risk factors and successful interventions(pp. 68–85). Thousand Oaks, CA: Sage.
Tolan, P. H., & Guerra, N. G. (1994). What works in reducing adolescentviolence: An empirical review of the field. Boulder, CO: Center for theStudy and Prevention of Violence.
Tolan, P. H., Guerra, N. G., & Kendall, P. C. (1995). A developmentalperspective on antisocial behavior in children and adolescents: Towarda unified risk and intervention framework. Journal of Consulting andClinical Psychology, 63, 579–584.
Tremblay, R., Masse, B., Perron, D., LeBlanc, M., Schwartzman, A., &Ledingham, J. (1992). Early disruptive behavior, poor school achieve-ment, delinquent behavior, and delinquent personality: Longitudinalanalyses. Journal of Consulting and Clinical Psychology, 60, 64–72.
Tremblay, R., McCord, J., Boileau, H., Charlebois, P., Gagnon, C., Le-blanc, M. & Larivee, S. (1991). Can disruptive boys be helped to become
competent? Psychiatry: Journal for the Study of Interpersonal Pro-cesses, 54, 148–161.
Tremblay, R. E., Pagani-Kurtz, L., Masse, L. C., Vitaro, F., & Pihl, R. O.(1995). A bimodal preventive intervention for disruptive kindergartenboys: Its impact through mid-adolescence. Journal of Consulting andClinical Psychology, 63, 560–568.
U. S. Department of Health and Human Services. (2001). Youth violence:A report of the Surgeon General (Report prepared by the U.S. Depart-ment of Health and Human Services for the Office of the SurgeonGeneral in partnership with the Centers for Disease Control, NationalCenter for Injury Prevention and Control; the National Institutes ofHealth, National Institute of Mental Health; and the Substance Abuseand Mental Health Services Administration, Center for Mental HealthServices). Rockville, MD: U. S. Public Health Service, Office of theSurgeon General.
Vazsonyi, A. T., Vesterdal, W. J., Flannery, D. J., & Belliston, L. (1999).The utility of child self reports and teacher ratings in classifying officialdelinquency status. Studies on Crime and Crime Prevention, 8(2), 225–244.
Walker, H. M., Colvin, G., & Ramsey, E. (1995). Anti-social behavior inschools: Strategies and best practices. Pacific Grove, CA: Brooks/Cole.
Walker, H. M., Irvin, L., Noell, J., & Singer, G. (1992). A construct scoreapproach to the assessment of social competence. Behavior Modifica-tion, 16, 448–474.
Walker, H. M., & McConnell, S. R. (1995). The Walker-McConnell Scaleof Social Competence and School Adjustment (SSCSA). Florence, Ken-tucky: Thomson Learning.
Webster, D. W. (1993). The unconvincing case for school-based conflictresolution programs for adolescents. Health Affairs, 12, 126–141.
Weissberg, R. P., & Bell, D. N. (1997). A meta-analytic review of primaryprevention programs for children and adolescents: Contributions andcaveats. American Journal of Community Psychology, 25, 207–214.
Received November 7, 2000Revision received April 22, 2002
Accepted May 3, 2002 �
308 FLANNERY ET AL.