Initial Antiretroviral Therapy - cls.org.co · ABC + 3TC + (ZDV or d4T) *EFV safety in pregnancy...
42
Initial Antiretroviral Therapy Initial Antiretroviral Therapy Joel E. Gallant, MD, MPH Johns Hopkins University School of Medicine
Transcript of Initial Antiretroviral Therapy - cls.org.co · ABC + 3TC + (ZDV or d4T) *EFV safety in pregnancy...

Initial Antiretroviral TherapyInitial Antiretroviral Therapy
Joel E. Gallant, MD, MPHJohns Hopkins University School of Medicine

A Brief History of Antiretroviral Therapy
! Early 80�s: No antiretroviral therapy

A Brief History of Antiretroviral Therapy
! Early 80�s: No antiretroviral therapy! Late 80�s: AZT monotherapy


A Brief History of Antiretroviral Therapy
! Early 80�s: No antiretroviral therapy! Late 80�s: AZT monotherapy! Early 90�s: Sequential NRTI
monotherapy and dual-NRTI therapy

A Brief History of Antiretroviral Therapy
! Early 80�s: No antiretroviral therapy! Late 80�s: AZT monotherapy! Early 90�s: Sequential NRTI
monotherapy and dual-NRTI therapy! Late 90�s: HAART: �Hit hard, hit early�


■ IDV / 3TC / AZT
● IDV
∆ AZT / 3TC
Gulick RM. Merck 035 NEJM 1997;337:734

Mortality From 1990-2004 in the Johns Hopkins HIV Clinical Cohort
Lau B, et al. Lau B, et al. CROI Denver, CO, 2006

Mortality and Use of Protease Inhibitors by Patients with CD4 <100, US 1994-1997
Palella, NEJM 1998


A Brief History of Antiretroviral Therapy
! Early 80�s: No antiretroviral therapy! Late 80�s: AZT monotherapy! Early 90�s: Sequential NRTI
monotherapy and dual-NRTI therapy! Late 90�s: HAART: �Hit hard, hit early�! Early 00�s: Deferral of therapy

0.0010.01
0.11
10100
100010000
Freq
uenc
y(IU
PM)
Frequency of Latently Infected CD4 Cells as a Function of Time on HAART
-
t ½ = 44.2 months73.4 years
0.00010.00001
3 4 5 6 7 80 1 2
Time on HAART (years)
Siliciano R, et al.

Adherence and Emergence of Resistant Virus Strains
Old View New View
Probability of resistance
0% Adherence 100%
Based on Friedland GH, et al. 1999;13(suppl 1):S61-S71.

Metabolic and Morphologic Complications of Antiretroviral Therapy
� Hyperlipidemia� Insulin resistance, hyperglycemia, &
diabetes� Lipoatrophy� Fat accumulation� Lactic acidosis� Osteopenia and osteoporosis (?)� Osteonecrosis & avascular necrosis (?)
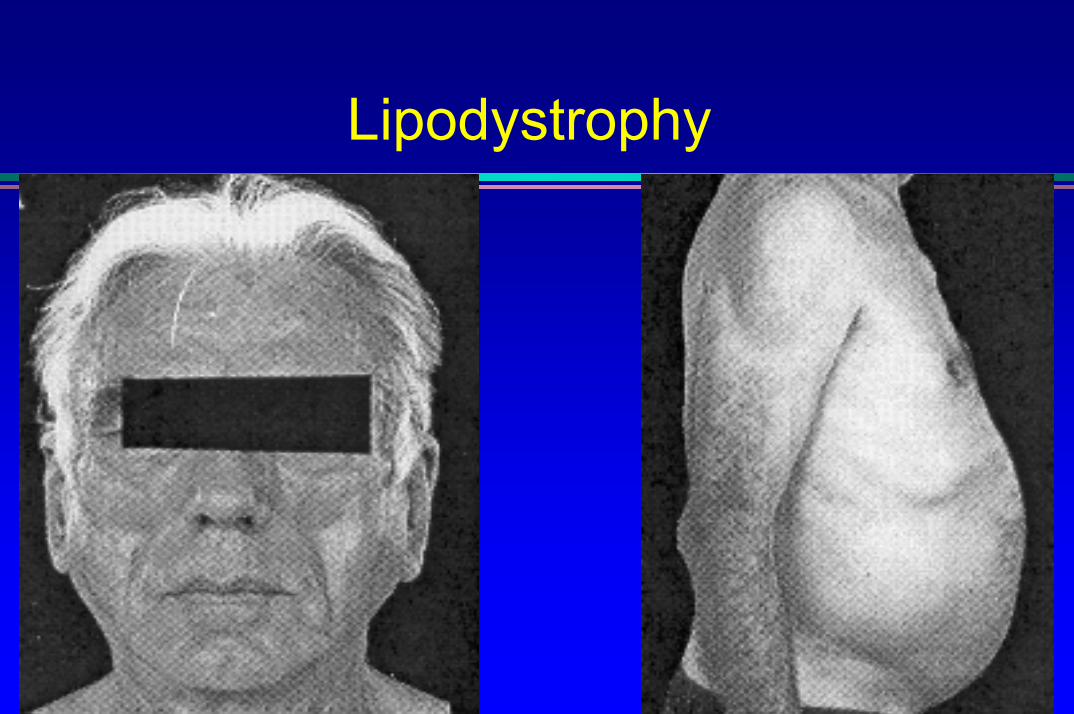
Lipodystrophy

Prognosis of Antiretroviral-Naïve Patients:ART Cohort Collaboration
Prognosis of Antiretroviral-Naïve Patients:ART Cohort Collaboration
� Time to AIDS defining events or death� 12,040 patients followed at 12 centers starting HAART
Probability of AIDS-free survival
1.000.950.900.850.800.75
Years from starting HAART0 1 2 3
0-49
50-68
100-198
200-349≥350
CD4 cell count at baseline
0.95
0.90
0.85
0.80
0.75Years from starting HAART
0 1 2 3
≥5
4-4.99
1.00
3-3.99>3
Log HIV RNA at baseline
Egger, et al. 41st ICAAC, Chicago 2001.

Guidelines For Initial Therapy
(TDF or AZT) + (3TC or FTC) + (EFV or LPV/r)
2004
2 NRTIs + PI, NNRTI, or 3rd
NRTI2002
2 NRTIs + PI or NNRTI19992 NRTIs + PI19972 NRTIs1995AZT/ddI1992AZT1987
GUIDELINESYEAR

ACTG 5095: AZT/3TC/ABC vs. EFV-Based Therapy
Gulick R, et al. N Engl J Med

NFV vs. LPV/r: Time to Virologic Failure by Baseline Viral Load
87%
68%
57%
41%40%
Nelfinavir
0%
20%
40%
60%
80%
100%
0 24 48 72 96Weeks
Perc
ent r
espo
ndin
g
<20,000 (n=68)20,000-65,000 (n=66)65,000-150,000 (n=66)150,000-350,000 (n=64)>350,000 (n=63)
Baseline viral load (log10 copies/mL)
90%85%80%74%67%
Lopinavir/ritonavir
0 24 48 72 96Weeks
<20,000 (n=62)20,000-65,000 (n=66)65,000-150,000 (n=66)150,000-350,000 (n=72)>350,000 (n=60)
Baseline viral load (log10 copies/mL)
King M et al. 9th CROI, Seattle, 2002, #470

TDF vs. d4T (plus EFV/3TC): Gilead 903 � 144 week data
0
20
40
60
80
100
0 24 48 72 96 120 144
% P
atie
nts
with
VL
< 50
c/m
L
Weeks
73%69%
ITT Missing=Failure
TDF+3TC+EFVd4T+3TC+EFV
Gallant JE, et al. JAMA 2004
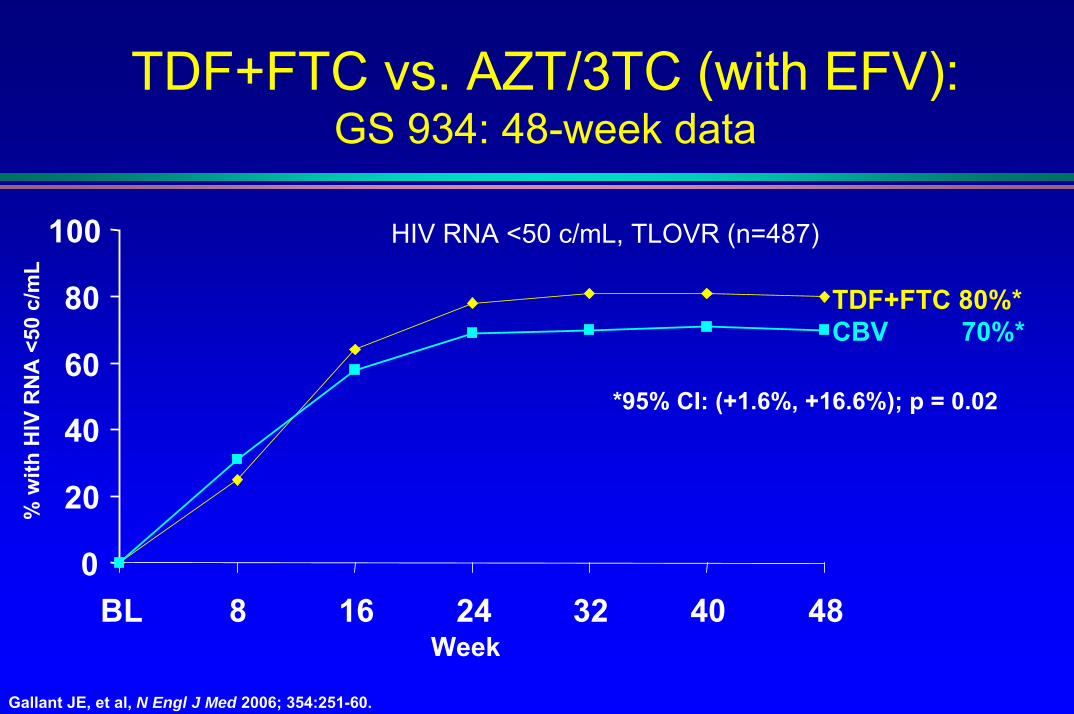
TDF+FTC vs. AZT/3TC (with EFV): GS 934: 48-week data
TDF+FTC 80%*CBV 70%*
% w
ith H
IV R
NA
<50
c/m
L
*95% CI: (+1.6%, +16.6%); p = 0.02
0
20
40
60
80
100
BL
HIV RNA <50 c/mL, TLOVR (n=487)
8 16Week
24 32 40 48
Gallant JE, et al, N Engl J Med 2006; 354:251-60.

Lessons Learned in the HAART Era
! A �new� drug may not be an �active� drug» Extensive cross-resistance within drug classes
! Addition of a 1 active drug to a failing regimen is monotherapy and results in drug resistance
! Continuing a failing regimen leads to accumulation of resistance and loss of options

Antiretroviral Drug Approval:1987 - 2006
0
5
10
15
20
1987 1989 1991 1993 1995 1997 1999 2001 2003 2005
AZT ddIddC d4T
3TCSQV
RTVIDVNVP
NFVDLV
EFVABC
APVLPV/r
TDF
TPVENFATV FPV
DRV?

When to Start TherapyWhen to Start Therapy

DHHS Guidelines: When to Start Treatment
Defer therapy< 100,000> 350Asymptomatic
Most clinicians recommend deferring therapy, but some
clinicians will treat.
≥ 100,000> 350Asymptomatic
Treatment should be offered following full discussion of pros and cons of treatment.
Any value200-350Asymptomatic
TreatAny value< 200Asymptomatic
TreatAny valueAny valueAIDS-defining illness or severe symptoms*
General GuidelinesViral LoadCD4 Count
Clinical Category
* Severe symptoms = unexplained fever or diarrhea > 2-4 wks, oral candidiasis, or > 10% unexplained weight loss.
DHHS guidelines. http://AIDSinfo.nih.gov. Accessed November 11, 2004.

Collated Results of HAART Studies
0 10 20 30 40 50 60 70 80 90 100% With VL < 50 at Week 48
Boosted PI
NNRTINRTI
Unboosted PI
" Previous analysis emphasized relation b/w pill burden and response
" Updated analysis: pill burden less important
" Highli and NNRTI regimens
ghts efficacy of boosted-PI
Bartlett JA et al. Abstract 586.

Treatment Responses in 1st Year of HAARTImproving Over Time
! 5 clinic cohorts in Europe and Canada, N=4143! Treatment-naive; started HAART 1996-2002! ↓ risk of virologic failure, ↑ med. CD4 increase in later years
» In recent years, most �failure� due to loss to follow-up or treatment discontinuation
0153045607590105120135150
97
119 120 121127 125
150Median CD4 increase
Lampe S, et al. 12th CROI, 2005, Abstract 593
24.8 23.017.3
12.4 10 8 8.4
01020304050
1996 1997 1998 1999 2000 2001 2002
% with VL > 500 c/mL
60708090
100
% W
ith V
L >
500
on A
RT
Med
ian
CD
4 In
crea
se

HAART and Survival Based on Initial CD4 Count
! Modeled data from ART Cohort Collaborative
! 10,855 patients included! 934 progressed to AIDS or died! IDUs excluded from model
Sterne J, et al. CROI 2006. Abstract 525.
Progression and Death According to CD4 Count (cells/mm3)
1.26 (0.94-1.68)
2.93 (2.41-3.57)
Hazard ratio for AIDS or death (95% CI)
< 350 vs 351-500
< 200 vs 201-350
1.52 (1.10-2.10)
3.68 (3.01-4.51)
Hazard ratio for AIDS (95% CI)
Cumulative Probability of AIDS/Death According to CD4 Count at Initiation of HAART
Years Since Initiation of HAART
0 1 2 3 4 5
0.00
0.02
0.04
0.06
0.08
0.10
0.12
Prob
abili
ty o
f AID
S or
Dea
th
101-200 cells/mm3
201-350 cells/mm3
351-500 cells/mm3

HOPS Cohort: Early, Uninterrupted ARTAssociated with Improved Outcomes
Incidence per 1,000 patient years by pre-HAART CD4 count and % time on HAART (n = 4,421)
CD4 Cell Count Category
MortalityOpportunistic Infections80
70
60
50
40
30
20
10
0
80
70
60
50
40
30
20
10
00-49 50-199 200-349 350-499 500+0-49 50-199 200-349 350-499 500+
CD4 categoryCD4 category
HAART < 95% of timeHAART > 95% of time
* P = 0.05 for difference by % HAART use
HAART < 95% of timeHAART > 95% of time
* P = 0.05 for difference by % HAART use
Inci
denc
e pe
r 1,0
00 P
erso
n-Ye
ars
Inci
denc
e pe
r 1,0
00 P
erso
n-Ye
ars
71.5
47.8
38.5
25.521.4
15.9 14.211.5
7.2 7.5
*
*
55.9
26.1
37.8
22.3 20.1
10.416.2
5.4 7.32.4
**
**
Lichtenstein K, et al. 13th CROI, 2006; #769.

CD4 Response Based on Baseline CD4 CountJohns Hopkins
HIV Clinical Cohort
Keruly J, et al. CROI 2006. Abstract 529. Gras L, et al. CROI 2006. Abstract 530.
Years on HAART
Mea
n C
D4
Cou
nt
! Magnitude of CD4 increase greatest if therapy started at low CD4 counts, but greater likelihood of CD4 count normalization with earlier therapy
0 1 2 3 4 5
200
400
600
800
0
1000ATHENA National Cohort
1000
800
600
400
200
00 24014448 96 192 288 336
Weeks From Starting HAART

Viral Load and Heterosexual Transmission of HIV-1
Quinn, et al. NEJM 2000;342:921-929

Recommended regimens fortreatment-naïve patients: DHHS 7/05
Preferred regimensLPV/r +LPV/r +
(3TC or FTC) + (ZDV) (3TC or FTC) + (ZDV) EFV* +EFV* +
(3TC or FTC) + (ZDV or TDF)(3TC or FTC) + (ZDV or TDF)Alternative regimens
PIPI--basedbased(ZDV, d4T, TDF, ABC or ddI) + (3TC or FTC) + :(ZDV, d4T, TDF, ABC or ddI) + (3TC or FTC) + :
ATV (w/ RTV for TDF)ATV (w/ RTV for TDF)FPVFPV
FPV + RTVFPV + RTVIDV + RTVIDV + RTV
LPV/rLPV/rNFV NFV
SQV + RTVSQV + RTV
NNRTINNRTI--basedbasedEFV* + (3TC or FTC) + (ddI, d4T, or ABC)EFV* + (3TC or FTC) + (ddI, d4T, or ABC)
NVP + (3TC or FTC) + (ZDV, d4T, ddI, ABC, or NVP + (3TC or FTC) + (ZDV, d4T, ddI, ABC, or TDFTDF
Triple NRTI**Triple NRTI**ABC + 3TC + (ZDV or d4T)
*EFV safety in pregnancy not established � avoid in pregnant women or women with pregnancy potential**Only when an NNRTI- or a PI-based regimen cannot or should not be used as first-line therapywww.aidsinfo.nih.gov

Decreasing Use of Thymidine Analogs for Initial Therapy
! AZT/3TC or d4T/3TC → TDF/FTC or ABC/3TC! Once daily therapy with coformulated products! Well tolerated! No mitochondrial toxicity (lipoatrophy, lactic acidosis)! No anemia or neuropathy! Better lipid profiles (TDF)! TDF: nephrotoxicity! ABC: hypersensitivity

Improvements in PI Therapy
! Once-daily therapy common (LPV/r, FPV/r, ATV/r)! Decreasing pill burden (2-4 pills/d)! GI tolerability improving! Metabolic toxicity no longer universal! RTV boosting standard: no PI resistance with
failure

Increasing Use of Once-Daily Therapy
EFV orATV* orATV/r orFPV/r or
LPV/r
TDF/FTCor
ABC/3TC+
*don�t use unboosted ATV with TDF


www.hopkins-hivguide.org