initial analysis of the SRA’s
39
Transcript of initial analysis of the SRA’s


» Economic Insight has been asked by the Solicitors Regulation Authority (SRA) to use its existing data to understand the extent to which different types of firm pose different risks to the compensation fund. This document sets out our initial analysis of the SRA’s data.
» In summary, our initial analysis suggests that firm characteristics, such as ownership structure and location, are correlated with: (a) the probability of claims being made against a firm; and (b) the value of such claims. Our (tentative) conclusion is, therefore, that pricing the compensation fund in a ‘risk-based’ way would involve a change from the status quo, with payments made by firms being set with regard to their characteristics.
» Specifically, our initial analysis suggests that:– Sole practitioners are more likely than other firms to have paid claims (i.e. claims that the SRA decides to use the compensation fund to
pay) made against them. However, the paid value of such paid claims is on average less than those against partnerships and limited companies.
– Consistent with above, firms with one partner are more likely to have paid claims made against them. However, there is not a clear relationship between the number of partners in a firm and the value of paid claims against them.
– Firms operating in deprived local areas are more likely to have paid claims made against them. The highest paid claims result from firms at either end of the deprivation scale – the most and least deprived.
– There is not a strong regional dimension to the likelihood of paid claims being made against firms, although the South West has a particularly high average value of paid claims.
– A high proportion of paid claims relate to conveyancing and probate, but the highest value paid claims are due to the theft of client money.
– Firms with annual turnover of between £100,000 and £500,000 are more likely than the smallest or largest firms to have paid claims made against them. Set against this, is some evidence to suggest that firms with lower and higher turnover levels have the highest paid claims. Importantly, however, revenue data is not available on a large proportion of firms that have had claims paid against them and these results are very sensitive to how deal with this “missing data” problem.
» The remainder of this section details our approach and the data supplied. The following sections take a characteristic in turn and investigate whether they influence the probability of claims being paid against a firm and the value of such claims.

To enable our analysis of the riskiness of firms, the SRA has provided historical data relating to the total population of solicitor firms, along with a dataset that contains the details of claims made against firms. These two datasets are described in more detail below.
Total population dataset
» Four snapshots in time have been provided relating to the 1st November of 2009, 2010, 2011 and 2012. This covers 14,444 unique firms.
» Variables provided are: SRA ID; firm name; firm type; date formed; postcode; partner count; and turnover.
» Each firm has a unique ID number, however, when a firm changes type (e.g. a partnership becomes a limited company) its unique ID changes.
» Not all variables are supplied for each firm. For example, 8% for records do not include a revenue figure for the given year, and 5% do not include a postcode.
» The make up of the population remains broadly consistent over the years, although there is a noticeable move towards more limited liability structures.
Individual Claims dataset
» Data on claims created between 1st February 2010 and 30th September 2014 has been provided. This covers 8,353 claims made against 801 firms. Over this period £44m was paid out of the compensation fund.
» Variables include: SRA ID; firm name; firm type; postcode; partner count; turnover; claim reason; original claim value (OCV); and amount paid.
» Not all variables are supplied for each firm, for example, we do not have a revenue figure for 61% of firms who have had a claim made against them.
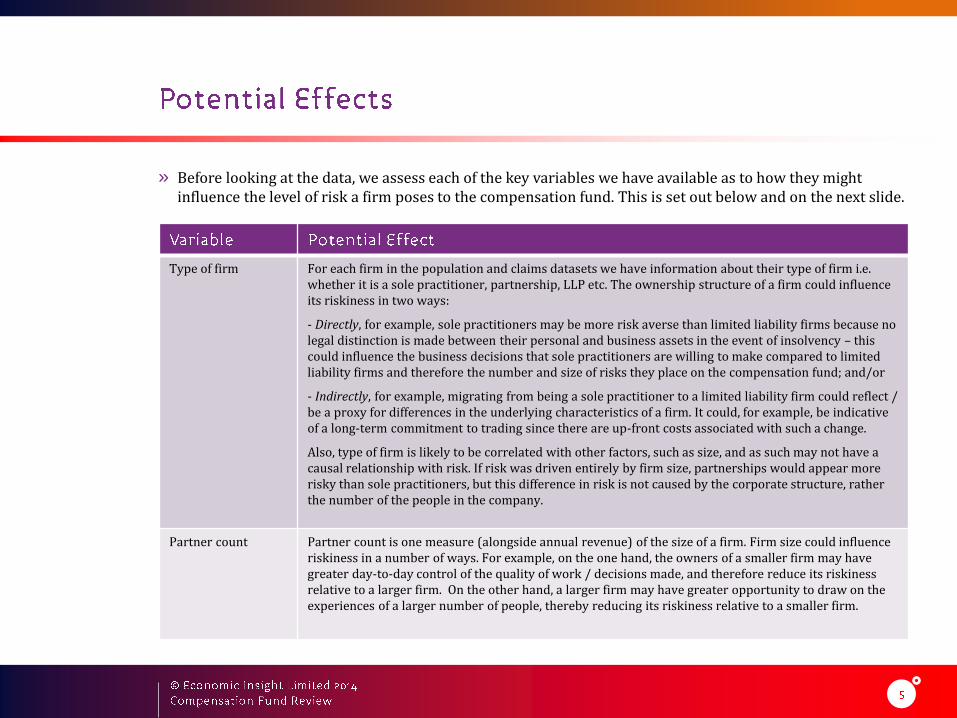
» Before looking at the data, we assess each of the key variables we have available as to how they might influence the level of risk a firm poses to the compensation fund. This is set out below and on the next slide.
Type of firm For each firm in the population and claims datasets we have information about their type of firm i.e. whether it is a sole practitioner, partnership, LLP etc. The ownership structure of a firm could influence its riskiness in two ways:
- Directly, for example, sole practitioners may be more risk averse than limited liability firms because no legal distinction is made between their personal and business assets in the event of insolvency – this could influence the business decisions that sole practitioners are willing to make compared to limited liability firms and therefore the number and size of risks they place on the compensation fund; and/or
- Indirectly, for example, migrating from being a sole practitioner to a limited liability firm could reflect / be a proxy for differences in the underlying characteristics of a firm. It could, for example, be indicative of a long-term commitment to trading since there are up-front costs associated with such a change.
Also, type of firm is likely to be correlated with other factors, such as size, and as such may not have a causal relationship with risk. If risk was driven entirely by firm size, partnerships would appear more risky than sole practitioners, but this difference in risk is not caused by the corporate structure, rather the number of the people in the company.
Partner count Partner count is one measure (alongside annual revenue) of the size of a firm. Firm size could influence riskiness in a number of ways. For example, on the one hand, the owners of a smaller firm may have greater day-to-day control of the quality of work / decisions made, and therefore reduce its riskiness relative to a larger firm. On the other hand, a larger firm may have greater opportunity to draw on the experiences of a larger number of people, thereby reducing its riskiness relative to a smaller firm.

» An important driver of risk that has not been included in the above table is area of law. Unfortunately, data collected on the population of firms does not include the areas of law in which they practice. We do however present an analysis of the claim reason, which relates to area of law.
Region We determined the Government Office Region in which each firm operates using the postcode data provided to us.
The region in which each firm operates can serve as a proxy for the underlying differences between firms in terms of the demand they serve and the supply conditions they face. For example, it is possible that consumers in some regions are more likely to make a claim against a firm than consumers in other regions. Similarly, to the extent that claims are linked to the price of services provided, claims against firms in high cost areas may tend to be higher than claims made against firms in low cost areas.
Index of Multiple Deprivation
We have also been able to identify the ‘deprivation’ level of the local area in which each firm operates using the postcode data provided to us. The ONS ‘Index of Multiple Deprivation’ takes into account factors such as local poverty and education levels at a much more granular level than Government Office Regions (i.e. each local area has between 1,000 and 3,000 inhabitants). Again, this could be a proxy for the underlying differences between firms in terms of the demand they service and the supply conditions they face.
Annual revenue Annual revenue is one measure (alongside partner count) of the size of a firm. See above.

» In the following sections, for each characteristic discussed previously, we investigate the probability of claims arising, and then the value of such claims.
Probability of claims
» For the probability of a claim arising relating to a firm with a given characteristic, we compare the proportion of firms with this characteristic in the population dataset with the claims dataset. If claims were completely random, and not dependent on the characteristic of the firm, we would expect to see the same proportion of, for example, sole practitioners in the population as we do having claims paid against them. If sole practitioners are more risky, we would expect to see a larger proportion of firms who have claims paid against them to be sole practitioners, compared to the population.
» The higher the probability of a claim, all else equal, the higher the expected claim value.
Value of claims paid
» To investigate the value of claims, we look at the average value of claims paid in relation to firms. All else equal, the higher the average value of claims paid against firms with given characteristics, the higher the expected claims value.
Unit of comparison
» Given that a firm pays into the compensation fund to cover claims against it, the analysis is presented at the firm level. That is, we aggregate all the claims that have been made against a firm.
» Furthermore, we focus only on where claims have been paid. That is, we analyse the probability that a successful claim will be made, rather than considering all claims that were made. A breakdown of original claims value is given in the appendix.

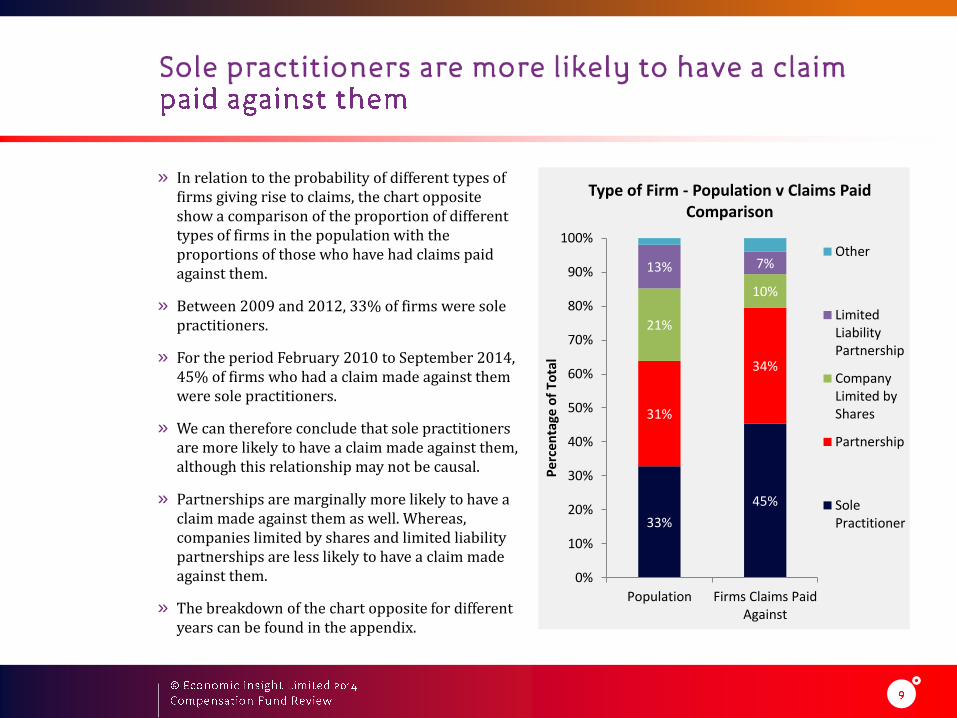
» In relation to the probability of different types of firms giving rise to claims, the chart opposite show a comparison of the proportion of different types of firms in the population with the proportions of those who have had claims paid against them.
» Between 2009 and 2012, 33% of firms were sole practitioners.
» For the period February 2010 to September 2014, 45% of firms who had a claim made against them were sole practitioners.
» We can therefore conclude that sole practitioners are more likely to have a claim made against them, although this relationship may not be causal.
» Partnerships are marginally more likely to have a claim made against them as well. Whereas, companies limited by shares and limited liability partnerships are less likely to have a claim made against them.
» The breakdown of the chart opposite for different years can be found in the appendix.
33%
45%
31%
34%
21%
10%
13% 7%
0%
10%
20%
30%
40%
50%
60%
70%
80%
90%
100%
Population Firms Claims PaidAgainst
Pe
rcen
tage
of
To
tal
Type of Firm - Population v Claims Paid Comparison
Other
LimitedLiabilityPartnership
CompanyLimited byShares
Partnership
SolePractitioner
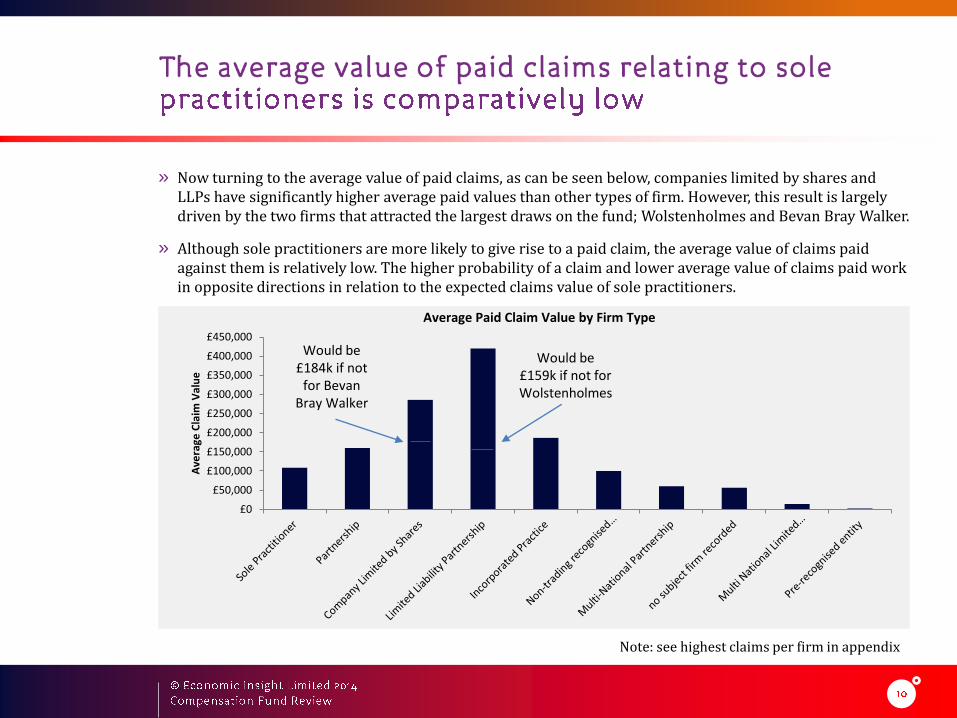
» Now turning to the average value of paid claims, as can be seen below, companies limited by shares and LLPs have significantly higher average paid values than other types of firm. However, this result is largely driven by the two firms that attracted the largest draws on the fund; Wolstenholmes and Bevan Bray Walker.
» Although sole practitioners are more likely to give rise to a paid claim, the average value of claims paid against them is relatively low. The higher probability of a claim and lower average value of claims paid work in opposite directions in relation to the expected claims value of sole practitioners.
£0
£50,000
£100,000
£150,000
£200,000
£250,000
£300,000
£350,000
£400,000
£450,000
Ave
rage
Cla
im V
alu
e
Average Paid Claim Value by Firm Type
Would be £159k if not for Wolstenholmes
Would be £184k if not
for Bevan Bray Walker
Note: see highest claims per firm in appendix


» Looking at the number of partners in a similar way to the type of law firm, one can see that firms with a single partner are more likely to give rise to a claim paid against them.
» 44% of the population are firms with a single partner, whereas 66% of those firms who have had claims paid against them are single partner firms.
» Consistent with the findings in relation to firm type, this would indicate that small firms with only one main decision maker are more likely to give rise to paid claims. Furthermore, as the number of partners increase, the probability of paid claims reduces.
2%9%
44%
66%
24%
21%
10%
3%
20%
0%
10%
20%
30%
40%
50%
60%
70%
80%
90%
100%
Population Firms Claims PaidAgainst
Per
cen
tage
of
Tota
lPartner Count – Population v Claims
Paid Comparison
4+Partners
3 Partners
2 Partners
1 Partner
0 orUnknown
Note: In addition to sole practitioners, firms of other types are reported as having a single partner, such as companies limited by shares
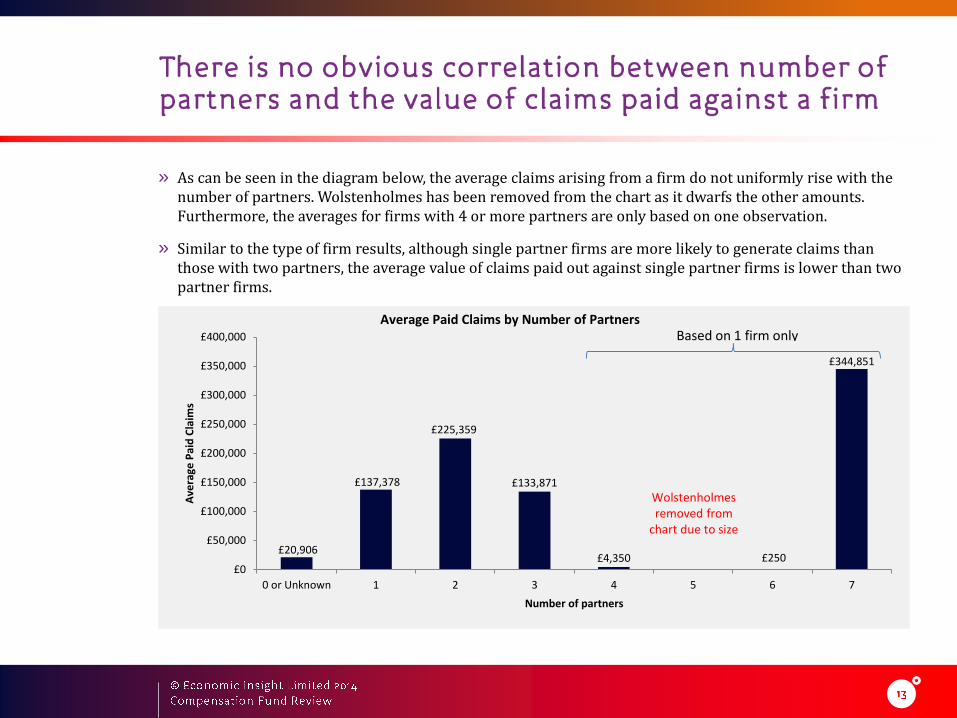
» As can be seen in the diagram below, the average claims arising from a firm do not uniformly rise with the number of partners. Wolstenholmes has been removed from the chart as it dwarfs the other amounts. Furthermore, the averages for firms with 4 or more partners are only based on one observation.
» Similar to the type of firm results, although single partner firms are more likely to generate claims than those with two partners, the average value of claims paid out against single partner firms is lower than two partner firms.
£20,906
£137,378
£225,359
£133,871
£4,350 £250
£344,851
£0
£50,000
£100,000
£150,000
£200,000
£250,000
£300,000
£350,000
£400,000
0 or Unknown 1 2 3 4 5 6 7
Ave
rage
Pai
d C
laim
s
Number of partners
Average Paid Claims by Number of Partners Based on 1 firm only
Wolstenholmesremoved from
chart due to size


» Using the postcode data supplied, we have been able to match additional geographic data to individual firms.
» However, not all firms had a postcode and not all postcodes could be successfully matched to a region. These firms are represented by the ‘unknown’ category.
» As can be seen in the chart opposite, London firms appear to account for a disproportionately high number of paid claims, when compared to the population (35% of firms who have claims made against them are known to be in London, 29% of the population are known to be in London).
» However, due to the size of the unknown segment of firms, we cannot robustly conclude that London based firms are more likely to give rise to claims i.e. it may be that a proportion of the unknown firms are located in London.
5% 6%
7% 8%
29%35%
3%
3%12%
13%12%
12%7%
7%7%
7%7%
6%11%4%
0%
10%
20%
30%
40%
50%
60%
70%
80%
90%
100%
Population Firms Claims PaidAgainst
Pe
rcen
tage
of
To
tal
Region – Population v Claims Paid Comparison
Unknown
Yorkshire andThe Humber
WestMidlands
South West
South East
North West
North East
London
East ofEngland
East Midlands

£0
£50,000
£100,000
£150,000
£200,000
£250,000
£300,000
£350,000
EastMidlands
East ofEngland
London North East North West South East South West WestMidlands
Yorkshireand TheHumber
Unknown
Ave
rage
Pai
d C
laim
s
Average Paid Claims by Region
» The South West has a particularly high average paid claims. However, the average paid claims of firms in unknown regions is an outlier. Accurately allocating these firms to their regions may significantly change the results in this chart.


» Along with matching postcodes with geographic region, we have also been able to match them with a measure of relative deprivation. The Index of Multiple Deprivation (IMD) is a composite measure that takes into account seven dimensions of deprivation:
– income deprivation;
– employment deprivation;
– health deprivation and disability;
– education deprivation;
– crime deprivation;
– barriers to housing and services deprivation; and
– living environment deprivation.
» The measure has been constructed by the Social Disadvantage Research Centre at the University of Oxford, and relates to 2010.
» IMD scores are calculated at the Lower layer Super Output Area (LSOA) level - which is a local area that contains a population between 1,000 and 3,000.
» The most deprived areas are given a high score, and the least deprived areas given a low score.

» As can be seen in the diagram below, within almost every region, and at a total level, firms who have had a claim paid against them have a higher averaged level of deprivation than the population of firms in the same area. Therefore, firms in more deprived local areas are more likely to have a claim paid against them.
0
5
10
15
20
25
30
35
40
45
50
EastMidlands
East ofEngland
London North East North West South East South West WestMidlands
Yorkshireand TheHumber
TotalAve
rage
In
de
x o
f M
ult
iple
De
pri
vati
on
Index of Multiple Deprivation - Population v Claims Paid Comparison Population
Firms Claims PaidAgainst

» Looking at the average claims paid across bands of the IMD scale, firms that are either very deprived or very well off give rise, on average, to larger draws on the fund compared to those firms in the middle of the scale.
» The extremely high average claims for the lowest IMD band (the least deprived) is heavily driven by Wolstenholmes.
£0
£50,000
£100,000
£150,000
£200,000
£250,000
£300,000
£350,000
£400,000
£450,000
0-10 10-20 20-30 30-40 40-50 50-60 60+
Ave
rage
Cla
ims
Pai
dIMD Band
Average Claims Paid by IMD
Would be £131k if not for
Wolstenholmes

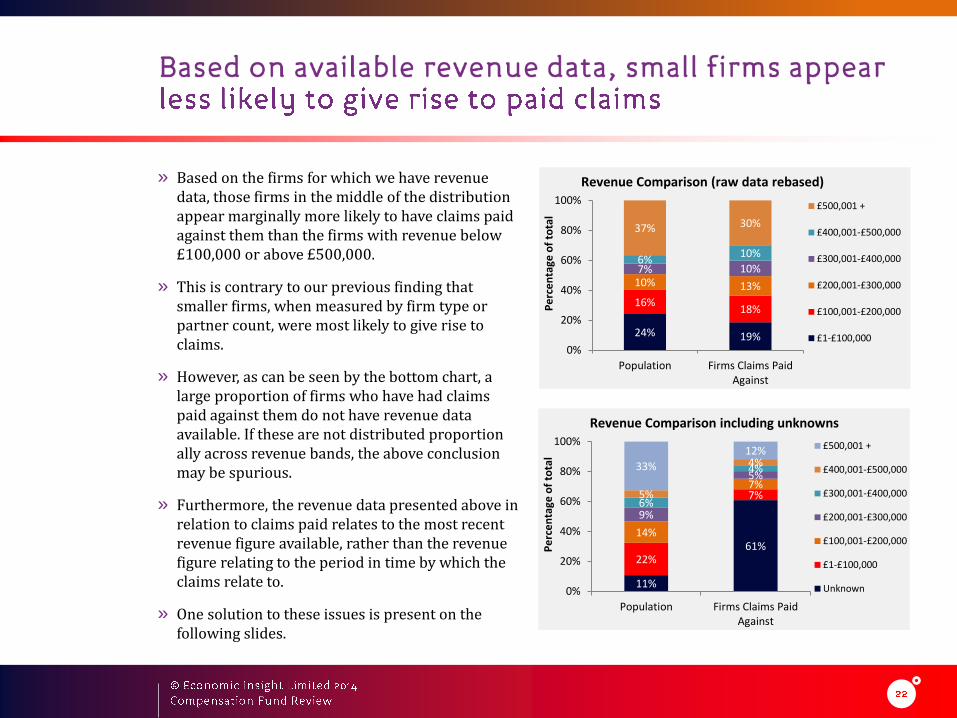
» Based on the firms for which we have revenue data, those firms in the middle of the distribution appear marginally more likely to have claims paid against them than the firms with revenue below £100,000 or above £500,000.
» This is contrary to our previous finding that smaller firms, when measured by firm type or partner count, were most likely to give rise to claims.
» However, as can be seen by the bottom chart, a large proportion of firms who have had claims paid against them do not have revenue data available. If these are not distributed proportion ally across revenue bands, the above conclusion may be spurious.
» Furthermore, the revenue data presented above in relation to claims paid relates to the most recent revenue figure available, rather than the revenue figure relating to the period in time by which the claims relate to.
» One solution to these issues is present on the following slides.
11%
61%22%
7%
14%
7%
9%
5%
6%
4%
5%
4%33%
12%
0%
20%
40%
60%
80%
100%
Population Firms Claims PaidAgainst
Pe
rce
nta
ge o
f to
tal
Revenue Comparison including unknowns
£500,001 +
£400,001-£500,000
£300,001-£400,000
£200,001-£300,000
£100,001-£200,000
£1-£100,000
Unknown
24% 19%
16%18%
10% 13%
7% 10%6%
10%
37% 30%
0%
20%
40%
60%
80%
100%
Population Firms Claims PaidAgainst
Pe
rce
nta
ge o
f to
tal
Revenue Comparison (raw data rebased)
£500,001 +
£400,001-£500,000
£300,001-£400,000
£200,001-£300,000
£100,001-£200,000
£1-£100,000

» For the population dataset, where the revenue of a firm is not know the average turnover of firms with a similar partner count could be used as a proxy.
» An element of banding is used to ensure averages are based on multiple observations. For example, if there was only one know revenue figure for firms with 15 partners, it would not be appropriate to assume that all other 15 partner firms had an equal revenue. For firms with more than 7 partners, we use sensible bands to ensure averages are based on a sensible number of other firms.
» For the claims dataset, we first identify the revenue figure that is closest in time to when the first claim was made against the firm in question. Specifically, we:– take the revenue of the firm in the year when the first claim was made
against it;
– if this is not available we take the first revenue available going backwards in time;
– and if neither of those are available we take the first available going forwards in time.
» For those firms which we have no revenue data available, we use the same average turnover approach used for the total population.
Number of Partners
Average Turnover
0 or Unknown £768,782
1 £183,012
2 £432,967
3 £838,104
4 £1,099,328
5 £1,648,816
6 £2,110,516
7 £2,488,427
8-10 £3,323,025
11-20 £6,010,685
21-50 £16,720,492
51-100 £50,502,405
101-250 £123,950,716
251+ £402,442,355

» The method described on the previous slide has a small impact on revenue proportions in the population dataset. Using the rebased column as a direct comparison, the £100k to £200k group becomes slightly bigger. This is because a lot of the firms we do not have revenue data on are sole partner firms who, where known, have an average revenue in the £100k to £200k band.
» In the claims dataset, a large proportion of the firms we don’t know the revenue of are also sole partner firms. This results in a significant increase in the £100k to £200k band when we use predicted revenues.
61%
7%
19%9%
7%
18% 44%
5%
13%
6%
4%
10%4%
4%
10%15%
12%30% 22%
0%
20%
40%
60%
80%
100%
Raw Data Raw DataRebased
EstimatedRevenue
Pe
rce
nta
ge o
f to
tal
Revenue of Firms Claims Paid Against
£500,001 +
£400,001-£500,000
£300,001-£400,000
£200,001-£300,000
£100,001-£200,000
£1-£100,000
Unknown
11%
22%24% 22%
14%16% 20%
9%10% 9%
6%7% 6%
5%6% 6%
33% 37% 37%
0%
20%
40%
60%
80%
100%
Raw Data Raw DataRebased
EstimatedRevenue
Pe
rce
nta
ge o
f to
tal
Revenue of Population Firms
£500,001 +
£400,001-£500,000
£300,001-£400,000
£200,001-£300,000
£100,001-£200,000
£1-£100,000
Unknown

£0
£50,000
£100,000
£150,000
£200,000
£250,000
£300,000
£350,000
£400,000
£450,000
Ave
rage
Cla
ims
Pai
d
Revenue
Average Claims Paid by Raw Revenue
Would be £277k if not for
Wolstenholmes
» Using the revenue data that we have available, firms that have revenues in the middle of the distribution, with revenues of £400k to £500k appear to give rise to lower draws on the fund. However, the proportion of firms which we don’t know the revenue of give rise to significantly lower draws than other firms – knowing their true revenue may distort our initial observation.
» Using the estimated revenue, no clear correlation between revenue and claims paid can be seen.
£0
£50,000
£100,000
£150,000
£200,000
£250,000
£300,000
£350,000
£400,000
£450,000
Ave
rage
Cla
ims
Pai
d
Revenue
Average Claim Value by Estimated Revenue
Would be £154k if not for
Wolstenholmes

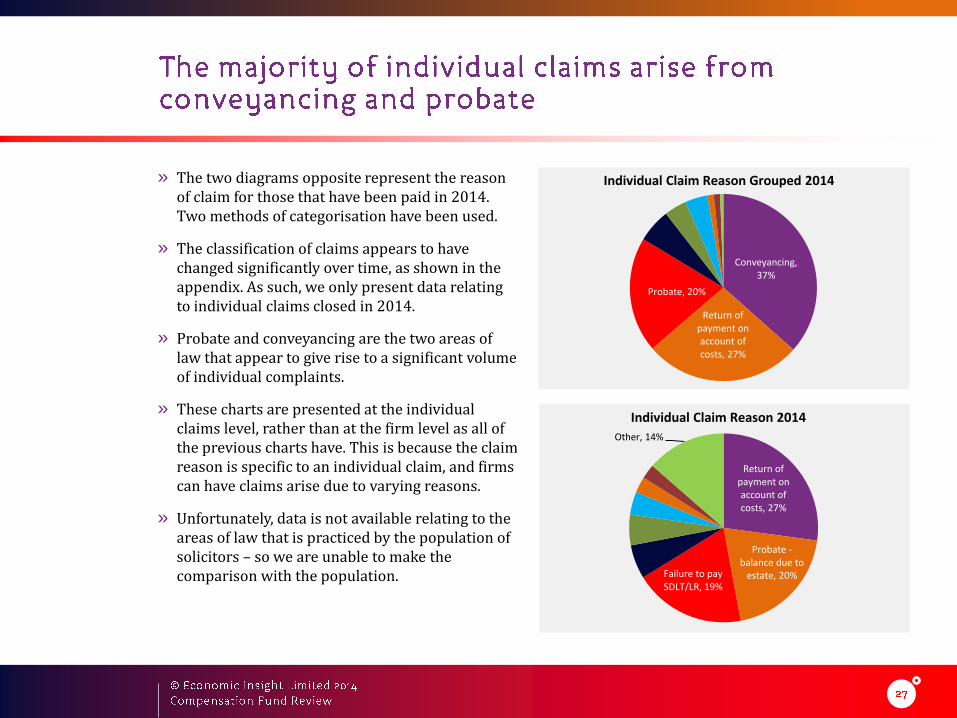
» The two diagrams opposite represent the reason of claim for those that have been paid in 2014. Two methods of categorisation have been used.
» The classification of claims appears to have changed significantly over time, as shown in the appendix. As such, we only present data relating to individual claims closed in 2014.
» Probate and conveyancing are the two areas of law that appear to give rise to a significant volume of individual complaints.
» These charts are presented at the individual claims level, rather than at the firm level as all of the previous charts have. This is because the claim reason is specific to an individual claim, and firms can have claims arise due to varying reasons.
» Unfortunately, data is not available relating to the areas of law that is practiced by the population of solicitors – so we are unable to make the comparison with the population.
Conveyancing, 37%
Return of payment on account of costs, 27%
Probate, 20%
Individual Claim Reason Grouped 2014
Return of payment on account of costs, 27%
Probate -balance due to
estate, 20%Failure to pay SDLT/LR, 19%
Other, 14%
Individual Claim Reason 2014

» Probate and conveyancing claims are relatively high in value, but are only a fraction of the size of claims relating to the theft of client money.
£0
£50,000
£100,000
£150,000
£200,000
£250,000
Ave
rage
Cla
im P
aid
Val
ue
Average Claims Paid by Claim Reason


37% 34% 31% 30%
36%32%
29% 27%
15%19%
24% 27%
11% 13% 14% 14%
0%
10%
20%
30%
40%
50%
60%
70%
80%
90%
100%
09/10 10/11 11/12 12/13
Pe
rce
nta
ge o
f Fi
rms
Type of Firm
LimitedLiabilityPartnership
CompanyLimited byShares
Partnership
SolePractitioner

37% 39%34%
48%
31%
46%
30%40%
36% 35%32%
35%
29%
32%
27%
32%
15% 8% 19%
5%
24%
9%
27%
19%
11%16% 13% 10%
14% 7% 14% 4%
0%
10%
20%
30%
40%
50%
60%
70%
80%
90%
100%
Pe
rce
nta
ge o
f To
tal
Type of Firm - Population v Claims Comparison
Other
Limited LiabilityPartnership
Company Limitedby Shares
Partnership
Sole Practitioner

8% 9% 12% 14%
24% 22% 21% 20%
15% 15% 14% 13%
9% 10% 9% 9%7% 7% 6% 6%5% 5% 5% 5%
33% 33% 33% 32%
£1,893,626 £1,924,926£2,022,359
£2,126,120
0%
20%
40%
60%
80%
100%
09/10 10/11 11/12 12/13
Pe
rce
nta
ge o
f Fi
rms
Turnover
£500,001 +
£400,001-£500,000
£300,001-£400,000
£200,001-£300,000
£100,001-£200,000
£1-£100,000
Unknown
Average Revenue

73%62%
27%
5%
25%
27%
12%
5%
17%
20%
9%
27%
10%19%
2% 2%6%2%
6%
16% 19%
0%
10%
20%
30%
40%
50%
60%
70%
80%
90%
100%
2010 2011 2012 2013
Pe
rce
nta
ge o
f In
div
idu
al C
laim
s P
aid
Year Claim Closed
Individual Claim Reason (Paid Claims)
Other
Return of deposit
Other-see file
Retention
Failure to paySDLT/LRReturn of paymenton account of costsProbate - balancedue to estateSDLT/Rule 14
General clientmoney
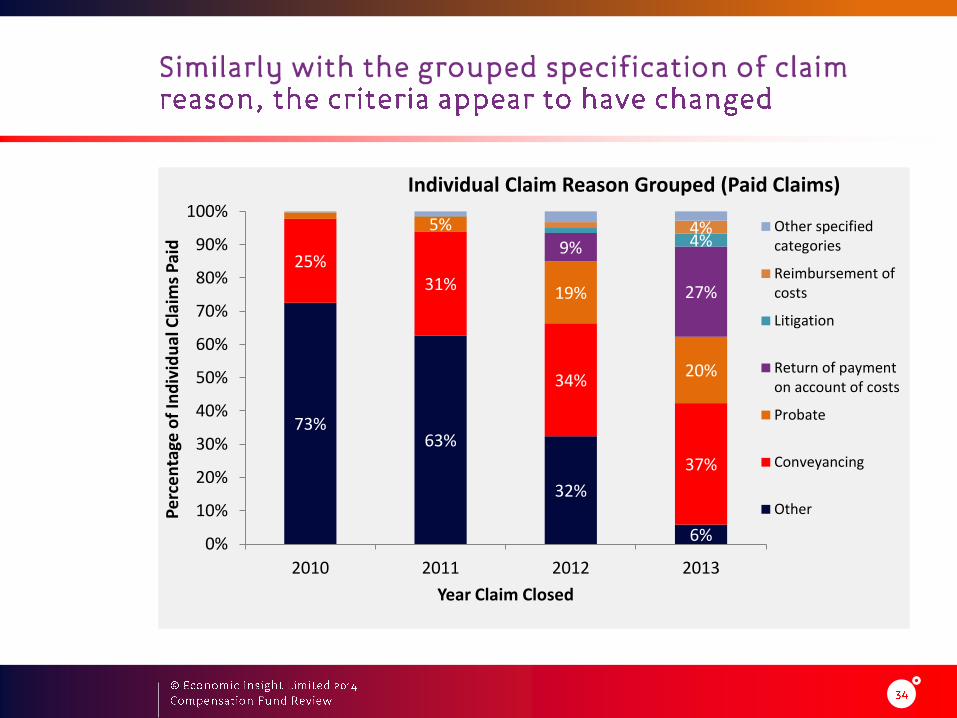
73%63%
32%
6%
25%31%
34%
37%
5%
19%
20%
9%
27%
4%4%
0%
10%
20%
30%
40%
50%
60%
70%
80%
90%
100%
2010 2011 2012 2013
Pe
rce
nta
ge o
f In
div
idu
al C
laim
s P
aid
Year Claim Closed
Individual Claim Reason Grouped (Paid Claims)
Other specifiedcategories
Reimbursement ofcosts
Litigation
Return of paymenton account of costs
Probate
Conveyancing
Other
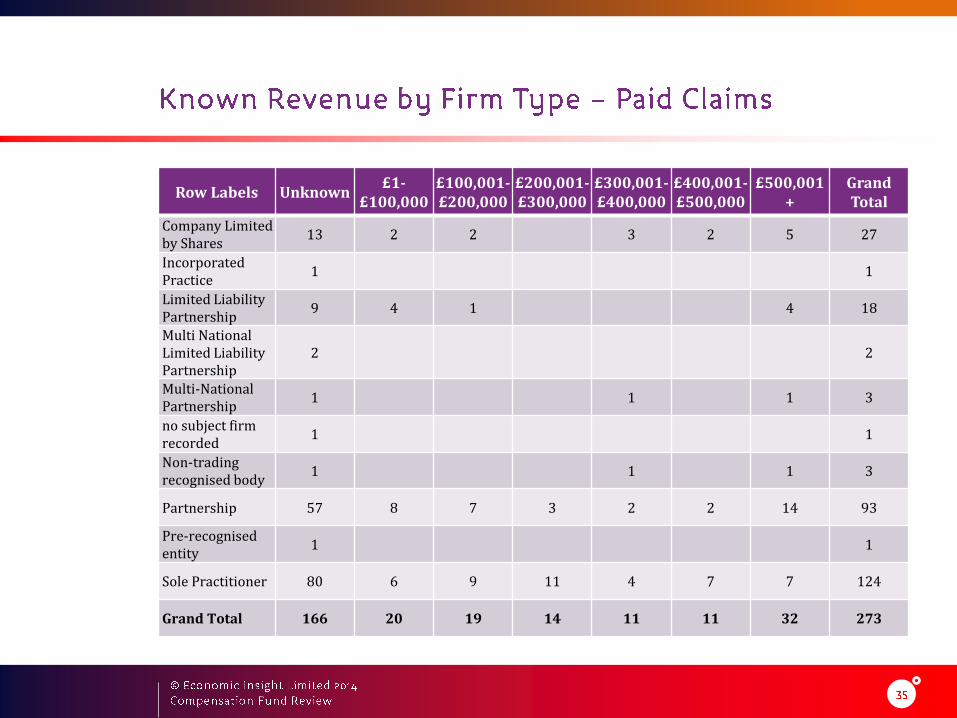
Row Labels Unknown£1-
£100,000£100,001-£200,000
£200,001-£300,000
£300,001-£400,000
£400,001-£500,000
£500,001 +
Grand Total
Company Limited by Shares
13 2 2 3 2 5 27
Incorporated Practice
1 1
Limited Liability Partnership
9 4 1 4 18
Multi National Limited Liability Partnership
2 2
Multi-National Partnership
1 1 1 3
no subject firm recorded
1 1
Non-trading recognised body
1 1 1 3
Partnership 57 8 7 3 2 2 14 93
Pre-recognised entity
1 1
Sole Practitioner 80 6 9 11 4 7 7 124
Grand Total 166 20 19 14 11 11 32 273

Row Labels Unknown£1-
£100,000£100,001-£200,000
£200,001-£300,000
£300,001-£400,000
£400,001-£500,000
£500,001 +
Grand Total
0 or Unknown 22 1 1 24
1 Partner 106 13 14 14 8 11 14 180
2 Partners 32 7 5 2 11 57
3 Partners 4 4 8
4 Partners 1 1
5 Partners 1 1
6 Partners 1 1
7 Partners 1 1
Grand Total 166 20 19 14 11 11 32 273
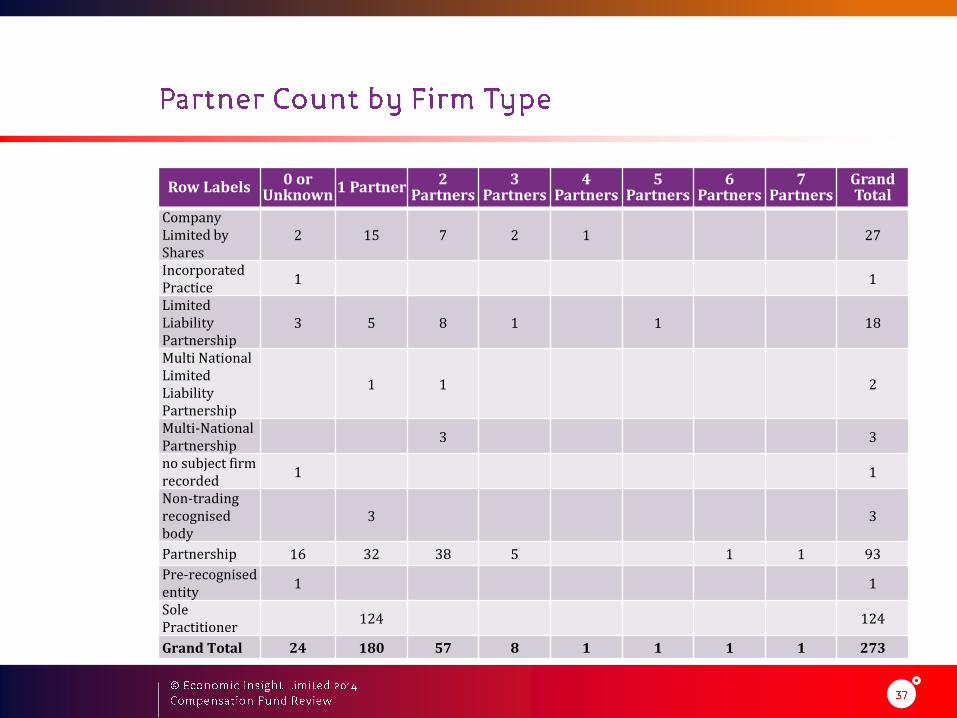
Row Labels 0 or Unknown 1 Partner 2
Partners3
Partners4
Partners5
Partners6
Partners7
PartnersGrand Total
Company Limited by Shares
2 15 7 2 1 27
Incorporated Practice
1 1
Limited Liability Partnership
3 5 8 1 1 18
Multi National Limited Liability Partnership
1 1 2
Multi-National Partnership
3 3
no subject firm recorded
1 1
Non-trading recognised body
3 3
Partnership 16 32 38 5 1 1 93
Pre-recognised entity
1 1
Sole Practitioner
124 124
Grand Total 24 180 57 8 1 1 1 1 273
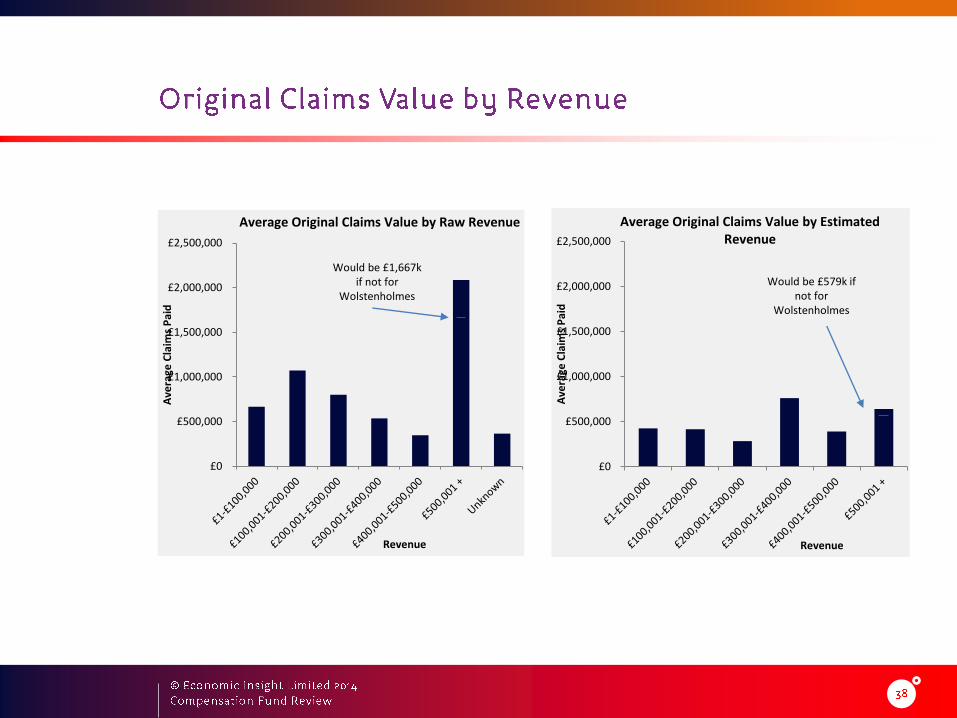
£0
£500,000
£1,000,000
£1,500,000
£2,000,000
£2,500,000
Ave
rage
Cla
ims
Pai
d
Revenue
Average Original Claims Value by Raw Revenue
Would be £1,667k if not for
Wolstenholmes
£0
£500,000
£1,000,000
£1,500,000
£2,000,000
£2,500,000
Ave
rage
Cla
ims
Pai
d
Revenue
Average Original Claims Value by Estimated Revenue
Would be £579k if not for
Wolstenholmes

Economic Insight Limited88 Wood StreetLondonEC2V 7RS
t: +44 (0) 207 849 3004
www.economic-insight.com


![References - 京都大学mfujii/shiryo/printbib.pdfReferences [1] Acharya, Diwakar. V¯acaspatimi´sra’s Tattvasam¯ıks.a. The Earliest Commentary on Man.d.anami´sra’s Brahmasiddhi.](https://static.fdocuments.net/doc/165x107/5f10d9c07e708231d44b1e4b/references-ef-mfujiishiryoprintbibpdf-references-1-acharya-diwakar.jpg)