Infusing Data Campus-Wide to Drive Institutional Change · INFUSING DATA CAMPUS-WIDE Mid-Western...
23
INFUSING DATA CAMPUS-WIDE Mid-Western Educational Researcher • Volume 30, Issue 4 204 Infusing Data Campus-Wide to Drive Institutional Change Meridith Wentz Amanda Brown Jeff Sweat University of Wisconsin-Stout As tuition rates for higher education rise, universities are under increased pressure from internal and external stakeholders to document outcomes such as graduation rates. To do so, higher education institutions must use data effectively. This paper examines the University of Wisconsin-Stout’s (UW-Stout) strategies for data use in the institutional planning process. UW-Stout, a recipient of the Malcolm Baldrige National Quality Award in 2001, continues to use the Baldrige framework and criteria, as well as the balanced scorecard, to gather data and help the institution make data-driven positive changes. Introduction Higher education faces many challenges, but a lack of institutional data is not often among them. Institutions often have a great deal of data but may not have useful or actionable data (Voorhees & Hinds, 2012), or they may not have the resources to analyze and communicate those data properly (Swing & Ross, 2016; Taylor, Hanlon, & Yorke, 2013). Increasingly, institutions of higher education are becoming overburdened with requests for data that exceed the capacity of the institutional research staff (Swing & Ross, 2016) who are tasked with collecting, analyzing, and then communicating this data. Further, institutions may operate on “outdated decision and planning models” (Swing & Ross, p.7), which lead to decision-making processes that are often non-systematic and not aligned with data. Effective models for identifying metrics of importance are needed (e.g., measures of productivity or efficiency, such as graduation and retention rates) and those metrics must be central to driving institutional change. In higher education, the sources of changing data needs is multi-faceted, and includes growth in accountability requirements, the emergence of performance-based funding, and an expansion of stakeholders and consumers of institutional data. Recent trends suggest that these issues and requirements will only continue to grow in the future, making it critical for educational institutions to address them now. During the 20th century, higher education shifted from a culture of perceived elitism, where only the wealthy attended university, to one of massification and egalitarianism, in which higher education became a means of upward economic mobility for everyone (Calderon & Mathies, 2013; Taylor, Webber, & Jacobs, 2013). As higher education’s role in society evolves, educational institutions are under increased pressure to prepare graduates for careers (Taylor et al., 2013; Taylor et al., 2013). The massification of higher education combined with the rising cost of obtaining a degree creates an environment in which these institutions are under increased scrutiny and pressure to demonstrate their value in terms of cost, efficiency, quality, accessibility, and accountability (Arif & Smiley, 2004; McLaughlin, Howard, & Bramblett,
Transcript of Infusing Data Campus-Wide to Drive Institutional Change · INFUSING DATA CAMPUS-WIDE Mid-Western...

INFUSING DATA CAMPUS-WIDE
Mid-Western Educational Researcher • Volume 30, Issue 4 204
Infusing Data Campus-Wide to Drive Institutional Change
Meridith Wentz Amanda Brown Jeff Sweat
University of Wisconsin-Stout
As tuition rates for higher education rise, universities are under increased pressure from
internal and external stakeholders to document outcomes such as graduation rates. To do
so, higher education institutions must use data effectively. This paper examines the
University of Wisconsin-Stout’s (UW-Stout) strategies for data use in the institutional
planning process. UW-Stout, a recipient of the Malcolm Baldrige National Quality
Award in 2001, continues to use the Baldrige framework and criteria, as well as the
balanced scorecard, to gather data and help the institution make data-driven positive
changes.
Introduction
Higher education faces many challenges, but a lack of institutional data is not often among them.
Institutions often have a great deal of data but may not have useful or actionable data (Voorhees
& Hinds, 2012), or they may not have the resources to analyze and communicate those data
properly (Swing & Ross, 2016; Taylor, Hanlon, & Yorke, 2013). Increasingly, institutions of
higher education are becoming overburdened with requests for data that exceed the capacity of
the institutional research staff (Swing & Ross, 2016) who are tasked with collecting, analyzing,
and then communicating this data. Further, institutions may operate on “outdated decision and
planning models” (Swing & Ross, p.7), which lead to decision-making processes that are often
non-systematic and not aligned with data. Effective models for identifying metrics of importance
are needed (e.g., measures of productivity or efficiency, such as graduation and retention rates)
and those metrics must be central to driving institutional change.
In higher education, the sources of changing data needs is multi-faceted, and includes growth in
accountability requirements, the emergence of performance-based funding, and an expansion of
stakeholders and consumers of institutional data. Recent trends suggest that these issues and
requirements will only continue to grow in the future, making it critical for educational
institutions to address them now.
During the 20th century, higher education shifted from a culture of perceived elitism, where only
the wealthy attended university, to one of massification and egalitarianism, in which higher
education became a means of upward economic mobility for everyone (Calderon & Mathies,
2013; Taylor, Webber, & Jacobs, 2013). As higher education’s role in society evolves,
educational institutions are under increased pressure to prepare graduates for careers (Taylor et
al., 2013; Taylor et al., 2013). The massification of higher education combined with the rising
cost of obtaining a degree creates an environment in which these institutions are under increased
scrutiny and pressure to demonstrate their value in terms of cost, efficiency, quality,
accessibility, and accountability (Arif & Smiley, 2004; McLaughlin, Howard, & Bramblett,

INFUSING DATA CAMPUS-WIDE
Mid-Western Educational Researcher • Volume 30, Issue 4 205
2012; Ruben, 2006; Ruben 2007; Volkwein, 1999). Furthermore, higher education institutions
are often called upon to ensure that their priorities are in line with their stakeholders or the
populations they serve (Chambers & Garek, 2007).
Due to the increased calls for accountability, higher education is at a critical juncture in its
evolution. Institutions must adapt and grow to meet the challenges posed by decreased external
funding while maintaining, and more importantly, demonstrating the quality of their product. To
accomplish this, institutions must use data effectively. This paper examines the use of
institutional data as instrumental to assessing, developing, and communicating an educational
institution’s direction and quality to internal and external stakeholders. The authors discuss the
University of Wisconsin-Stout’s (UW-Stout) strategies for using data in the institution’s strategic
planning process. UW-Stout, a recipient of the Malcolm Baldrige National Quality Award in
2001, continues to use the Baldrige framework and criteria to gather data and help the institution
make positive changes based on that data.
Emergence of Performance -Based Funding
Decreases in funding have made the ability to address the many challenges faced by higher
education institutions more difficult and often result in increased competition among universities
for funding from governments as well as other external stakeholders (Arif & Smiley, 2004;
Furst-Bowe & Bauer, 2007; Taylor et al., 2013). Public funding for higher education is
increasingly performance-based (Brown, 2017; Miller, 2016). Performance-based funding
allocates financial resources to institutions based on whether they meet selected performance
metrics. Typically, funding increases as performance on the identified metrics improves, and
funding decreases as performance on the identified metrics worsens. Currently, 35 states have
performance-based funding initiatives for higher education (Hillman, Hicklin Fryar, & Crespin-
Trujillo, 2018). Existing performance-based funding models typically align with metrics that are
important to the state (e.g., number of degrees conferred, persistence and completion rates,
enrollment and transfer counts, career outcome rates, and productivity measures). For example,
in Wisconsin, performance-based metrics align with 2020FWD
(https://www.wisconsin.edu/2020FWD/), the strategic plan for the state university system. The
amount of funding allocated based on performance varies considerably by state, as does the
criteria for making these funding decisions.
Accountability Requirements
Educational institutions use data and information to demonstrate accountability to students and
the public. However, the number of accountability initiatives and metrics from state governments
and accrediting agencies continue to grow, making it difficult to know which data are most
important. For example, at the national level, commonly used accountability metrics include the
Federal Scorecard, Voluntary System of Accountability, Student Achievement Measure and
federal requirements for accreditation (see Table 1).

INFUSING DATA CAMPUS-WIDE
Mid-Western Educational Researcher • Volume 30, Issue 4 206
Table 1
National Accountability Initiatives Initiative Description
Federal Scorecard A college search tool created with direct input from students, families, and
their advisers. The Scorecard provides national data on college costs,
graduation rates, typical debt levels, and post-college earnings. It is available
to help students make informed choices about attending college. The College
Scorecard is primarily designed for students and families, so the data are
presented in an easy-to-understand graphical format (U.S. Department of
Education, 2018).
Voluntary System of
Accountability (VSA)
Created to provide greater accountability through accessible, transparent, and
comparable information. The VSA was introduced by the Association of
Public and Land-grant Universities (APLU) and the American Association of
State Colleges and Universities (AASCU) based on the premise of offering
straightforward, flexible, comparable information on the undergraduate
experience, including student progress and learning outcomes.
http://www.voluntarysystem.org/
Student Achievement
Measure (SAM)
Tracks student movement across postsecondary institutions to provide a more
complete picture of undergraduate student progress and completion within the
higher education system. SAM is an alternative to the federal graduation rate,
which is limited to tracking the completion of first-time, full-time students at
one institution. http://www.studentachievementmeasure.org/
Federal requirements for
accreditation
Institutions are now federally required to report certain types of student
outcome metrics on their websites that are aligned with institution type and
degree offerings.
Increased reporting standards require higher education institutions to be innovative in their use of
data as they reexamine traditional methods of operation (Furst-Bowe & Bauer, 2007). The need
for higher education institutions to collect, organize, and communicate institutional data to
internal and external stakeholders is more important than ever before. Consequently, institutional
research is increasingly vital to an institution’s success and viability.
Addressing Data-Related Challenges
The Rise of Institutional Research
Fincher (1978) and Terenzini (1993, 2013) explain institutional research simply as a form of
organizational intelligence which includes methodological and analytical skills, an understanding
of higher education issues, and the ability to contextualize educational issues and data within a
higher education institution as well as in the larger environment in which a higher education
institution is situated.
Institutional research has evolved past data collection and analysis to include a more scholarly
focus on research and communication of data to internal and external stakeholders, which
requires a delicate balancing act between impartiality and advocacy. Swing and Ross (2016) as

INFUSING DATA CAMPUS-WIDE
Mid-Western Educational Researcher • Volume 30, Issue 4 207
well as Voorhees and Hinds (2012) argue that institutional research should be involved across an
institution to enable a deep understanding of institutional functions and issues. Moreover,
institutional research now plays a more active role in planning and policy-setting contexts
(Calderone & Mathies, 2013; Chambers & Garek, 2007), which is especially important for data-
informed decisions in the current culture of higher education (Swing & Ross, 2016; Volkwein,
2008; Volkwein, Liu, & Woodell, 2012). Ultimately, institutional research is a tool for decision-
making, communication with stakeholders, and advocacy in higher education. Therefore, it is
vital to the strategic planning process.
In 2016, the Association for Institutional Research (AIR) released their Statement of Aspirational
Practice for Institutional Research, in which they define their vision for the profession. This
vision includes “a broadened definition of ‘decision makers’ supported by institutional research,
an intentional structure and leadership for data capacities, and adoption of a ‘student-focused’
paradigm for decision support” (Swing & Ross, 2016, p. 11). UW-Stout was one of ten founding
institutions that contributed to this document. The Statement argues that more internal
stakeholders in an institution (including students, administrators, faculty, and staff at all levels of
the institution) should be involved in institution-wide decision-making processes and that,
because an increasing number of people within an institution need to use data to inform their
decision making, more data literacy is needed for all decision-makers. For UW-Stout, it is
important to include all internal stakeholders because the university has a strong shared
governance model (e.g. faculty, staff and student senates) where all of these groups have a voice
in institutional decision-making. Finally, the Statement argues that institutional data must be
transparent, focused on student experience and on the question of how the data and their analysis
best serve students (Swing & Ross, 2016).
Expansion of Internal Stakeholders and Consumers of Data from Institutional Research
Offices
Historically, institutional research offices have primarily served the needs of a small group of
internal stakeholders, including institutional leaders and mandatory reporting agencies (e.g.,
accrediting agencies). However, institutional research offices have recently experienced
significant growth in decentralized institutional research capacity, resulting in an expansion in
the range of internal stakeholders and decision-makers that institutional research offices serve
(Swing & Ross, 2016). For example, faculty request data that can be used to make improvements
to the curriculum or that will be used in program review processes. Committee chairs ask for
data that can be used to support their recommendations. Unit directors ask for data on
satisfaction with the services they provide. Administrators ask for data about how resource
allocations within one unit compare to resource allocations in similar units at other institutions.
Institutional research offices are receiving more requests to conduct surveys to increase
understanding of issues such as campus climate, student and faculty/staff satisfaction, and job
engagement. An increase in internal stakeholders often translates to different needs and growth
in the types of data that are being requested and used for decision making. UW-Stout uses the
strategic planning process to engage a broad group of stakeholders.
Collectively, monitoring all these data that are collected through multiple processes and from
various sources can be overwhelming for an institution. It is difficult to know which data to

INFUSING DATA CAMPUS-WIDE
Mid-Western Educational Researcher • Volume 30, Issue 4 208
focus on, how to communicate these data, and how to use them to drive institutional change. Yet
it is incumbent upon institutions to develop such reporting and action-based models. Not doing
so could have negative repercussions associated with accreditation, institutional funding, student
enrollment, and workload for institutional research offices.
Benchmarking/Balanced Scorecard
All organizations collect and utilize data. Organizations, specifically for-profit businesses, often
use financial performance (e.g., profits) to measure their success and productivity. However,
financial measures alone do not provide a complete or clear enough picture of an organization’s
performance or opportunities for improvement and innovation (Kaplan & Norton, 1992). Kaplan
and Norton (1992, 1996) as well as Karathanos and Karathanos (2005) argue that information
about lagging indicators, such as profits, must be balanced with measures of other types of
driving indicators, including customer satisfaction, in an organization’s scorecard. No one
measure should be relied upon at the expense of others. Instead, measures in the scorecard
should be balanced. In business, the balanced scorecard is based on four perspectives: the
customer perspective, the internal perspective, the innovation and learning perspective, and the
financial perspective (see Figure 1). These perspectives focus on how the organization appears to
customers and shareholders as well as the organization’s strengths and how it can continue to
improve (Kaplan & Norton, 1992, 1996).
Figure 1. Typical balanced scorecard approach
The popularity of the balanced scorecard in business is based on its ability to provide a
comprehensive view of the organization’s indicators (i.e., scores), and how they function
together. The balanced scorecard limits the number of measures used, thereby reducing
information overload. The integration of information helps to increase communication among
different departments or areas within an organization as well as reduce sub-optimization, a
decrease in quality due to a lack of communication and/or coordination between units or
departments, because all information is examined together (Kaplan & Norton, 1992, 1996). In
addition to providing a means of gathering and communicating organizational data, the balanced
scorecard functions as a strategic management tool. Information in the balanced scorecard is
linked to the organization’s mission, vision, short and long-term goals, and opportunities for
feedback and learning (Kaplan & Norton, 1992, 1996).
INFUSING DATA CAMPUS-WIDE
Mid-Western Educational Researcher • Volume 30, Issue 4 209
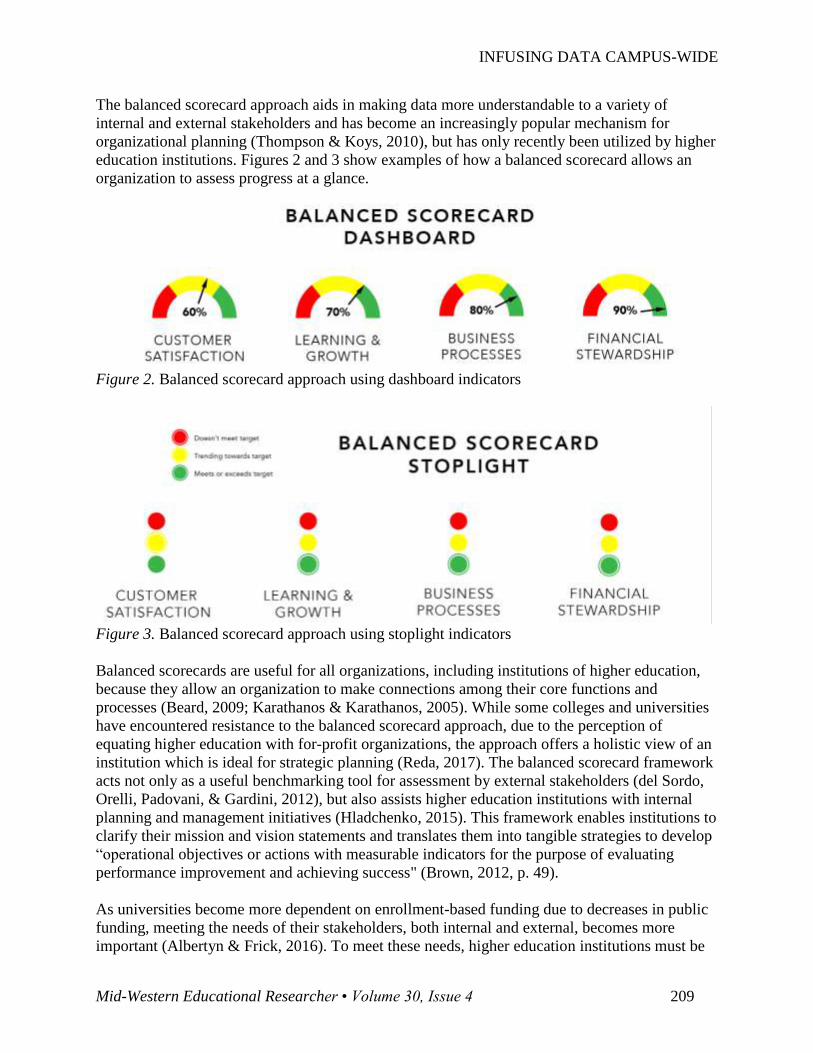
The balanced scorecard approach aids in making data more understandable to a variety of
internal and external stakeholders and has become an increasingly popular mechanism for
organizational planning (Thompson & Koys, 2010), but has only recently been utilized by higher
education institutions. Figures 2 and 3 show examples of how a balanced scorecard allows an
organization to assess progress at a glance.
Figure 2. Balanced scorecard approach using dashboard indicators
Figure 3. Balanced scorecard approach using stoplight indicators
Balanced scorecards are useful for all organizations, including institutions of higher education,
because they allow an organization to make connections among their core functions and
processes (Beard, 2009; Karathanos & Karathanos, 2005). While some colleges and universities
have encountered resistance to the balanced scorecard approach, due to the perception of
equating higher education with for-profit organizations, the approach offers a holistic view of an
institution which is ideal for strategic planning (Reda, 2017). The balanced scorecard framework
acts not only as a useful benchmarking tool for assessment by external stakeholders (del Sordo,
Orelli, Padovani, & Gardini, 2012), but also assists higher education institutions with internal
planning and management initiatives (Hladchenko, 2015). This framework enables institutions to
clarify their mission and vision statements and translates them into tangible strategies to develop
“operational objectives or actions with measurable indicators for the purpose of evaluating
performance improvement and achieving success" (Brown, 2012, p. 49).
As universities become more dependent on enrollment-based funding due to decreases in public
funding, meeting the needs of their stakeholders, both internal and external, becomes more
important (Albertyn & Frick, 2016). To meet these needs, higher education institutions must be

INFUSING DATA CAMPUS-WIDE
Mid-Western Educational Researcher • Volume 30, Issue 4 210
able to communicate data about their institution in a format that is understandable and tangible
for stakeholders (Kettunen, 2010, 2015). As McGowan (2016) pointed out, “there is a need for
institutions of higher education to move from static data systems to value-added systems that
analyze data in light of dashboards, outcomes, or stated goals” (p. 5). Higher education
institutions are more competitive when they can measure their success (Volkwein, 1999),
communicate that success to internal and external stakeholders, and respond quickly to changes
in stakeholder needs and values (Kettunen, 2010, 2015).
To track and communicate institutional data, benchmarking, or comparisons to similar
organizations or industries, is useful in comparing data across different sectors to determine if
higher education institutions have met their goals (Booth, 2013). Benchmarking is an integral
part of the institutional research process, aiding educational institutions in making data-informed
decisions and informing the strategic planning process.
In addition to benchmarking data’s utility in communicating institutional information, the
balanced scorecard approach aids in making data more understandable. Beard and Humphrey
(2014) contend that the elements of an educational institution’s strategic plan need to be
communicated to internal and external stakeholders. The balanced scorecard and the strategic
planning process allow educational institutions to reflect and refine their processes based on data.
Benchmarking data should be part of that strategic plan and is most successful when integrated
into an organization’s overall strategy. Kettunen (2010) explains:
The approach has been designed as a mechanism to make the strategic plan more
understandable to both management and personnel, as it translates the strategic plan into
strategic objectives, themes, and measures and also balances them in a generic form into
customer, financial and internal processes as well as valuable organisational learning
perspectives. (p. 18)
Malcolm Baldrige Award Framework
While all educational institutions engage in strategic planning, UW-Stout’s use of the balanced
scorecard is quite unique among higher education institutions. The university’s innovative
strategic planning process led to the university being presented with the Malcolm Baldrige
National Quality award in 2001.
Established in 1987 by the U.S. Department of Commerce (and administered by the National
Institute for Standards and Technology), the Malcolm Baldrige Award recognizes quality in a
variety of sectors, including manufacturing, service, health care, small businesses, and education
(Baldrige Performance Excellence Program, 2017; Crum-Allen & Bierlein Palmer, 2016; Furst-
Bowe & Wentz, 2006). The focus of the award is on continual self-assessment and improvement
as well as identifying role model organizations that exemplify the award’s framework and
criteria (Jasinski, 2004; Karimi, Safari, Hashemi, & Kalantar, 2014). The Baldridge criteria
essentially focus on three questions: “Is your organization doing as well as it could? How do you
know? What and how should your organization improve or change?” (Baldrige Excellence
Framework, 2017, p. ii). These guiding questions challenge an organization to reflect on their
processes and results.

INFUSING DATA CAMPUS-WIDE
Mid-Western Educational Researcher • Volume 30, Issue 4 211
Specifically, the Baldrige framework for Education lists seven interrelated categories: leadership;
strategy; customers; measurement, analysis, and knowledge management; workforce; operations;
and results (Baldrige Excellence Framework, 2017). The Baldrige framework emphasizes a
systems perspective, focusing on the interrelated nature of the various units within an
organization. It focuses on processes or “…the methods your organization uses to accomplish its
work” (2017, p. iii), such as a survey to collect data. Within that process approach, the
framework explores assessment and improvement along the following four dimensions:
approach, deployment, learning, and integration.
Table 2
Baldrige Excellence Framework Dimension Definition Examples
Approach The approach dimension asks “How do
you accomplish your organization’s work?
How effective are your key approaches?”
(Baldrige Excellence Framework, 2017, p.
iii).
Examples of the approach dimension include
a survey instrument or assessment tool that is
administered on a regular cycle. The
Baldrige framework encourages
organizations to examine how effective those
tools are in acquiring the information needed.
Deployment The deployment dimension explores “How
consistently are your key approaches used
in relevant parts of your organization?”
(Baldrige Excellence Framework, 2017, p.
iii).
The approach (e.g., survey instrument)
should be sent to the appropriate units within
an organization and to the appropriate
stakeholders at the appropriate time.
Deployment could also address including
appropriate units in the follow-up actions
associated with the survey.
Learning The learning dimensions asks “How well
have you evaluated and improved your
key approaches? How well have
improvements been shared within your
organization? Has new knowledge led to
innovation?” (Baldrige Excellence
Framework, 2017, p. iii).
Organizational learning emphasizes
incremental improvement and refinements to
the existing approaches, which can lead to
innovations in existing approaches or
products, or creating new ones. For example,
learning could include changes made to a
survey instrument or process based on
feedback.
Integration “The integration dimension asks:
How well do your approaches align with
your current and future organizational
needs? How well do your measures,
information, and improvement systems
complement each other across processes
and work units? How well are processes
and operations harmonized across your
organization to achieve key organization-
wide goals?” (Baldrige Excellence
Framework, 2017, p. iii)
The integration dimension explores how the
information learned is included and aligned
with the organization’s processes, resources
decisions, plans, and institution-wide goals.

INFUSING DATA CAMPUS-WIDE
Mid-Western Educational Researcher • Volume 30, Issue 4 212
The Baldrige Framework is a very successful approach to organizational assessment and
improvement; organizations that utilize the Baldrige Framework see positive results, such as
reduced costs and turnover (Ruben, 2006, 2007). Further, Lee and Ooi (2015) contend that
organizations using the Baldrige Framework create a culture in which information is stored more
effectively. These positive results associated with the Baldridge framework are what make it
ideal for higher education planning (Jasinski, 2004).
Both the Baldrige Framework and the balanced scorecard provide useful tools for institutional
researchers. Higher education is under increased public scrutiny based on perceptions that the
value or quality of a degree may not justify the cost of that degree. The systems approach
inherent in the Baldrige Framework addresses the issue of higher education silos, or lack of
communication and/or coordination between units or departments, by purposefully exploring the
connections between units of an organization and fostering communication. The Baldrige
Framework is ideal for strategic planning, exploring the issues facing a higher education
institution (e.g., declining enrollments and retention rates and increasing costs) and providing a
mechanism for improvement. The framework examines results from the viewpoints of both
internal and external stakeholders, as well as fostering reflection on the future and how the
university is learning, growing, and integrating new insights.
To be successful, institutions need to have multiple approaches at multiple levels (i.e.,
university-wide, unit, department, and program), make the data available and accessible to all
individuals at all these levels, integrate the review of these data into multiple existing
approaches, and then take action at different levels as well. Below, we will describe how this is
accomplished at UW-Stout. This process aligns with the Malcolm Baldrige National Quality
Award evaluation criteria of approach, deployment, learning and integration, and the AIR
Aspirational Statements of Institutional Research. UW-Stout is well-positioned to meet these
multiple needs as the first four-year institution of higher education to receive the award and one
of ten founding institutions nationally that contributed to the AIR Aspirational Statement of
Institutional Research (2016). UW-Stout has been acknowledged as an exemplar of balanced
score card implementation in a higher education context (Beard, 2009; Brown, 2012). According
to Beard (2009), “Evaluating performance by using key-performance indicators and
incorporating those evaluations into strategic planning have served these institutions well in their
search for and attainment of continuous improvement” (p. 278).
The University of Wisconsin-Stout and the Malcolm Baldrige Award
In 2001, the University of Wisconsin-Stout became the first higher education institution to
receive the Baldrige Award. However, the road to that accomplishment was not an easy one.
After the passage of a vote of no confidence in its chancellor in the mid-1990s, the university
began to transform. Furst-Bowe and Wentz (2006) explained: “Following this crisis, there was a
need to significantly change the campus leadership structure to address concerns regarding
communication, trust, and decision-making. By 2001, this change was complete and leadership
was described as a key strength in the Baldrige feedback report” (p. 46).
In addition to the leadership crisis, the university was using too many metrics or inadequate
metrics, which led to inconsistencies in how the metrics were used. The Baldrige Framework

INFUSING DATA CAMPUS-WIDE
Mid-Western Educational Researcher • Volume 30, Issue 4 213
helped the institution streamline and align metrics and measures to support the mission of the
university in a way that supported systematic and continuous improvement (Furst-Bowe &
Bauer, 2007). UW-Stout began focusing on measurements their stakeholders valued, particularly
employment of their graduates (Thompson & Koys, 2010). Since receiving the award, UW-Stout
continues to hone and improve their planning process by refining performance indicators,
expanding membership in strategic planning, and creating a more systematic approach for
developing action plans (Furst-Bowe & Wentz, 2006). Specifically, every five years the Strategic
Planning Group engages in a comprehensive review and update of the performance indicators
(i.e. metrics) for the next strategic plan (see Figure 4).
Figure 4. The comprehensive review and update process of performance indicators at UW Stout.
Furst-Bowe and Wentz (2006) explained the benefits of this approach:
Certainly, adoption of the Baldrige model does not make a university impervious to
changing environments. The value of the Baldrige model is the integration and operation
of the university as a system, enabling the university to anticipate changes, evaluate
impacts, and respond with greater accuracy and agility (p. 48).
Cooke (1996) argues that many higher education institutions tend to be focused internally. The
Baldrige Framework emphasizes an external focus that integrates internal and external
stakeholder needs and expectations. For UW-Stout, utilizing the Baldrige Framework has
increased communication between institutional units and with internal and external stakeholders.
The Baldrige Framework at UW-Stout
At UW-Stout, the approach starts with identifying a small number of performance indicators
used to assess the overall success of the university’s strategic plan. These indicators are
developed by the strategic planning group and updated every five years. In identifying these
performance indicators, the strategic planning group considers a number of factors, as shown in
Figure 4.1.
Figure 4.1. Factors for the strategic planning group to consider when identifying performance
indicators.

INFUSING DATA CAMPUS-WIDE
Mid-Western Educational Researcher • Volume 30, Issue 4 214
These metrics are deployed campus-wide through a cascading scorecard—an interactive
dashboard. The dashboard is interactive in that the individual using the scorecard chooses how to
view the data. The scorecard displays performance metrics used throughout the institutional
planning process by a variety of stakeholders, including all levels of administration, strategic
planning groups (at the university-wide, unit, department, and program levels), and faculty/staff
(see Figure 5). The scorecard tracks performance with respect to organizational goals, to ensure
that all faculty and staff are involved in tracking progress toward reaching these goals, to inform
strategic plan implementation, and to promote integration of efforts across all levels of the
organization. This expansive deployment also serves to engage a broad group of decision-makers
in these processes in alignment with the AIR Aspirational Statement.
Figure 5. A visual of how the scorecard is reviewed and deployed.
UW-Stout has a five-year strategic planning cycle in which goals for the endpoint of the cycle
are established, performance indicators and related metrics are identified and gathered, progress
is reviewed regularly, and action items are developed and assigned to existing or new
committees to accomplish. The balanced scorecard, which cascades to multiple levels in the
organization (e.g., university, college, department/unit), plays a role in many of these activities.
It gives all members of the organization an opportunity to understand their own unit’s relative
standing or contribution to overall performance metrics, promotes ongoing review of these
indicators in the planning activities at all levels, and facilitates the integration and coordination
of efforts across the entire organization.

INFUSING DATA CAMPUS-WIDE
Mid-Western Educational Researcher • Volume 30, Issue 4 215
The cascading scorecard displays information drawn from routinely-gathered performance
indicators, program facts, survey data, and other studies and reports related to university goals.
The scorecard uses Tableau data analytics (https://www.tableau.com/) to provide a user-friendly
interface to access the vast array of performance-related data available on the organization. The
scorecard is divided into three dashboards: student outcomes, faculty/staff performance
indicators, and other (see Figure 6.1).
Figure 6.1. Performance Indicator Dashboard landing page
Student-related information includes enrollment, retention, and graduation rates, as well as
engagement data (from the National Survey of Student Engagement), learning outcomes data
(e.g., student participation in applied learning activities and intercultural competence results),
exit survey information, and job/continuing education placement statistics. As shown in Figure
6.2, for example, the dashboard includes trend data compared to the target, as well as a
breakdown by various demographic groups. In this particular example, data are broken down by
undergraduate/graduate and by gender (that is color-coded with detailed numbers, which can be
seen by hovering over the graph on the site; see Figure 6.2). Additionally, most student data are
able to be interactively disaggregated by race/ethnicity and class level (see Figures 6.3 and 6.4).

INFUSING DATA CAMPUS-WIDE
Mid-Western Educational Researcher • Volume 30, Issue 4 216
Figure 6.2. Example of an enrollment visual within the student dashboard.
Figure 6.3. Example of an enrollment by race and program (major) visual within the student
dashboard.
INFUSING DATA CAMPUS-WIDE
Mid-Western Educational Researcher • Volume 30, Issue 4 217
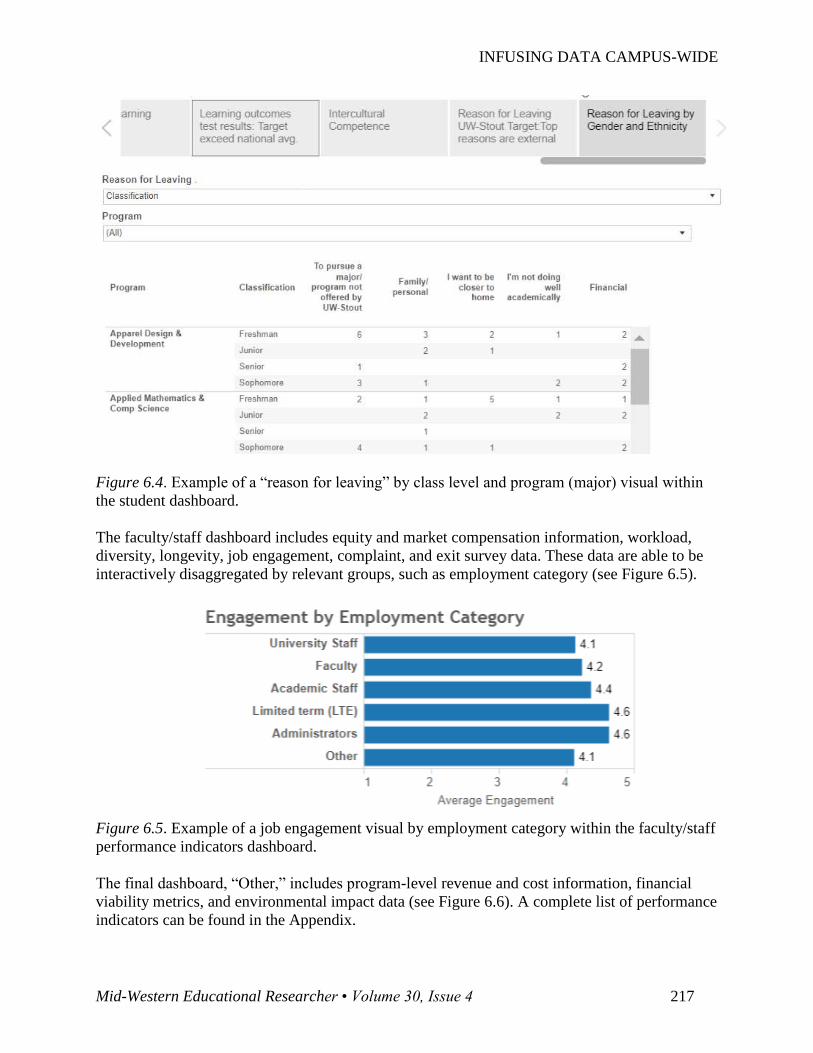
Figure 6.4. Example of a “reason for leaving” by class level and program (major) visual within
the student dashboard.
The faculty/staff dashboard includes equity and market compensation information, workload,
diversity, longevity, job engagement, complaint, and exit survey data. These data are able to be
interactively disaggregated by relevant groups, such as employment category (see Figure 6.5).
Figure 6.5. Example of a job engagement visual by employment category within the faculty/staff
performance indicators dashboard.
The final dashboard, “Other,” includes program-level revenue and cost information, financial
viability metrics, and environmental impact data (see Figure 6.6). A complete list of performance
indicators can be found in the Appendix.

INFUSING DATA CAMPUS-WIDE
Mid-Western Educational Researcher • Volume 30, Issue 4 218
Figure 6.6. Example of a performance indicator visual within the other performance indicators
dashboard.
The scorecard continues to be refined and improved over time. Recent and ongoing revisions
include the addition of new performance indicators, simplifying the interface, consolidating
graphs when possible, incorporating trend data, and balancing detail with visual simplicity and
usability considerations.
Performance metrics are integrated into multiple processes, including the program review
process, educational support unit review process, strategic planning process, and accreditation
process. For example, in both the program review process and educational support unit review
process, units are provided data from relevant performance indicators and asked to comment on
what they are doing to achieve those targets. The Strategic Planning Group formally reviews
progress on these metrics once per year and also aligns strategic planning initiatives with
relevant performance indicators. Involvement of these groups also serves to broaden the group of
data-based decision-makers in alignment with the AIR Aspirational Statements.
Actions or learning associated with the performance indicators appear in many places, including
unit action plans, university action plans, university priorities, Planning and Review Committee

INFUSING DATA CAMPUS-WIDE
Mid-Western Educational Researcher • Volume 30, Issue 4 219
(PRC) reports on academic programs, Educational Support Unit Review Committee (ESURC)
reports on non-academic units, and accreditation follow-up actions. Examples include a
university-wide student jobs program developed in response to concerns about stagnant retention
rates, the development of program-specific marketing plans to increase student enrollment,
initiatives to increase student outcomes for racial/ethnic minorities to reduce the gap in retention
and graduation rates, and initiatives to create a more welcoming environment in response to
campus climate data.
For example, the retention rate was remaining flat, at around 69-71% year after year, despite
efforts to improve it. Previous research showed that students who had jobs on campus had higher
retention rates than the campus average. Further, engagement session feedback suggested that the
university needed to identify more opportunities to engage students in campus activities as early
as possible. As a result, in 2011, the Strategic Planning Group identified the need for a new
initiative to improve retention that focused on expanding existing offerings to promote student
involvement on campus. First offered in 2012, the program paired students with a faculty and
staff mentor and utilized high impact practices. Evaluation results demonstrated high retention
rates for students in the program, so it has since been continued and expanded.
Conclusion
UW-Stout offers a model that can be used and adapted by other institutions, including K-12 and
non-educational organizations, to align institutional research data with strategic priorities and
drive institutional change. This model also connects the Baldrige Framework, balanced scorecard
methodology, and the AIR Aspirational Statements for Institutional Research. The Baldrige
Framework offers a roadmap that institutions can follow to better align data, information and
institutional actions, and therefore make strategic planning more integrated and systematic. The
AIR Aspirational Statements for Institutional Research offer direction as to appropriate internal
stakeholders and decision-makers that need to be involved in the process. This approach helps
with addressing growing pressures in higher education, including performance-based funding
and increased accountability with external stakeholders.
Author Notes
Meridith Wentz is an Assistant Chancellor and the Director of the Planning, Assessment,
Research and Quality Office at the University of Wisconsin-Stout. Amanda Brown is a Professor of Communication Studies in the Department of Communication
Studies, Global Languages, and Performing Arts at the University of Wisconsin-Stout. Jeff Sweat is a Professor of Sociology & Strategic Planning Analyst in the Social Science
Department at the University of Wisconsin-Stout. Correspondence regarding this article should be addressed to Meridith Wentz at

INFUSING DATA CAMPUS-WIDE
Mid-Western Educational Researcher • Volume 30, Issue 4 220
References
Albertyn, R., & Frick, L. (2016). A collaborative higher education initiative for leadership
development: Lessons for knowledge sharing. South African Journal of Higher
Education, 30(5), 11-27.
Arif, M. A., & Smiley, F. M. (2004). Baldrige theory into practice: A working model.
International Journal of Educational Management, 18(5), 324-328.
doi:10.1108/09513540410543475
Baldrige Performance Excellence Program (2017). 2017-2018 Baldrige Excellence Framework
(Education): A systems approach to improving your organization’s performance.
Gaithersburg, MD: U.S. Department of Commerce, National Institute of Standards and
Technology. https://www.nist.gov/baldrige
Beard, D. F. (2009). Successful applications of the balanced scorecard in higher education.
Journal of Education for Business, 84(5), 275-282. DOI: 10.3200/JOEB.84.5.275-282
Beard, D. F., & Humphrey, R. L. (2014). Alignment of university information technology
resources with the Malcolm Baldrige results criteria for performance in excellence in
education: A balanced scorecard approach. Journal of Education for Business, 89(7),
382-388. doi:10.1080/08832323.2014.916649
Booth, S. (2013). Utilizing benchmarking to inform decision-making at the institutional level:
A research-informed process. Journal of Institutional Research, 18(1), 1-12. Retrieved
from http://www.eric.ed.gov/contentdelivery/servlet/ERICServlet?accno=EJ1094093
Brown, C. (2012). Application of the balanced scorecard in higher education. Planning for
Higher Education, 40(4), 40-50.
Brown, J. T. (2017). The seven silos of accountability in higher education: Systematizing
multiple logics and fields. [Special issue]. Research & Practice in Assessment, 11, 41-58.
Retrieved from
http://www.eric.ed.gov/contentdelivery/servlet/ERICServlet?accno=EJ1137933
Calderon, A., & Mathies, C. (2013). Institutional research in the future: Challenges within
higher education and the need for excellence in professional practice. New Directions for
Institutional Research, 157, 77-90.
Chambers, S., & Gerek, M. L. (2007, February). IR activities. IR Applications, 12, 1-24.
Tallahassee, FL: Association for Institutional Research. Retrieved from
https://files.eric.ed.gov/fulltext/ED504324.pdf

INFUSING DATA CAMPUS-WIDE
Mid-Western Educational Researcher • Volume 30, Issue 4 221
Cooke, B. (1996, May). Institutional advancement: Using the Malcolm Baldrige National
Quality Award criteria for self-study and accreditation. Paper presented at the National
Institute for Staff and Organizational Development Conference on Teaching and
Leadership Excellence, Austin, TX.
Crum-Allen, P., & Bierlein Palmer, L. (2016). Alignment of CTE Centers with the Baldrige
Quality Award in education criteria: Perceptions of leaders and faculty. Career and
Technical Education Research, 41(1), 49-64. doi:10.5328/cter41.1.49
del Sordo, C., Orelli, R. L., Padovani, E., & Gardini, S. (2012). Assessing global performance
in universities: An application of balanced scorecard. Procedia – Social and Behavioral
Sciences, 46, 4793-4797. doi:10.1016/j.sbspro.2012.06.336
Fincher, C. (1978). Institutional research as organizational intelligence. Research in Higher
Education, 8(2), 189-192.
Furst-Bowe, J. A., & Bauer, R. A. (2007). Application of the Baldrige model for innovation in
higher education. New Directions for Higher Education, 2007(137), 5-14.
Furst-Bowe, J. A., & Wentz, M. (2006). Beyond Baldrige: What the first institution of higher
education to receive the Malcolm Baldrige National Quality Award has learned in the
five years since. University Business, 9(10), 45-48.
Hillman, N. W., Hicklin Fryar, A., & Crespin-Trujillo, V. (2018). Evaluating the impact of
performance funding in Ohio and Tennessee. American Educational Research Journal,
55(1), 144-170. doi: 10:3102/0002831217732951
Hladchenko, M. (2015). Balanced scorecard— A strategic management system of the higher
education institution. International Journal of Educational Management, 29(2), 167-176.
doi: 10.1108/IJEM-11-2013-0164
Jasinski, J. (2004). Strategic planning via Baldrige: Lessons learned. New Directions for
Institutional Research, 2004(123), 27-31.
Kaplan, R. S., & Norton, D. P. (1992). The balanced scorecard: Measures that drive
performance. Harvard Business Review, 70(1), 71-79.
,
Kaplan, R. S., & Norton, D. P. (1996). Using the balanced scorecard as a
strategic management system. Harvard Business Review, 74(1), 75-85.
Karathanos. D., & Karathanos, P. (2005). Applying the balanced scorecard to education. Journal
of Education for Business, 80(4), 222-230. doi:10.3200/JOEB.80.4.222-230
Karimi, A., Safari, H., Hamid Hashemi, S., & Kalantar, P. (2014). A study of the Baldrige
Award framework using the applicant scoring data. Total Quality Management, 25(5),
461-477.

INFUSING DATA CAMPUS-WIDE
Mid-Western Educational Researcher • Volume 30, Issue 4 222
Kettunen, J. (2010). Strategy process in higher education. Journal of Institutional Research,
15(1), 16-27. Retrieved from https://files.eric.ed.gov/fulltext/EJ1094149.pdf
Kettunen, J. (2015). Stakeholder relationships in higher education. Tertiary Education and
Management, 21(1), 56-65. doi:10.1080/13583883.2014.997277
Lee, V., & Ooi, K. (2015). Applying the Malcolm Baldrige National Quality Award criteria:
An approach to strengthen organizational memory and process innovation. Total Quality
Management, 26(12), 1373-1386.
McGowan, V. (2016). Improving institutional report card indicators. International Journal of
Education and Development Using Information and Communication Technology, 12(1),
4-19. Retrieved from https://files.eric.ed.gov/fulltext/EJ1099574.pdf
McLaughlin, G. W., Howard, R. D., & Branblett, S. (2012). Institutional research and planning
in higher education in the United States and Canada. In R. D. Howard, McLaughlin, G.
W., W. E. Knight, and Associates (Eds.), The handbook of institutional research (pp. 43-
57). San Francisco, CA: Jossey-Bass.
Miller, T. (2016). Higher education outcomes-based funding models and academic quality.
Lumina Foundation. Retrieved from
https://www.luminafoundation.org/files/resources/ensuring-quality-1.pdf
Reda, N. W. (2017). Balanced scorecard in higher education institutions. Quality Assurance in
Education, 25(4), 489-499.
Ruben, B. D. (2006). Linking accreditation and the Malcolm Baldrige Framework. Academic
Leader, 22(5), 3-5.
Ruben, B. D. (2007). Higher education assessment: Linking accreditation standards and the
Malcolm Baldrige criteria. New Directions for Higher Education, 2007(137), 59-83.
Swing, R. L., & Ross, L. E. (2016). Statement of aspirational practice for institutional research.
Tallahassee, FL: Association for Institutional Research, Tallahassee, Florida. Retrieved
from http://www.airweb.org/aspirationalstatement
Taylor, J., Hanlon, M., & Yorke, M. (2013). The evolution and practice of institutional
research. New Directions for Institutional Research, 2013(157), 59-75. doi:
10.1002/ir.20039
Taylor, B. J., Webber, K. L., & Jacobs, G. J. (2013). Institutional research in light of
internationalization, growth, and competition. New Directions for Institutional Research,
157, 5-22. doi:10.1002/ir
Terenzini, P. T. (1993). On the nature of institutional research and the knowledge and skills it
requires. Research in Higher Education, 34(1), 1-10.

INFUSING DATA CAMPUS-WIDE
Mid-Western Educational Researcher • Volume 30, Issue 4 223
Terenzini, P. T. (2013). “On the nature of institutional research” revisited: plus ca change…?.
Research in Higher Education, 54(2), 137-148. doi:10.1007/s11162-012-9274-3
Thompson, K. R., & Koys, D. J. (2010). The management curriculum and assessment journey:
Use of Baldrige criteria and occupational network database. Journal of Leadership &
Organizational Studies, 17(2), 156-166. doi:10.1177/1548051810369341
U.S. Department of Education (2018) College scorecard communications toolkit: Back to
school and the college scorecard. Retrieved from
https://collegescorecard.ed.gov/assets/College-Scorecard-Toolkit.pdf
Volkwein, J. F. (1999). The four faces of institutional research. New Directions for Institutional
Research, 1999(104), 9-19.
Volkwein, J. F. (2008). The foundations and evolution of institutional research. New Directions
for Higher Education, 2008(141), 5-20. doi:10.1002/he.289
Volkwein, J. F., Liu, Y., & Woodell, J. (2012). The structure and functions of institutional
research offices. In R. D. Howard, G. W. McLaughlin, W. E. Knight, & Associates
(Eds.), The handbook of institutional research (pp. 22-39). San Francisco, CA: Jossey-
Bass.
Voorhees, R. A., & Hinds, T. (2012). Out of the box and out of the office: Institutional research
for changing times. In R. D. Howard, G. W. McLaughlin, W. E. Knight, & Associates
(Eds.), The handbook of institutional research (pp. 73-85). San Francisco, CA: Jossey-
Bass.

INFUSING DATA CAMPUS-WIDE
Mid-Western Educational Researcher • Volume 30, Issue 4 224
Appendix
Performance Indicators
Faculty/Staff Dashboard Performance Indicator Definition
Internal equity Difference between actual and expected salaries based on regression analysis.
External market Average percent of market of salaries for faculty/staff.
SCH/FTE Student-credit hours per full-time equivalent employee. Student credit hours
reflect the credit value of a course multiplied by the number of students enrolled
in that course. For example, if a 4 credit course enrolls 30 students, the
faculty/staff member would be assigned 120 student credit hours. One FTE is
equivalent to one faculty/staff working full-time. An FTE of 1.0 is equivalent to
a full-time faculty/staff, while an FTE of 0.5 signals half of a full workload.
Average credit load Average credit load taught in the fall semester.
Faculty/staff of color Percent of faculty and staff who are of color (includes faculty, limited
appointments, instructional academic staff, professional academic staff,
university staff and graduate assistants).
Job Engagement Response to Campus Climate survey question administered to all faculty and
staff, “I am committed to, believe in UW-Stout, and I have freedom and
autonomy to contribute, succeed, grow and develop in my workplace
environment. Based on this definition, I am engaged at UW-Stout:” (4 point
scale: Rarely, Occasionally, Most of the Time, Always.)
Longevity Percentage of faculty and staff employed at Stout broken down by years
employed.
Reasons for leaving Top five self-reported reasons for faculty and staff leaving UW-Stout.

INFUSING DATA CAMPUS-WIDE
Mid-Western Educational Researcher • Volume 30, Issue 4 225
Students Dashboard
Performance Indicator Definition
Enrollments Total headcount enrollment and full-time equivalent enrollment. The Full-Time
Equivalent for a student is based on official credits and student level. It is
computed by dividing the student official credits at each level by the average
number of credit hours carried per semester of the various student levels.
Undergrads would be 15, Master and EDS would be 12, EDD would be 7.
Career outcome rates Percentage of students self-reporting employment or continuing their education
on the First Destination Employment Survey.
Applied learning Percentage of students participating in capstone courses, co-ops/internships,
field experiences, practicum, service learning, student research, student
teaching, and study abroad prior to graduation.
Student engagement The National Survey of Student Engagement (NSSE) includes ten engagement
indicators to provide a summary of the detailed information contained in the
survey responses. The ten indicators are based on three to eight survey questions
each with an aggregate mean score of 0 to 60. This metric includes mean rating
on the ten indicators, which are higher order thinking, learning strategies,
quantitative reasoning, reflective/integrative learning, collaborative learning,
discussion with diverse others, effective teaching practices, quality of
interactions, student-faculty interaction, and supportive environment.
Intercultural
competence
Mean student ratings based on course artifacts on the Intercultural Competence
Metric rubric, which includes a scale of global consciousness (ability to
understand, value and acknowledge other cultures, demonstrate open-
mindedness, and act effectively in non-native settings) and depth of knowledge
(ability to explain their global perspective).
Retention rates First to second year retention rate for first time, full-time freshmen for
undergraduates and for full-time graduates.
Graduation rates 6-year graduation rate for undergraduates who start at UW-Stout and graduate
from UW-Stout, 7-year graduation rates for graduate students who start at UW-
Stout and graduate from UW-Stout.
Starting salaries Three-year average of starting salaries of graduates.
Employer rating of
preparation
Mean ratings on "degree that employee exhibited educational preparation to
perform role within the organization" from the Employer Survey.
Reasons for leaving Top five self-reported reasons why students are leaving UW-Stout without
graduating.
Credits to degree Average credits to degree by Bachelor’s degree recipients.

INFUSING DATA CAMPUS-WIDE
Mid-Western Educational Researcher • Volume 30, Issue 4 226
Other Dashboard
Performance Indicator Definition
Program cost Per each program plan, department cost per SCH to the program plan’s required
course credits related to each department’s cost.
Revenue/cost Revenue generated by department divided by expenses charged to that
department’s funding strings plus an allocation of college-level overhead
expenses allocated to each of the college’s departments.
Sources of revenue Listing of sources of revenue at UW-Stout and dollar amount and percentage for
each.
Financial viability Composite Financial Index (CFI) (measures financial health) and Primary
Reserve Ratio, which is one of the core ratios included in the CFI. The CFI
utilizes four core ratios: the primary reserve ratio, the viability ratio, the return
on net assets ratio, and the net operating revenues ratio.
Greenhouse emissions
Scope1, 2 and 3 Greenhouse Gas Emissions associated with the American
College and University Presidents' Climate Commitment. Scope 1 is direct
emissions, Scope 2 is indirect emissions mostly associated with purchased
utilities, and Scope 3 is other indirect emissions from sources that are not owned
or controlled by the campus but are central to campus operations.