Infrastructure Quality, Local Government Spending and ...
20
Infrastructure Quality, Local Government Spending and Corruption Research Report #1
Transcript of Infrastructure Quality, Local Government Spending and ...

Infrastructure Quality,Local Government Spendingand Corruption
Research Report #1
Research Team KPPOD:
Ig. Sigit MurwitoBoedi RhezaSri Mulyati
Elizabeth KarlindaRatnawati Muyanto
December 2012
Komite Pemantauan Pelaksanaan Otonomi DaerahRegional Autonomy Watch
Permata Kuningan Building 10 th Fl.Guntur Setiabudi, Jakarta Selatan 12980
Phone: +62 21 8378 0642/53, Fax.: +62 21 8378 0643

1
Infrastructure Quality, Local Government Spending, and Corruption
AbstractAbstract
We study on how a larger local government budget on infrastructure does not refl ect into good quality of road in forty-one district/city across Indonesia given the fact of low infrastructure quality and low government spending on infrastructure. This
study excels its preceded studies done by Tanzi and Davoodi (1997) at country level. The methodology used is a combination of quantitative and qualitative approach since our main research query is to seek facts on why a larger government spending is not followed by bett er quality of infrastructure. Our empirical strategy proved that corruption has aff ected government spending directly refl ecting cost of corruption has been included as infrastructure project cost. We argue that corruption does aff ect quality of infrastructure negatively through government spending. Given the fact of Indonesian decentralization system enabling local election at district/city level it gives more room for decision-making process that has never been conducted before under centralized system. Corruption tends to occur in situation where the monitoring eff ort of central bureaucrat does exist while participation of local civil society is low. Although a district has already implemented e-procurement system intended to reduce opportunity of corruption incidence, it still exists through hidden-agreement between bureaucrat and such contractor who agree upon the project announcement process. They agree to set bid-price at lower level so that the contractor can win the project. This unfair process is suspected to happen since the budgetary process taking place at legislative where political bargaining is massive.

2
2005 to Rp 2.1 quintillion in 2010 (World Bank, 2012). However, its percentage to total regional spending was increased from 2005 to 2009 only. While during 2010 – 2011 the percentage of infrastructure spending was decreased from 15 percent to 13 percent (based on 2010 APBD Amendment and 2011 APBD Plan). The spending in infrastructure sector in percentage to total local government spending was increased only 4 percent, i.e. from 18 percent in 2002 to 22 percent in 2006 in Gorontalo Province (World Bank, 2008).
However, in the case of South Sulawesi Province, the increase of government budget was not followed by an increase in road infrastructure quality; about 37.6 percent of respondent said that road quality in dis-tricts/cities was bad in 2011, while only 26.6 percent of respondent felt the same situation in 2007 (KPPOD, 2011). To improve condition of deteriorate roads in districts/cities of South Sulawesi it was required about
131 days in 2011, while in 2007 the same condition of roads only required 42 days. Such contrary condition has urged a motivation to this study to examine what kinds of factors caused the situation.
In order to fi nd the answer, KPPOD has undertaken a simple correlation test regarding correlation be-tween low qualities of roads with local government spending increase (Figure 1). The linear correlation line drawn from left -bott om side to right-top side shows a positive correlation between the two vari-ables. Such result is a plot randomly made towards
I. BackgroundThe Government of Indonesia has made some development programs recently to improve conditions of physical infrastructure. One of the programs is MP3EI which contains, among others development of physical infrastructure at some corridors which are focused at economic growth centers such as North Sumatera for western side and South Sulawesi for eastern side. Such Government plan is defi nitely an important step to overcome the problem of low infrastructure quality in Indonesia, which position according to World Economic Forum (2010), is ranked 76 out of 142 countries, whilst neighbor countries’ ranks such as Malaysia and Thailand are 26 and 42.
A study result by KPPOD (2011) regarding business-man perception in the regions shows that infrastruc-ture has been the main obstacle in addition to the pro-
gram of private business sector development by local government, interaction between local government and businessman, and business licensing. In this case, infrastructure condition in Indonesia is currently worse and certainly needs a government comprehen-sive and integrative program to improve.
Such government plan is accompanied by an increase in spending on infrastructure sector. Government of South Sulawesi Province, for example, has increased riil spending in infrastructure sector, almost doubled between 2005 – 2010, i.e. from Rp 1 quintillion in

3
Infrastructure Quality, Local Government Spending, and Corruption
the 25 districts/cities in Indonesia, each of which has implemented Government Accounting System (SAP) in their APBD realization report. Based on such early fi nding, we develop a research query, i.e. ‘why a larger local government spending budget in infrastructure sector is not followed by a bett er quality of road infrastructure?’Government spending on infrastructure sector is a public investment which could improve productivity on production factors which in turn would promote economic growth. For decision makers in private sector as well as in public sector, such government spending may become a sign which enabling a higher economic growth following implementation of infra-structure improvement policy. However, some stud-ies at national level have shown that public invest-ment management is not necessarily successful in boosting economic development due to corruption factor; public investment has just been a cause for a decrease in economic productivity instead (Tanzi
and Davoodi, 1997). In developing countries which have just experience democracy and relatively high economic growth, government budget management is very risky to corruption since political institutions have not been developing well (Huntington, 1968).
Indonesia which has been implementing regional autonomy system and fi scal decentralization for more than one decade has experienced a lot of corruption cases which involved Head of Local Government. In 2010 there were 17 governors of totally 33 provinces and 138 regent/mayor became corruption suspects according to Corruption Eradication Commission (KPK)1). Such corruption cases in general are related to misuse of government budget for their own interests, in particular in provision of goods and services, which has been the most common corruption case in
1). Kurniawan, Teguh, Democratic Decentralization and Corruption in Indonesia: Why Decentralization has Caused Head of Regions Aff ected by Corruption Cases. Paper presented at International Conference on Decentralization and Democratization in South East Asia, University of Freiburg, Germany, June 16, 2011
the regions, i.e. about 70% (KPK, 2011). Government spending at all districts/cities in Indonesia has been the prime mover for economic growth since private sector is relatively less developed. This local corruption has defi nitely given an impact to decreasing local economic performance. In contrary, fi ght against corruption could increase investment level about 2.9% of Bruto Domestic Product based on Business International Indices data for the period of 1980 – 1983 in 70 countries (Mauro, 1995).
In this study we do research on the research query in district/city as analysis unit. Indonesia has been perceived as one of the countries having high corruption level, ranked 100 of 182 countries surveyed (Transparency International, 2011). By focusing on lower level of government, i.e. district/city level, it is expected that the study could fi nd characteristics of institutions at the government system which
triggering corruption actions. Subsequently the study result would provide inputs to be considered in planning and supervision processes in infrastructure projects.
Corruption Defi nition Theoretically, Klitgaard (1988) describes such condition where corruption occurs, i.e. at the absence of public accountability coupled with high level of market monopoly and high power of decision maker (discretionary).
Corruption happens because there is a situation where monopoly level is high, and discretion of the leader is extensive. Combination of both may increase the risk, however if public accountability is good corruption

4
risk maybe decreased. Such situation is explained in the following diagram:
From Indonesia’s law perspective, corruption has been defi ned in Law Number 31, Year 1999 as has been changed to Law Number 20, Year 2001 regarding Eradication of Corruption Crimes. Based on the Law, corruption is divided into 30 kinds of corruption crimes. Articles in the Law explain in detail actions that could be condemned due to corruption practices. The thirty kinds of corruption crimes are grouped into seven categories, namely:1. state’s fi nancial loss2. bribery3. tampering in position4. exploitation5. deceitful action6. confl ict of interest in procurement process 7. gratifi cation.
In a simpler defi nition, the World Bank defi nes cor-ruption as a misuse of public services position for own as a misuse of public services position for own interest, and is apart from political corruption (such as illegal campaign donation, buying voters, and so on.).
Based on the abovementioned reference, in their survey Transparency International Indonesia (TII) defi nes corruption as the use of public authority for own interest. The operational concepts of corruption used in the survey are as follows (TII Report 2010, part 1, p.16): a.) Bribery: an ction of giving money to government
offi cial which is intended to get a special right or to speed up a bureaucracy process.
b.) Tampering in position: an action to utilize government facility and state’s budget as well for private use.
c.) Exploitation: an action of asking for money to client by public offi cial in carrying out his/her service duty.
d.) Confl ict of interest in goods and services procurement process: direct or indirect involvement of public offi cial in goods and services procurement process to get profi t for himself/herself or his/her group.
II. Review of the former StudyCorruption and Economic ProductivityBarro (1990) argued that infrastructure was a factor in production function, however, an investment in infrastructure sector might decrease investment in other sectors. The impact of such hypothesis is that public infrastructure which is fi nanced by the government has to consider investment made by private sector, therefore combination of both
investments might create an optimum economic growth. If the government investment is very high, the private investment will be contraproductive due to investment capacity limitedness in boosting economic growth. The following discussion shows that it is not the competition between private and public which brings down economic productivity, rather, it is the management of public investment factor.
Analysis at the state level shows that there is a positive correlation between government spending and corruption (SevUktekin et al., 2010). Composition of government spending itself has a certain impact to corruption incidence since public investment project creates opportunities for corruption to happen (ibid p.143). A study by Tanzi and Davoodi (1997) also shows that a higher public investment is obviously not productive in creating economic productivity since corruption has been worsening performance of the investment. Such corruption is made by project executor who practices bribery, gives some commissions to public offi cial who has rendered him in winning the tender of physical infrastructure project. The commission money has certainly marked up total project cost, therefore it is as if government spending in infrastructure sector is increased. Implementation process of investment project involves some stages, bears the risks of corruptions to occur, due to decision making processes, uncertainties, and vested-interest in issues such as: project specifi cations and design, goods and services bidding, construction supervision bidding, project cost negotiations, tendering approval process and contract preparation.
A corruption occurrence will reduce construction project cost by at least 5-20 percent of the total project cost (Gulati and Rao, 2006). If investment and maintenance costs is corrupted by fi ve percent, it is predicted that state fi nance in developing countries would be burdened with a predicted amount reaching US 18 billion2). In addition, a study result by Rose-Ackermann (1996) shows that illegal costs could reduce quality of government projects, and increase spending budget about 30 to 50%. In case of developing countries, corrupted money is usually enjoyed by government and military offi cials who are the elites.
Corruption does not only cause losses of public sector productivity directly, but also reducing incentives for private sector to invest (Bardhan 1997, p.1327). Corruption could increase production costs, therefore decreasing income tax from public investment. In addition, corruption also increases prices so that corruption burden would be borne by consumers. Corruption result would be more enjoyable for corruptors for their own consumption rather than
2) According to an estimate of investment and maintenance, by Fay and Yepes, 2003

5
Infrastructure Quality, Local Government Spending, and Corruption
for used in infrastructure produvtivity improvement. In such situation where rules and law are not clear and very complicated, there is a tendency that the contractor would affi liate with the state’s offi cial (Bigsten and Moene, 1996). Corruption cost would be used to smoothing infrastructure construction process and to provide incentive for bureaucrat to postpone public services so as to create rooms for negotiations which enabling corruption to occur. Such extensive corruption will certainly reduce government legitimation level because public offi cials should have been working based on prevailing rules.
According to Dellavalade (2006) corruption practice in government spending generally occurs by means of: a) a bureaucrat always tries to fi nd room for budget corruption for his/her own use, in particular at such budget item which is usually negotiable such as those in energy and defence sectors, and also in law projects to produce law and regulations; b) government projects which involve large amount of budget allocations.
A bureaucrat’s certain expectation in big amount of contract value has become an incentive for the contractor to bribe the bureaucrat. Corruption, on the other side, could increase effi ciency level where existing organization and rules are not eff ective (Meon and Weill, 2008). They made an estimation of corruption clarifi er variable and corruption-management quality interactive variable with clarifi ed variable as effi ciency level. The stuy used TI data and World Bank Governance Indicator at state’s analysis unit.
Corruption and Decentralization Decentralization may decrease or increase corruption practices. By implementing decentralization there is an improvement in local accountability by means of increased participation of society in public policy making (Cheema and Rondinelli, 1983), and increase of local government respons to the peoples’ needs (Tiebout, 1956; Oates, 1993). Decentralization may create multiple layers of control toward bureaucracy organization since there are more agents controlling the government’s ruling way (Carbonara, 1999). Higher discretion at regional level aft er implementation of decentralization has not been immediately increasing the risk of corruption occurrence. Such incidence depends on the superior’s or the higher level of government institutions’ controlling capabilities. Decentralization in principle creates a trade-off between incentive of the higher level of government institution to monitor and the hope of the lover level agent to bribe. A quantitative, empirical study by Fisman and Gatt i (2002) using country-level data fi nds that decentralization just brings down level of corruption. They made regression of decentralization, income level, population, and proportion of government spending to national GDP.
On the other side, decentralization which is also part of democratization process (to make it easier) may boost corruption incidence since politician actors appear in numbers during political reform era. Politician actor appears in larger numbers due to such situation wherein socio-culture is extensive with traditional values (Huntington, 1968). Bardhan and Mookherjee (2000) argue that at local level there are more corruption incidences because interest groups cohesiveness is higher, or because proportion number of voters having quality public information is low. An interesting fi nding of a study (by Reinikka and Svensson, 2004) shows that corruption of public budget for school happened because the school offi cer tend to make use of his high bargaining position for infl uencing local government to allocate higher budget amount. Such political, active att itude was more benefi cial for the school side, individually rather than taking passive att itude, i.e. just accepting school budget allocation made by the local government. In this case, bargaining power was more dominant than current regulations due to lack of local mass media exposes to corruption cases where local elites were more dominant in decision making at regional level (Shah, 2006, p.19).
Decentralization tends to spring more corruptors at regional level since discretion power is higher at such level (Shleifer and Vishney, 1993). Control and supervision measures undertaken by central government will be easily ineff ective at regions due to high opportunities to make collusion (Prud’homme, 1995). In a comparison study involving some states with diff erent number of decentralization levels, it is found that states with higher number of decentralization levels have higher risk of corruption practices (Treisman et al., 2008). The study was done in Uganda wherein six levels (tier) of government have caused higher government spending, i.e. 32 percent higher than those at states which have only two level of government.
A negative correlation between government spending and corruption level has been proven by Fisman and Gatt i (1999). Their study result shows that decentralization at the expenditure side tends to be problematic except if it is followed by decentralization at the income side. Low power of local tax tends to urge corruption practices since local government becomes more aggressive to non-interest groups due to high burden on tax revenues. Actually, tax revenues potentials from non-interest groups are high, however, since they have special relationship with government offi cials they tend to pay taxes lower than they should be. This situation urges local bureaucrates to be ‘acrobatic’ in looking for new targets of tax payer, i.e. non-interest groups wherein the bureaucrat has an opportunity for bargaining on big amount of taxes; this means corruption practices are more possible to occur.

6
III. Hypothesis and ModelThis studi used a combination of quantitative and qualitative methods to answer the aforementioned research query, i.e. why a larger local government spending budget in infrastructure sector is not followed by a bett er quality of road infrastructure. In principle, quantitative method examines statistical correlation of corruption variable by controlling presence of other variables toward government spending in roads infrastructure and infrastructure quality. Based on the above study discussion, we develop hypothesa as follows: 1. The higher the corruption level, the higher
government spending in infrastructure sector, ceteris paribus.
2. The higher the corruption level, the lower the government income, ceteris paribus.
3. The higher the corruption level, the lower road infrastructure quality, ceteris paribus.
4. Negative impacts of corruption on infrastructure occur through government spending in infrastructure, ceteris paribus.
Quantitative MethodThis study used data from various institutions such as Statistics Central Body, Ministry of Finance, and KPPOD at 2007 and 2010 periods. To determine regions, consideration is made upon completeness of APBD data report at the Ministry of Finance in both periods, which resulting in 41 districts/cities in four provinces in Indonesia, i.e. East Nusa Tenggara, South Sulawesi, Aceh, and West Java. There were not so many regions used as analysis unit in this study since total numbers of regions applying Government Accounting Standard (SAP) are just greater in 2007 compared to that of 2010.
Variable descriptions used in this study are as follows: • GDRPCAP or GDRP per capita, is total value of
goods and services produced in a certain region at applicable price divided by total population in the region. Data was obtained from BPS. Data of applicable price was normalized toward total population (million Rp/person) since estimated period used in this study was very short, i.e. only two points; therefore autocorrelation eff ect could be assumed as very minimum.
• INDEKSKORUP is an index containing variables to assess perception regarding corruption practices by Head of local government. These variables are more focused on corruption practices done by Head of local government rather than those done by his/her subordinates. Nonetheless, we assume corruption by Head of local government is more systemic, and it
aff ects his/her subordinates to do corruptions, and not the other way3). This index is a result of a process on KPPOD Survey data on Regional Economic Management. The higher value of the index refl ects the higher level of corruption.
• INDEKSROADQUAL is a perception index regarding riil roads quality and improvement of such roads quality relative to their former condition. This index is a result of a process on KPPOD Survey data on Regional Economic Management. The higher value of the index refl ects the bett er quality of roads.
• TOTREVGDRP is the ratio of total government income to GDRP based on applicable prices. It is assumed that infl ation impact of applicable prices utilization is none because utilization of government spending normalization and GDRP value are at the same period.
• ROADEXGDRP is the ratio of government spending in roads- irrigation- network to GDRP based on applicable prices. It is assumed that infl ation impact of applicable prices utilization is none because utilization of government spending normalization and GDRP value are at the same period.
Table 1 below shows descriptive statistics of variables used in hypothesis test in this study. Data shown here are compilation data of 2007 and 2010 which are estimated by data panel. Average values of all the variables at the three models show the same value.
IV. Result and DiscussionDevelopment of Road Infrastructure in Indonesia Indonesia is a state where investment still gives relatively low contribution to Gross Domestic Product (GDP). According to BPS, investment contribution in average is 22.56% for the period of 2004 to 2009, while consumption expenditure is still dominant in GDP structure of Indonesia, that is 55.45%. More specifi cly, investment in roads sector is very low, that is less than 2% of Indonesia’s GDP each year (Figure 3). A signifi cant decrease in roads investment happened in 1994 until 1999 when during the period investment declined by more than 50%. Such signifi cant decrease occurred when economic crisis happened in South East Asia including in Indonesia. Since Year 2000, investment in this sector tent to increase although there was a decrease in 2008. It was global economic crisis in 2008 which has caused roads investment in this year declined.Road infrastructure investment in Indonesia is still dominated by public investment which is carried out by central, provincial, and districts/cities governments.
3) Principal Agent Theory says that subordinate has just more possibility to create asymmetric information for his/her supervisor. Such situation enables the subordinate to do corruption rather than his/her supervisor.

7
Infrastructure Quality, Local Government Spending, and Corruption
Table 1. Descriptive Statistics
MODEL 1Variable Mean SE Mean StDev Minimum Median Maximumroadexgdrp 0.02085 0.00228 0.02067 0.00170 0.01451 0.09263gdrpcap 10138329 647430 5862728 2472000 8874500 37553000indekskorup 50.63 1.95 17.70 0.00 52.45 87.32indeksroadqual 50.80 1.82 16.52 6.41 50.51 94.22totrevgdrp 0.4140 0.0199 0.1799 0.0311 0.1487 1.0459
MODEL 2indeksroadqual 50.80 1.82 16.52 6.41 50.51 94.22indekskorup 50.63 1.95 17.70 0.00 52.45 87.32roadexgdrp 0.02085 0.00228 0.02067 0.00170 0.01451 0.09263
MODEL 3indeksroadqual 50.80 1.82 16.52 6.41 50.51 94.22indekskorup 50.63 1.95 17.70 0.00 52.45 87.32roadexgdrp 0.02085 0.00228 0.02067 0.00170 0.01451 0.09263gdrpcap 10138329 647430 5862728 2472000 8874500 37553000totrevgdrp 0.4140 0.0199 0.1799 0.0311 0.1487 1.0459INTRCORR-ROADEX 2.569 0.173 1.570 0.000 2.438 8.091
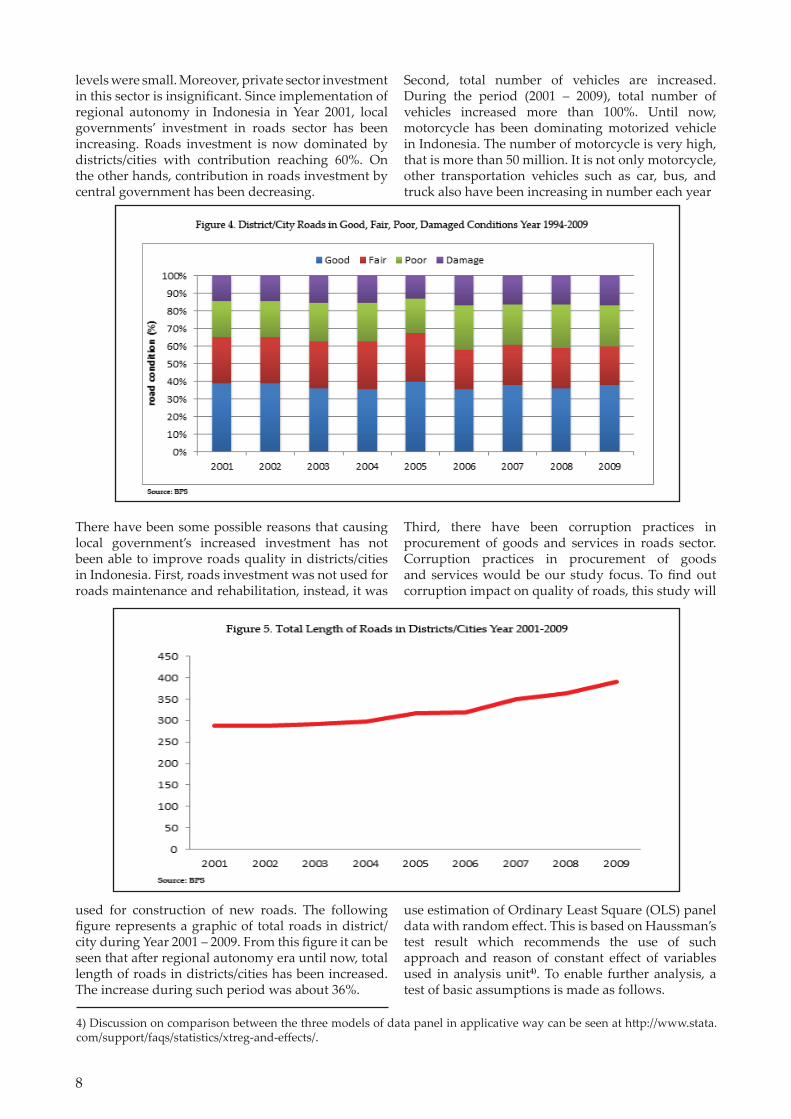
Before implementation of regional autonomy, it was central government which dominated road investment in Indonesia with more than 60% of total roads investment contribution, while contributions by local government in provincial as well as in districts/cities levels were small. Moreover, private sector investment in this sector is insignifi cant. Since implementation of regional autonomy in Indonesia in Year 2001, local governments’ investment in roads sector has been
increasing. Roads investment is now dominated by districts/cities with contribution reaching 60%. On the other hands, contribution in roads investment by central government has been decreasing. During Year 2001 – 2009, there has been a great increase in roads
investment by local government. However, during the period, there were not many changes in roads quality. The situation is shown in Figure 4 where proportion of roads with good quality was only 35% - 40%. Moreover, roads in poor and damaged conditions tend to increase. Road infrastructure investment in Indonesia is still dominated by public investment which is carried out by central, provincial, and districts/cities governments. Before
implementation of regional autonomy, it was central government which dominated road investment in Indonesia with more than 60% of total roads investment contribution, while contributions by local government in provincial as well as in districts/cities
8
levels were small. Moreover, private sector investment in this sector is insignifi cant. Since implementation of regional autonomy in Indonesia in Year 2001, local governments’ investment in roads sector has been increasing. Roads investment is now dominated by districts/cities with contribution reaching 60%. On the other hands, contribution in roads investment by central government has been decreasing.
There have been some possible reasons that causing local government’s increased investment has not been able to improve roads quality in districts/cities in Indonesia. First, roads investment was not used for roads maintenance and rehabilitation, instead, it was
used for construction of new roads. The following fi gure represents a graphic of total roads in district/city during Year 2001 – 2009. From this fi gure it can be seen that aft er regional autonomy era until now, total length of roads in districts/cities has been increased. The increase during such period was about 36%.
Second, total number of vehicles are increased. During the period (2001 – 2009), total number of vehicles increased more than 100%. Until now, motorcycle has been dominating motorized vehicle in Indonesia. The number of motorcycle is very high, that is more than 50 million. It is not only motorcycle, other transportation vehicles such as car, bus, and truck also have been increasing in number each year
Third, there have been corruption practices in procurement of goods and services in roads sector. Corruption practices in procurement of goods and services would be our study focus. To fi nd out corruption impact on quality of roads, this study will
use estimation of Ordinary Least Square (OLS) panel data with random eff ect. This is based on Haussman’s test result which recommends the use of such approach and reason of constant eff ect of variables used in analysis unit4). To enable further analysis, a test of basic assumptions is made as follows.
4) Discussion on comparison between the three models of data panel in applicative way can be seen at htt p://www.stata.com/support/faqs/statistics/xtreg-and-eff ects/.

9
Infrastructure Quality, Local Government Spending, and Corruption
Impact of Corruption on Roads on Roads Spending and Infrastructure Quality
Test on Basic Assumption of EstimationTo meet basic assumption for OLS Model (Ordinary Least Square), some tests on basic assumption of estimation were made. They are: 1. Normality test to residual model; residual Model
1 and 2 are not normally distributed (shown by signifi cant Jarque-Berra probability value). While result of the same test on two other models shows that Model 3 and 4 are distributed normally. Correction step can be made towards abnormal residuals such as variable transformation, however, this step is not eff ective. Aft er we have made logarithma transformation (all variables become insignifi cant and coeffi cient mark changed) to handle abnormality, it was found that the abnormality exists in TOTEVGDRP variable.
2. Homoskedastisitas and Autocorrelation Tests; Heteroskedastisity test is a test of varians’ similarity in inter analysis unit in data panel equation. In STATA program such test can be made by plott ing residual model, however this approach has limitation in visualization. Therefore, we made an identifi cation of heteroskedastisity problem by making an estimate to all the models. Result of the test shows that there are no problem of autocorrelation but the data have a problem of heteroskedastisity (Att achment 3). To overcome problem of data normality and heteroskedastisity, we made a correction of error standardization to the estimation coeffi cient in STATA program for all the models using robust vce facility. This step could overcome heteroskedastisity problem at the model therefore all the models become homoskedastisity.
Empirical ResultOur studi follows Tanzi and Davoodi (1997) model
to test our hypothesa by make a regression on local government spending ratio in infrastructure sector toward corruption index. In addition we added income per capita variable to control development level in a region which will infl uence the amount of local government infrastructure spending. The ratio of local government income to GDRP is also used to control local capability in fi nancing roads-irrigation-network infrastructure projects.
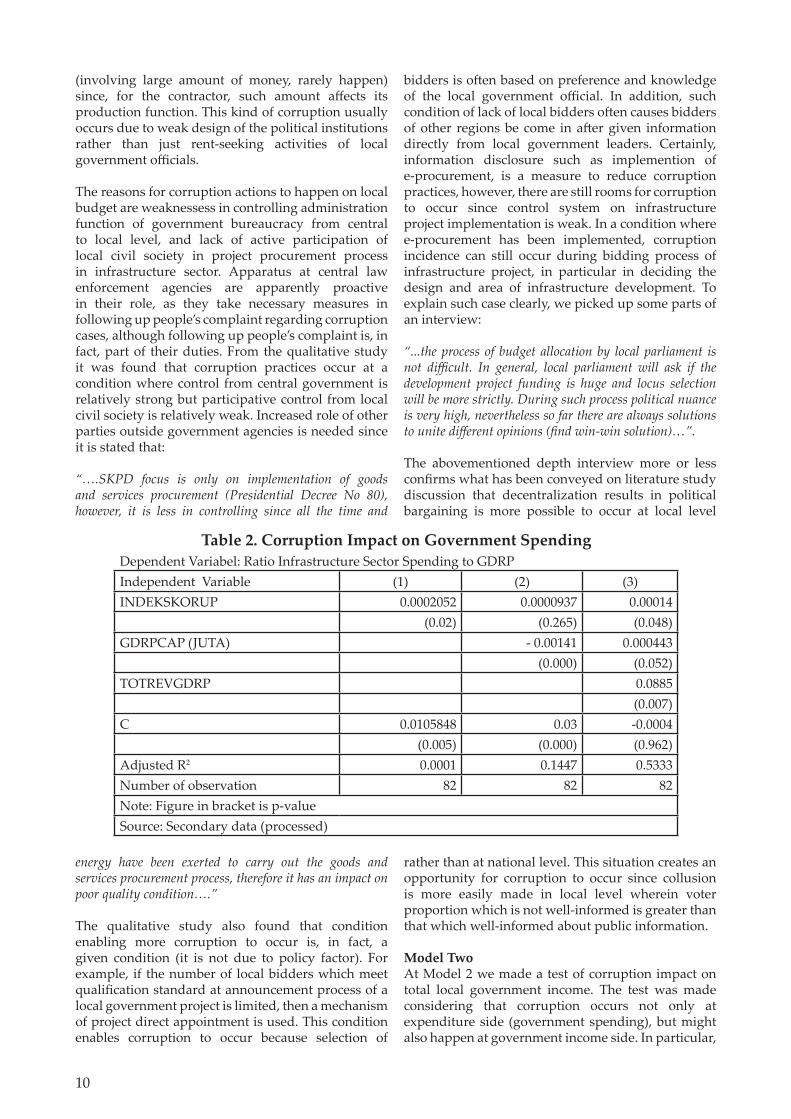
Model One Result of empirical test of Model 1 shows that higher corruption level tends to have an impact on higher local government spending in infrastructure sector (Table 2 of Equation 1 and 3). Although coeffi cient value is small in equation 3, that is 0.00014 and in equation 1 is 0.0002052, however such result supports Hypothesis 1 with 95% confi dence limit. In equation 2, corruption has no signifi cant impact to government spending. However, the regression coeffi cient mark
still indicates that an increase in corruption practices may increase local government spending in 41 districts/cities in Indonesia.
Result of empirical evidence in Model 1 (equation 1 and 3) shows that corruption has signifi cant impact on government spending although Indonesia is a state with poor infrastructure condition coupled with relatively low infrastructure budget. Nevertheless, it appears that corruption has a direct impact to government spending. Corruption practices which tend to increase local government budget happen because contractors of infrastructure projects include costs of corruption (bribery) to local government offi cials into project cost estimates (marking up). In this case, project contractors take rational action by including corruption costs into project expenses. This happen because such cost is considered signifi cant in infl uencing production costs, rather than be assumed as gratifi cation. This empirical study result implies that corruption incidence is grand corruption
10
(involving large amount of money, rarely happen) since, for the contractor, such amount aff ects its production function. This kind of corruption usually occurs due to weak design of the political institutions rather than just rent-seeking activities of local government offi cials.
The reasons for corruption actions to happen on local budget are weaknessess in controlling administration function of government bureaucracy from central to local level, and lack of active participation of local civil society in project procurement process in infrastructure sector. Apparatus at central law enforcement agencies are apparently proactive in their role, as they take necessary measures in following up people’s complaint regarding corruption cases, although following up people’s complaint is, in fact, part of their duties. From the qualitative study it was found that corruption practices occur at a condition where control from central government is relatively strong but participative control from local civil society is relatively weak. Increased role of other parties outside government agencies is needed since it is stated that:
“….SKPD focus is only on implementation of goods and services procurement (Presidential Decree No 80), however, it is less in controlling since all the time and
energy have been exerted to carry out the goods and services procurement process, therefore it has an impact on poor quality condition….”
The qualitative study also found that condition enabling more corruption to occur is, in fact, a given condition (it is not due to policy factor). For example, if the number of local bidders which meet qualifi cation standard at announcement process of a local government project is limited, then a mechanism of project direct appointment is used. This condition enables corruption to occur because selection of
Table 2. Corruption Impact on Government SpendingDependent Variabel: Ratio Infrastructure Sector Spending to GDRPIndependent Variable (1) (2) (3)INDEKSKORUP 0.0002052 0.0000937 0.00014
(0.02) (0.265) (0.048)GDRPCAP (JUTA) - 0.00141 0.000443
(0.000) (0.052)TOTREVGDRP 0.0885
(0.007)C 0.0105848 0.03 -0.0004
(0.005) (0.000) (0.962)Adjusted R2 0.0001 0.1447 0.5333Number of observation 82 82 82Note: Figure in bracket is p-valueSource: Secondary data (processed)
bidders is oft en based on preference and knowledge of the local government offi cial. In addition, such condition of lack of local bidders oft en causes bidders of other regions be come in aft er given information directly from local government leaders. Certainly, information disclosure such as implemention of e-procurement, is a measure to reduce corruption practices, however, there are still rooms for corruption to occur since control system on infrastructure project implementation is weak. In a condition where e-procurement has been implemented, corruption incidence can still occur during bidding process of infrastructure project, in particular in deciding the design and area of infrastructure development. To explain such case clearly, we picked up some parts of an interview:
“...the process of budget allocation by local parliament is not diffi cult. In general, local parliament will ask if the development project funding is huge and locus selection will be more strictly. During such process political nuance is very high, nevertheless so far there are always solutions to unite diff erent opinions (fi nd win-win solution)…”.
The abovementioned depth interview more or less confi rms what has been conveyed on literature study discussion that decentralization results in political bargaining is more possible to occur at local level
rather than at national level. This situation creates an opportunity for corruption to occur since collusion is more easily made in local level wherein voter proportion which is not well-informed is greater than that which well-informed about public information.
Model TwoAt Model 2 we made a test of corruption impact on total local government income. The test was made considering that corruption occurs not only at expenditure side (government spending), but might also happen at government income side. In particular,

11
Infrastructure Quality, Local Government Spending, and Corruption
corruption at income side happens at tax revenues, retribution, and regional business revenues. The model test result shows that corruption does not aff ect local government income. Such situation may happen since the character of government fi nancial audit at the income side is clearer rather than that at the expenditure side.
Model Three At Model 3 (in Table 4) a test of direct infl uence of corruption on roads quality was made to prove Hypotheses 3. Empirical result shows that the particular hypotheses is proven at confi dence limit of 90% with coeffi cient value of 0.167. If compared with coeffi cient value of corruption direct impact on government spending in Model 1, coeffi cient value of corruption variable is higher at Model 3. This means that corruption infl uence has a greater impact on worsening of roads infrastructure quality directly compared with that on government spending increase. At the same time, government spending in infrastructure sector has no signifi cant impat on roads quality improvement. This shows that government spending increase in infrastructure sector has no positive infl uence on roads-irrigation-network quality in 41 districts/cities across Indonesia.
Local government budget which has less impact on roads infrastructure quality improvement could be caused by poor budget planning. A fi nding of
the qualitative study shows that a collutive and manipulative process has been happening since planning process where e-procurement system has not been implemented in the particular region, as can be seen from a fi eld record as follows:
“ …during planning stage, there has been a manipulation when budget is determined, where majority Party in the Parliament, that is Golkar, oft en force their interest if there were a project with large amount of budget. At the goods and services procurement project, most portion of the budget is just for offi cial duty travel and not for goods
Table 3. Corruption Impact on Total Local Government Income Dependent Variable: Ratio of Total Local Government Income to GDRP Independent Variable (1) (2)INDEKSKORUP 0.00083 0.00041
(0.009) (0.615)GRDPCAP -0.00732
(0.004)C 0.1715 0.277
(0.000) (0.000)Adjusted R2 0.0131 0.1368Number of observation 82 82Note: Number in bracket is p-valueSource: Secondary data (processed)
and services; it turns out that it has an impact on reducing quality of the project result. Approach used to ‘force’ it is by conducting meetings for budget approval through voting mechanism. Due to large number of representative chairs owned, such a program with inaccurate budget proportion will always win”.
Nonetheless, in fact other regions which have been implementing e-procurement system still have technical constraint during implementation. Technical constraint occurs such as LPSE staff are entrusted personnels from some SKPD. Such entrusted staff s have not yet acquired required expertise to run the e-procurement system since the new system has just been implemented in year 2012, therefore there have not been any training for the responsible staff . In addition, human resource quality also determines quality of tendering process as implied from the following interview:
“…..the dangerous spots for misuse of position/for problems in goods and services procurement may be in any stages of procurement, depends on human resource behind the position. For example, in planning stage, bidding participants and the tendering committ ee have made an early agreement that there would be profi t sharing, for example, taken from materials which quality would be reduced; while misuse in tendering process is less possible since it is now an electronic process. The general case is protests made by other bidder in relation with the tendering
process in which he participates. Such protests could be on purpose or with hidden intention. In general, protesters are those bidders who lost at tendering process, and aft er being checked there are mistakes in administration stage and the mistakes are not the procurement committ ee’s fault…”
Corruption opportunities in roads infrastructure project may happen although a certain region has implemented e-procurement system. It may happen since there is an unwritt en agreement between project winner candidat with bureaucrat. Reducing technical specifi cation is the price paid for obtaining assurance

12
of winning the particular project. This commission amount tends to increase from year to year in infrastructure development project constructed by third party, therefore budget has no infl uence on roads quality improvement. The bureaucrat’s expectation to get profi t from infrastructure project for his own is refl ected from increasingly optimum government spending in following years in line with bribery capability of the project managers.
Model Four In Model 4 we use an interaction variable, that is an interaction variable between corruption and government spending in infrastructure sector. The model result shows that the interaction variable is proven signifi cant at 10% limit. Empirical result (Table 4) of the interaction variable between corruption level – government spending proved that:1. Corruption may result in roads quality decline,
however, it depends on the amount of local government budget for infrastructure. The higher local government budget for infrastructure, the more severe impact the corruption will have on roads quality declining.
2. In other words, in such a region where government spending on infrastructure is high, roads quality may be declined due to high corruption level occurrence in the particular region.
A negative sign of the interaction shows that the higher government spending on roads, the higher the negative impact of corruption towards roads quality. In other words, the higher corruption level would reduce the productivity of roads spending.
Government spending in infrastructure sector could improve infrastructure quality signifi cantly at 95%
Table 4. Corruption Impact on Roads Quality Dependent Variable: Roads QualityIndependent Variable Model 3 Model 4INDEKSKORUP -0.16742 -0.073
(0.0618) (0.4852)GDRPCAP (JUTA) 1.25 1.52
(0.0005) (0.0004)TOTREVGDRP -25.3283 -39.341
(0.1012) (0.0232)ROADEXGDRP 176.2094 277.99
(0.1567) (0.0443)INTRCORR-ROADEX -2.436
(0.0906)C 48.34284 50.57437
(0.000) (0.000)Adjusted R2 0.2083 0.26636Number of observation 82 82Note: Figure in bracket is p-valueSource: Secondary Data sekunder (processed)

13
Infrastructure Quality, Local Government Spending, and Corruption
confi dence limit. If there is an increase in government spending in infrastructure sector to GDRP as much as one unit it will improve infrastructure quality as much as 278 point, ceteris paribus. Other result shows that, although it is not signifi cant corruption may reduce roads quality. Corruption infl uence towards roads quality decline is 0.073, it means that if corruption level is decreased by one point roads quality infrastructure will increase by 0.073, ceteris paribus. Corruption infl uence towards roads quality decline can be seen in Figure 7.
Corruption could reduce roads quality although it is not statistically signifi cant. Corruption infl uence towards roads quality decline is 0.073. It means that a decline of one point in corruption practices will increase roads infrastructure quality by 0.073 ceteris paribus (as can be seen in Figure 7).Corruption roles toward roads quality decline depends on local government infrastructure spending. At the case of region X roads infrastructure quality in villages are relatively poorer compared to main roads in capital city of the district since there are indications of corruption practices on roads aphalt caused by Village Head Election. This refl ects that where there are political processes at various government levels, such situation may open corruption opportunities.
Political process in APBD discussion in both regions generally occurred almost identically, such as started from development planning process (Musrenbangkab) which apparently characterized as just a formality. Audience presence is just only as listener of government program presentation, thus not to be active involved in program planning process. In region X, although there has been online system of Musrenbang process, however, preference of the local parliament member (DPRD) toward his/her constituent region has been more determining in decision making on infrastructure project design. This situation shows that the role of political process is high in making government budget corruption to occur. Although the process is in line with budget allocation and planning program resulted from Musrenbang, the majority party in DPRD has the power to make fi nal decision on infrastructure project program through mechanism of decision making by voting.
V. Summary • Corruption has an impact on increasing local
government spending in infrastructure sector. This fact indicates that the government project cost has been bubbled as source of corruption.
• Local government budget of 41 districts/cities accross Indonesia which was increased during the period of 2007 – 2010 did not have impact
on improving quality of the infrastructure (roads- irrigation-network). Government budget may improve roads quality and it depends on corruption level which occurs in the particular region.
• In such situation where e-procurement has not been implemented, and control towards bureaucracy of higher level of government offi cials is not eff ective, in order to reduce corruption level participation of civil society in controlling bidding process and implementation of local government infrastructure projects must be made eff ective.
• In case e-procurement has been implemented, corruption may occur through a conspiracy in bidding price between bidder and local government apparatus. The bidder will include such collusion cost into production cost. According to our qualitative observation in the fi eld, a region which has implemented e-procurement tends to have higher civil society participation than that which has not implemented e-procurement.
• From regression result on 41 districts/cities in Indonesia, corruption is proven to be able to increase government spending. Such result indicates that corruption in Indonesia happens in public expenditure budget.
VI. Policy Implication • Control method on the process of government
project bidding which involves experts outside government bureaucracy structure is needed to control corruption in project implementation process. Physical evaluation on fi nal materials of budget utilization should be done regularly and the results should be published to guarantee transparency. Local government may create an Adhoc Team consisting of experts from third party, non governmental agency.
• Increase active participation role of civil society organization in controlling infrastructure project planning and implementation of the project, in a more formal form, if a certain region has not yet implemented e-procurement.
• Audit process to government project by third party should be bett er carried out at project implementation process, controlling also when project is being implemented, and aft er end result to minimalized rooms for tricky actions which can lead to corruption.
• It is required to match the needs for expenditure with the income, such as for roads maintenance budget, it should be taken from revenues posts related to roads, such as tax on motor vehicles, tax on gasoline for car.
□□□

14
ReferencesBardhan, Pranab and Mookherjee, Dilip. Capture and Governance at Local and National Levels. The American
Economic Review, Vol.90, No.2, pp.135-139, May, 2000
Bigsten, A. and Moene, K. Growth and Rent Dissipation: The Case of Kenya. Journal of African Economies 5, p.177–198, 1996
Carbonara, Emanuela. Bureaucracy, Corruption, and Decentralization. University of Bologna, Department of Economics Working Paper No.342/33, Italy, 1999
Dellavalade, Clara. Corruption and Distribution of Public Spending in Developing Countries. Journal of Economics and Finance, Vol 30, No.2, Summer, 2006
Fay, M. and Yepes, T. Investing in infrastructure: what is needed from 2000 to 2010? World Bank Policy Research Working Paper 3102, Washington DC, 2003
Huntington, Samuel. P. Political Order in Changing Societies. Yale University Press. 1968
Kenny, Charles. Measuring Corruption in Infrastructure: Evidence from Transition and Developing Countries. Journal of Development Studies, Vol. 45, No. 3, 314–332, March 2009
Kurniawan, Teguh. Democratic Decentralization and Corruption in Indonesia: Why Decentralization has Caused Head of Regions Aff ected by Corruption Cases. Paper presented at Conference on Decentralization and Democratization in Southeast Asia, University of Freiburg, Germany, June 16, 2011
KPPOD. Profi l Tata Kelola Ekonomi Daerah Sulawesi Selatan2011. Laporan Penelitian. 2012
KPPOD. Tata Kelola Ekonomi Daerah 2011: Survei Pelaku Usaha di 245 Kabupaten/Kota di Indonesia. Laporan Penelitian. 2011
Méon, Pierre-Guillaume and Weill, Laurent. Is Corruption an Effi cient Grease? Bank of Finland (BOFIT) Discussion Paper No.20, 2008
Prud’homme, Remy. On the Dangers of Decentralization. World Bank Policy Research Working Paper 1252, Washington DC, 1994
Reinikka, Ritva and Svensson, Jacob. Local Capture: Evidence from a Central Government Transfer Program in Uganda. The Quarterly Journal of Economics, May, 2004
Rose-Ackerman, Susan. Democracy and Grand Corruption. Altruism, Nonprofi ts and Economic Theory. Journal of Economic Literature 34:701-728, 1996
Rose-Ackerman, Susan. Corruption and Government: Causes, Consequences, and Reform. Cambridge University Press. 1999
Shah, Anwar. Corruption and Decentralized Public Governance. World Bank Working Paper Series 3824, January, 2006
SevÜktekin, Mustafa and Nargelecekenler, Mehmet. A Cross-Country Comparison of Corruption and Public Expenditures: A Panel Data Approach. International Journal of Public Administration,33:140-150, 2010
Shleifer, Andrei and Vishney, Robert W. Corruption. The Quarterly Journal of Economics, Vol. 108, No.3, pp. 599-617August, 1993
Tanzi, V and H. Davoodi. Corruption, Public Investment and Growth. International Monetary Fund Working Paper 97/139. 1997
Transparency International Indonesia. Indonesia Corruption Perception Index Report 2010, TII, Jakarta, 2010
World Bank. Analisis Keuangan Publik Provinsi Sulawesi Selatan 2012: Meningkatkan Kualitas Pelayanan Publik dan Pengelolaan Keuangan Daerah di Gerbang Indonesia Timur. Edisi Workshop. 2012
□□□

15
Infrastructure Quality, Local Government Spending, and Corruption
Att achment 1 Names of selected Provinces and Districts/Cities used as samples for this study:
Prov. of East Nusa Tenggara: • Lembata District• South Timor Tengah District • Kupang City• Rote Ndao District• Manggarai Barat District
Prov. of South Sulawesi: • Bone District• Bulukumba District• Enrekang District• Jeneponto District• Luwu District• North Luwu District • Maros District• Pinrang District• Selayar District• Takalar District• Tana Toraja District• Wajo District
Prov. of East Java: • Banyuwangi District• Blitar District• Bondowoso District• Madiun District• Magetan District• Nganjuk District• Ngawi District• Pamekasan District• Pasuruan District• Ponorogo District• Sampang District• Situbondo District• Trenggalek District• Blitar City• Malang City• Mojokerto City• Pasuruan City• Probollinggo City
Prov. of Nanggroe Aceh Darussalam:• West Aceh District • Aceh Besar District• South Aceh District • Aceh Singkil District• North Aceh District • Sabang City
Att achment 2 Result of Residual Nomality Test
□□□

16
Att achment 3
Result of Heteroskedastisity Test
□□□

Komite Pemantauan Pelaksanaan Otonomi DaerahRegional Autonomy Watch
Permata Kuningan Building 10 th Fl.Guntur Setiabudi, Jakarta Selatan 12980
Phone: +62 21 8378 0642/53, Fax.: +62 21 8378 0643