Infrastructure and Environment Department Energy · PDF filePre-Feasibility Study of the...
158
Pre-Feasibility Study of the Potential Market for Natural Gas as a Fuel for Power Generation in the Caribbean Jed Bailey Nils Janson Inter-American Development Bank Infrastructure and Environment Department Energy Division INE/ENE TECHNICAL NOTE No. IDB-TN-600 December 2013
Transcript of Infrastructure and Environment Department Energy · PDF filePre-Feasibility Study of the...

Pre-Feasibility Study of the Potential Market for Natural Gas as a Fuel for Power Generation in the Caribbean
Jed Bailey Nils Janson
Inter-American Development Bank
Infrastructure and Environment Department Energy Division INE/ENE
TECHNICAL NOTE
No. IDB-TN-600
December 2013

Pre-Feasibility Study of the Potential Market for Natural Gas as a Fuel for Power Generation in the
Caribbean
Jed Bailey Nils Janson
Inter-American Development Bank
2013

http://www.iadb.org The opinions expressed in this publication are those of the authors and do not necessarily reflect the views of the Inter-American Development Bank, its Board of Directors, or the countries they represent. The unauthorized commercial use of Bank documents is prohibited and may be punishable under the Bank's policies and/or applicable laws. Copyright © Inter-American Development Bank. All rights reserved; may be freely reproduced for any non-commercial purpose.
2013
The opinions expressed in this publication are those of the authors and do not necessarily reflect the views of the Inter-American Development Bank, its Board of Directors, or the countries they represent. The unauthorized commercial use of Bank documents is prohibited and may be punishable under the Bank’s policies and/or applicable laws. Copyright © 2013 Inter-American Development Bank. All rights reserved; may be freely reproduced for any non-commercial purpose. Cataloging-in-Publication data provided by the Inter-American Development Bank Felipe Herrera Library Bailey, Jed. Pre-feasibility study of the potential market for natural gas as a fuel for power generation in the Caribbean / Jed Bailey, Nils Janson. p. cm. — (IDB Technical Note ; 600) Includes bibliographical references. 1. Gas as fuel—Caribbean Area. 2. Electric power production—Caribbean Area. 3. Natural gas—Caribbean Area. I. Janson, Nils. II. Inter-American Development Bank. Energy Division. III. Title. IV. Series. IDB-TN-600 JEL Codes O13 Q4 Q42 Q43

Compete Caribbean is a private sector development program that provides technical assistance grants and investment funding to support productive development policies, business climate reforms, cluster-ing initiatives and Small and Medium Size Enterprise (SME) development activities in the Caribbean region. The program, jointly funded by the Inter-American Development Bank (IDB), the United Kingdom Department for International Development (DFID) and the Foreign Affairs, Trade and Development Canada (DFATD), supports projects in 15 Caribbean countries. Projects in the OECS countries are implemented in partnership with the Caribbean Development Bank.
PRE-FEASIBILITY STUDY OF THE POTENTIAL MARKET FOR NATURAL GAS AS A FUEL FOR POWER GENERATION IN THE CARIBBEAN
TECHNICAL NOTE
JED BAILEY AND NILS JANSON

INDEXEXECUTIVE SUMMARY ............................................................................................................................7
SECTION A ...............................................................................................................................................17
BACKGROUND ................................................................................................................................................................................18
OBJECTIVE .....................................................................................................................................................................................18
STUDY APPROACH ........................................................................................................................................................................18
REGIONAL SOURCES FOR NATURAL GAS EXPORTS ...............................................................................................................19
UNITED STATES ............................................................................................................................................................................21
TRINIDAD AND TOBAGO ..............................................................................................................................................................23
MEXICO ..........................................................................................................................................................................................23
PERU ................................................................................................................................................................................................24
COLOMBIA .....................................................................................................................................................................................24
VENEZUELA ....................................................................................................................................................................................25
POTENTIAL NATURAL GAS DELIVERY POINTS ........................................................................................................................25
LNG AND CNG LANDING POINTS ................................................................................................................................................25
ANTIGUA AND BARBUDA ..............................................................................................................................................................29
THE BAHAMAS ...............................................................................................................................................................................29
BARBADOS ......................................................................................................................................................................................29
DOMINICA ......................................................................................................................................................................................29
DOMINICAN REPUBLIC ................................................................................................................................................................29
GRENADA ........................................................................................................................................................................................30
HAITI ...............................................................................................................................................................................................30
JAMAICA ..........................................................................................................................................................................................30
ST. KITTS & NEVIS .........................................................................................................................................................................30
ST. LUCIA .........................................................................................................................................................................................31
ST. VINCENT AND THE GRENADINES .........................................................................................................................................31
GUYANA ...........................................................................................................................................................................................31
SURINAME ......................................................................................................................................................................................31
NATURAL GAS COSTS: UPSTREAM ...........................................................................................................32
WHY HENRY HUB INDEX GAS PRICES?......................................................................................................................................35
NATURAL GAS COSTS: TRANSPORTATION ................................................................................................36
ADVANTAGES AND LIMITATIONS OF PIPELINES AND LNG/CNG INFRASTRUCTURE .........................................................36
POTENTIAL SUPPLY ROUTES: DISTANCES ...............................................................................................................................38
LNG TRANSPORTATION COSTS ..................................................................................................................................................39
SOURCE COUNTRY .......................................................................................................................................................................41
CNG TRANSPORTATION COSTS ..................................................................................................................................................42
PIPELINE TRANSPORTATION COSTS .........................................................................................................................................45
Western Caribbean ....................................................................................................................................................................................46
Eastern Caribbean .....................................................................................................................................................................................48
GUYANA AND SURINAME ...............................................................................................................................................49

NATURAL GAS: FINAL DELIVERED PRICE ..................................................................................................50
LNG DELIVERED PRICE ................................................................................................................................................................50
CNG DELIVERED PRICE ...............................................................................................................................................................51
PIPELINE DELIVERED PRICE ......................................................................................................................................................52
ENERGY INTENSIVE INDUSTRIES AND BARRIERS TO THEIR DEVELOPMENT ...........................................54
EXPECTED NATURAL GAS DEMAND FROM POWER GENERATION .............................................................55
IMPACT ON POWER GENERATION LONG-RUN MARGINAL COST ...............................................................56
POTENTIAL BARRIERS TO INTRODUCING NATURAL GAS..........................................................................63
HIGH CAPITAL COST AND REGIONAL DEBT LEVELS .............................................................................................................63
CONFLICTING “BEST OPTION” AT THE COUNTRY LEVEL ...................................................................................................64
SOVEREIGNTY VS. REGIONAL COORDINATION ......................................................................................................................64
SUPPLY SIDE CONSTRAINTS ......................................................................................................................................................65
MARKET STRUCTURE DISPARITIES ..........................................................................................................................................65
REGULATORY AND LEGAL FRAMEWORK .................................................................................................................................66
CONCLUSIONS .........................................................................................................................................66
SECTION B ..............................................................................................................................................69
INTRODUCTION ......................................................................................................................................71
OBJECTIVES OF THIS ASSIGNMENT ..........................................................................................................................................71
OVERVIEW OF THE ELECTRICITY SYSTEMS IN THE CARIBBEAN ........................................................................................71
STRUCTURE OF THIS REPORT ....................................................................................................................................................73
CURRENT DEPENDENCE ON FUEL OIL HAS LED TO HIGH COSTS AND PRICES IN THE CARIBBEAN .........74
AVERAGE RETAIL TARIFFS ARE HIGH IN MOST CARIBBEAN COUNTRIES ..........................................................................75
Average retail tariffs are high .....................................................................................................................................................................75
Tariffs are high for all customer categories ..............................................................................................................................................78
Most tariff structures have a fuel pass-through ..........................................................................................................................................79
THE COST STRUCTURE FOR PROVIDING ELECTRICITY IN THE CARIBBEAN ...................................................................82
The generation matrix is highly dependent on imported oil-based fuels ..................................................................................................83
The cost of fuel accounts for more than 50 percent of the cost of service ...............................................................................................84
The average cost of electricity systems in the Caribbean is high due to
the high price of fuel ................................................................................................................................................................................85
CURRENT RE AND EE COST CURVES .........................................................................................................................................88
Renewable Energy Cost Curves ................................................................................................................................................................89
EE Cost Curves .........................................................................................................................................................................................92
IMPACT OF NATURAL GAS IN ELECTRICITY .............................................................................................94
IMPACT OF INTRODUCING NATURAL GAS ON GENERATION COSTS ..................................................................................94
LRMC of Gas fired power plants .............................................................................................................................................................95
The average cost of generation will be lower with natural gas plants .......................................................................................................96
A lower percentage of generation costs are expected to be fuel costs .......................................................................................................98

IMPACT OF INTRODUCING NATURAL GAS ON PRICES ...........................................................................................................99
Average retail prices would be lower with the introduction of natural gas ...............................................................................................99
Prices might also be less volatile ................................................................................................................................................................100
IMPACT ON RE AND EE COST CURVES ......................................................................................................................................100
RE Cost Curves with Natural Gas ............................................................................................................................................................101
EE Cost Curve with Natural Gas ..............................................................................................................................................................103
COST BENEFIT ANALYSIS OF NATURAL GAS ALTERNATIVES ......................................................................104
SCENARIO 0: BUSINESS AS USUAL ...............................................................................................................................................106
SCENARIO 1: USE OF LIQUID FUEL IN CONJUNCTION WITH RE AND EE ............................................................................107
SCENARIO 2: INTRODUCING NATURAL GAS (REPLACING LIQUID FUELS) IN CONJUNCTION WITH RE AND EE ..........111
SCENARIO 3: INTRODUCING NATURAL GAS (REPLACING LIQUID FUELS) ..........................................................................114
FACTORS THAT MAY AFFECT THE VIABILITY OF NATURAL GAS AS AN ALTERNATIVE TO FUEL OIL ...........................117
APPENDICES
APPENDIX A: TRANSPORTATION ROUTE MAPS ......................................................................................................................122
APPENDIX B COUNTRY LEVEL NATURAL GAS DELIVERED PRICE CHARTS.......................................................................128
APPENDIX C: COUNTRY LEVEL LONG-RUN MARGINAL COST OF POWER GENERATION CHARTS ................................136
APPENDIX D: BIBLIOGRAPHY .....................................................................................................................................................143
APPENDIX E: APPENDIX E: COSTS FOR RENEWABLE ENERGY TECHNOLOGY ..................................................................143
APPENDIX F: COSTS FOR ENERGY EFFICIENCY TECHNOLOGY ...........................................................................................152

TABLES
Table 0.1: Net Benefits of Three Scenarios .............................................................................................................................................................8
Table 1: Potential Natural Gas Suppliers .................................................................................................................................................................22
Table 2: Ranking Potential Natural Gas Suppliers ...................................................................................................................................................22
Table 1.1: Overview of the Electricity Systems in the Caribbean ............................................................................................................................74
Table 2.1: Average Retail Tariffs per Utility (2012) ...................................................................................................................................................79
Table 2.2: Tariff Structure of Residential Customers Countries (USD) ...................................................................................................................82
Table 2.3: Percentage of Installed Capacity by Source ............................................................................................................................................85
Table 2.4: Cost of Service for Utilities in 2009-2011 ................................................................................................................................................87
Table 2.5: Summary of Individual Countries’ Viable Future Options .....................................................................................................................94
Table 3.1: Percentage savings of natural gas v. fuel oil, as a percent of LRMC (U.S. Sabine Pass) ..........................................................................98
Table 3.2: Viability of RE technologies in fuel oil v. natural gas scenarios ...............................................................................................................103
Table 4.1: Net Benefits of Three Scenarios ..............................................................................................................................................................107
Table 4.2: Costs of Scenario 0: Business as usual .....................................................................................................................................................108
Table 4.3: Generation Matrix by Source for Scenario 1: Use of liquid fuel in conjunction
with RE and EE ........................................................................................................................................................................................................110
Table 4.4: Costs of Scenario 1: Use of liquid fuel in conjunction with RE and EE .................................................................................................111
Table 4.5: Benefits of Scenario 1: Use of liquid fuel in conjunction with RE and EE .............................................................................................112
Table 4.6: Generation Matrix by Source for Scenario 2: Introducing natural gas
(replacing liquid fuels) in conjunction with RE and EE ............................................................................................................................................113
Table 4.7: Costs of Scenario 2: Introducing natural gas (replacing liquid fuels)
in conjunction with RE and EE ................................................................................................................................................................................114
Table 4.8: Benefits of Scenario 2: Introducing natural gas (replacing liquid fuels)
in conjunction with RE and EE ................................................................................................................................................................................115
Table 4.9: Generation Matrix by Source for Scenario 3: Introducing natural gas
(replacing liquid fuels) ................................................................................................................................................................................................116
Table 4.10: Costs of Scenario 3: Introducing natural gas (replacing liquid fuels) .....................................................................................................117
Table 4.11: Benefits Analysis of Scenario 3: Introducing natural gas (replacing liquid fuels) ..................................................................................................118
Table F.1: Key Features of Energy Efficiency Technologies......................................................................................................................................156

Pre-Feasibility Study of the Potential Market for Natural Gas as a Fuel for Power Generation in the Caribbean6
FIGURES
Figure 0.1: Map of Countries in this Study ..............................................................................................................................................................9
Figure 0.2: Cost of Service for Five Utilities in the Caribbean, 2012 .......................................................................................................................11
Figure 0.3: Average Retail Tariffs per Utility (2012) .................................................................................................................................................12
Figure 0.4: Natural gas supply sources ......................................................................................................................................................................12
Figure 0.5: LRMC of Natural Gas Fired Power Generation ....................................................................................................................................13
Figure 0.6: Tariffs based on Natural Gas vs. Tariffs based on Fuel oil ......................................................................................................................14
Figure 0.7: RE Cost Curves, Current Scenario v. Natural Gas Scenario..................................................................................................................15
Figure 0.8: EE Cost Curves, Current Scenario v. Natural Gas Scenario ..................................................................................................................16
Figure 1.1: Map of Countries in this Study ..............................................................................................................................................................72
Figure 2.1: Cost of Service v Tariffs for Some Utilities in the Caribbean, 2012 ......................................................................................................76
Figure 2.2: Average Retail Tariffs per Utility (2012) .................................................................................................................................................78
Figure 2.3: Average Residential, Commercial, and Industrial Tariffs per Utility (US$ per kWh) ............................................................................80
Figure 2.4: Average Monthly Bills for Households ...................................................................................................................................................81
Figure 2.5: Fuel surcharge as a % of non-fuel variable charge for first customer band ...........................................................................................83
Figure 2.6: Fuel surcharge as a percent of average tariff...........................................................................................................................................84
Figure 2.7: 2012 Cost of service for five utilities in The Caribbean (2012) ..............................................................................................................86
Figure 2.8: All-in Costs of Generation of Fuel Oil Plants ........................................................................................................................................88
Figure 2.9: Average Cost for Caribbean systems .......................................................................................................................................................90
Figure 2.10: RE Cost Curve ......................................................................................................................................................................................92
Figure 2.11: EE Cost Curve ......................................................................................................................................................................................95
Figure 3.1: LRMC of Natural Gas v. LRMC of Fuel oil (US$ cents per kWh) .......................................................................................................97
Figure 3.2: Average Cost of System with Natural Gas..............................................................................................................................................99
Figure 3.3: All-in Costs of Generation of Natural Gas Plants v. Fuel Oil Plants ......................................................................................................100
Figure 3.4: Tariffs based on Natural Gas vs. Tariffs based on Fuel oil ......................................................................................................................102
Figure 3.5: RE Cost Curve with Natural Gas ...........................................................................................................................................................104
Figure 3.6: EE Cost Curve with Natural Gas ............................................................................................................................................................105
Figure A.1: Shipping routes from U.S. Gulf Coast (Sabine Pass) ..............................................................................................................................124
Figure A.2: Shipping routes from Southern Florida (West Palm Beach) ...................................................................................................................125
Figure A.3: Shipping routes from Altamira, Mexico .................................................................................................................................................125
Figure A.4: Shipping routes from Point Fortin, Trinidad ..........................................................................................................................................126
Figure A.5: Shipping routes from Guiria, Venezuela ................................................................................................................................................127
Figure A.6: Shipping routes from Coveñas, Colombia..............................................................................................................................................128
Figure A.7: Shipping routes from Peru LNG ............................................................................................................................................................129

7
EXECUTIVE SUMMARYThis study analyses the feasibility of introducing natural gas in 14 countries in the Caribbean. The current dependence on fuel oil in the countries in the Caribbean has led to high generation costs and electricity prices. Introducing natural gas would decrease both the cost and price of electricity—main-ly due to the lower price of natural gas. Additionally, natural gas plants emit less carbon dioxide (CO2) per ton than fuel oil plants. Therefore, the net benefits of natural gas would be seen in lower financial and economic (environmental) costs.
It is important to note that upon introducing natural gas, not all renewable energy (RE) and energy ef-ficiency (EE) technologies that are viable in the current scenario—a scenario in which most electricity is generated with fuel oil—will still be viable. Furthermore, though natural gas proves viable under the current situation—where the price of natural gas is lower than that of fuel oil—there is no guarantee that this will always be the case. Lastly, there are some factors that need to be considered closely to fully assess if they will affect the viability of introducing natural gas in the Caribbean. For example, the introduction of natural gas may be hard to organize due to market structure disparities for each country. Additionally, it may not be feasible to completely phase out fuel oil.
This report explains the above mentioned topics in further detail. Section A of this report assesses the potential of natural gas as a generation source, and presents the costs of supplying natural gas to the Caribbean. Section B analyses the implications of introducing natural gas on generation costs, electricity prices, and the viability of RE and EE technologies. Section B also includes a cost-benefit analysis that compares the savings in net benefits of three alternatives scenarios to the costs of the current scenario.
CURRENT SITUATION IN THE CARIBBEAN ENERGY SECTOR
Most countries in the Caribbean import fuel oil and diesel to generate electricity. The high and vola-tile prices of these imported liquid fuels are passed on to customers in the form of high electricity bills. Figure 0.1 shows a map of the Caribbean countries considered in this study. The figure shows that in 11 of these countries diesel-fired plants account for over 75 percent of all installed capacity.

Guyana
Jamaica Haiti
Dominican Republic
The Bahamas
Suriname
Puerto Rico
Saint Kitts and Nevis
Antigua and Barbuda
Trinidad and Tobago
Barbados
Dominica
Saint Lucia
Saint Vincent and the Grenadines
Grenada
COUNTRY: Peak Demand (in MW), Diesel-Fired Plant Intalled Capacity (in % of Total Installed Capacity)
MW Fuel Oil
The Bahamas 318.1 100.0Jamaica 680.0 94.7Haiti 226.0 79.5Dominican Republic 2353.0 52.6Puerto RicoSaint Kitts and Nevis 33.0 96.2Antigua and Barbuda 17.2 75.3Dominica 17.2 75.3Saint Lucia 59.8 100.0Barbados 157.4 100.0Saint Vincent and the Grenadines
25.7 88.1
Grenada 29.2 100.0Trinidad and Tobago 1121.0 0.9Guyana 100.0 100.0Suriname 264.0 49.3
Figure 0.1: Map of Countries in this Study

9
Guyana
Jamaica Haiti
Dominican Republic
The Bahamas
Suriname
Puerto Rico
Saint Kitts and Nevis
Antigua and Barbuda
Trinidad and Tobago
Barbados
Dominica
Saint Lucia
Saint Vincent and the Grenadines
Grenada
COUNTRY: Peak Demand (in MW), Diesel-Fired Plant Intalled Capacity (in % of Total Installed Capacity)
CURRENT DEPENDENCE ON FUEL OIL HAS LED TO HIGH COSTS AND PRICES IN THE CARIBBEAN
The cost of generating electricity in the Caribbean is high. The long run marginal cost (LRMC) of a low speed diesel (LSD) plant in the Caribbean—assuming an oil price of US$80 per barrel—is 15.72 US$ cents per kWh. This is higher than the estimated LRMC of natural gas plants for all countries in the Caribbean (which ranges from US$10.08 to 13.98 US$ cents per kWh). One reason the LRMC of a LSD plant is so high is due to fuel costs, which account for about 72 percent of generation costs. A high LRMC means that the cost of service of the utilities is high. Figure 0.1 shows the cost of service for five utilities in the Caribbean and shows that fuel costs account for more than half the costs in all utilities.
Figure 0.2: Cost of Service for Five Utilities in the Caribbean, 2012
0,22 0,25 0,23 0,23 0,21
0,060,08
0,060,12 0,12
0,31
0,36 0,370,41 0,41
0,00
0,05
0,10
0,15
0,20
0,25
0,30
0,35
0,40
0,45
Barbados … Jamaica … St. Lucia … Grenada … Dominica …
US$/
kWh
Sold
Cost of Service (2012)Dividends
Taxes
Interest
D&A
Non -Fuel OpEx
Fuel Cost
Total Cost(in US$/kWh)
Source: 2012 Annual Reports of BLPC, DOMLEC, GRENLEC, JPS, and LUCELEC
In most countries, the high costs of generation are passed on to customers via a fuel-surcharge, which can make up a majority of the electricity bill. So, customers see the high and volatile price of fuel in their monthly bills. The average tariff for 7 utilities in this study is above 30 US$ cents per kWh, which is very high (Figure 0.3).

Pre-Feasibility Study of the Potential Market for Natural Gas as a Fuel for Power Generation in the Caribbean10
Figure 0.3: Average Retail Tariffs per Utility (2012)
$0,20 $0,20$0,22
$0,32
$0,36 $0,38 $0,38$0,40
$0,43 $0,43
$0,00
$0,05
$0,10
$0,15
$0,20
$0,25
$0,30
$0,35
$0,40
$0,45
$0,50
EDEESTE(Dominican Republic)
EDENORTE(Dominican Republic)
EDESUR(Dominican Republic)
BLPC(Barbados)
JPS(Jamaica)
LUCELEC(St. Lucia)
EDH(Haiti)
GRENLEC(Grenada)
APUA(Antigua
and Barbuda)
DOMLEC(Dominica)
US$/
kWh
Source: 2012 Annual Reports for BLPC, JPS, LUCELEC, GRENLEC, and DOMLEC, data from EDH website, and published figures by APUA and Corporación Domini-cana de Empresas Eléctricas Estatales (CDEEE) for EDEESTE, EDENORTE, and EDESUR
NATURAL GAS MAY BE A FEASIBLE ALTERNATIVE TO FUEL OIL
Natural gas can prove to be a feasible alternative energy source to fuel oil in the Caribbean. Figure 0.4 shows the possible sources that could supply natural gas to Caribbean countries
Figure 0.4: Natural gas supply sources
Sabine PassMost advanced US Gulf Coast LNG
liquefaction projects. Located near Henry Hub gas pricing point, higly industrializad area. West Palm Beach
Port nearest to the end of new natural gas pipelines serving Florida’s gasfired power generation. Closest US point to eastern Caribbean.
GuiriaSite of proposed CIGNA industrial complex and LNG liquefaction plant. Natural gas from Plataforma Deltana / Mariscal Sucre.
Point Fortin (TT)Operating LNG liquefaction plant, higly industrialized area based on Trinidad’s natural gas production.
AltamiraLNG import facility, close to mayor
pipelines could add liquefaction with sufficient supply - US imports are
increasing and market is too tight to allow exports.
CovenasPort closest to Colombia’s natural gas
pipeline system and production.
Peru NLGOperating LNG liquefaction plant, receives gas by pipeline from Peru’s Camisea field.

11
Further, considering the pros and cons of Liquefied Natural Gas (LNG), Compressed Natural Gas (CNG), and pipelines, this study concludes that the best option for most Caribbean countries would be LNG. The advent of U.S. gas exports are expected to drive a growing number of LNG contracts linked to Henry Hub (U.S. gas pricing point). This was the pricing mechanism used for this study, and so natural gas supply from potential sources was priced at the Henry Hub netback. Particularly, the U.S. Sabine Pass supply point (located near the Henry Hub gas pricing point) is expected to be able to supply LNG at competitive prices due to the projects that are underway. Therefore, we have assumed that LNG exports to the Caribbean will likely originate from the Sabine Pass.
It is worth noting that the calculations related to the LRMC of natural gas plants are preliminary and are based on assumptions and generalizations that may not hold for specific projects. Further, the cost and competitiveness estimates are only preliminary. Therefore, project specific factors should be taken into account when preparing a final feasibility study. For the purposes of this study, we have used the LNG prices from the Sabine Pass supply point to calculate the LRMC of natural gas plants for each country in this study. Figure 0.5 presents the resulting LRMC of natural gas plants for each country in the Caribbean, and compares it to the LRMC of a LSD plant.
Figure 0.5: LRMC of Natural Gas Fired Power Generation
5,64 6,01 6,10 6,41 6,45 6,47 6,72 6,74 6,93 7,30 7,49 7,499,54
11.28
10,08 10,45 10,54 10,85 10,89 10,91 11,16 11,18 11,37 11,74 11,94 11,94
13,98
15,72
0,00
2,00
4,00
6,00
8,00
10,00
12,00
14,00
16,00
Dominican Republic
Jamaica The Bahamas
Barbados Guyana Suriname Haiti Antigua and
Barbuda
St. Lucia St. Kitts and Nevis
St. Vincent and the
Grenadines
Grenada Dominica Low Speed Diesel (HFO)
US$ c
ents
/kW
h
Fuel cost (NG)
Non-fuel costs
All-in cost of generation
Fuel as a % of all-in generation costs
Dom
inic
an
Rep
ublic
Jam
aica
Bah
amas
Bar
bado
s
Guy
ana
Ant
igua
&
Bar
buda
Hai
ti
St. L
ucia
Suri
nam
e
St. K
itts
and
Nev
is
Gre
nada
St. V
ince
&
Gre
nadi
nes
Dom
inic
a
Oil
- Fue
l
56% 57% 58% 59% 59% 59% 60% 60% 61% 62% 63% 63% 68% 72%
Pre-Feasibility Study of the Potential Market for Natural Gas as a Fuel for Power Generation in the Caribbean12
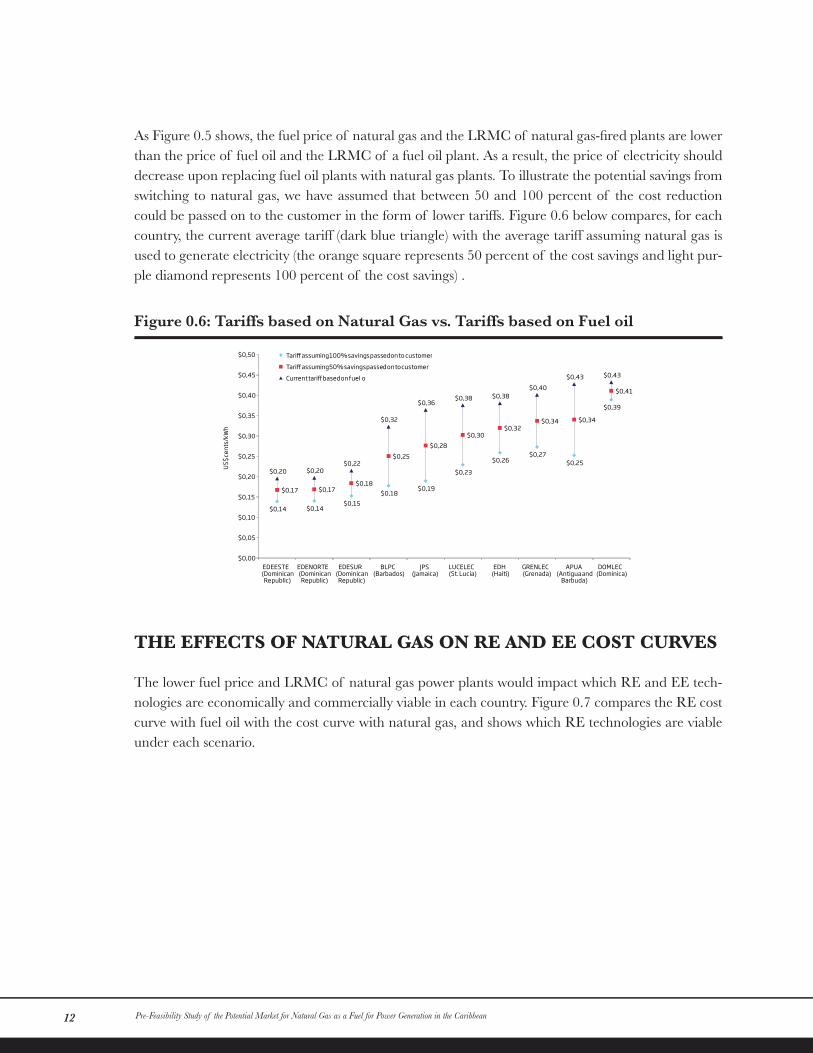
As Figure 0.5 shows, the fuel price of natural gas and the LRMC of natural gas-fired plants are lower than the price of fuel oil and the LRMC of a fuel oil plant. As a result, the price of electricity should decrease upon replacing fuel oil plants with natural gas plants. To illustrate the potential savings from switching to natural gas, we have assumed that between 50 and 100 percent of the cost reduction could be passed on to the customer in the form of lower tariffs. Figure 0.6 below compares, for each country, the current average tariff (dark blue triangle) with the average tariff assuming natural gas is used to generate electricity (the orange square represents 50 percent of the cost savings and light pur-ple diamond represents 100 percent of the cost savings) .
Figure 0.6: Tariffs based on Natural Gas vs. Tariffs based on Fuel oil
$0,14 $0,14$0,15
$0,18$0,19
$0,23
$0,26$0,27
$0,25
$0,39
$0,17 $0,17$0,18
$0,25$0,28
$0,30$0,32
$0,34 $0,34
$0,41
$0,20 $0,20$0,22
$0,32
$0,36$0,38 $0,38
$0,40$0,43 $0,43
$0,00
$0,05
$0,10
$0,15
$0,20
$0,25
$0,30
$0,35
$0,40
$0,45
$0,50
EDEESTE(Dominican Republic)
EDENORTE(Dominican Republic)
EDESUR(Dominican Republic)
BLPC(Barbados)
JPS(Jamaica)
LUCELEC(St. Lucia)
EDH(Haiti)
GRENLEC(Grenada)
APUA(Antigua and
Barbuda)
DOMLEC(Dominica)
US$ c
ents
/kW
h
Tari� assuming 100% savings passed on to customers
Tari� assuming 50% savings passed on to customers
Current tari� based on fuel- oil
THE EFFECTS OF NATURAL GAS ON RE AND EE COST CURVES
The lower fuel price and LRMC of natural gas power plants would impact which RE and EE tech-nologies are economically and commercially viable in each country. Figure 0.7 compares the RE cost curve with fuel oil with the cost curve with natural gas, and shows which RE technologies are viable under each scenario.

13
Figure 0.7: RE Cost Curves, Current Scenario v. Natural Gas Scenario
0,32
0,32
0,30
0,25
0,22
0,20
0,16
0,11
0,10
0,09
0,08
0,04
0,02
- 0,05 0,10 0,15 0,20 0,25 0,30 0,35 0,40 0,45
E�cient Retail Refrigerators (Condensing Unit)
LED Street Lighting
E�cient Residential Refrigerators
LCD Computer Monitors
T5 High Output Fluorescent Lamps
E�cient Chillers
T8 Fluorescent Lamps w/Occupancy Sensor
E�cient Split A/C Systems
Variable Frequency Drives
E�cient Window A/C Systems
Premium E�ciency Motors
Power Monitors
Compact Fluorescent Lamps (CFLs)
EE Cost Curve in Current ScenarioCommercially viable
Economically viable
Retail Tari� DRUS$0.20/kWh
LSD/HFO, all -in cost: US$ 0.16 /kWh
Retail Tari� Others*US$0.32 - 0.43/kWh
0,50
0,47
0,29
0,26
0,23
0,20
0,14
0,12
0,10
0,09
0,09
0,09
0,08
0,05
- 0,05 0,10 0,15 0,20 0,25 0,30 0,35 0,40 0,45 0,50 0,55
OTEC (5MW)
Wind (10kW)
Solar PV (small scale)
Solar PV (comm. scale)
Seawater Air Conditioning (2MW)
Solar PV (utility scale)
Residential SWH (2kW)
Hydro*
Wind (850kW)
Commercial SWH (70 kW)
Bagasse cogeneration
Land�ll gas to energy (internal combustion)
Anaerobic Digestion / Biogas (2MW)
Geothermal (100MW)**
RE Cost Curve in Natural Gas Scenario
LSD/NG, all - in cost: US$0.10 - 0.14/kWh
LSD/NG, fuel cost: US $0.06 -0.095 /kWh
Retail Tari� Others US$0.25 - 0.41/kWh*
Commercially viableEconomically viable
Firm technologyNon- �rm technology
Retail Tari� DRUS$0.17/kWh
Source: Castalia Report, Sustainable Energy Framework for Barbados Final Report, 2010.
*Hydro costs are a preliminary estimate based on Guyana. However, hydro is site specific and need to be studied further for each of the countries.
**Geothermal costs are based on 100MW plants in the US. These costs are site specific and need to be studied further for each of the countries
***The range of fuel cost of natural gas is based on LRMC calculations for each country presented in Section A (Table 18) of this report.
****The retail tariff range is calculated assuming that customers will see 50 percent of the savings from using natural gas. These tariffs are presented in Figure 3.4 of this report.

Pre-Feasibility Study of the Potential Market for Natural Gas as a Fuel for Power Generation in the Caribbean14
Introducing natural gas will also impact the economic and commercial viability of EE technologies. Our analysis suggests that EE technologies with a cost lower than the all in cost of an LSD plant using HFO (US$0.16/kWh) are viable in the current scenario. Further, all EE technologies with a cost lower than US$0.10/kWh are still viable in all countries in a scenario with natural gas (Figure 0.8).
Figure 0.8: EE Cost Curves, Current Scenario v. Natural Gas Scenario
0,32
0,32
0,30
0,25
0,22
0,20
0,16
0,11
0,10
0,09
0,08
0,04
0,02
- 0,05 0,10 0,15 0,20 0,25 0,30 0,35 0,40 0,45
E�cient Retail Refrigerators (Condensing Unit)
LED Street Lighting
E�cient Residential Refrigerators
LCD Computer Monitors
T5 High Output Fluorescent Lamps
E�cient Chillers
T8 Fluorescent Lamps w/Occupancy Sensor
E�cient Split A/C Systems
Variable Frequency Drives
E�cient Window A/C Systems
Premium E�ciency Motors
Power Monitors
Compact Fluorescent Lamps (CFLs)
EE Cost Curve in Scenario with Natural GasCommercially viable
Economically viable
LSD/NG, all -in cost: US$0.10 -0.14/kWh
Retail Tari� DRUS$0.17/kWh
Retail Tari� Others US$0.25-0.41/kWh*
0,32
0,32
0,30
0,25
0,22
0,20
0,16
0,11
0,10
0,09
0,08
0,04
0,02
- 0,05 0,10 0,15 0,20 0,25 0,30 0,35 0,40 0,45
E�cient Retail Refrigerators (Condensing Unit)
LED Street Lighting
E�cient Residential Refrigerators
LCD Computer Monitors
T5 High Output Fluorescent Lamps
E�cient Chillers
T8 Fluorescent Lamps w/Occupancy Sensor
E�cient Split A/C Systems
Variable Frequency Drives
E�cient Window A/C Systems
Premium E�ciency Motors
Power Monitors
Compact Fluorescent Lamps (CFLs)
EE Cost Curve in Scenario with Natural GasCommercially viable
Economically viable
LSD/NG, all - in cost: US$0.10 - 0.14/kWh
LSD/HFO, all - in cost: US$ 0.16 /kWh
Retail Tari� NG Others US$0.25 - 0.41/kWh*
Retail Tari� NG DRUS$0.17/kWh
Source: The cost for EE technologies is based on Castalia Report Sustainable Energy Framework for Barbados Final Report, 2010.
*The range of fuel cost of natural gas is based on LRMC calculations for each country presented Section A (Table 18) of this report.
**The retail tariff range is calculated assuming that customers will see 50 percent of the savings from using natural gas. These tariffs are presented in Figure 3.4 of this report.

15
COST-BENEFIT ANALYSIS OF NATURAL GAS ALTERNATIVES
In order to better understand the implications of introducing natural gas in the Caribbean, we con-ducted costs and benefit analysis of three scenarios:
• Scenario 1: Use of liquid fuel in conjunction with RE and EE
• Scenario 2: Introducing natural gas (replacing liquid fuels) in conjunction with RE and EE
• Scenario 3: Introducing natural gas (replacing liquid fuels)
In this analysis, total costs are the sum of the cost of generation and the cost of CO2 emissions. Because we assume the difference in benefits due to electricity produced and reliability between sce-narios is zero, the savings in net benefits for each scenario are derived by subtracting the total costs of each scenario from the total costs of the business as usual scenario. Based on this method, which is fully described in Section 4 of Section B of this report, we conclude that Scenario 2 has the highest savings in net benefits for every country (see Table 0.1).
IN U$$ MILLION SAVINGS IN NET BENEFITS OF SCENARIO 1: LIQUID FUEL + RE AND EE
SAVINGS IN NET BENEFITS OF SCENARIO 2: NATURAL GAS + RE AND EE
SAVINGS IN NET BENEFITS OF SCENARIO 3: NATURAL GAS
Dominican Republic 127 691 619
Suriname 15 71 60
Dominica 9 10 3
Haiti 11 70 62
St. Vincent & Grenadine 2 9 8
St. Kitts and Nevis 5 31 28
Jamaica 48 357 329
Grenada 2 14 13
Antigua y Barbuda 4 27 25
St. Lucia 4 30 27
Guyana 54 59 51
Barbados 12 88 81
The Bahamas 25 186 172

Pre-Feasibility Study of the Potential Market for Natural Gas as a Fuel for Power Generation in the Caribbean16
FACTORS THAT MAY AFFECT THE VIABILITY OF NATURAL GAS
Despite the benefits of introducing natural gas, several challenges must be overcome to bring natural gas to the region. The optimal method for importing natural gas or the structure of the natural gas market must also be determined. Therefore, it is important to recognize the following factors which may affect the viability of natural gas as an alternative to fuel oil:
• Introduction of Natural Gas (NG) may be hard to organize. This is because natu-ral gas may only be viable if implemented at a regional scale. Yet, the “best option” for each country may differ, making it difficult to reach a regional consensus.
• Market structure disparities. Each country has different power market structures (for example, vertically integrated versus market-based). Also, long-term contracts between gen-erators and off-takers could make it difficult for new generators to enter market and com-pete effectively.
• Liquid fuels cannot be completely phased out. Countries would still need liquid fuels (for example, for vehicles), and so would need to import two types of fuel.
• For consumers, the ability to contract will be the main test. There is relatively little variation in the cost to transport LNG or CNG from five of the six source countries in the study. Instead, the important factor is the timing of export infrastructure and the export-er’s willingness to contract with Caribbean importers. Securing a favorable supply contract may be difficult, as suppliers may have ongoing relationships or expectations to serve other larger and more lucrative, markets.
In addition to these examples, it is worth noting that there would be a need to address what to do with the existing diesel-fired plants. It is not realistic to assume that utilities will stop using all their diesel-fired plants overnight. It is possible to convert fuel-oil fired power plants to burn on natural gas. Though there would be a capital cost associated with that, and a potential change in efficiency. This should be however, less expensive than replacing the existing capacity with new units.
Lastly, it is important to keep in mind that natural gas is a viable option based on current prices rela-tive to those of oil. However, considering that recently regional gas prices have reflected the effect of different drivers than those of global oil prices, it is possible that the cost of natural gas could increase to a level where it would no longer be lower than that of fuel oil. In other words, a rise in gas prices at current oil prices, or a drop in oil prices at current gas prices, would undermine the economic benefits of switching to natural gas. Therefore, it is important to carefully assess this risk in the analysis of any potential natural gas projects in the Caribbean.

SECTION
A

Pre-Feasibility Study of the Potential Market for Natural Gas as a Fuel for Power Generation in the Caribbean18
BACKGROUND
Electricity prices in the Caribbean countries (except for Trinidad and Tobago) are among the high-est in the Americas. Despite substantial renewable energy resources—including solar power, hydro power, geothermal energy, and wind—limited hydrocarbon resources force countries to import fuel oil and diesel for power generation. These high prices significantly affect the competitiveness of the region’s firms and adversely influence private sector development as a whole.
Many countries in the Americas have abundant natural gas resources. Recent technological advanc-es in natural gas production, particularly from shale gas resources, have greatly reduced the cost of developing these resources, driving a rapid growth in available natural gas supply, particularly in the United States. As a result, natural gas prices are now a fraction of the levels seen just five years ago and are anticipated to remain relatively low for the foreseeable future. Importing low cost natural gas to the small states in the Caribbean has the potential to substantially reduce liquid fuel imports and thus reduce power generation costs. This could in turn help support economic growth, reduce inequality, allow governments to reduce energy bills and electricity subsidies, and redirect scare funds to other priorities.
Producing research that elucidates how currently available technologies could provide access to low-er-cost electricity would benefit not only private sector entities in the region, but also governments and the Caribbean citizenry in general that are similarly negatively affected by high energy costs. INE/ENE has produced a comprehensive database summarizing the flow of all energy sources for most countries in Latin America but not for the Caribbean. This project aims to support the construction of energy dossiers for the countries in the Caribbean that are members of either the IDB or the Compete Caribbean project, including Antigua and Barbuda, the Bahamas, Barbados, Dominica, the Dominican Republic, Grenada, Jamaica, Haiti, St. Kitts and Nevis, St. Lucia, St. Vincent and the Grenadines, and Trinidad and Tobago. Guyana and Suriname are also included in this analysis.
OBJECTIVE
The objective of this report is to 1) assess potential regional sources of natural gas exports to the Ca-ribbean, including availability of supply and status of export-supporting infrastructure; 2) estimate the cost to supply natural gas to the Caribbean from regional natural gas producing countries; and, 3) identify potential barriers to introducing natural gas as a fuel for power generation in the Caribbean.
STUDY APPROACH
The study objectives were divided into six basic tasks:

19
• Assess potential regional sources of natural gas exports to the Caribbean. This analysis included an assessment of available natural gas supply and the status of ex-port-supporting infrastructure (natural gas liquefaction and compression facilities or pipe-lines). Assessed countries include the United States, Mexico, Trinidad and Tobago, Venezu-ela, Colombia, and Peru.
• Identify potential locations for natural gas to enter the Caribbean market. The analysis took into account existing port facilities and power transmission infrastructure (where applicable), and the offloading and storage infrastructure suitable to the size of each individual market.
• Analyze the expected cost of delivering natural gas to the Caribbean. This in-cluded a cost estimate for each stage of the natural gas value chain (market price at export point, liquefaction/compression, transportation cost, and regasification/decompression).
• Identify energy-intensive industries that would benefit from natural gas availability and barriers to development. The analysis will examine the economic sectors currently consuming imported liquid fuels and discusses the potential challenges and benefits to substituting natural gas for higher cost fuels.
• Estimate expected demand for natural gas in Central America’s power sec-tor. The study will use data from the power sector analysis performed for Section B to assess the potential maximum demand for natural gas for power generation for each individual market. Long-run marginal cost data, as well as individual plant characteristics, will then be used to estimate the change in power generation costs resulting from substituting natural gas for liquid fuels.
• Identify potential barriers to introducing natural gas to the Caribbean’s pow-er sector. The above analysis considers the economic competitiveness of natural gas under ideal market conditions. This final segment of the study will consider institutional, regulatory, and political barriers that may affect the ultimate cost or feasibility of importing natural gas.
These six tasks are detailed in this final report.
REGIONAL SOURCES FOR NATURAL GAS EXPORTS
This study examined six potential natural gas suppliers: the United States, Venezuela, Trinidad and Tobago, Mexico, Colombia, and Peru. Each country is geographically close to the Caribbean and, according to the 2012 BP Statistical Review of World Energy, has substantial natural gas reserves (see Table 1). Furthermore, several countries have large shale gas resources that are under evaluation or development. Adding in the EIA’s 2011 estimate for technically recoverable shale gas reserves rein-forces the region’s potential to significantly increase natural gas production.

Pre-Feasibility Study of the Potential Market for Natural Gas as a Fuel for Power Generation in the Caribbean20
Caribbean Port Table 1: Potential Natural Gas Suppliers
NATURAL GAS MARKET OVERVIEW (2011 DATA)
Proved Reserves
Production Reserves to Production (R/P) Ratio
Consumption Net Exports
Shale Technically Recoverable Reserves
R/P Ratio with Shale Added
(Tcf) (Bcf) (Bcf) (Bcf) (Tcf)
United States 300 22,990 13.0 24,371 -1,381 862 50.5
Venezuela 195 1,102 177.0 1,169 -67 11 187.0
Trinidad & Tobago
14.2 1,437 9.9 777 660 9.9
Mexico 12.5 1,854 6.7 2,433 -579 681 374.0
Peru 12.5 403 31.0 219 184 31.0
Colombia 5.8 388 14.9 318 71 19 63.8
Table 2 shows the relative rankings of each potential supply source based on estimated reserves, the reserve to production ratio (as a proxy for reserve volumes available for export), the likely timing when export infrastructure could be available, and a qualitative assessment of political risk to export projects.
Table 2: Ranking Potential Natural Gas Suppliers
NATURAL GAS SOURCE RANKINGS (1=MOST FAVORABLE)
Known Reserves (w/shale gas)
Reserve to Production Ratio (w/shale gas)
Timing of Export Infrastructure Availability
Political Risk to Exports
Average Ranking (unweighted)
United States 1 4 3 3 2.75
Trinidad & Tobago
5 6 1 1 3.25
Mexico 2 1 5 5 3.25
Peru 6 5 2 2 3.75
Colombia 4 3 4 4 3.75
Venezuela 3 2 6 6 4.25
The ranking suggest that the United States is the strongest likely supply source. It is important to note, however, that most sources in the region ranked in a tight range as each option brings specific strengths and weaknesses. Further detail about each of these supply options is provided below.

21
Figure 1 highlights the export points best suited to serving the Caribbean for each natural gas ex-porting country, based on available port and related infrastructure, proximity to domestic natural gas infrastructure, and proximity to the Caribbean.
Figure 1: Potential Natural Gas Supply Sources
Sabine Pass
West Palm Beach
Guiria
Point Fortin (TT)
Altamira
Covenas
Peru NLG
UNITED STATES
The United States has the largest natural gas market in the hemisphere, consuming an average of 67 billion cubic feet (Bcf) per day. It has been a net natural gas importer for decades, mainly via pipeline imports from Canada and liquefied natural gas (LNG) deliveries along the East coast and U.S. Gulf coast. The U.S. also exports roughly 1.5 Bcf per day of natural gas to Mexico via pipe-line (representing just over one fifth of Mexico’s total consumption) and smaller volumes to Asia as LNG from Alaska.

Pre-Feasibility Study of the Potential Market for Natural Gas as a Fuel for Power Generation in the Caribbean22
The U.S. shale gas revolution has dramatically increased the country’s natural gas reserves and pro-duction. Current estimates suggest the U.S. has more than 860 trillion cubic feet (Tcf) of technically recoverable shale gas reserves—on top of the 300 Tcf of traditional reserves—allowing the country to maintain current production levels for the next 50 years or more. This supply surge has led previously planned LNG import projects to reinvent themselves as LNG export terminals, particularly in the U.S. Gulf Coast region.
Multiple LNG liquefaction projects are under development in the U.S. Gulf coast region, including three which have received licenses to export to non-FTA countries: Sabine Pass (Cheniere Energy, Inc.), Freeport (Freeport LNG Development, L.P.), and Lake Charles (Southern Union Co.). These facilities are close to Henry Hub, the United States’ main natural gas pricing point, and are in a highly industrialized region with a long history of hydrocarbon development and related industries. LNG or compressed natural gas (CNG) exports from the U.S. would likely originate from this region, and could be available as early as 2016. As the most advanced of the proposed projects, Sabine Pass is used as a proxy for U.S. Gulf Coast LNG exports in this study.
Southern Florida is another potential export point, particularly to the Bahamas. Although Florida does not itself produce natural gas, the state has a sizeable market, consuming more than 3 Bcf per day. The Florida market is connected to the U.S. Gulf Coast gas producing basins via two major in-terstate pipelines: the Florida Gas Transmission company’s extensive state-wide pipeline system links to the southern U.S. pipeline grid via the Florida panhandle, and the undersea Gulfstream pipeline links Louisiana directly to the Tampa Bay area. In addition, a proposed third major pipeline the Sabal Trail Transmission project, would link to the MidContinent Express trunk line via Georga bringing roughly 1 Bcf per day of additional natural gas supply to central Florida. A second project sponsored by Florida Power and Light would extend the pipeline to a large power generation complex in Indi-antown, FL near Lake Okeechobee. These projects are currently undergoing regulatory approvals. If approved, they are expected to come on line in 2017.
Southern Florida is well position to supply the Bahamas and is close to the islands of the eastern Ca-ribbean. The terminus of the proposed new pipelines is less than 30 miles from a suitable port and power generation/ industrial complex north of West Palm Beach. From there, Nassau, the Bahamas, is just over 200 miles away. Ship-born LNG and CNG could also potentially be exported from the region (indeed, very small containerized gas shipments for small consumers are already being export-ed from Florida).
Because Florida does not produce natural gas itself, the cost of shipping gas to Florida from U.S. producing regions increases the cost of natural gas supplied to the export point. Florida’s basis dif-ferential (the price difference between gas delivered in Florida and the main pricing point at Henry Hub) has averaged close to $1.00 for the past few years. Additional pipeline capacity and the broader trend of increasing gas supply in the mid-Atlantic region may reduce this difference in the future, but Florida will continue to be more expensive than Henry Hub.

23
TRINIDAD AND TOBAGO
Trinidad and Tobago is the fourth largest natural gas producer in the hemisphere despite its small pop-ulation and economy. It exports many products that use natural gas as a feedstock, such as ammonia and fertilizer, and also energy-intensive products, such as direct-reduced iron. Natural gas has also been directly exported as LNG since 1999, primarily supplying the United States and Europe. As U.S. LNG imports have dried up, Trinidad has been under pressure to find new customers for its available exports, turning to growing markets such as Brazil, Argentina, and increasingly reaching Asian markets.
Trinidad’s Atlantic LNG at Point Fortin is the only operating LNG liquefaction facility in the Ca-ribbean basin. Its four trains process roughly half of Trinidad’s total natural gas production and are able to export the equivalent of more than 2 Bcf per day of natural gas. In addition, other groups have proposed expanding Trinidad’s natural gas exports via LNG and pipelines. Gasfin, a European developer with ties to TGE, a small and medium sized LNG ship builder, has proposed a 500,000 tonne per annum (roughly 24 Bcf per year) LNG export facility at the La Brea Industrial park, near Point Fortin. The Eastern Caribbean Gas Pipeline Company has also proposed a pipeline linking gas fields near Tobago (northeast of Trinidad) directly to Barbados. This project would be a more limited version of the Eastern Caribbean pipeline that was proposed a decade ago to link Trinidad with the line of islands along the eastern side of Caribbean. If built, the project could be expanded to include other nearby islands, such as St. Lucia, Martinique and Guadaloupe.
MEXICO
Mexico is the third largest natural gas producer in the hemisphere, having grown rapidly in the past decade with the installation of new gas-fired power generation capacity. Mexico produces associated gas (gas that is developed alongside crude oil) in its offshore Gulf of Mexico fields, as well as non-as-sociated gas, primarily in the Burgos basin near the Texas border. Like the United States, Mexico has significant shale gas reserves. This resource remains largely untapped as upstream investment is focused on oil production. As a result, Mexico continues to import natural gas via pipeline from the United States as well as via LNG at three receiving terminal: Altamira on the Gulf coast, Manzanillo on the Pacific coast, and Costa Azul in Baja California near the California border.
Mexico’s rapid natural gas demand growth and limited investment in new gas production raises con-cerns about its ability to support exports to the Caribbean. This risk is partially mitigated by the coun-try’s growing connections to the United States’ natural gas market and the excess of available supply near the U.S.-Mexico border. In effect, growing exports of U.S. gas into northern Mexico could offset domestic supplies from further south, freeing it for potential exports to the Caribbean. In this case, Ciudad Pemex, the southern pricing point for the Mexican natural gas pipeline system, would be the mostly likely pricing point for Mexican exports. Because Mexico is too far from the Caribbean markets to support a pipeline, the most likely export option would be to convert the Altamira LNG receiving terminal to also allow for LNG liquefaction and exports.

Pre-Feasibility Study of the Potential Market for Natural Gas as a Fuel for Power Generation in the Caribbean24
PERU
Peru’s natural gas reserves are estimated to be just 12.5 Tcf. The country has recently identified potential shale gas resources, but has not yet shown them to be commercially viable. Until further discoveries are proven up, Peru has the smallest resource potential of the six proposed countries. The domestic natural gas market is also small, however, such that current reserves are sufficient for more than 30 years at current production rates. Strong economic growth and additional gas-fired power generation capacity will continue to increase domestic consumption, but large hydropower resources and new natural gas discoveries will help maintain supply availability for LNG exports.
Peru LNG is Latin America’s only operating LNG liquefaction plant on the Pacific Ocean. It primar-ily ships natural gas to Mexico’s Manzanillo terminal, although spot cargoes have been delivered to Europe and Asia. Current capacity is relatively small – roughly 150 million cubic feet (MMcf) per day – and so a second train would likely be needed to meet a substantial part of Caribbean demand. Peru LNG receives gas via pipeline from Peru’s Camisea field, located on the eastern side of the Andes. Re-serves are sufficient to allow an expansion in exports, although additional investment may be required in the cross-Andes pipeline. This would likely increase the delivered cost of natural gas although other recent natural gas discoveries in more accessible locations could also potentially serve growing exports.
COLOMBIA
Colombia’s natural gas sector is growing rapidly driven by new discoveries (owing to an exploration boom) and new investment in gas-fired power generation and natural gas distribution. The country has an extensive natural gas pipeline system, linking producing fields with large demand centers near Bogota, Medellin, and Cali. Colombia exports gas to Venezuela’s western oil fields via pipeline and has recently announced plans to build both LNG liquefaction and regasification capacity on its Ca-ribbean coast. Building both would allow the country to access a larger number of export markets for its growing production while also enabling gas imports for periods of peak natural gas demand. Colombia’s hydro power units – which constitute a majority of the country’s power generation capac-ity—are vulnerable to swings in rainfall associated with the El Niño / La Niña weather patterns. As a result, Colombia’s utilization of its gas-fired power generation capacity and need for gas supplies can surge periodically.
Coveñas is near Colombia’s natural gas pipeline system and major producing fields such as La Cresci-ente. Colombia’s growing natural gas production could be exported to the Caribbean basin via LNG, CNG or pipeline from this point once the required infrastructure is built. Pacific Rubiales, the com-pany holding the concession for La Cresciente, is building a small (70 MMcf per day capacity) LNG liquefaction barge that is expected to be operational by 2015. The will likely be placed at Coveñas and will have sufficient capacity to meet projected gas demand from the smaller Caribbean countries. As Colombia’s gas production continues to increase, the project could be expanded to serve a greater share of the Caribbean’s potential natural gas demand.

25
VENEZUELA
Venezuela has the third largest natural gas reserves in the hemisphere, reaching just over 200 TCF. Current natural gas production is primarily associated gas, much of which is re-injected in order to maintain reservoir pressure and support oil production. Venezuela’s domestic gas market is small rel-ative to its resource potential, smaller than Trinidad or Colombia at roughly 3 Bcf per day. Proposals to use this resource to supply gas-fired power generation capacity, energy-intensive industries, petro-chemicals or exports have yet to result in actual investment and development. Venezuela currently im-ports natural gas from Colombia to support oil production in its western fields rather than developing its domestic resources in the east and building a pipeline to link the two.
Guiria is the site of the proposed CIGNA industrial complex that would exploit the Plataforma Delt-ana / Mariscal Sucre natural gas fields—extensions of the same geological structures below Trini-dad. The complex is planned to include petrochemicals production and LNG liquefaction. Although the natural gas reserves were discovered decades ago, proposed development and related industrial projects on the Venezuelan side have not moved forward. In addition to perceived political risks, reg-ulatory requirements to sell a percentage of natural gas supply to the domestic market at artificially low rates have limited investor interest in large, capital-intensive natural gas projects. Therefore, while Guiria is the expected port for any future Venezuelan natural gas exports, it is unclear when the re-quired infrastructure will be built.
POTENTIAL NATURAL GAS DELIVERY POINTS
Natural gas deliveries to the Caribbean will require suitable locations for the related infrastructure. Standard LNG and CNG ships are large and have deep drafts, requiring sizeable harbors to accom-modate them. Smaller scale options are available, however, which are better suited to the Caribbean’s smaller markets. These include small-scale LNG and CNG ships, floating storage and regasification vessels (FSRU’s) that remove the need for a port and greatly reduce on-shore infrastructure costs, and even container-sized LNG modules that can be delivered via regular shipping. Delivering natural gas via pipelines requires a clear right-of-way—a potentially difficult proposition in densely populated areas, although less of a barrier for undersea routes. This analysis reviews delivery points for seaborne natural gas based on known port characteristics, and assumes a suitable right-of-way can be found for any proposed pipeline.
LNG AND CNG LANDING POINTS
LNG and CNG ships are available in a range of sizes with the largest reaching more than 260,000 cubic meters of capacity. For this study, LNG ships were assumed to be sized in line with the needs of each individual market. CNG ships of a similar physical size have a much smaller delivery capacity, owing to the lower compression of the natural gas. CNG ships also have a similar draft as LNG ships

Pre-Feasibility Study of the Potential Market for Natural Gas as a Fuel for Power Generation in the Caribbean26
owing to the much heavier weight of steel pipe within the ship to contain the compressed natural gas. A large CNG ship is expected to be able to deliver the equivalent of 500 MMcf of natural gas, rough-ly a quarter the volume of a typical LNG vessel. Like LNG vessels, CNG ships can be scaled down significantly to match the destination market’s needs.
Full-scale LNG and CNG ships have a typical loaded draft of 10-12 meters (30-40 feet) depth and lengths in excess of 250 meters (825 feet). According to the World Port Index database, most coun-tries included in this report have at least one port with sufficient depth to accommodate a full sized LNG tanker. Major exceptions to this rule include Haiti and St. Lucia (both of which have ports with anchorage sites of sufficient depth, such that a new jetty could be built) and Guyana and Suriname (neither of which has even sufficient depth at anchorage sites, requiring an off-shore buoy for off-load-ing). The ports selected for this study are shown in Figure 2, and additional details for all ports with sufficient depth are shown in Table 3 and Table 4.
Figure 2: Potential ports for LNG or CNG delivery
Nassau, The Bahamas
Andres LNG, Dominican
Republic
Basseterre,St. Kitts &
Nevis
St. Georges, Grenada
Port-au-Prince, Haiti
St. John’s Antigua & Barbuda
Roseau, Domenica
Castries, St. Lucia
Bridgetown, Barbados
Point Fortin (TT)Old Harbour, Jamaica
Covenas
Kingstown, St. Vincent & The
Grenadines
Georgetown, Guyana Paramaribo,
Suriname
Ports can be modified to accept larger ships, but typically at very high cost. In addition, LNG and CNG ships can unload to FSRU’s moored at off-shore buoys, thus avoiding the need to enter a port at all. This analysis assumed there is space available to build an LNG or CNG terminal, or a suitable location to moor an FSRU, in each country.

27
Table 3: Caribbean Port Characteristics
CARIBBEAN PORT CHARACTERISTICS
HARBOR MINIMUM DEPTH (FEET)
CO
UN
TR
Y
POR
T
NA
ME
HA
RB
OR
SI
ZE
HA
RB
OR
T
YPE
SHE
LTE
R
CH
AN
NE
L
AN
CH
OR
-A
GE
CA
RG
O
PIE
R
OIL
TE
R-
MIN
AL
Goo
d H
old-
ing
Gro
und
Tur
ning
Are
a
Antigua and Barbuda St Johns M OR F 31 51 46 41 Y Y
Bahamas Freeport S RB F 46 76 36 76 Y Y
Bahamas South Riding Point
V CN F 76 41 0 76 Y Y
Bahamas Nassau M CN G 36 46 36 36 Y Y
Bahamas Clifton Pier V OR F 36 46 0 36 Y Y
Barbados Bridgetown S CB G 41 26 36 41 Y Y
Dominica Portsmouth V CN F 0 31 46 0 Y
Dominica Roseau V CN F 76 76 31 31
Dominican Republic San Pedro De Macoris
S RN G 26 56 26 41 Y Y
Dominican Republic Puerto De Haina S RN G 31 41 31 36 N Y
Dominican Republic Punta Nizao Oil Terminal
S OR F 0 41 0 41 Y
Dominican Republic Pepillo Salcedo V OR G 31 76 36 0 Y Y
Grenada St George's S CN F 41 41 61 31 Y
Haiti Port Au Prince M OR G 41 46 31 31 Y
Haiti Cap Haitien V OR F 56 46 31 0 N Y
Jamaica - North Coast Discovery Bay S OR P 36 0 36 36 Y
Jamaica - North Coast Ocho Rios V CN P 46 41 36 0 Y
Jamaica - South Coast Kingston M CN E 56 36 46 36 Y Y
Jamaica - South Coast Port Esquivel V OR F 36 36 36 41 Y Y
Jamaica - South Coast Port Kaiser V OR F 0 71 36 36 Y
St. Kitts & Nevis Basseterre V OR F 71 71 26 16 Y Y
St. Lucia Vieux Fort V CN G 36 61 31 0 Y Y
St. Lucia Grand Cul De Sac Bay
S CN G 76 0 36 76 Y
St. Lucia Castries S CN G 36 71 31 36 Y Y
St. Vincent and the Grenadines
Kingstown S CN F 0 76 36 26 Y Y
Guyana Georgetown M RN G 21 16 16 11 Y
Suriname Paramaribo S RN E 11 16 16 16
Suriname Paranam V RN E 11 31 26 0 Y

Pre-Feasibility Study of the Potential Market for Natural Gas as a Fuel for Power Generation in the Caribbean28
Table 4: Caribbean Port Services
CARIBBEAN PORT SERVICES
CO
UN
TR
Y
POR
T N
AM
E
TU
G
ASS
IST
WH
AR
VE
S
PRO
VIS
ION
S
WA
TE
R
FUE
L O
IL
DIE
SEL
OIL
RE
PAIR
RA
ILW
AY
Antigua and Barbuda St Johns N Y Y Y N
Bahamas Freeport N Y Y Y C
Bahamas South Riding Point Y Y Y Y Y C
Bahamas Nassau Y Y Y Y C S
Bahamas Clifton Pier N N N N N N
Barbados Bridgetown N Y Y Y N S
Dominica Portsmouth N Y Y Y Y
Dominica Roseau Y Y Y Y Y N S
Dominican Republic San Pedro De Macoris Y Y Y Y N
Dominican Republic Puerto De Haina N Y Y Y N C
Dominican Republic Punta Nizao Oil Terminal
N Y Y Y Y Y C
Dominican Republic Pepillo Salcedo Y Y Y Y Y C M
Grenada St George's Y Y Y C
Haiti Port Au Prince Y Y Y Y Y N C S
Haiti Cap Haitien Y Y Y Y C S
Jamaica - North Coast Discovery Bay Y Y Y Y C
Jamaica - North Coast Ocho Rios Y Y Y N N N N
Jamaica - South Coast Kingston Y Y Y Y Y C
Jamaica - South Coast Port Esquivel N Y Y Y Y Y C
Jamaica - South Coast Port Kaiser N Y Y Y Y C
St. Kitts & Nevis Basseterre Y Y Y Y Y D
St. Lucia Vieux Fort Y Y Y Y Y C
St. Lucia Grand Cul De Sac Bay Y Y Y Y Y C
St. Lucia Castries Y Y Y
St. Vincent and the Grenadines
Kingstown Y Y Y Y N
Guyana Georgetown Y Y Y Y C S
Suriname Paramaribo Y Y Y Y Y N C S
Suriname Paranam N Y Y Y C S

29
The specific port characteristics for each Caribbean market are described below.
ANTIGUA AND BARBUDA
St. John’s is Antigua and Barbuda’s only port of sufficient size to manage full-scale LNG ships. The World Port Index describes it as medium sized, making it among the Caribbean’s largest. The port is an open roadstead design with fair shelter. It is located in Antigua’s largest city but has relatively limited available services.
THE BAHAMAS
There are four ports in the Bahamas that are able to accommodate full-scale LNG ships either at their terminals or within their anchorage areas. Of the four, Nassau’s port is the largest, a medium-sized natural coastal port with good shelter. Port services available at Nassau are also the most extensive in the Bahamas, including limited repair capability and a small railroad at the facility. Nassau is also the greatest concentration of population and electricity demand in the Bahamas, making it the destina-tion of choice for natural gas deliveries.
BARBADOS
The Bridgetown port is large enough for full-sized LNG ships, described as a small coastal breakwater harbor with good shelter by the World Port Index. Although the anchorage depth is less than would be needed for a larger LNG ship, the cargo pier and oil terminals are both sufficiently deep. Bridgetown is the major population center for the island and the center of electricity demand.
DOMINICA
Dominica’s ports at Roseau and Portsmouth both have sufficient depth to accommodate large-scale LNG ships, although Roseau’s channel and anchorage areas are by far the deeper of the two. Both ports are very small natural coastal ports with fair shelter. Roseau also has the better services of the two and so was chosen as the most likely location for ship-borne gas imports to Dominica. The island’s small size ensures the port is close to the relevant power generation facilities and electricity demand.
DOMINICAN REPUBLIC
The Dominican Republic has four ports that are large enough to manage full-scale LNG ships – two open roadsteads and two natural river ports. The ports range from very small to small, with fair to

Pre-Feasibility Study of the Potential Market for Natural Gas as a Fuel for Power Generation in the Caribbean30
good shelter, and a substantial range of available services. Of the four, the smallest, Pepillo Salcedo, located on the northern coast near the border with Haiti, is the best equipped. In addition to these four, the Andres LNG facility operates its own jetty located just east of Santo Domingo, near the in-ternational airport and a container port. A new LNG facility, the NGL Complejo del Este, has been proposed to be built in the San Pedro e Macaris port further to the east. For this study, LNG imports to the Dominican Republic are assumed to land at the existing facility at Andres LNG.
GRENADA
Grenada’s St. George’s port is a small natural coastal port with fair shelter. Port depths range from 30 to 60 feet and the port has sufficient turning area to accommodate full-scale LNG ships. The port has a range of services available, including limited repair facilities. The island’s small size ensures the port is close to the relevant power generation facilities and electricity demand.
HAITI
Haiti has two ports capable of handling full-scale LNG ships: Port-au-Prince and Cap Haitien. Of the two, Port-au-Prince is the larger and more developed, listed as a medium sized open roadstead port with good shelter and sufficient depth. Port-au-Prince also has a full range of services, including limited repair facil-ities and a small railroad on site. Cap Haitien is listed as a very small open roadstead with only fair shelter. This port has a more limited range of services available, although it does have a railroad on site and also limited repair facilities. For this study, Port-au-Prince was selected as the delivery point for modeling natural gas deliveries given its location closest to Haiti’s largest city and electricity demand center.
JAMAICA
Jamaica has five ports listed as being large enough to manage full-scale LNG ships, including two on the island’s northern coast and three on the southern coast. Of the five, Kingston port is the most attractive, listed as a medium sized open roadstead port with excellent shelter and channel depths in excess of 50 feet. Kingston is also very close to the proposed LNG import facility at Old Harbour, chosen for its proximity to the Kingston electricity demand center.
ST. KITTS & NEVIS
St. Kitts’ port at Basseterre is a very small open roadstead port with fair shelter. Although the oil ter-minal is too shallow to accommodate a full-scale LNG ship, its channel and anchorage sites are more than sufficient at more than 70 feet of depth. Port services are relatively extensive, although repair facilities are limited to emergency repairs only. St. Kitts is a very small island, making it relatively easy to access power generation units from the primary harbor.

31
ST. LUCIA
There are three ports in St. Lucia with sufficient depth to manage a full-scale LNG ships. Of the three, Castries is among the largest, listed as a small sized natural coastal port with good shelter and an anchorage depth in excess of 70 feet. Services are more limited than in other ports, but it is located in St. Lucia’s capital city and thus is close to the major center of electricity demand.
ST. VINCENT AND THE GRENADINES
St. Vincent’s port at Kingstown is a small natural coastal port with fair shelter. Its anchorage area has sufficient depth for any sized vessel, although the oil terminal is too shallow to accommodate full-scale LNG ships. Services at the port are limited, but the islands small size also limits any difficulties in linking natural gas offloading infrastructure with the island’s power generation units.
GUYANA
This study assumed natural gas import facilities for Guyana would be built near Georgetown, the largest city and center of the primary power distribution grid. The port at Georgetown is a medium sized natural river port with good shelter, according to the World Port Index. It is not large enough to manage full-scale LNG ships, nor even smaller CNG ships as even the smallest proposed CNG ships have a draft in excess of 20 feet. This study assumes a jetty or off-shore buoy for an FSRU can be built near the river mouth where ocean depths are sufficient for larger vessels but still within close proximity to the city’s power generation facilities.
SURINAME
None of Suriname’s three ports have sufficient depth to accommodate full-scale LNG vessels. This study includes two natural river ports listed as having excellent shelter: the port at Paramaribo on the Suriname River and, farther upstream on the same river, the port of Paranam. Although much far-ther inland, Paranam is listed as being the deeper of the two, with a maximum depth of roughly 30 feet – deep enough to accommodate smaller CNG and LNG ships. Paramaribo is Suriname’s largest city, and so the port is closest to the country’s main electricity generation and demand center. For this study, it is assumed that a jetty or off-shore buoy for an FSRU can be built near the river mouth just north of Paramaribo where ocean depths are sufficient for larger vessels but still within close proxim-ity to the city’s power generation facilities.
Pre-Feasibility Study of the Potential Market for Natural Gas as a Fuel for Power Generation in the Caribbean32
NATURAL GAS COSTS: UPSTREAM
The first component of the natural gas value chain is the price of natural gas at the export point in each exporting country. The natural gas wholesale price for each potential supply source was calcu-lated using a netback analysis based on the price at Henry Hub as reported in the EIA 2013 Annual Energy Outlook. Henry Hub is the main pricing point for U.S. natural gas sales, and a natural ref-erence price for LNG or CNG exports from the United States. Natural gas price setting for other exporting countries is less liquid and often set by contract, although many do use Henry Hub as a reference price.
Sabine Pass and other U.S. Gulf Coast export terminals are located very close to Henry Hub, and so the expected Henry Hub price is used for natural gas supplied to these export points. Southern Flori-da and the potential Mexican exports from Altamira are both connected to the U.S. natural gas pipe-line system. As a result, the price of natural gas supplied to these export points are linked to Henry Hub and are determined by regional supply and demand dynamics. Based on historical average price differentials, this study assumes natural gas is supplied to Altamira via the Mexican pipeline system at roughly $0.20 below the price at Henry Hub. Natural gas prices in Southern Florida are assumed to be roughly $1.00 above Henry Hub.
This study uses a netback from Henry Hub to calculate the maximum upstream price that other regional exporting countries—including Colombia, Peru, Trinidad, and Venezuela—could charge while still remaining competitive with U.S. gulf coast LNG exports. The netback was calculated as the price of natural gas at Henry Hub plus the cost to ship natural gas as LNG to each target market minus the cost to ship natural gas as LNG from an alternate supply point to that market (see Figure 4). In this way, sources that are closer to the destination point are able to charge an upstream price higher than Henry Hub, while those that are further away from the destination would have to supply natural gas at a discount to Henry Hub.

33
Figure 4: Netback pricing analysis based on Henry Hub
Sabine PassMost advanced US Gulf Coast LNG
liquefaction projects. Located near Henry Hub gas pricing point, higly industrializad area. West Palm Beach
Port nearest to the end of new natural gas pipelines serving Florida’s gasfired power generation. Closest US point to eastern Caribbean.
GuiriaSite of proposed CIGNA industrial complex and LNG liquefaction plant. Natural gas from Plataforma Deltana / Mariscal Sucre.
Point Fortin (TT)Operating LNG liquefaction plant, higly industrialized area based on Trinidad’s natural gas production.
AltamiraLNG import facility, close to mayor
pipelines could add liquefaction with sufficient supply - US imports are
increasing and market is too tight to allow exports.
CovenasPort closest to Colombia’s natural gas
pipeline system and production.
Peru NLGOperating LNG liquefaction plant, receives gas by pipeline from Peru’s Camisea field.
Table 5 below shows the resulting upstream natural gas price for each of the proposed supply sources and major destination markets. Because the netback analysis indicates the maximum price that could be charged while still remaining competitive with LNG exports from Sabine Pass, exporting countries could potentially supply gas for less in order to gain an advantage. Likewise, exporting countries that are unable to supply gas to the export point below the indicated breakeven price will be vulnerable to competition from the United States. This analysis is based on a $4.00 Henry Hub price, consistent with the expected natural gas price trend over the next ten years.

Pre-Feasibility Study of the Potential Market for Natural Gas as a Fuel for Power Generation in the Caribbean34
Table 5: Calculated Break-even Natural Gas Price at Supply Point (US$ per MMBtu)
UNITED STATES
MEXICO TRINIDAD VENEZUELA COLOMBIA PERU
DESTINATION
SOU
TH
ER
N
FLO
RID
A
ALT
AM
IRA
POR
T
FOR
TIN
GU
IRIA
CO
VE
NA
S
PER
U L
NG
Bahamas Nassau $5.00 $3.80 $3.95 $3.95 $3.99 $3.55
Jamaica Old Harbour $5.00 $3.80 $4.01 $4.01 $4.06 $3.74
Haiti Port-au-Prince $5.00 $3.80 $4.05 $4.05 $4.10 $3.65
Dominican Republic
Andres LNG $5.00 $3.80 $4.08 $4.08 $4.08 $3.75
Grenada St. George $5.00 $3.80 $4.66 $4.66 $4.40 $3.16
St. Vincent & the Grenadines
Kingstown $5.00 $3.80 $4.64 $4.64 $4.39 $3.16
Barbados Bridgetown $5.00 $3.80 $4.32 $4.32 $4.19 $3.59
St. Lucia Castries City $5.00 $3.80 $4.62 $4.62 $4.38 $3.16
Dominica Roseau $5.00 $3.80 $4.87 $4.87 $4.56 $2.56
Antigua & Barbuda
St. Johns $5.00 $3.80 $4.40 $4.40 $4.27 $3.35
St. Kitts and Nevis
Basseterre $5.00 $3.80 $4.38 $4.38 $4.27 $3.34
Guyana Georgetown $5.00 $3.80 $4.36 $4.36 $4.20 $3.68
Suriname Paramaribo $5.00 $3.80 $4.36 $4.36 $4.20 $3.62
Of the four countries calculated with the netback methodology, all except Peru are better positioned than the U.S. Gulf Coast to serve any Caribbean market except the Bahamas. This is particularly true for natural gas from Trinidad and Venezuela delivered to the eastern Caribbean markets where the source countries could charge a $0.50 - $0.87 premium over Henry Hub.
In Peru’s case, the longer shipping distances require the supplier to accept a discount to Henry Hub ranging from $0.25 to $1.44 per MMBtu. At its most disadvantaged destination (Dominica, owing to the distance differential and the higher cost for shipping owing to the very small size of the market), natural gas would have to be supplied to the Peru LNG liquefaction plant at just $2.56 per MMBtu to compete with $4.00 Henry Hub. Transporting the natural gas from Peru’s Camisea field in the Andes to the coast for liquefaction adds an additional cost, further reducing the price that is ultimate paid at the wellhead. Natural gas suppliers may be unwilling to accept such a low price, and therefore would not be able to effectively compete to supply the Caribbean market.

35
WHY HENRY HUB INDEX GAS PRICES?
Historically, non-U.S. LNG importers in the Americas have been challenged to link prices to Henry Hub. Indeed, in recent years importers ranging from Chile, Argentina, and Brazil to Mexico and the Dominican Republic have paid prices more closely related to Japan’s LNG prices than to Henry Hub. Many have at times paid three or four times the cost of Henry Hub, if they were able to secure supplies at all. These importers are contracting for small, spot-market purchases rather than larger, long-term contracts, and so have less leverage in price negotiations. More importantly, these purchas-es were made before LNG exports were available from the U.S. Gulf Coast (recent reported exports from the region are actually re-exports of contracted LNG cargoes that were not needed in the U.S. owing to the current natural gas surplus, rather than supply sourced from U.S. production).
Liquefaction capacity is now under construction at Sabine Pass and Freeport on the Texas Gulf Coast, and exports have been approved for the Lake Charles facility in Louisiana. Each project already holds sales contracts with multiple European and Asian buyers based on Henry Hub prices. Sabine Pass expects to have 9 million tons per year (mtpa) of liquefaction capacity—equal to roughly 430 Bcf of natural gas per year, online by 2016. Two additional trains will raise the total to 18 mtpa (865 Bcf) by 2017, and another two will increase total capacity to 27 mtpa (1,300 Bcf) by 2018. Of this total, roughly 20 mtpa (just under 1 Tcf per year) is already contracted. Sabine Pass’s customers include BG (Britain), GN Fenosa (Spain), KOGAS (Korea), GAIL (India), Total (France), and Centrica (Britain).
Freeport is planning to bring 13.2 mtpa (roughly 630 Bcf per year) of capacity online by 2018. Osaka Gas and Chubu Electric, both Japanese energy companies, have contracted 100% of the first train’s liquefaction capacity, totaling 4.4 mtpa or roughly 210 Bcf per year of conversion capacity. BP (Brit-ain) has contracted the second 4.4 mtpa train, and the third planned train remains open. Freeport in particular is an illustrative example as it provides liquefaction services on a tolling basis: customers must provide the gas to be liquefied and the shipping to take it away while Freeport merely charges a fee to convert it from gaseous form to liquid form.
Lake Charles is another of the original LNG import facilities built in response to the 1970s oil crisis that is now reorienting to LNG exports. Its permit for non-FTA exports was approved in August, 2013 for up to 15 mtpa (roughly 730 Bcf per year) of capacity. The project has contracted all of its initial capacity to BG and expects to begin operations in 2018.
In addition to these three projects, an overwhelming 150 mtpa of additional liquefaction capacity has been proposed in the United States, with another 50 mtpa proposed in Canada. All told, U.S. and Ca-nadian proposed additions account for roughly 45% of worldwide planned new liquefaction capacity, and represent a volume that is close to 65% of the world’s current existing liquefaction capacity. Not all of these projects will come to fruition, but even a fraction of the total has the potential to substan-tially change global LNG markets. As a result, Henry Hub-indexed LNG supply is expected to expand significantly in the coming decade.

Pre-Feasibility Study of the Potential Market for Natural Gas as a Fuel for Power Generation in the Caribbean36
NATURAL GAS COSTS: TRANSPORTATION
Transporting natural gas to the final consumption point via pipeline is a relatively straightforward process. Transporting it as LNG or CNG, however, requires large investment in processing equipment at each end of the route: liquefaction and regasification facilities for LNG, and compression and de-compression facilities for CNG (see Figure 5).
Figure 5: Natural Gas Transportation Options
Natural Gas Supply
Pipeline
Shipping
Shipping
Expansion
Regasification
Compression
Liquefaction
Natural Gas Consumption
LNG
CNG
PIPELINE
The different costs along the value chain, and the inherent characteristics of each transportation tech-nology option, create specific benefits and challenges for each option.
ADVANTAGES AND LIMITATIONS OF PIPELINES AND LNG/CNG INFRASTRUCTURE
LNG and CNG terminals can provide greater protection against counter-party risk as they can accept shipments from any number of potential suppliers. Should one supplier or purchaser be unable to meet its obligations, cargoes can easily be redirected from or to another. LNG is a well-established technology that has been used on a global scale for decades, and so is best able to take advantage of this flexibility. The liquefaction stage is greatest cost component along the LNG value chain. The process also consumes 10-12% of the supplied natural gas. These high costs penalize smaller projects, requiring a liquefaction train to have large anchor clients or access to multiple markets. LNG benefits from relatively low shipping costs, however, and so distance between supply and demand has less im-pact on the final delivered price.
A growing number of small-scale LNG projects, such as small-scale liquefaction and regasification, floating liquefaction and off-loading platforms for smaller stranded off-shore natural gas reserves, and
37
LNG ships with on-board regasification capabilities, are being developed worldwide. This ongoing investment has helped bring costs down for smaller-scale projects, although larger-scale projects still benefit from economies of scale. For most Caribbean natural gas markets, small-scale LNG is the most applicable. Only the largest markets, such as the Dominican Republic, have sufficient size for a full-scale regasification terminal.
For any of the source countries considered in this study, liquefaction projects are likely to be full-scale given the size of the resource base. While this would mean Caribbean consumers would be one of sev-eral off-takers supporting a given liquefaction project, it suggests they would be able to take advantage of the resulting cost reduction. As a result, the potential increase in cost from moving to smaller-scale projects would come in the shipping and regasification links of the chain.
CNG has also been used for decades, but seaborne CNG is a much newer concept. Although several companies have competing designs for large-scale CNG ships, none are in commercial operation to date. The lure of seaborne CNG is the dramatically lower cost of compressing gas relative to liquefying it. This lower cost in turn allows much smaller natural gas fields to be linked to markets and monetized. However, shipping CNG is likely to be much more expensive than shipping LNG. CNG ships are essen-tially floating platforms for high-pressure pipelines which require thick, high grade steel that is heavy and expensive. Each CNG ship will likely cost more than a typical LNG ship (particularly the first generation of ships) and will be able to carry much less natural gas. CNG ships may be easier to scale down, how-ever. Because shipping is the most expensive component for CNG, shipping distance has a large impact on the final delivered cost. As the technology matures, costs will likely come down, but much additional investment and development is required before seaborne CNG will be as readily available as LNG.
Another limitation of both LNG and CNG is that the loading and receiving terminals cannot be interchanged. Because they can only support exports or imports, the direction of natural gas flows cannot be as easily reversed as they can in a pipeline (where additional compression is often all that is needed). If new gas discoveries allow a gas-importing country to become an exporter (as is now hap-pening in the United States), the receiving terminals would become obsolete. Likewise, if available supply proves insufficient to sustain gas exports in the future, export terminals would become stranded assets. Some countries, including the United States and Colombia, are combining liquefaction and regasification capacity into a single facility. This can bring some cost savings with shared port and related infrastructure, but remains a very capital-intensive proposition. The Caribbean has almost no known natural gas reserves outside of Trinidad and Tobago and Barbados, suggesting that there is little risk that the region will ever become a natural gas exporter. The region is also relatively under explored, however, and increased investment in exploration could result in new discoveries.
Natural gas pipelines are also a well-established technology deployed worldwide with multiple equip-ment providers and operators. Natural gas pipelines have the advantage of allowing gas flow to re-verse more easily than with LNG or CNG, but are not as flexible in linking multiple sources of supply with multiple demand centers. Pipelines are therefore vulnerable to problems with supply availability at their point of origin or changes in demand at the point of delivery. In addition, the capital cost to

Pre-Feasibility Study of the Potential Market for Natural Gas as a Fuel for Power Generation in the Caribbean38
build a pipeline is largely driven by the pipeline length with relatively little variation from changes in the pipeline diameter (and, thereby, capacity to move natural gas). As such, long-distance projects or those with small volumes are penalized.
POTENTIAL SUPPLY ROUTES: DISTANCES
Table 6 below lists the calculated shipping distances for each natural gas source and destination com-bination. These distances were estimated using routes plotted on Google Earth.
Table 6: Seaborne shipping distances (nautical miles)
SOURCE COUNTRY
RE
CE
IVIN
G
CO
UN
TR
Y
POR
T
U. S
. SA
BIN
E P
ASS
U. S
. S.
FL
OR
IDA
ME
XIC
OA
LTA
MIR
A
TR
INID
AD
PO
INT
FO
R-
TIN
VE
NE
ZU
EL
A
GU
IRIA
CO
LO
MB
IA
CO
VE
NA
PER
U
PER
U L
NG
Bahamas Nassau 990 190 1.026 1,380 1,400 1,041 2,614
Jamaica Old Harbour 1,214 539 1,250 1,031 1,032 521 2,052
Haiti Port-au-Prince 1,501 676 1,537 1,074 1,075 698 2,283
Dominican Republic
Andres LNG 1,646 982 1,682 679 679 670 2,327
Grenada St. George 2,156 1,511 2,192 114 116 939 2,629
St. Vincent & the Grenadines
Kingstown 2,160 1,433 2,196 192 194 969 2,659
Barbados Bridgetown 2,255 1,371 2,291 287 289 1,066 2,756
St. Lucia Castries City 2,162 1,257 2,198 254 256 986 2,677
Dominica Roseau 2,121 1,170 2,157 341 343 977 2,666
Antigua & Barbuda
St. Johns 2,080 1,058 2,116 453 455 986 2,679
St. Kitts and Nevis
Basseterre 2,039 1,017 2,075 494 496 945 2,638
Guyana Georgetown 2,531 1,949 2,567 324 343 1,298 2,988
Suriname Paramaribo 2,709 2,131 2,745 506 525 1,466 3,157
Shipping distances range from as little as 114 nautical miles from Point Fortin, Trinidad to St. George, Grenada, to as much as 3,167 nautical miles from the Peru LNG export terminal to Paramaribo, Suriname via the Panama Canal. Maps showing the estimated routes for each supply source can be found in Appendix A.
The calculated distances were converted to transit times using an assumed average ship speed of 19.4 nautical miles per hour, based on figures reported in NERA’s 2012 Macroeconomic Impacts of LNG Exports

39
from the United States study. Shipments from Peru must pass through the Panama Canal, adding an ad-ditional day to account for slower transit speeds in the Canal and any potential delays in entering the Canal. The resulting transit times for a one-way voyage range from as little as 6 hours (1/4 of a day) to nearly 8 days as shown in Table 7.
Table 7: Seaborne transit times (days per one-way voyage) )
SOURCE COUNTRY
RE
CE
IVIN
G
CO
UN
TR
Y
POR
T
U. S
. SA
BIN
E P
ASS
U. S
. S.
FL
OR
IDA
ME
XIC
OA
LTA
MIR
A
TR
INID
AD
PO
INT
FO
RT
IN
VE
NE
ZU
EL
A
GU
IRIA
CO
LO
MB
IA
CO
VE
NA
PER
U
PE
RU
LN
G
Bahamas Nassau 2.13 0.41 2.20 2.96 3.01 2.24 6.61
Jamaica Old Harbour 2.61 1.16 2.68 2.21 2.22 1.12 5.41
Haiti Port-au-Prince 3.22 1.45 3.30 2.31 2.31 1.50 5.90
Dominican Republic
Andres LNG 3.54 2.11 3.61 1.46 1.46 1.44 6.00
Grenada St. George 4.63 3.25 4.71 0.24 0.25 2.02 6.65
St. Vincent & the Grenadines
Kingstown 4.64 3.08 4.72 0.41 0.42 2.08 6.71
Barbados Bridgetown 4.84 2.94 4.92 0.62 0.62 2.29 6.92
St. Lucia Castries City 4.64 2.70 4.72 0.55 0.55 2.12 6.75
Dominica Roseau 4.56 2.51 4.63 0.73 0.74 2.10 6.73
Antigua & Barbuda St. Johns 4.47 2.27 4.54 0.97 0.98 2.12 6.75
St. Kitts and Nevis Basseterre 4.38 2,18 4.46 1.06 1.07 2.03 6.67
Guyana Georgetown 5.44 4.19 5.51 0.70 0.74 2.79 7.42
Suriname Paramaribo 5.82 4.58 5.90 1.09 1.13 3.15 7.78
LNG TRANSPORTATION COSTS
The LNG cost assumptions used in this study are based on the 2012 NERA study Macroeconomic Im-pacts of LNG Exports from the United States completed for the U.S. DOE to assess the potential market for U.S. LNG exports. NERA assumed capital costs for liquefaction to be at $2.37 per million British thermal units (MMBtu) for projects in South America and for greenfield projects in the United States. This figure was discounted to $1.61 per MMBtu for U.S. Gulf Coast brownfield projects, as a portion of the required investment had already occurred when the sites were planned to be regasification fa-cilities. In addition to the capital cost, operations and maintenance (O&M) costs were assumed to be $0.16 per MMBtu plus the purchase price of 9% of the natural gas to be shipped (set at the wholesale price of natural gas being supplied to the facility) to account for the natural gas consumed in the liq-uefaction process.
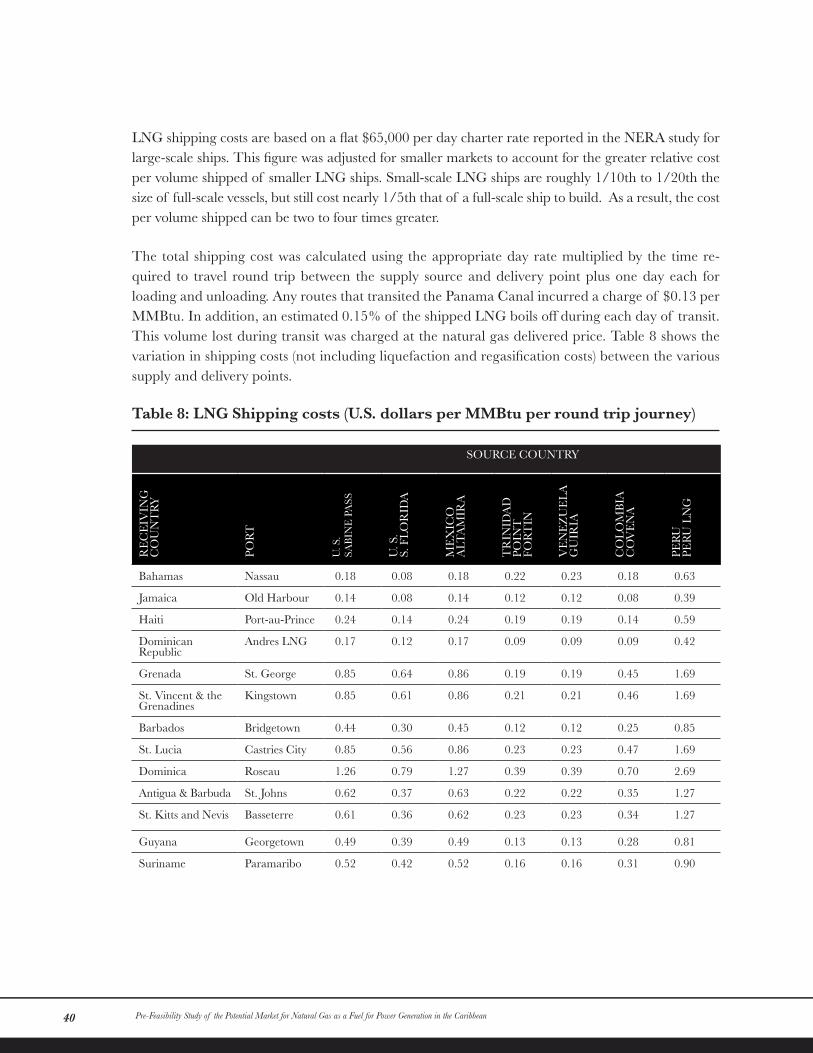
Pre-Feasibility Study of the Potential Market for Natural Gas as a Fuel for Power Generation in the Caribbean40
LNG shipping costs are based on a flat $65,000 per day charter rate reported in the NERA study for large-scale ships. This figure was adjusted for smaller markets to account for the greater relative cost per volume shipped of smaller LNG ships. Small-scale LNG ships are roughly 1/10th to 1/20th the size of full-scale vessels, but still cost nearly 1/5th that of a full-scale ship to build. As a result, the cost per volume shipped can be two to four times greater.
The total shipping cost was calculated using the appropriate day rate multiplied by the time re-quired to travel round trip between the supply source and delivery point plus one day each for loading and unloading. Any routes that transited the Panama Canal incurred a charge of $0.13 per MMBtu. In addition, an estimated 0.15% of the shipped LNG boils off during each day of transit. This volume lost during transit was charged at the natural gas delivered price. Table 8 shows the variation in shipping costs (not including liquefaction and regasification costs) between the various supply and delivery points.
Table 8: LNG Shipping costs (U.S. dollars per MMBtu per round trip journey)
SOURCE COUNTRY
RE
CE
IVIN
G
CO
UN
TR
Y
POR
T
U. S
.SA
BIN
E P
ASS
U. S
. S.
FL
OR
IDA
ME
XIC
OA
LTA
MIR
A
TR
INID
AD
POIN
T
FOR
TIN
VE
NE
ZU
EL
A
GU
IRIA
CO
LO
MB
IAC
OV
EN
A
PER
UPE
RU
LN
G
Bahamas Nassau 0.18 0.08 0.18 0.22 0.23 0.18 0.63
Jamaica Old Harbour 0.14 0.08 0.14 0.12 0.12 0.08 0.39
Haiti Port-au-Prince 0.24 0.14 0.24 0.19 0.19 0.14 0.59
Dominican Republic
Andres LNG 0.17 0.12 0.17 0.09 0.09 0.09 0.42
Grenada St. George 0.85 0.64 0.86 0.19 0.19 0.45 1.69
St. Vincent & the Grenadines
Kingstown 0.85 0.61 0.86 0.21 0.21 0.46 1.69
Barbados Bridgetown 0.44 0.30 0.45 0.12 0.12 0.25 0.85
St. Lucia Castries City 0.85 0.56 0.86 0.23 0.23 0.47 1.69
Dominica Roseau 1.26 0.79 1.27 0.39 0.39 0.70 2.69
Antigua & Barbuda St. Johns 0.62 0.37 0.63 0.22 0.22 0.35 1.27
St. Kitts and Nevis Basseterre 0.61 0.36 0.62 0.23 0.23 0.34 1.27
Guyana Georgetown 0.49 0.39 0.49 0.13 0.13 0.28 0.81
Suriname Paramaribo 0.52 0.42 0.52 0.16 0.16 0.31 0.90

41
Calculated shipping costs ranged from a low of $0.08 per MMBtu from Southern Florida to the Bahamas to a high of $2.69 per MMBtu between Peru LNG and Dominica. The wide variation in shipping distances, compounded by the increase in daily shipping costs for smaller vessels to serve smaller markets, resulted in a more than a 30-fold increase in shipping costs between the lowest and highest cost option.
Like shipping, smaller-scale regasification costs more per volume than larger-scale terminals. This study assumes that a minimum of $30 million is required for basic offloading and regasification infra-structure. Regassification costs were scaled with project size, ranging from a minimum of $0.64 per MMBtu (including capital costs and O&M) for large-scale terminals to a high of $4.36 per MMBtu for the smallest markets.
Table 9 shows the all-in cost to transport natural gas as LNG between the proposed supply and des-tination points, including liquefaction, shipping, and regasification. The total cost ranged from a low of just over $2.94 per MMBtu from Sabine Pass, U.S. to Jamaica to a high of $9.94 for Peru LNG to ship LNG to Dominica.
Table 9: LNG transportation costs (Liquefaction, shipping, regasification)
SOURCE COUNTRY
RE
CE
IVIN
G
CO
UN
TR
Y
POR
T
U. S
.SA
BIN
E P
ASS
U. S
.S.
FL
OR
IDA
ME
XIC
O
ALT
AM
IRA
TR
INID
AD
PO
INT
FOR
TIN
VE
NE
ZU
EL
A
GU
IRIA
CO
LO
MB
IAC
OV
EN
A
PER
U
PER
U L
NG
Bahamas Nassau 3.51 4.17 4.27 4.31 4.32 4.27 4.72
Jamaica Old Harbour 3.40 4.10 4.16 4.14 4.14 4.10 4.41
Haiti Port-au-Prince 4.27 4.93 5.03 4.98 4.98 4.93 5.38
Dominican Republic
Andres LNG 2.94 3.65 3.70 3.62 3.62 3.62 3.95
Grenada St. George 5.23 5.78 6.00 5.33 5.33 5.59 6.83
St. Vincent & the Grenadines
Kingstown 5.23 5.75 6.00 5.35 5.35 5.60 6.83
Barbados Bridgetown 3.89 4.51 4.66 4.33 4.33 4.46 5.06
St. Lucia Castries City 4.53 5.00 5.30 4.67 4.67 4.91 6.13
Dominica Roseau 7.75 8.04 8.52 7.64 7.64 7.95 9.94
Antigua & Barbuda St. Johns 4.30 4.81 5.07 4.66 4.66 4.79 5.71
St. Kitts and Nevis Basseterre 4.99 5.50 5.76 5.37 5.37 5.48 6.41
Guyana Georgetown 3.94 4.60 4.70 4.34 4.34 4.49 5.02
Suriname Paramaribo 3.97 4.63 4.73 4.37 4.37 4.52 5.11

Pre-Feasibility Study of the Potential Market for Natural Gas as a Fuel for Power Generation in the Caribbean42
Because liquefaction is such a large share of the total transportation cost, the assumed lower capital cost for U.S. Gulf Coast-based liquefaction projects gave them a significant cost advantage over other sources.
All potential supply sources except Peru were able to deliver within a relatively tight cost range, cre-ating a highly competitive landscape. This implies that non-U.S. suppliers would not have to discount their supply dramatically below Henry Hub parity in order to deliver natural gas at a highly compet-itive price. Atlantic LNG in Trinidad is particularly well positioned to supply the region, and other exporters could similarly compete with U.S. supply to meet the Caribbean’s needs. Peru LNG is an outlier given its much greater distance from the region and the need to transit the Panama Canal.
This analysis assumes ships are available at going charter rates and shipping scheduling can be optimized to avoid paying for any demurrage or other “dead” time. Higher rates for spot cargoes or logistical inefficiencies arising from the actual delivery process could increase costs significantly. Variations in the cost of primary inputs, such as high grade steel and skilled labor, or site specific conditions, can also affect the cost of liquefaction and regasification projects. This implies that the range in calculated transportation costs from the main regional suppliers could be within the range of cost uncertainty. This suggests that transportation costs alone are insufficient to prioritize one supplier over another
CNG TRANSPORTATION COSTS
Because no CNG ships are currently operating commercially, the cost to ship CNG is much more difficult to estimate and has a wider range of uncertainty than for shipping LNG. For this study, CNG cost assumptions are based on academic papers and company information from two com-peting shipping technologies: SeaNG Corporation’s Coselle system, which uses modules of coiled high-pressure pipes to store the CNG for shipping, and the EnerSea Transport, LLC’s VOTRANS technology which cools the natural gas to -30 degrees Celsius to allow a greater compression ratio at lower pressures.
For this analysis, the capital and operating costs for loading and unloading full-scale ships was estimat-ed to be $0.20 per MMBtu. Like LNG, smaller-scale CNG infrastructure costs more per volume than larger-scale terminals. This study assumes that a minimum level of investment is required for basic offloading infrastructure, even where FSRU’s are used.
Shipping costs were estimated to equal a daily charter rate of $125,000 per day for full-scale ships based on academic estimates that CNG ships would be substantially more expensive than current LNG ships. As with LNG ships, it was assumed that reducing CNG ship’s scale did not linearly reduce the ship’s cost, resulting in higher shipping costs per unit shipped for smaller markets.

43
CNG ships were assumed to have a same speed as LNG ships, traveling at 19.4 knots per hour, but the loading and unloading processes were assumed to take longer. This study allowed two days for loading and five days for unloading as CNG ships themselves can provide floating storage if needed at the destination. Table 10 below shows CNG shipping costs (not including compression or unloading) for the various supply and destination combinations for the study.
Table 10: CNG shipping costs (round trip US$ per MMBtu)
SOURCE COUNTRY
RE
CE
IVIN
G
CO
UN
TR
Y
POR
T
U. S
. SA
BIN
E P
ASS
U. S
. S.
FL
OR
IDA
ME
XIC
O
ALT
AM
IRA
TR
INID
AD
PO
INT
FO
RT
IN
VE
NE
ZU
EL
A
GU
IRIA
CO
LO
MB
IAC
OV
EN
A
PER
UPE
RU
LN
G
Bahamas Nassau 2.59 1.80 2.63 2.98 3.00 2.64 4.79
Jamaica Old Harbour 2.81 2.15 2.85 2.63 2.63 2.13 4.24
Haiti Port-au-Prince 3.10 2.28 3.13 2.68 2.68 2.30 4.46
Dominican Republic
Andres LNG 3.24 2.59 3.28 2.29 2.29 2.28 4.51
Grenada St. George 14.99 12.44 15.13 6.90 6.91 10.17 19.23
St. Vincent & the Grenadines
Kingstown 15.00 12.13 15.15 7.21 7.22 10.29 19.34
Barbados Bridgetown 7.69 5.94 7.76 3.79 3.80 5.34 9.86
St. Lucia Castries City 11.26 8.57 11.37 5.59 5.60 7.77 14.56
Dominica Roseau 22.28 16.63 22.49 11.70 11.72 15.48 29.06
Antigua & Barbuda St. Johns 11.02 7.98 11.12 6.18 6.19 7.77 14.57
St. Kitts and Nevis Basseterre 10.89 7.86 11.00 6.31 6.31 7.65 14.45
Guyana Georgetown 8.24 7.08 8.31 3.87 3.91 5.80 10.32
Suriname Paramaribo 8.59 7.45 8.66 4.23 4.27 6.13 10.66
CNG shipping costs are significantly higher than shipping LNG, ranging from just under $2 per MMBtu between West Palm Beach, Florida and Nassau, the Bahamas to a high of $29 per MMBtu between Peru LNG’s export facility and Roseau, Dominica. Adding in the cost to compress and un-load the CNG at its destination results in the total transportation costs shown in Table 11.

Pre-Feasibility Study of the Potential Market for Natural Gas as a Fuel for Power Generation in the Caribbean44
Table 11: CNG transportation costs (compression, shipping, delivery)
SOURCE COUNTRY
RE
CE
IVIN
G
CO
UN
TR
Y
POR
T
U. S
. SA
BIN
E P
ASS
U. S
. S.
FL
OR
IDA
ME
XIC
O
ALT
AM
IRA
TR
INID
AD
POIN
T
FOR
TIN
VE
NE
ZU
EL
A
GU
IRIA
CO
LO
MB
IAC
OV
EN
A
PER
U
PER
U L
NG
Bahamas Nassau 2.99 2.20 3.03 3.38 3.40 3.04 5.19
Jamaica Old Harbour 3.21 2.55 3.25 3.03 3.03 2.53 4.64
Haiti Port-au-Prince 3.50 2.68 3.53 3.08 3.08 2.70 4.86
Dominican Republic
Andres LNG 3.64 2.99 3.68 2.69 2.69 2.68 4.91
Grenada St. George 16.19 13.64 16.33 8.10 8.11 11.37 20.43
St. Vincent & the Grenadines
Kingstown 16.20 13.33 16.35 8.41 8.42 11.49 20.54
Barbados Bridgetown 8.29 6.54 8.36 4.39 4.40 5.94 10.46
St. Lucia Castries City 12.16 9.47 12.27 6.49 6.50 8.67 15.46
Dominica Roseau 24.48 18.83 24.69 13.90 13.92 17.68 31.26
Antigua & Barbuda St. Johns 11.92 8.88 12.02 7.08 7.09 8.67 15.47
St. Kitts and Nevis Basseterre 11.79 8.76 11.90 7.21 7.21 8.55 15.35
Guyana Georgetown 8.84 7.68 8.91 4.47 4.51 6.40 10.92
Suriname Paramaribo 8.79 7.65 8.86 4.43 4.47 6.33 10.86
Estimated total transportation costs range from just over $2 per MMBtu between West Palm Beach, Florida and Nassau, the Bahamas to a high of just over $31 per MMBtu between Peru LNG’s export facility and Roseau, Dominica. The table above clearly shows the disadvantage faced by smaller mar-kets. Because these projects are capital intensive and incur a fixed minimum cost regardless of market size, the capital charge becomes unbearable for smaller markets.
CNG ships are also assumed to have longer unloading times than LNG. Indeed, loading and unload-ing each shipment accounts for more days than the actual shipping transit in almost all cases consid-ered here. As a result, shipping distance has less influence on the all-in price of CNG transportation, resulting in a smaller range of all-in costs than for LNG.
There is greater uncertainty regarding actual shipping costs for CNG than LNG, as well as in the cost of building offloading facilities and storage. The lack of commercial experience in operating seaborne CNG suggests early projects could be more expensive than anticipated, but that costs will ultimately come down as operators gain experience and systems are optimized to take full advantage of the new technology.

45
PIPELINE TRANSPORTATION COSTS
Natural gas could also be supplied to certain Caribbean nations via pipeline from four supply coun-tries: the United States, Trinidad and Tobago, Venezuela, and Colombia. A pipeline from Florida could reach the Bahamas. A pipeline from Trinidad and Tobago or Venezuela would be able to reach the smaller islands in the Eastern Caribbean ranging from Granada up through St. Lucia, Dominica, and potentially reaching as far as Puerto Rico. Finally, a pipeline from Colombia could reach Jamai-ca, and also extend to Haiti and the larger market in the Dominican Republic. In addition, smaller regional pipeline could be used to re-export natural gas that is delivered to neighboring markets via LNG. For example, a pipeline could send natural gas delivered to the Dominican Republic to Haiti.
This study considered sixteen different options for building undersea pipelines to bring natural gas to the Caribbean market. The analysis includes options to directly link a single market to a supply source, and also regional pipelines that link several markets together to achieve economies of scale. For region-wide deliveries, the proposed pipeline was assumed to begin with an initial delivery capac-ity at the source sufficient to serve the combined demand of all served markets. The pipeline would then reduce in size between each country along the route, based on the projected consumption for the country being transited.
Pipeline cost assumptions are based on reported capital costs of recently completed undersea pipe-lines and from calculations by Black and Veatch in 2012 as reported in the Jobs and Economic Bene-fits of Midstream Infrastructure Development, U.S. Economic Impacts through 2035 project for the INGAA Foundation. Capital costs were assumed to be $5 million per mile for pipelines with capacity over 300 MMcf per day, falling to $3 million per mile for pipeline capacity between 100 MMcf per day and 300 MMcf per day, and $2 million per mile for capacity below 100 MMcf per day.
Annual O&M costs were set equal to 1.8% of the pipeline’s total capital cost, and annual fuel costs for pipeline operations (compression) was set equal to 2% of the total capital cost as a proxy for volume and distance. Pipeline tariffs were calculated using an assumed 80 percent load factor, 80/20 debt to equity ratio, 8 percent interest rate and 12 percent allowed rate of return on equity, 15 year depreci-ation, and 35 percent tax rate. This allowed the pipeline’s capital cost to be spread across an average tariff for the project’s 15-year economic life.
The sixteen pipeline options are grouped into three broad regions:
• Western Caribbean. This group includes a pipeline from Florida to the Bahamas, a pipe-line from Colombia to Jamaica, Haiti, and the Dominican Republic (with three different configurations); and, a land-based pipeline linking the Dominican Republic’s Andres LNG terminal to Haiti.
• Eastern Caribbean. This group includes a pipeline from Tobago to Barbados and six variations on a regional pipeline linking Trinidad or Venezuela to Grenada, St. Vincent and the Grenadines, St. Lucia, Antigua and Barbuda, St. Kitts and Nevis, and Barbados.

Pre-Feasibility Study of the Potential Market for Natural Gas as a Fuel for Power Generation in the Caribbean46
• Guyana and Suriname. This group includes pipelines from Trinidad and Venezuela to Guyana, and a variation of each with an extension to Suriname.
Each of these three groups are shown in Figure 6 and discussed separately below.
Figure 6: Potential Natural Gas Pipeline Routes in the Caribbean
WESTERN CARIBBEAN
This grouping brings together three distinct supply options: Southern Florida, exporting to the Ba-hamas; Colombia, exporting to Jamaica, Haiti, and the Dominican Republic; and, the Dominican Republic, re-exporting LNG via pipeline to Haiti.
The proposed capacity for each segment of the five proposed pipeline variations in the Western Ca-ribbean are shown in Table 12 below. The three variations for Colombia supply analyze the potential cost savings from increasing the size of the main pipeline from Colombia to Jamaica by extending additional pipelines to serve Haiti and the Dominican Republic.

47
Table 12: Variations on Western Caribbean Pipeline Capacity (MMcf per day)
RECEIVING COUNTRY
PORT S. FLORIDA - BAHAMAS
COLOMBIA - JAMAICA
COLOMBIA - HAITI
COLOMBIA - DOMINICAN REPUBLIC
DOMINICAN REPUBLIC - HAITI
Bahamas Nassau 100
Jamaica Old Harbour 250 350 850
Haiti Port-au-Prince 100 600 100
Dominican Republic
Andres LNG 500
The above pipeline capacities were combined with the route distances and assumed capital and oper-ational cost per mile noted previously to calculate the resulting transportation tariff for each pipeline segment. The cumulative cost to transport gas from the supply source to each destination point is listed in Table 13 below.
Table 13: Western Caribbean Pipeline transportation costs (US$/MMBtu)
RECEIVING COUNTRY
PORT S. FLORIDA - BAHAMAS
COLOMBIA - JAMAICA
COLOMBIA - HAITI
COLOMBIA - DOMINICAN REPUBLIC
DOMINICAN REPUBLIC - HAITI
Bahamas Nassau $3.18
Jamaica Old Harbour $5.16 $3.71 $2.58
Haiti Port-au-Prince $8.45 $4.61 $2.14
Dominican Republic
Andres LNG $5.72
The pipelines linking Florida with the Bahamas and the Dominican Republic with Haiti are relatively low cost, given the size of the markets and short distance between supplier and consumer. Both are dis-advantaged by the elevated price of natural gas at the supply point, however: Florida owing to the cost of transportation via pipeline from Henry Hub, and the Dominican Republic owing to LNG shipping costs.
Building an undersea pipeline from Colombia to Jamaica is a much larger undertaking. The signif-icant distance (roughly 600 miles) is reflected in the transportation tariff despite the market being more than twice the size of the Bahamas. Extending the pipeline to Haiti helps to reduce the cost of transporting the gas to Jamaica, but results in a very high cost at the pipeline’s terminus in Haiti. Fur-ther extending the pipeline to the Dominican Republic takes advantage of the much larger terminal market, beginning to bring transportation costs in line with sea-borne transportation options.

Pre-Feasibility Study of the Potential Market for Natural Gas as a Fuel for Power Generation in the Caribbean48
EASTERN CARIBBEAN
This grouping includes one project currently under development (Tobago to Barbados) and six vari-ations of a regional pipeline following the line of islands from Grenada to Puerto Rico. The six variations can be supplied by either Trinidad or Venezuela – there is virtually no difference in the distance of either supply source to the destination markets. The six variations include three different pipeline lengths: to St. Luica, to Antigua and Barbuda, and extending all the way to Puerto Rico. The extension to Antigua and Barbuda is assumed to also deliver gas to Martinique and Guadaloupe, al-though neither island is included in the scope of this report. In addition, the extension to Puerto Rico is assumed to include deliveries to the Virgin Islands (specifically St. Croix and St. Thomas), although Puerto Rico and the Virgin Islands are also outside the scope of this study. Including Puerto Rico was necessary to justify a pipeline connecting St. Kitts and Nevis – without a large market further downstream, the transportation cost for the final 60-mile segment from Antigua to St. Kitts and Nevis would be more than $14 per MMBtu.
Each of the three proposed pipeline lengths were also considered with an option for a spur pipeline to Barbados leaving the main pipeline between St. Vincent and the Grenadines and St. Lucia. Adding this spur allowed for a larger capacity pipeline for the first two segments (Trinidad/Venezuela to Grenada and Grenada to St. Vincent and the Grenadines), thereby reducing the transportation tariff for each.
The proposed capacity for each segment of the seven proposed pipeline variations is shown in Table 14 below. The variation reaching to Puerto Rico assumed deliveries of 500 MMcf per day to Puerto Rico. This is sizeable enough to anchor the pipeline, while remaining small enough to not overwhelm Trinidad’s natural gas production capabilities, and is well below Puerto Rico’s potential total demand.
Table 14: Variations on Eastern Caribbean Pipeline Capacity (MMcf per day)
RE
CE
IVIN
G
CO
UN
TR
Y
POR
T
TO
BA
GO
- B
AR
BA
DO
S
T&
T/V
Z -
ST
. LU
CIA
T&
T/V
Z -
ST
. LU
CIA
W/
BA
RB
AD
OS
T&
T/V
Z -
AN
TIG
UA
&
BA
RB
UD
A
T&
T/V
Z -
AN
TIQ
UA
&
BA
RB
UD
A W
/B
AR
BA
DO
S
T&
T/V
Z -
PU
ER
TO
R
ICO
T&
T/V
Z -
PU
ER
TO
R
ICO
W/B
AR
-B
AD
OS
Grenada St. George 35 65 180 210 720 750
St. Vincent & the Grenadines
Kingstown 25 55 170 200 710 740
Barbados Bridgetown 30 30 30 30
St. Lucia Castries City 15 15 160 160 700 700
Dominica Roseau 75 75 615 615
Antigua & Barbuda
St. Johns 15 15 555 555
St. Kitts and Nevis
Basseterre 540 540

49
The above pipeline capacities were combined with the route distances and assumed capital and oper-ational cost per mile noted previously to calculate the resulting transportation tariff for each pipeline segment. The cumulative cost to transport gas from the supply source to each destination point is listed in Table 15 below.
Table 15: Eastern Caribbean Pipeline transportation costs (US$/MMBtu)
RE
CE
IVIN
G
CO
UN
TR
Y
POR
T
TO
BA
GO
- B
AR
BA
DO
S
T&
T/V
Z -
ST
. LU
CIA
T&
T/V
Z -
ST. L
UC
IA W
/B
AR
BA
DO
S
T&
T/V
Z -
AN
TIG
UA
&
BA
RB
UD
A
T&
T/V
Z -
AN
TIQ
UA
&
BA
RB
UD
A W
/B
AR
BA
DO
S
T&
T/V
Z -
PU
ER
TO
R
ICO
T&
T/V
Z -
PU
ER
TO
R
ICO
W/
BA
RB
AD
OS
Grenada St. George $5.35 $2.93 $1.59 $1.38 $0.73 $0.71
St. Vincent & the Grenadines
Kingstown $10.51 $5.32 $2.77 $2.39 $1.27 $1.24
Barbados Bridgetown $7.12 $10.55 $7.62 $6.46
St. Lucia Castries City $17.30 $12.12 $3.79 $3.41 $1.73 $1.70
Dominica Roseau $5.63 $5.25 $2.47 $2.44
Antigua & Barbuda
St. Johns $12.79 $12.41 $3.44 $3.41
St. Kitts and Nevis
Basseterre $4.03 $4.00
Each of the shorter variations show a very high transportation cost to the final market. This is due to the small market size of St. Lucia, Barbados, and Antigua and Barbuda. Extending the pipeline to the largest market in the region – Puerto Rico—reduces transportation costs significantly for markets along the pipeline’s path, but still results in transportation costs to Puerto Rico of just over $6.00. Such a pipeline would also be extremely expensive to build: rough estimates suggest it could cost on the order of $4.5 billion to build.
GUYANA AND SURINAME
This grouping includes two supply sources—Trinidad and Venezuela—with two pipeline configura-tions each: serving Guyana alone, or extending the pipeline to also serve Suriname.
Table 16 below shows the proposed capacity for each variation. Guyana and Suriname’s expected natural gas demand are similar in size despite Suriname’s significantly larger power market owing to Suriname’s existing hydro power capacity. This analysis assumes that Guyana’s proposed Amaila Falls hydropower plant is not built and is replaced with gas-fired thermal power plants.

Pre-Feasibility Study of the Potential Market for Natural Gas as a Fuel for Power Generation in the Caribbean50
Table 16: Variations on Guyana-Suriname Pipeline Capacity (MMcf per day)
RECEIVING COUNTRY
PORT TRINIDAD - GUYANA
VENEZUELA - GUYANA
TRINIDAD - SURINAME
VENEZUELA - SURINAME
Guyana Georgetown 30 30 60 60
Suriname Paramaribo 30 30
The above pipeline capacities were combined with the route distances and assumed capital and oper-ational cost per mile noted previously to calculate the resulting transportation tariff for each pipeline segment. The cumulative cost to transport gas from the supply source to each destination point is listed in Table 17 below.
Table 17: Guyana - Suriname Pipeline transportation costs (US$/MMBtu)
RECEIVING COUNTRY
PORT TRINIDAD - GUYANA
VENEZUELA - GUYANA
TRINIDAD - SURINAME
VENEZUELA - SURINAME
Guyana Georgetown $17.66 $18.59 $8.88 $9.35
Suriname Paramaribo $18.81 $19.28
The two countries’ small expected demand and their distance from Trinidad and Venezuelan natural gas supply result in unfeasibly high transportation costs. While Guyana’s transportation costs are cut in half if the pipeline is extended to Suriname, the cost to deliver the gas to Suriname would likely render it uncompetitive.
NATURAL GAS: FINAL DELIVERED PRICE
Combining the expected upstream cost for each natural gas supply source with the transportation costs for each technology and destination gives the range of final delivered prices for each of the transportation technologies being considered. Charts showing the delivered natural gas price across all delivery technologies for each individual country can be found in Appendix B.
LNG DELIVERED PRICE
LNG prices range from $7 to $13 per MMBtu, with the cheapest combination being U.S. Gulf Coast supply to the Dominican Republic (see Table 18).

51
Table 18: Final Delivered Price, LNG
SOURCE COUNTRY
RE
CE
IVIN
G
CO
UN
TRY
POR
T
U. S
. SA
BIN
E P
ASS
U. S
. S.
FL
OR
IDA
ME
XIC
O
ALT
AM
IRA
TR
INID
AD
POIN
T
FOR
TIN
VE
NE
ZU
EL
A
GU
IRIA
CO
LO
MB
IA
CO
VE
NA
PER
U
PER
U L
NG
Bahamas Nassau 7.51 9.17 8.07 8.27 8.27 8.27 8.27
Jamaica Old Harbour 7.40 9.10 7.96 8.16 8.16 8.16 8.16
Haiti Port-au-Prince 8.27 9.93 8.83 9.03 9.03 9.03 9.03
Dominican Republic
Andres LNG 6.94 8.65 7.50 7.70 7.70 7.70 7.70
Grenada St. George 9.23 10.78 9.80 9.99 9.99 9.99 9.99
St. Vincent & the Grenadines
Kingstown 9.23 10.75 9.80 9.99 9.99 9.99 9.99
Barbados Bridgetown 7.89 9.51 8.46 8.65 8.65 8.65 8.65
St. Lucia Castries City 8.53 10.00 9.10 9.29 9.29 9.29 9.29
Dominica Roseau 11.75 13.04 12.32 12.51 12.51 12.51 12.51
Antigua & Barbuda St. Johns 8.30 9.81 8.87 9.06 9.06 9.06 9.06
St. Kitts and Nevis Basseterre 8.99 10.50 9.56 9.75 9.75 9.75 9.75
Guyana Georgetown 7.94 9.60 8.50 8.70 8.70 8.70 8.70
Suriname Paramaribo 7.97 9.63 8.53 8.73 8.73 8.73 8.73
With natural gas supply at the export point based on an LNG netback from Henry Hub for Trinidad, Colombia, Peru, and Venezuela, the lower capital cost for LNG liquefaction at the Gulf Coast facil-ities gave them a competitive edge. For most alternative supply options, however, the cost difference is less than $1.00 per MMBtu. This tight band suggests that countries that are able to reduce their upstream price can effectively compete against the U.S. Gulf Coast exporters. Florida LNG exports are challenged from both higher liquefaction costs (there are no regasification terminals to be retro fit-ted, and so greenfield construction is required) and higher cost gas supply (roughly $1.00 above Henry Hub). These two additional costs outweighed Florida’s advantage of being closer to most Caribbean markets. Even in the Bahamas, where Sabine Pass is more than five times the distance as West Palm Beach, LNG from Florida was significantly more expensive.
CNG DELIVERED PRICE
CNG delivered prices ranged from just over $6.50 per MMBtu to nearly $34 per MMBtu, with the lowest cost pair being Colombia delivering to Jamaica and the most expense being Peru delivering to Dominica. The average cost to deliver CNG to the region (not including Dominica) was slightly higher than LNG at roughly $11 per MMBtu. The range in possible prices was also wider owing to the greater influence of transportation distance on transportation cost (see Table 19Table ).

Pre-Feasibility Study of the Potential Market for Natural Gas as a Fuel for Power Generation in the Caribbean52
Table 19: Final Delivered Price, CNG
SOURCE COUNTRY
RE
CE
IVIN
G
CO
UN
TRY
POR
T
U. S
. SA
BIN
E
PASS
U. S
. S.
FL
OR
IDA
ME
XIC
O
ALT
AM
IRA
TR
INID
AD
POIN
T
FOR
TIN
VE
NE
ZU
EL
AG
UIR
IA
CO
LO
MB
IAC
OV
EN
A
PER
U
PER
U L
NG
Bahamas Nassau 6.99 7.20 6.83 7.33 7.35 7.04 8.74
Jamaica Old Harbour 7.21 7.55 7.05 7.05 7.05 6.58 8.38
Haiti Port-au-Prince 7.50 7.68 7.33 7.13 7.13 6.80 8.52
Dominican Republic
Andres LNG 7.64 7.99 7.48 6.76 6.76 6.76 8.66
Grenada St. George 20.19 18.64 20.13 12.77 12.77 15.77 23.59
St. Vincent & the Grenadines
Kingstown 20.20 18.33 20.15 13.05 13.06 15.88 23.70
Barbados Bridgetown 12.29 11.54 12.16 8.71 8.72 10.13 14.06
St. Lucia Castries City 16.16 14.47 16.07 11.11 11.12 13.05 18.62
Dominica Roseau 28.48 23.83 28.49 18.77 18.78 22.24 33.82
Antigua & Barbuda St. Johns 15.92 13.88 15.82 11.48 11.49 12.93 18.81
St. Kitts and Nevis Basseterre 15.79 13.76 15.70 11.58 11.59 12.81 18.68
Guyana Georgetown 12.84 12.68 12.71 8.83 8.86 10.60 14.60
Suriname Paramaribo 12.79 12.65 12.66 8.79 8.82 10.53 14.48
PIPELINE DELIVERED PRICE
Pipeline delivered natural gas prices ranged from roughly $4.71 per MMBtu (Trinidad/Venezuela to Grenada, as part of a pipeline to Puerto Rico) to as high as $23.28 (Trinidad/Venezuela to Suriname via Guyana). Variations in pipeline configuration greatly affected the final price, especially if the pipe-line reaches a large terminal market or not (see Tables 20-22).
Table 20: Final Delivered Price, Western Caribbean Pipeline Variations
RECEIVING COUNTRY
PORT S. FLORIDA - BAHAMAS
COLOMBIA - JAMAICA
COLOMBIA - HAITI
COLOMBIA - DOMINICAN REPUBLIC
DOMINICAN REPUBLIC - HAITI
Bahamas Nassau $8.18
Jamaica Old Harbour $9.16 $7.71 $6.58
Haiti Port-au-Prince $12.45 $8.61 $10.29
Dominican Republic
Andres LNG $9.72

53
For the Western Caribbean group, pipeline delivered natural gas was generally more expensive than either LNG or CNG delivery methods. Indeed, the lowest cost option (Jamaica as part of a larger pipeline from Colombia to the Dominican Republic) is the same as the estimated cost of shipping Colombian gas to Jamaica as CNG.
Table 21: Final Delivered Price, Eastern Caribbean Pipeline Variations
RE
CE
IVIN
G
CO
UN
TR
Y
POR
T
TO
BA
GO
- B
AR
BA
DO
S
T&
T/V
Z -
ST
. LU
CIA
T&
T/V
Z -
ST
. LU
CIA
W/
BA
RB
AD
OS
T&
T/V
Z -
AN
TIG
UA
&
BA
RB
UD
A
T&
T/V
Z -
AN
TIQ
UA
&
BA
RB
UD
A W
/B
AR
BA
DO
S
T&
T/V
Z -
PU
ER
TO
R
ICO
T&
T/V
Z -
PU
ER
TO
R
ICO
W/
BA
RB
AD
OS
Grenada St. George $9.35 $6.93 $5.59 $5.38 $4.73 $4.71
St. Vincent & the Grenadines
Kingstown $14.51 $9.32 $6.77 $6.39 $5.27 $5.24
Barbados Bridgetown $11.12 $14.55 $11.62 $10.46
St. Lucia Castries City $21.30 $16.12 $7.79 $7.41 $5.73 $5.70
Dominica Roseau $9.63 $9.25 $6.47 $6.44
Antigua & Barbuda
St. Johns $16.79 $16.41 $7.44 $7.41
St. Kitts and Nevis
Basseterre $8.03 $8.00
The pipeline is a more feasible option in the Eastern Caribbean group where many smaller markets can be more effectively aggregated via a single pipeline. Average natural gas costs are much lower for smaller markets as there is no need for capital intensive regasification terminals or offloading jetties and buoys. Markets that are closest to the supply source benefit the most from the arrange-ment, and particularly benefit from the integration of a large terminal market (such as Puerto Rico in this example).
Table 22: Final Delivered Price, Guyana - Suriname Pipeline Variations
RECEIVING COUNTRY
PORT TRINIDAD - GUYANA
VENEZUELA - GUYANA
TRINIDAD - SURINAME
VENEZUELA - SURINAME
Guyana Georgetown $21.66 $22.59 $12.88 $13.35
Suriname Paramaribo $22.81 $23.28
As noted previously, the natural gas markets in Guyana and Suriname are too small to adequately support a natural gas pipeline of the length required. Both markets can be served for less than $9.00 per MMBtu via either LNG or CNG, making either option far more cost effective than build-ing a pipeline.

Pre-Feasibility Study of the Potential Market for Natural Gas as a Fuel for Power Generation in the Caribbean54
ENERGY INTENSIVE INDUSTRIES AND BARRIERS TO THEIR DEVELOPMENT
According to the EIA, total petroleum consumption in the Caribbean countries included in this report reached more than 320,000 barrels per day in 2012, or nearly 120 million barrels per year (see Table 23). Two-thirds of this total is consumed in the Dominican Republic and Jamaica alone. Overall, be-tween one-quarter and one-third of the region’s petroleum imports are estimated to be consumed for power generation. For smaller markets, this share rises to as much as 50%. Transportation accounts for the majority of the remaining demand. Industrial demand is limited as few countries in the region have significant industrial capacity.
Table 23: Caribbean Refined Petroleum Products Consumption (2012)
DAILY CONSUMPTION ANNUAL CONSUMPTION
TOTAL PETROLEUM CONSUMPTION
NATUR AL GAS EQUIVALENT
TOTAL PETROLEUM CONSUMPTION
NATURAL GAS EQUIVALENT
(THOUSAND BARRELS PER DAY)
(MILLION CUBIC FEET PER DAY)
(MILLION BARRELS PER YEAR)
(BILLION CUBIC FEET PER YEAR)
Antigua and Barbuda 4 21 1.46 7.5
Bahamas, The 24.2 124 8.8 45.3
Barbados 8.2 42 3.0 15.4
Dominica 0.9 4.6 0.3 1.7
Dominican Republic 122.6 629 44.7 230
Grenada 3.2 16 1.2 6.0
Guyana 10.9 56 4.0 20.4
Haiti 14 72 5.1 26.2
Jamaica 78.8 404 28.8 148
Saint Kitts and Nevis 1.7 9 0.6 3.2
Saint Lucia 3 15 1.1 5.6
Saint Vincent/Grenadines
2 10 0.7 3.7
Suriname 14.5 74 5.3 27.2
Total 322.3 1,654 118 604
Note: Total includes some Caribbean islands that are not included in the list above.
In the Caribbean, natural gas would be mainly used to reduce power generation costs by displacing more expensive liquid fuels. However, once natural gas supply is available, it would be beneficial to extend it as widely as possible throughout the economy. This would reduce costs in other sectors that rely on imported oil, and could also reduce the cost of natural gas by spreading the capital costs over a wider demand base.

55
In most markets, using natural gas as a transportation fuel would require an extensive distribution net-work to deliver the natural gas to retail filling stations. In small island nations, however, the number of retail stations is relatively low and they are contained within a manageable distance from the natural gas’ point of entry. This could help contain the cost of building the required distribution infrastruc-ture to substitute natural gas for gasoline and motor diesel. The cost to convert existing vehicles to use natural gas could be more challenging, especially if it is borne by the individual vehicle owners. Vehicular natural gas tends to be best suited for fleet vehicles (buses, trucks, taxis) which are paid for by corporations, have a limited range, and can return to the same center for refueling or are used in dense urban areas. To the extent that the Caribbean markets have fleet vehicles of this type, natural gas fueled vehicles can help reduce fuel costs and air pollution. Further market penetration into the personal vehicle sector is unlikely without substantial government subsidies for vehicle conversion.
Another way that natural gas could offset liquid fuels in transportation is through plug-in hybrid electric vehicles. These vehicles, such as the Chevy Volt and others, have an electric motor and a back-up gasoline engine. Unlike standard hybrids, they can also be plugged into the electricity grid to charge the battery directly. Using electricity generated with natural gas to recharge the car’s battery overnight would accomplish the same effect of substituting natural gas for higher cost liquid fuels but without the costly natural gas distribution infrastructure. Here again, substantial government support—including financial, marketing, and in making the vehicles available for the local market—would be needed for them to make up a sizeable share of the personal vehicle fleet. If retail gasoline prices are subsidized, there is little incentive to switch fuels.
In the industrial sector, natural gas imports would unlikely be the basis for a major expansion of energy-intensive industrial processes. Natural gas prices in the importing nations of the Caribbean will be substantially higher than those in surrounding countries, especially the United States and Trinidad. As a result, any energy-intensive products would also be more expensive than those that could be produced by gas exporting countries in the region. Many energy-intensive goods, such as petrochemicals, fertilizer, or steel, are relatively inexpensive to transport, thus limiting the benefit of having domestically sourced supply.
EXPECTED NATURAL GAS DEMAND FROM POWER GENERATION
Expected natural gas demand for power generation was calculated for the year 2020. This estimate is based on the current share of power generation served by thermal power plants (and in particular, reciprocating engines) which can be converted from liquid fuels to natural gas. In addition, the anal-ysis assumes that all incremental power demand between now and 2020 would be served by natural gas fired generation.
Based on these assumptions, the expected average daily consumption of natural gas for each of the Caribbean markets is shown in Table 24 below.

Pre-Feasibility Study of the Potential Market for Natural Gas as a Fuel for Power Generation in the Caribbean56
Table 24: Estimated Natural Gas Demand for Power Generation in 2020 (MMcf per Day)
ESTIMATED AVERAGE NATURAL GAS DEMAND FOR POWER GENERATION IN 2020 (MMCF PER DAY)
Bahamas 74
Jamaica 207
Haiti 43
Dominican Republic 310
Grenada 8
St. Vincent & Grenadines 6
Barbados 29
St. Lucia 12
Dominica 2
Antigua & Barbuda 12
St. Kitts & Nevis 8
Guyana 22
Suriname 33
IMPACT ON POWER GENERATION LONG-RUN MARGINAL COST
Switching from higher cost fuel oil to lower cost natural gas for power generation will reduce the cost of power to the end user. Most Caribbean countries are too small to support a competitive power market, and many rely on a small number of power generation stations for their electricity supply. In order to compare the benefit of introducing natural gas on an equal basis across all po-tential markets, this study examined the change in the long-run marginal cost of power generation for a reciprocating engine (low-speed diesel generator) when burning fuel oil versus natural gas. Re-ciprocating engines are the primary power generation technology in many of the region’s markets, and are the only fossil fuel based technology on several of the smallest islands. This technology is also one of the primary comparisons used in Section B, the renewable energy technology study that is the companion to this report.

57
The assumed capital cost, financial parameters, and non-fuel operating costs for the diesel engine are identical to the assumptions made in the Section B renewable energy cost comparison. Fuel oil is as-sumed to cost $80 per barrel ($13.89 per MMBtu), as is assumed in the renewable energy cost analysis, resulting in a long-run marginal cost of power generation of 15.72 US$ cents per kWh. Because this study assumes that introducing natural gas does not result in a change in power generation technologies, any option delivers natural gas for less than $13.89 per MMBtu will show a cost savings versus fuel oil.
Fuel costs make up the majority of the long-run marginal costs, and so a significant reduction in fuel expenses can have an appreciable impact on long-run power generation costs. It is important to keep in mind that natural gas prices from Trinidad, Venezuela, Colombia, and Peru is assumed to be based on Henry Hub parity. If natural gas cannot be secured at the parity price (as is likely the case in Peru), the resulting delivered gas prices will be higher.
Table 25 shows the long-run marginal cost of power generated by a reciprocating engine based on de-livered LNG prices. The long-run marginal costs for power generation across all natural gas delivery options for each specific country are shown in charts in Appendix C.
Table 25: LNG Delivered Natural Gas Long Run Marginal Cost of Power Generation (US$ Cents per kWh)
SOURCE COUNTRY
RE
CE
IVIN
G
CO
UN
TR
Y
POR
T
U. S
. SA
BIN
E P
ASS
U. S
. S.
FL
OR
IDA
ME
XIC
O
ALT
AM
IRA
TR
INID
AD
PO
INT
FO
RT
IN
VE
NE
ZU
EL
A
GU
IRIA
CO
LO
MB
IA
CO
VE
NA
PER
U
PER
U L
NG
Bahamas Nassau 10.54 11.89 10.99 11.15 11.15 11.15 11.15
Jamaica Old Harbour 10.45 11.83 10.90 11.06 11.06 11.06 11.06
Haiti Port-au-Prince 11.15 12.50 11.61 11.77 11.77 11.77 11.77
Dominican Republic
Andres LNG 10.08 11.46 10.53 10.69 10.69 10.69 10.69
Grenada St. George 11.94 13.19 12.40 12.55 12.55 12.55 12.55
St. Vincent & the Grenadines
Kingstown 11.94 13.17 12.40 12.55 12.55 12.55 12.55
Barbados Bridgetown 10.85 12.16 11.31 11.47 11.47 11.47 11.47
St. Lucia Castries City 11.37 12.56 11.83 11.99 11.99 11.99 11.99
Dominica Roseau 13.98 15.03 14.45 14.60 14.60 14.60 14.60
Antigua & Barbuda St. Johns 11.18 12.41 11.64 11.80 11.80 11.80 11.80
St. Kitts and Nevis Basseterre 11.74 12.97 12.20 12.36 12.36 12.36 12.36
Guyana Georgetown 10.88 12.24 11.34 11.50 11.50 11.50 11.50
Suriname Paramaribo 10.91 12.26 11.37 11.53 11.53 11.53 11.53

Pre-Feasibility Study of the Potential Market for Natural Gas as a Fuel for Power Generation in the Caribbean58
The calculated long-run marginal cost averages between 10 and 15 US$ cents per kWh across the countries included in the study. This indicates that all countries could potentially see lower electricity costs through the introduction of LNG, although the benefit is minimal for some markets. Table 26 below shows the percent change in long-run marginal cost between LNG and fuel oil.
Table 26: LNG Delivered Natural Gas Savings Compared to Fuel Oil (Percentage of Fuel Oil Long-Run Marginal Cost)
SOURCE COUNTRY
RE
CE
IVIN
G
CO
UN
TR
Y
POR
T
U. S
. SA
BIN
E P
ASS
U. S
. S.
FL
OR
IDA
ME
XIC
O
ALT
AM
IRA
TR
INID
AD
PO
INT
FO
RT
IN
VE
NE
ZU
EL
A
GU
IRIA
CO
LO
MB
IA
CO
VE
NA
PER
U
PER
U L
NG
Bahamas Nassau -33% -24% -30% -29% -29% -29% -29%
Jamaica Old Harbour -33% -24% -30% -29% -29% -29% -29%
Haiti Port-au-Prince -29% -20% -26% -25% -25% -25% -25%
Dominican Republic
Andres LNG -36% -27% -33% -32% -32% -32% -32%
Grenada St. George -24% -16% -21% -20% -20% -20% -20%
St. Vincent & the Grenadines
Kingstown -24% -16% -21% -20% -20% -20% -20%
Barbados Bridgetown -31% -22% -28% -27% -27% -27% -27%
St. Lucia Castries City -27% -20% -24% -23% -23% -23% -23%
Dominica Roseau -11% -4% -8% -7% -7% -7% -7%
Antigua & Barbuda St. Johns -29% -21% -26% -25% -25% -25% -25%
St. Kitts and Nevis Basseterre -25% -17% -22% -21% -21% -21% -21%
Guyana Georgetown -30% -22% -28% -27% -27% -27% -27%
Suriname Paramaribo -30% -22% -27% -26% -26% -26% -26%
For most markets, the price reduction is on the order of 20 to 30 percent. Dominica is a notable out-lier, where its very small market size greatly increases the relative cost of natural gas and reduces the potential benefit to less than a 10 percent cost reduction.

59
The expected long-run marginal cost based on CNG is significantly higher than LNG (see Table 27). This is largely due to the higher cost to transport CNG and related greater impact of falling econo-mies of scale to match the smaller markets in the region.
Table 27: CNG Delivered Natural Gas Long Run Marginal Cost of Power Generation (US$ Cents per kWh)
SOURCE COUNTRY
RE
CE
IVIN
G
CO
UN
TR
Y
POR
T
U. S
. SA
BIN
E P
ASS
U. S
. S.
FL
OR
IDA
ME
XIC
O
ALT
AM
IRA
TR
INID
AD
PO
INT
FO
RT
IN
VE
NE
ZU
EL
A
GU
IRIA
CO
LO
MB
IA
CO
VE
NA
PER
U
PER
U L
NG
Bahamas Nassau 10.12 10.29 9.99 10.39 10.41 10.15 11.54
Jamaica Old Harbour 10.30 10.57 10.17 10.16 10.16 9.79 11.24
Haiti Port-au-Prince 10.53 10.68 10.40 10.23 10.23 9.96 11.36
Dominican Republic
Andres LNG 10.65 10.92 10.51 9.93 9.93 9.93 11.47
Grenada St. George 20.84 19.57 20.79 14.81 14.81 17.24 23.60
St. Vincent & the Grenadines
Kingstown 20.85 19.32 20.80 15.04 15.04 17.33 23.69
Barbados Bridgetown 14.42 13.81 14.32 11.52 11.52 12.67 15.86
St. Lucia Castries City 17.56 16.19 17.49 13.46 13.47 15.04 19.56
Dominica Roseau 27.56 23.79 27.58 19.68 19.69 22.50 31.91
Antigua & Barbuda St. Johns 17.37 15.71 17.29 13.76 13.77 14.94 19.72
St. Kitts and Nevis Basseterre 17.27 15.61 17.19 13.85 13.85 14.84 19.61
Guyana Georgetown 14.86 14.74 14.76 11.61 11.64 13.05 16.30
Suriname Paramaribo 14.83 14.71 14.72 11.58 11.60 12.99 16.20

Pre-Feasibility Study of the Potential Market for Natural Gas as a Fuel for Power Generation in the Caribbean60
Long-run marginal costs based on CNG range between 10 and 20 US$ cents per kWh, with Peru deliveries to the smallest markets (Grenada, St. Vincent and the Grenadines, and Dominica) more expensive still. The higher average cost reduces the potential benefit of switching from fuel oil, as shown in Table 28.
Table 28: CNG Delivered Natural Gas Savings Compared to Fuel Oil (Percentage of Fuel Oil Long-Run Marginal Cost)
SOURCE COUNTRY
RE
CE
IVIN
G
CO
UN
TR
Y
POR
T
U. S
. SA
BIN
E P
ASS
U. S
. S.
FL
OR
IDA
ME
XIC
O
ALT
AM
IRA
TR
INID
AD
PO
INT
FO
RT
IN
VE
NE
ZU
EL
A
GU
IRIA
CO
LO
MB
IA
CO
VE
NA
PER
U
PER
U L
NG
Bahamas Nassau -35% -34% -36% -34% -33% -35% -26%
Jamaica Old Harbour -34% -32% -35% -35% -35% -37% -28%
Haiti Port-au-Prince -33% -32% -34% -35% -35% -36% -27%
Dominican Republic
Andres LNG -32% -30% -33% -37% -37% -37% -27%
Grenada St. George 33% 25% 33% -5% -5% 10% 51%
St. Vincent & the Grenadines
Kingstown 33% 23% 33% -4% -4% 11% 51%
Barbados Bridgetown -8% -12% -9% -26% -26% -19% 1%
St. Lucia Castries City 12% 3% 12% -14% -14% -4% 25%
Dominica Roseau 76% 52% 76% 26% 26% 44% 104%
Antigua & Barbuda St. Johns 11% 0% 10% -12% -12% -5% 26%
St. Kitts and Nevis Basseterre 10% 0% 10% -12% -11% -5% 25%
Guyana Georgetown -5% -6% -6% -26% -26% -17% 4%
Suriname Paramaribo -5% -6% -6% -26% -26% -17% 3%
Countries with larger markets and those the shortest distances from natural gas supply sources contin-ued to see substantial reductions in the long-run marginal cost of power, some on the order of 25 to 35 percent. Smaller markets and those farther away, however, would see a substantial cost increase if they were to switch to CNG – some by more than 50 percent.
Delivering natural gas via pipeline also resulted in a wide range of potential long-run marginal costs for power generation. The pipeline analysis is grouped into three regions – Western Caribbean, East-ern Caribbean, and Guyana-Suriname. For the Western Caribbean, Table 29 shows long-run margin-al costs ranging from just under 10 US$ cents per kWh to nearly 14.5 US$ cents per kWh.

61
Table 29: Pipeline Delivered Natural Gas Long Run Marginal Cost of Power Generation –Western Caribbean (US$ Cents per kWh)
RECEIVING COUNTRY
PORT S. FLORIDA - BAHAMAS
COLOMBIA - JAMAICA
COLOMBIA - HAITI
COLOMBIA - DOMINICAN REPUBLIC
DOMINICAN REPUBLIC - HAITI
Bahamas Nassau 11.09
Jamaica Old Harbour 11.88 10.70 9.78
Haiti Port-au-Prince
14.55 11.43 $10.29
Dominican Republic
Andres LNG 12.33
These price levels represent a savings versus fuel oil, although of only marginal value for Haiti in the Colombia-Haiti pipeline option (see Table 30). For most other markets in the region, the potential savings range from 20 to 40 percent.
Table 30: Pipeline Delivered Natural Gas Savings Compared to Fuel Oil - Western Caribbean (Percentage of Fuel Oil Long-Run Marginal Cost)
RECEIVING COUNTRY
PORT S. FLORIDA - BAHAMAS
COLOMBIA - JAMAICA
COLOMBIA - HAITI
COLOMBIA - DOMINICAN REPUBLIC
DOMINICAN REPUBLIC - HAITI
Bahamas Nassau -29%
Jamaica Old Harbour -24% -32% -37%
Haiti Port-au-Prince -7% -27% -18%
Dominican Republic
Andres LNG -21%

Pre-Feasibility Study of the Potential Market for Natural Gas as a Fuel for Power Generation in the Caribbean62
In the Eastern Caribbean, the range of price outcomes is even larger, given the greater number of markets and pipeline configurations that were examined. Long-run marginal cost of power genera-tion ranged from just over 8 US$ cents per kWh to nearly 22 US$ cents per kWh (see Table 31).
Table 31: Pipeline Delivered Natural Gas Long Run Marginal Cost of Power Generation – Eastern Caribbean (US$ Cents per kWh)
RECEIVING COUNTRY
PORT
TO
BA
GO
- B
AR
BA
DO
S
T&
T/V
Z -
ST
. LU
CIA
T&
T/V
Z -
ST
. LU
CIA
W/
BA
RB
AD
OS
T&
T/V
Z -
AN
TIG
UA
&
BA
RB
UD
A
T&
T/V
Z -
AN
TIQ
UA
&
BA
RB
UD
A W
/B
AR
BA
DO
S
T&
T/V
Z
- PU
ER
TO
R
ICO
T&
T/V
Z
- PU
ER
TO
R
ICO
W/
BA
RB
AD
OS
Grenada St. George 12.03 10.07 8.98 8.81 8.28 8.27
St. Vincent & the Grenadines
Kingstown 16.22 12.01 9.94 9.63 8.72 8.70
Barbados Bridgetown 13.47 16.26 13.87 12.94
St. Lucia Castries City 21.74 17.53 10.77 10.46 9.09 9.07
Dominica Roseau 12.26 11.96 9.69 9.67
Antigua & Barbuda St. Johns 18.08 17.77 10.48 10.46
St. Kitts and Nevis Basseterre 10.96 10.94
The calculated long-run marginal costs tend to be a significant discount from fuel oil for the earlier markets, but are less attractive the closer to the end of the pipeline (see Table 32).
Table 32: Pipeline Delivered Natural Gas Savings Compared to Fuel Oil - Eastern Caribbean (Percentage of Fuel Oil Long-Run Marginal Cost)
RECEIVING COUNTRY
PORT
TO
BA
GO
- B
AR
BA
DO
S
T&
T/V
Z -
ST
. LU
CIA
T&
T/V
Z -
ST
. LU
CIA
W/
BA
RB
AD
OS
T&
T/V
Z -
AN
TIG
UA
&
BA
RB
UD
A
T&
T/V
Z -
AN
TIQ
UA
&
BA
RB
UD
A W
/B
AR
BA
DO
S
T&
T/V
Z
- PU
ER
TO
R
ICO
T&
T/V
Z
- PU
ER
TO
R
ICO
W/B
AR
-B
AD
OS
Grenada St. George -23% -36% -43% -44% -47% -47%
St. Vincent & the Grenadines
Kingstown 4% -23% -36% -38% -44% -44%
Barbados Bridgetown -14% 4% -11% -17%
St. Lucia Castries City 39% 12% -31% -33% -42% -42%
Dominica Roseau -22% -24% -38% -38%
Antigua & Barbuda St. Johns 16% 14% -33% -33%
St. Kitts and Nevis Basseterre -30% -30%

63
Indeed, in all configurations except the extension to the region’s largest market (Puerto Rico), the last market in each pipeline would see higher power prices than with fuel oil at $80 per barrel.
A similar trend can be noted in the Guyana – Suriname pipeline configurations. The long-run mar-ginal power price is prohibitively expensive, except in Guyana if there is a continuation to Suriname (see Table 33).
Table 33: Pipeline Delivered Natural Gas Long Run Marginal Cost of Power Generation – Guyana-Suriname (US$ Cents per kWh)
RECEIVING COUNTRY
PORT TRINIDAD - GUYANA
VENEZUELA - GUYANA
TRINIDAD - SURINAME
VENEZUELA - SURINAME
Guyana Georgetown 22.03 22.79 14.90 15.28
Suriname Paramaribo 22.96 23.35
Even here, the savings versus power generated from fuel oil is marginal –expected to be a 5 percent reduction or less. Suriname’s long-run marginal cost, and Guyana’s without the extension, would be 40 to 50 percent more expensive than with fuel oil (see Table 34).
Table 34: Pipeline Delivered Natural Gas Savings Compared to Fuel Oil - Guyana-Suriname (Percentage of Fuel Oil Long-Run Marginal Cost)
RECEIVING COUNTRY
PORT TRINIDAD - GUYANA
VENEZUELA - GUYANA
TRINIDAD - SURINAME
VENEZUELA - SURINAME
Guyana Georgetown 41% 46% -5% -2%
Suriname Paramaribo 47% 49%
POTENTIAL BARRIERS TO INTRODUCING NATURAL GAS
Despite the potential economic benefits from bringing natural gas to the Caribbean region’s power sector, many barriers remain that may limit or delay natural gas import projects. The most important of these are discussed below.
HIGH CAPITAL COST AND REGIONAL DEBT LEVELS
All of the options analyzed in this report require large amounts of capital to implement. Financing these costs is a challenge for project developers and could place a substantial burden on the project’s host country as well. Many countries in the Caribbean carry significant amounts of debt. As a result, they are unable to provide sovereign guarantees to support infrastructure projects as large as those being proposed here.

Pre-Feasibility Study of the Potential Market for Natural Gas as a Fuel for Power Generation in the Caribbean64
CONFLICTING “BEST OPTION” AT THE COUNTRY LEVEL
Even under a purely economic assessment different options to bring natural gas are optimal for each country in the region. Smaller countries that are close to supply sources, such as Granada or St. Vincent and the Grenadines, benefit the most if they are part of a larger project (such as a regional pipeline). Larger countries, such as the Dominican Republic, do better if the natural gas is delivered directly to them via LNG or CNG. This inherent conflict in country-level economic interests suggests that it will be difficult to reach consensus on a region-wide project.
One option to overcome this difficulty would be agree on a fixed regional pricing scheme, such as a postage stamp tariff, that charges a similar price to all recipient markets regardless of size or position. This would tend to penalize countries closer to supply sources and subsidize those that are farther away, but could also help manage the large cost difference between larger and smaller markets. Such an approach could result in an overall average price that is still beneficial to all, but would require strong political support from all participants to be viable.
SOVEREIGNTY VS. REGIONAL COORDINATION
A related challenge to a more coordinated approach is the implicit requirement that each country that participates in a regional project cede substantial control over their energy supply. For example, the options involving a region-wide pipeline would require coordination and cooperation across all countries along its path, potentially requiring a treaty-level agreement. Countries along the pipeline’s route could potentially disrupt the flow of natural gas, leaving each country at the mercy of the coun-tries before it. For example, disputes between Russia and Ukraine regarding natural gas prices and payments have at times curtailed Russian natural gas supply to Europe that is delivered via Ukraine. Such dependence could be politically infeasible for many countries, particularly among those with a history of conflict or mistrust.
While there are certainly many examples in other sectors where international norms and operations are managed effectively (air traffic control, for example), the perceived benefits must clearly outweigh the perceived costs for such an arrangement to be sustainable. In addition, the Caribbean region already has a number of regional bodies including the Caribbean Community (CARICOM) and the Caribbean Electric Utility Services Corporation (CARILEC) that help coordinate member govern-ment policy and regional cooperation.
Even so, without a concerted effort from regional institutions or interested outside stakeholders, coun-try-level options would be the quickest route to bringing natural gas to the region. In this way, each country would be able to move at its own pace and focus on its own interests, with minimal coordina-tion with its neighbors.

65
SUPPLY SIDE CONSTRAINTS
The countries of the Caribbean may also face challenges in securing natural gas supply, despite being surrounded by many gas-exporting countries. Currently, only Trinidad and Peru have the required export facilities to send natural gas to the region in significant volumes (via LNG). The United States exports very small amounts of natural gas via container-sized LNG tanks, but these facilities are in-sufficient to support power generation with natural gas. Other countries are developing LNG export capacity, but such projects are large, capital intensive, and are often delayed. CNG export facilities can be built more quickly and at lower cost, but CNG shipping faces much higher technical and cost uncertainty creating a potential bottleneck or delay for CNG based projects. Pipelines face much lower technical uncertainty, but face higher regulatory uncertainty as the rights to build the pipeline must be secured for the entire length of the proposed path, potentially involving dozens of different governments and land owners.
The Caribbean region’s lack of scale may also be a challenge. The region’s natural gas demand is expected to be on the order of 1 Bcf per day in 2020. This is small relative to many global markets, but substantial enough to interest a project developer. However, more than half of this volume is ex-pected to come from the Dominican Republic, which already has an LNG import terminal, and the Dominican Republic and Jamaica together account for three-quarters of the total. Major suppliers such as Atlantic LNG in Trinidad and exporters in the United States may prefer to focus on larger, more lucrative markets. The rapidly growing markets in Asia in particular currently pay a large pre-mium above U.S. natural gas price levels. Other exporters may be constrained to only contract LNG supplies with their shareholders’ subsidiaries, limiting Caribbean access.
MARKET STRUCTURE DISPARITIES
Each country has its own power market structure, ranging from vertically integrated utilities to the more fragmented and market-based power market in the Dominican Republic. Confidential long-term contracts between generators and off-takers can vary dramatically from prevailing spot market prices, making it difficult for new generators to enter the market and compete effectively. In a similar way, contracts between fuel suppliers and power generators can vary from prevailing global fuel mar-kets (a prominent example are the favorable financing terms the Venezuela provides to members of its PetroCaribe program).
Power market participants across the region include state-owned entities, large multi-national foreign investors, and local private companies, each bringing their own set of priorities, perspectives and criteria for success. Disparities in market size, degree of competition and market power concentra-tion across the countries also influence company strategy, investment and pricing dynamics. These structural differences can make it very difficult to coordinate operations across the region and greatly complicates the creation of a regional natural gas market.

Pre-Feasibility Study of the Potential Market for Natural Gas as a Fuel for Power Generation in the Caribbean66
REGULATORY AND LEGAL FRAMEWORK
Importing natural gas would require the development of a regional legal framework, regulations, and institutional structure for the new fuel and related industry. For pipelines that connect multiple countries, operational agreements would also be needed to protect and manage the interests of all countries involved. Central America’s experience in developing SIEPAC suggests that creating a re-gion-wide legal system from the outset can facilitate energy integration and cross-border trade, but can also be a long and difficult process. Focusing instead on country-level institutions and rules can allow each country to move at its own pace.
From a private investor’s perspective, a project that deals with a single political and regulatory jurisdiction is far less complicated than one that involves multiple countries. Few natural gas pipelines cross more than one international border today—the European pipeline system and the network in the former Soviet Union are among the few examples, each of which benefited from a high degree of regional political cooperation before they were built—making a region-wide Caribbean pipeline a relatively unique project. This greater degree of uncertainty and risk may reduce private sector interest in the project. It may also lead project participants to require higher than expected returns on their investment or greater multi-lateral guarantees than similar proj-ects involving just one or two countries.
CONCLUSIONS
Importing natural gas to the Caribbean for power generation will lower the cost to generate electricity, dramatically reduce oil product imports, and cut air pollution. Despite these benefits, many challeng-es must be overcome to bring natural gas to the region. The optimal import method or gas market structure must also be determined. This study has highlighted a number of insights as well as critical issues that Caribbean nations face.
• LNG appears to be the safest technology choice for individual markets. For the Caribbean markets, seaborne CNG does not appear to provide a large enough cost reduction to justify the added risk of using an unproven technology. Even so, there is great uncertainty about the costs of smaller-scale LNG ships and regasification terminals. The specific circumstances and choices made during project development may also increase the cost to bring natural gas beyond the rough estimates made in this study.
• Pipelines are most effective when anchored by a large market at the pipe terminus. Smaller markets along a pipeline pathway benefited from greatly reduced cost of natural gas, but only if the final market was large enough. Because the price may be less competitive at the end of the pipeline, and it is desirable to attract as great a demand in the terminal market as possible, regional pipelines may benefit from cost-sharing mechanisms that spreads the cost more evenly across markets. Involving

67
multiple countries along the route can reduce prices, but also increasing the complexity of completing the project as well as the political risk facing the project investors. A substantial and sustained regional political initiative would be needed to make such a project a reality.
• All but the smallest markets would benefit from natural gas. While some deliv-ery options resulted in lower natural gas prices than others, virtually all showed a significant reduction from the cost of using fuel oil. The major exception was the smallest markets in the region, particularly Dominica, which needed to be part of a larger regional project to be able to secure natural gas at a reasonable price. This suggests that for most countries in the region, whichever course allows natural gas imports to begin the soonest would bring the greatest benefit. It also suggests that non-economic factors will likely play an important role in the final decision as multiple technologies and import configurations provide a benefit over the current situation.
• For consumers, the ability to contract will be the main test. There was relative-ly little variation in the cost to transport LNG or CNG from all but one of the six source countries in the study. Each option—with the exception of Peru—lie within a narrow range of distances from the market. With a limited transportation price difference, other factors such as the timing of export infrastructure and the exporter’s willingness to contract with Caribbean importers become more important. Securing a favorable supply contract may be particularly difficult, as suppliers may have ongoing relationships or expectations to serve other, more lucrative, markets.
• For suppliers, the first mover will likely have the advantage. The narrow range in delivered cost of gas across the five closest supply sources suggests that no single supplier enjoys an insurmountable advantage over the others. As a result, the supplier who is able to first reach the market and secure contracts would face limited pressure from competitors. In addition, the region’s small market size limit its ability to diversify across multiple suppliers. Therefore, countries with existing infrastructure, such as Trinidad and the United States, may have an advantage.

Pre-Feasibility Study of the Potential Market for Natural Gas as a Fuel for Power Generation in the Caribbean68

SECTION
B

Guyana
Jamaica Haiti
Dominican Republic
The Bahamas
Suriname
Puerto Rico
Saint Kitts and Nevis
Antigua and Barbuda
Trinidad and Tobago
Barbados
Dominica
Saint Lucia
Saint Vincent and the Grenadines
Grenada
COUNTRY: Peak Demand (in MW), Diesel-Fired Plant Intalled Capacity (in % of Total Installed Capacity)
Source: Antigua and Barbuda: Draft National Energy Policy 2010; Bahamas: Emera 2011 Annual Report,CARICOM study by C. Wilson and T. Byer, 2009-2010, National Energy Policy 2010, BEC website, GBPC website; BARBADOS: BLPC 2012 Annual Report, Sustainable Energy Framework for Barbados, 2010;Dominica: DOMLEC 2012 Annual Report; Dominican Republic: Nexant, “Caribbean Regional Elec-tricity Generation, Interconnection, and Fuels Supply Strategy” 2010 (‘2010 Nexant Report’), CNE Tablas Memoria2011 Operaciones; Grenada: GRENLEC 2012 Annual Report; Guyana: ‘GPL in Perspective, May 2012’, GPL 013 RFP Terms of Reference—Design of GPL’s Management Strengthening Program’; Jamaica: 2010 Nexant Haiti; Nevis: 2011 RFP Terms of Reference—Power Interconnection Pre-Feasibility Study between St. Kitts and Nevis and Puerto Rico, NEVLEC website, “Nevis Geothermal Project and Power Take-off” presentation by NEVLEC General Manager Cartwright Farrell, 2012; St. Kitts: 2013 RFP Terms of Reference—Renewable Energy Infusion Study; St. Lucia: LUCELEC 2012 Annual Report; St. Vin-cent and the Grenadines: VINLEC2011 Annual Report, data received from a VINLEC representative (Mr. Sheon John) on 28 August 2013; Suriname: Presentation at 2010 CARILEC Engineering Conference (S. Mehairjan and R. Mehairjan), REEEP Policy Database, U.S. Energy Information Administration (EIA); Trinidad and Tobago: T&TEC 20112016 Business Plan, Trinidad and Tobago Ministry of Energy website
Figure 1.1: Map of Countries in this Study MW Fuel Oil
The Bahamas 318.1 100.0Jamaica 680.0 94.7Haiti 226.0 79.5Dominican Republic 2353.0 52.6Puerto RicoSaint Kitts and Nevis 33.0 96.2Antigua and Barbuda 17.2 75.3Dominica 17.2 75.3Saint Lucia 59.8 100.0Barbados 157.4 100.0Saint Vincent and the Grenadines
25.7 88.1
Grenada 29.2 100.0Trinidad and Tobago 1121.0 0.9Guyana 100.0 100.0Suriname 264.0 49.3

71
Guyana
Jamaica Haiti
Dominican Republic
The Bahamas
Suriname
Puerto Rico
Saint Kitts and Nevis
Antigua and Barbuda
Trinidad and Tobago
Barbados
Dominica
Saint Lucia
Saint Vincent and the Grenadines
Grenada
COUNTRY: Peak Demand (in MW), Diesel-Fired Plant Intalled Capacity (in % of Total Installed Capacity)
INTRODUCTION
The fourteen participating countries in this section are Antigua and Barbuda, the Bahamas, Barba-dos, Dominica, the Dominican Republic, Grenada, Guyana, Jamaica, Haiti, St. Kitts and Nevis, St. Lucia, St. Vincent and the Grenadines, Suriname and Trinidad and Tobago. This work has been carried out concurrently with Section A, a technical feasibility analysis of implementing a natural gas supply system in the Caribbean.
OBJECTIVES OF THIS ASSIGNMENT
The objective of this assignment is to assess the potential impact of switching to natural gas to gen-erate electricity in the Caribbean and the resulting implications of implementing renewable energy technologies and energy efficiency measures. Technology advancements in hydrocarbon extraction have led to an abundance of cheap natural gas in the market. Governments, businesses, and citizens of the Caribbean will all benefit if policymakers and development banks can determine how to best exploit this opportunity. This study will help determine the feasibility of transitioning to natural gas as the main source of fuel for generating electricity in the Caribbean.
The objective of this report is to build on the conclusions presented in Section A in order to demon-strate the impact that natural gas will have in the Caribbean. Particularly, we show how switching to natural gas would reduce the costs utilities incur, and, subsequently the prices customers pay (if cost savings are passed on to customers). Also, we show how the use of natural gas would affect the viability of some RE and EE technologies. Lastly, we present the cost and benefits of three scenarios where alternative sources are used to generate electricity. These scenarios show that greater benefits can be derived from reducing the dependence on fuel oil, whether it is by increasing the use of RE and EE technologies or by replacing the generation of electricity from fuel oil with natural gas.
OVERVIEW OF THE ELECTRICITY SYSTEMS IN THE CARIBBEAN
Due to limited hydrocarbon resources in the Caribbean, most countries in the region import fuel oil and diesel to generate electricity to meet customer demand. The high and volatile prices of these imported liquid fuels can be seen in that electricity prices in the Caribbean are among the highest in the Americas. One reason why prices are so high is because the high fuel costs are passed on to cus-tomers in the form of high electricity bills. These bills account for a significant portion of customers’ household income.

Pre-Feasibility Study of the Potential Market for Natural Gas as a Fuel for Power Generation in the Caribbean72
Figure 1.1 shows a map of the countries included in this study. The map also shows the peak demand for each country and the percentage of installed capacity that uses fuel oil. The figure shows that the electricity systems in these countries have peak demands that range from about 17MW (Dominica) to over 2,353MW (Dominican Republic). The figure also shows that most countries in the Caribbean run on diesel-fired, iso-lated systems, with the exception of Trinidad and Tobago, which has an abundance of natural gas reserves. In 11 of these countries, diesel-fired plants account for over 75 percent of total installed capacity.
Table 1.1 presents an overview of the countries and electricity systems in this study. The table is sorted from lowest to highest peak demand. The table also provides data on population size, GDP per capita, and key statistics about the electricity systems of each country.
Table 1.1: Overview of the Electricity Systems in the Caribbean
COUNTRY POPULATION GDP PER CAPITA(US$)
PEAK DEMAND(MW)
INSTALLED GENERATION CAPACITY (MW)
INSTALLED DIESEL-FIRED CAPACITY (MW)
GROSS GENERATION (GWh)
Dominica 71,684 6,691 17.2 26.7 20.1 102
St. Vincent and the Grenadines
109,373 6,515 25.7 53.0 47.2 141
Grenada 105,483 7,485 29.2 48.6 48.6 193
St. Kitts and Nevis
53,584 13,969 33.0 57.5 55.3 200
Antigua and Barbuda
86,069 13,207 50.0 83.0 83.0 326
St. Lucia 180,870 6,558 59.8 88.6 88.6 370
Guyana 795,369 3,584 100.0 148.0 148.0 653
Barbados 283,221 13,076 157.4 274.0 274.0 1,024
Haiti 10,173,775 771 226.0 296.6 235.8 1,033
Suriname 534,541 8,864 264.0 355.0 175.0 1,570
Bahamas 371,960 21,908 318.1 575.0 575.0 2,075
Jamaica 2,712,100 5,472 680.0 820.0 776.3 4,136
Trinidad and Tobago
1,337,439 17,934 1,121.0 2,350.0 21.0 7,998
Dominican Republic
10,276,621 5,736 2,353.0 3,004.6 1,579.3 13,086
Sources: World Bank – World Development Indicators; Annual Reports for BEC (2010),
BLPC (2012), DOMLEC (2012), GBPC (2011), GRENLEC (2012), JPS (2012), LUCELEC (2012), VINLEC (2011); Business Plan for Trinidad and Tobago (2011-2016); National Energy Policies and Action Plans for Antigua and Barbuda (2010),
Bahamas (2010), Nevis (2010), St. Kitts (2010), and St. Vincent and the Grenadines (2010); government statistics for the Dominican Republic (Electricity Superintendents, 2006); utility websites of GBPC, BEC, JPS,
T&TEC, and NEVLEC; presentations by CARICOM (Wilson and Byer, 2009), CARILEC (Mehairjan and Mehairjan, 2010), GPL (‘GPL in Perspective’, 2012), EDH (Action Plan, 2012-2013), and NEVLEC (‘Power Take-off’ by Cartwright Farrell, 2012); reports by the World Bank (Krishnaswamy and Stuggins, 2007), Nexant
(‘Caribbean Regional Electricity Generation, Interconnection, and Fuels Supply Strategy’, 2010); Terms of Reference for NEVLEC (‘Power Interconnection Pre-Feasibility Study’, 2011), SKELEC (Renewable Energy
Infusion Study, 2013); the Renewable Energy & Energy Efficiency Partnership (REEEP) database; and data from the U.S. Energy Information Administration

73
Regarding RE, some countries are already generating electricity with RE; for example, Dominica (hydro), the Dominican Republic (hydro and wind), Jamaica (hydro and wind), Haiti (hydro), St. Vin-cent and the Grenadines (hydro and solar), and Suriname (hydro). However, there is still potential to develop these technologies further and increase their use in Caribbean countries. For example, there is high potential to generate electricity based on geothermal sources, in Dominica, Grenada and Nevis. Also, nearly all of the countries have the potential to generate electricity based on wind and solar PV.
Additionally, there are many opportunities to increase energy efficiency in the Caribbean. Economi-cally-viable EE technologies can provide significant cost savings.
STRUCTURE OF THIS REPORT
To meet the objectives of this assignment, we have structured this report in the following way:
• In Section 2, we provide an overview of the current state of the electricity sector in the Caribbean. We do this by presenting current tariffs and costs of service. We also present the RE and EE technologies that are viable in the current scenario where fuel oil is used in most countries in this study as the main source of generation.
• In Section 3, we illustrate the impact that natural gas would have on the electricity sector in the Caribbean. Specifically, we assume that all electricity that is currently generated based with fuel oil would be generated with natural gas. In order to directly compare the potential use of natural gas as the main source of energy generation with the use of fuel oil, we show what the tariffs and costs of service would be if natural gas were introduced. Additionally, we show how the introduction of natural gas would affect the viability of some RE and EE technologies.
• In Section 4, we carry out a cost benefit analysis that shows that greater benefits can be derived by reducing the dependence on fuel oil. We present three possible scenarios as a substitute to the current (business as usual) scenario, all of which have greater net benefits. These scenarios are:
– Scenario 1: Using liquid fuel in conjunction with RE and EE technologies
– Scenario 2: Introducing natural gas (replacing liquid fuels) and using it in conjunction with RE and EE technologies
– Scenario 3: Introducing natural gas (replacing liquid fuels)

Pre-Feasibility Study of the Potential Market for Natural Gas as a Fuel for Power Generation in the Caribbean74
CURRENT DEPENDENCE ON FUEL OIL HAS LED TO HIGH COSTS AND PRICES IN THE CARIBBEAN
The high and volatile price of electricity is the most important issue in the Caribbean energy sector. Electricity prices in the Caribbean are among the highest in the world, and they fluctuate greatly with the global price of oil. The primary cause of the high cost of electricity is that most Caribbean coun-tries use diesel and heavy fuel oil for electricity generation. These fuels are expensive and their prices fluctuate greatly based on the global price of oil.
Figure 2.1 compares the average cost of service of five utilities in the Caribbean with the average tariff for each utility. The figure shows that for these five utilities, fuel costs account for the highest portion of the cost of service. The figure also shows that all utilities have costs of service and average tariffs above 30.0 US$ cents per kWh sold. These are very high costs and prices.
Figure 2.1: Cost of Service v Tariffs for Some Utilities in the Caribbean, 2012
0,22 0,25 0,23 0,23 0,21
0,060,08
0,060,12 0,12
0,31
0,36 0,370,41 0,41
0,00
0,05
0,10
0,15
0,20
0,25
0,30
0,35
0,40
0,45
Barbados… Jamaica … St. Lucia … Grenada… Dominica…
US$/
kWh
Sold
Dividends
Taxes
Interest
D&A
Non-Fuel OpEx
Fuel Cost
Total Cost(in US$/kWh)
Source: 2012 Annual Reports for BLPC, JPS, LUCELEC, GRENLEC, and DOMLEC
Since electricity prices are high in the Caribbean, the introduction of some RE and EE technologies can help reduce the cost of generating electricity. This is true for the technologies that have a lower long run marginal cost (LRMC) than that of fuel fired plants, because a lower LRMC means that the cost of producing electricity will be lower too.
In this section, we analyze the average tariffs and average costs of electricity for each of the countries in this study. Additionally, we analyze the economic and commercial viability of a range of RE and EE technologies for the countries in this study. We show that:

75
• Average retail electricity tariffs are high in most Caribbean countries (Section 2.1)
• High tariffs are mainly due to the high percentage of electricity that is generated with fuel oil (Section 2.2)
• Introducing RE and EE in current generation matrix can help reduce the cost of electricity (section 2.3)
We explain each of these points below.
AVERAGE RETAIL TARIFFS ARE HIGH IN MOST CARIBBEAN COUNTRIES
In this section, we present the average tariffs for customers, the price of electricity for different cus-tomer categories, and the structure of these tariffs. Based on this information, we find that: average retail tariffs are high (section 2.1.1); tariffs are high for all customer categories (section 2.1.2); and most electricity utilities have fuel pass-through provisions in their tariff structures (section 2.1.3).
AVERAGE RETAIL TARIFFS ARE HIGH
In 2012, the average tariff for 10 utilities in the Caribbean was 33.0 US$ cents per kWh. This average tariff is high when compared to countries in other regions. Figure 2.2 shows the average tariff for 10 utilities in the countries in the study. The figure shows that 7 out of the 10 utilities have average tariffs above 30.0 US$ cents per kWh. Furthermore, the utilities with tariffs lower than 30.0 US$ cents per kWh are the three utilities in the Dominican Republic (we mention why in later sections). This figure also shows that the countries with the highest average tariffs are Antigua and Barbuda, and Dominica, which have among the smallest systems (Peak demands of 50MW and 17MW respectively).

Pre-Feasibility Study of the Potential Market for Natural Gas as a Fuel for Power Generation in the Caribbean76
Figure 2.2: Average Retail Tariffs per Utility (2012)
$0,20 $0,20$0,22
$0,32$0,36 $0,38 $0,38
$0,40$0,43 $0,43
$0,00
$0,05
$0,10
$0,15
$0,20
$0,25
$0,30
$0,35
$0,40
$0,45
$0,50
EDEESTE(Dominican Republic)
EDENORTE(Dominican Republic)
EDESUR(Dominican Republic)
BLPC(Barbados)
JPS(Jamaica)
LUCELEC(St. Lucia)
EDH(Haiti)
GRENLEC(Grenada)
APUA(Antigua
and Barbuda)
DOMLEC(Dominica)
US$/
kWh
Source: 2012 Annual Reports for BLPC, JPS, LUCELEC, GRENLEC, and DOMLEC, data from EDH website, and published figures by APUA and Corporación Dominicana de Empresas Eléctricas Estatales (CDEEE) for EDEESTE, EDENORTE, and EDESUR
Not only is the average of the average tariffs for 2012 particularly high, but this average has risen each year for the past two years. In 2011, the average of the average tariffs was 31.0 US$ cents per kWh, and in 2010 it was 27.0 US$ cents per kWh. Table 2.1 shows average tariffs for 2010, 2011, and 2012 for the utilities in all countries in this study. The table shows that Trinidad and Tobago and Surina-me had the lowest average tariffs (in 2011), followed by the Dominican Republic (in 2010, 2011 and 2012). The table also shows that all other countries have significantly higher average tariffs, at levels above 30.0 US$ cents per kWh.

77
Table 2.1: Average Retails Tariffs per Utility (2010-2012)
COUNTRY UTILITY AVERAGE TARIFF(2012)
AVERAGE TARIFF(2011)
AVERAGE TARIFF(2010)
Antigua and Barbuda APUA $0.43 - -
Bahamas BEC - - $0.26
Barbados BLPC $0.32 $0.33 $0.26
Dominica DOMLEC $0.43 $0.41 $0.38
Dominican Republic EDEESTE $0.20 $0.20 $0.17
Dominican Republic EDENORTE $0.20 $0.20 $0.18
Dominican Republic EDESUR $0.22 $0.22 $0.20
Grenada GRENLEC $0.40 $0.39 $0.33
Guyana GPL - $0.32 -
Jamaica JPS $0.36 - -
Haiti EDH $0.38 - -
St. Lucia LUCELEC $0.38 $0.36 $0.31
St. Vincent and the Grenadines VINLEC - $0.36 $0.33
Suriname EBS - $0.05 -
Trinidad and Tobago T&TEC - $0.06 $0.05
Average $0.33 $0.31* $0.27*
Note: The Averages of “Average Tariff (2010)” and “Average Tariff (2011)” do not include the figures for Suriname and Trinidad and Tobago because they would make the average incomparable to “Average Tariff (2012)”, which does not have data for Suriname and Trinidad and Tobago
Source: 2012 Annual Reports for BLPC, DOMLEC, GRENLEC, JPS, and LUCELEC; 2011 Annual Reports for BLPC, DOMLEC, GRENLEC, LUCELEC, and VINLEC, 2010 Annual Reports or Business Plans for BEC, BLPC, DOMLEC, GRENLEC, LUCELEC, VINLEC, and T&TEC; published figures by Corporacion Dominicana de Empresas Electricas Estatales (CDEEE) for EDEESTE, EDENORTE, and EDESUR, and the Ministry of Trade & Industry for EBS; and figures from utility websites for EDH and APUA

Pre-Feasibility Study of the Potential Market for Natural Gas as a Fuel for Power Generation in the Caribbean78
TARIFFS ARE HIGH FOR ALL CUSTOMER CATEGORIES
The high average retail tariffs have an impact on all customer categories. High tariffs impact resi-dential customers in that households spend more on electricity bills as a percentage of gross national income (GNI) than electricity customers in other countries. Commercial customers have high elec-tricity costs which are passed on to consumers as higher costs of goods and services. Lastly, industrial customers are affected by high retail tariffs because it increases their production costs, and can make their products less competitive than imported products.
Figure 2.3 compares average residential, commercial, and industrial tariffs. The figure shows that, even though residential average tariffs tend to be lower than those for other customer categories, average tariffs are high for all customer categories.
Figure 2.3: Average Residential, Commercial, and Industrial Tariffs per Utility (US$ per kWh)
$ 0,03
$ 0,34 $ 0,34$ 0,35 $ 0,36 $ 0,37 $ 0,38 $ 0,38
$ 0,42 $ 0,42$ 0,44
$ 0,04
$ 0,39$ 0,35
$ 0,40
$ 0,44
$ 0,40 $ 0,40$ 0,42
$ 0,42$ 0,47
$ 0,05
$ 0,39$ 0,40
$ 0,44
$ 0,35
$ 0,39$ 0,41
$ 0,00
$ 0,05
$ 0,10
$ 0,15
$ 0,20
$ 0,25
$ 0,30
$ 0,35
$ 0,40
$ 0,45
$ 0,50
in U
S$
ResidentialCommericalIndustrial
Source: Average tariffs were calculated by taking the average monthly bills calculated for the different customer types and dividing by the average monthly usage in the Caribbean by customer type for each utility
Figure 2.4 shows the average electricity bill for residential customers that consume 161kWh per month. The figure also shows the percent of GNI per capita that is used to pay these bills. It appears that, on average, households spend around 6 percent of their income on electricity bills. The figure also shows that in countries like St. Vincent and the Grenadines, and Grenada, residential customers spend around 8 percent of their income in electricity bills.

79
Figure 2.4: Average Monthly Bills for Households
$ 4,29
$ 54,04 $ 54,64 $ 56,98 $ 58,27 $ 59,75 $ 61,50 $ 61,67$ 67,03 $ 68,25
$ 71,62
$ 0,00
$ 10,00
$ 20,00
$ 30,00
$ 40,00
$ 50,00
$ 60,00
$ 70,00
$ 80,00
Trinidad and Tobago(T&TEC)
St. Lucia(LUCELEC)
Bahamas(GBPC)
St. Kitts(SKELEC)
Jamaica(JPS)
Barbados(BLPC)
Nevis(NEVLEC)
Bahamas(BEC)
Antigua and Barbuda(APUA)
Grenada(GRENLEC)
St. Vincent and the
Grenadines(VINLEC)
in U
S$
0,2%
4,0% 4,2% 4,3%
5,9%
8,0% 8,0%
0%
1%
2%
3%
4%
5%
6%
7%
8%
9%
Trinidad and Tobago(T&TEC)
St. Kitts(SKELEC)
Antigua and Barbuda(APUA)
Nevis(NEVLEC)
St. Lucia(LUCELEC)
St. Vincent and the Grenadines
(VINLEC)
Grenada(GRENLEC)
Note: Assumes average monthly consumption of 161 kWh in the Caribbean. This is based on the average monthly consumption of residents in Barbados, Dominica, Grenada, Jamaica, St. Lucia, and St. Vincent and the Grenadines
Trinidad and Tobago does not charge its customers a fuel surcharge, and domestically-produced natural gas fuels most of its electricity generation.
Source: 2012 Annual Reports of Barbados, Dominica, Grenada, Jamaica, and St. Lucia; 2011 Annual Report of St. Vincent and the Grenadines; tariff structures from utility websites. World Bank Development Indicators—GNI per capita (PPP); tariff structures from utility websites; average monthly household bill based off average con-sumption of residents in Barbados, Dominica, Grenada, Jamaica, St. Lucia, and St. Vincent and the Grenadines in as reported in 2012 Annual Reports (2011 Annual Report for St. Vincent and Grenadines – VINLEC)
MOST TARIFF STRUCTURES HAVE A FUEL PASS-THROUGH
Tariffs in the Caribbean are not only high, they are also volatile. The reason is that most utilities—the exceptions being utilities in Trinidad and Tobago, the Dominican Republic, and Haiti—are allowed to pass on fuel costs to their customers. Furthermore, because most of these utilities generate a large portion of the electricity with fuel oil (which has high and volatile prices), the fuel surcharge compo-nent of electricity bills can constitute high portions of the customer’s bills, and can vary considerably during the year. Table 2.2 shows the tariff structure for residential customers of utilities in the Carib-bean. The table shows that 11 out of the 14 utilities have fuel surcharges.

Pre-Feasibility Study of the Potential Market for Natural Gas as a Fuel for Power Generation in the Caribbean80
Table 2.2: Tariff Structure of Residential Customers Countries (USD)
COUNTRY (UTILITY)
FIXED CHARGE VARIABLE CHARGE—NON-FUEL
FUEL SURCHARGE (MONTH, YEAR)
VAT
Antigua and Barbuda (APUA)
- 0-300kWh: $0.15/kWh>300kWh: $0.14/kWh(Minimum charge: $9.20)
$0.27/kWh(August 2013)
-
Bahamas (BEC) - 0-200 kWh: $0.11/kWh201-800 kWh: $0.12/kWh800+ kWh: $0.15/kWh(Minimum charge: $5.00)
$0.27/kWh(August 2013)
-
Bahamas (GBPC) - 0-350kWh: $0.18/kWh351-800kWh: $0.21>800kWh: $0.25(Minimum charge: $10.00)
$0.16/kWh(August 2013)
-
Barbados (BLPC) 0-150kWh: $3.00151-500kWh: $5.00>500kWh: $7.00
0-150kWh: $0.08/kWh151-500kWh: $0.09/kWh501-1500kWh: $0.10/kWh>1500kWh: $0.11/kWh
$0.21/kWh(August 2013)
17.5%
Dominican Republic (EDEESTE) 1
0-100kWh: $1.13>101kWh: $4.07
0-200kWh: $0.27201-300kWh: $0.27301-700kWh: $0.34>700kWh: $0.34
NA NA
Grenada (GRENLEC) 0-99kWh: $099-149kWh: $1.84>150kWh: $3.68
$0.15/kWh(Minimum charge: $1.47)
$0.24/kWh(August 2013)
15% (non-fuel charge)
Guyana (GPL) NA 0-75kWh: $0.24/kWh>75kWh: $0.27/kWh
NA NA
Jamaica (JPS) $3.93 0-100kWh: $0.07/kWh>100kwh: $0.16/kWh
$0.23/kWh(August 2013)
-
Haiti (EDH) - 0-30kWh: $0.11/kWh31-200kWh: $0.12/kWh>201kWh: $0.29/kWh
NA 12%
St. Kitts (SKELEC) 2 $4.79 $0.22/kWh $0.11/kWh(August 2013)
-
Nevis (NEVLEC) 0-120kWh: $2.65121-250kWh: $4.42>250kWh: $6.63
0-50kWh: $0.19/kWh51-125kWh: $0.18/kWh>125kWh: $0.17/kWh
$0.12/kWh(July 2013)
17%
St. Lucia (LUCELEC) - 0-180kWh: $0.32/kWh>181kWh: $0.34/kWh(minimum charge: $1.84)
$0.02/kWh(January 2013)
-
St. Vincent and the Grenadines (VINLEC)
- 0-50kWh: $0.16/kWh>50kWh: $0.18/kWh(Minimum charge: $3.31)
$0.20/kWh(August 2013)
15%*
Trinidad and Tobago (T&TEC)
$0.47 0-200kWh: $0.02/kWh201-500kWh: $0.02/kWh>500kWh: $0.03/kWh
- 15%
*Only applied if more than 200kWh used/monthSource: Utility websites and directly from utility representatives of JPS, VINLEC, and T&TECExchange rates: USD/XCD: 0.3681, USD/BBD: 0.5, USD/JMD: 0.01015, USD/HTG: 0.0231, USD/BSD: 1.0, USD/TTD: 0.15577, USD/DOP: 0.0247, USD/GYD: 0.005, USD/SRD: 0.3054
1 The government provides a subsidy to the rates that customers pay, however, these are the unsubsidized rates2 Customers who use less than 200kWh/month receive a subsidy: 50% off their non-fuel variable charge and 100% off their fuel surcharge

81
Table 2.2 shows that fuel surcharges tend to be higher than the non-fuel variable charges. For ex-ample, for APUA the fuel surcharge ($0.27 per kWh) is 80 percent higher than the non-fuel variable charge for the first customer band ($0.13 per kWh). For BLPC, the fuel surcharge ($0.21 per kWh) is 163 percent higher than the non-fuel variable charge for the first customer band ($0.08 per kWh).
Figure 2.5 compares the fuel surcharge as a percentage of the non-fuel variable charge for the first customer band of nine utilities. In 6 of these utilities, the fuel surcharge is more than 100 percent higher—between 129 percent and 227 percent—than the non-fuel variable charge for the first cus-tomer band. Though this calculation is dependent on the tariff structure for each utility, the calcula-tion captures that the fact that the majority of the variable charge that customers pay for per kWh consumed is the fuel price.
Figure 2.5: Fuel surcharge as a % of non-fuel variable charge for first customer band
6%
50%63%
89%
125%
160%180%
245%263%
329%
$0,02
$0,11 $0,12
$0,16
$0,20
$0,24
$ 0,27 $0,27
$0,21$0,23
$0,00
$0,05
$0,10
$0,15
$0,20
$0,25
$0,30
0%
50%
100%
150%
200%
250%
300%
350%
LUCELEC(St. Lucia)
SKELEC(St. Kitts)
NEVLEC(Nevis)
GBPC(Bahamas)
VINLEC(St. Vincent
and the Grenadines)
GRENLEC(Grenada)
APUA(Antigua and
Barbuda)
BEC(Bahamas)
BLPC(Barbados)
JPS(Jamaica)
Fuel
surc
harg
e (US
$/kw
h)
-
-
Fuel surcharge/Variable non-fuel charge of �rst band
Fuel surcharge
Fuel
surc
harg
e as %
of
varia
ble
non
fuel
char
ge fo
r �r
st cu
stom
er ba
nd
Note: Fuel surcharge for each utility is from July or August 2013. The percent is calculated based on the tariff structure for each utility.

Pre-Feasibility Study of the Potential Market for Natural Gas as a Fuel for Power Generation in the Caribbean82
In nominal terms, the average fuel surcharge for the nine utilities in Figure 2.5 for July and August 2013 is 18.0 US$ cents per kWh. The fuel surcharge varies greatly for each utility, between 2.0 US$ cents per kWh for LUCELEC and 27.0 US$ cents per kWh for APUA and BEC. Further, Figure 2.6 shows that the fuel surcharge makes up a large portion of the average tariffs, for utilities that have a fuel surcharge.
Figure 2.6: Fuel surcharge as a percent of average tariff
$0,2 $0,2
$0,0
$0,2 $0,3
$0,20 $0,20 $0,22
$0,32$0,36 $0,38 $0,38
$0,40$0,43 $0,43
$0,0$0,1$0,1$0,2$0,2$0,3$0,3$0,4$0,4$0,5
EDEESTE(Dominican
Republic)(Dominican
Republic)
EDENORTE EDESUR(Dominican
Republic)
BLPC(Barbados)
JPS(Jamaica)
LUCELEC(St. Lucia)
EDH(Haiti)
GRENLEC(Grenada)
APUA(Antigua
and Barbuda)
DOMLEC(Dominica)
US$/
kWh
Fuel surcharge Average Retail Tari� minus f uel surcharge Average Retail Tari�
Source: Average retail tariffs for each utility was calculated based on the following sources: 2012 Annual Reports for BLPC, JPS, LUCELEC, GRENLEC, and DOMLEC, data from EDH website, and published figures by APUA and Corporación Dominicana de Empresas Eléctricas Estatales (CDEEE) for EDEESTE, EDE-NORTE, and EDESUR
Fuel surcharge for each utility is from July or August 2013. The percent is calculated based on the tariff structure for each utility.
Note: DOMLEC does have a surcharge but we do not have the necessary information to include it here
THE COST STRUCTURE FOR PROVIDING ELECTRICITY IN THE CARIBBEAN
The high electricity prices in the Caribbean are driven primarily by the underlying costs of genera-tion. In particular, the dependence on generation plants with high LRMC (such diesel-fired plants) is very costly. That is why countries that generate a large percentage of electricity based on natural gas have lower generation costs than countries that generate most of their electricity based on fuel oil. For example, in Trinidad and Tobago, 99 percent of electricity is generated using natural gas, and the generation costs incurred for annual sales of 9,272 GWh is approximately US$939.6 million (a unit cost of 10.1 US$ cents per kWh generated). In contrast, in Jamaica, 95 percent of fuel is generated based on fuel oil which leads to incurred generation costs of about US$743 million for annual sales of 4,795 GWh (a unit cost of 15.5 US$ cents per kWh generated). This example illustrates how much the type of fuel used to generate electricity can affect the total cost of generation.
In this section, we analyze how the cost structure of electricity in Caribbean countries leads to the high prices presented in Section 2.1. We find that:

83
• The generation matrix is highly dependent on imported oil-based fuels (Section 2.2.1)
• The cost of fuel accounts for more than 50 percent of the cost of service (Section 2.2.2)
• The long-run marginal cost of fuel oil plants is high due to the high price of fuel (Section 2.2.3)
THE GENERATION MATRIX IS HIGHLY DEPENDENT ON IMPORTED OIL-BASED FUELS
In the Caribbean, and particularly the island countries, the generation matrix is highly dependent on imported oil-based fuels. Out of thirteen countries in this study, eleven generate more than 75 percent of their electricity with fuel oil. Furthermore, six of the 11 countries generate 100 percent of their electricity based on fuel oil.
Table 2.3 shows the percentage of installed capacity by different source for each country. The table shows that all countries have generation plants that use fuel oil, and that the only countries with less than 50 percent of installed capacity based on fuel oil are Suriname (49 percent), and Trinidad and Tobago (1 percent).
Table 2.3: Percentage of Installed Capacity by Source
COUNTRY FUEL OIL GAS COAL HYDRO OTHER
Dominica 75% - - 25% -
St. Vincent and the Grenadines 88% - - 12% -
Grenada 100% - - - -
St. Kitts and Nevis 96% - - - 4%
Antigua and Barbuda 100% - - - -
St. Lucia 100% - - - -
Guyana 100% - - - -
Barbados 100% - - - -
Haiti 80% - - 20% -
Suriname 49% - - 51% -
Bahamas 100% - - -
Jamaica 95% - - 3% 2%
Trinidad and Tobago 1% 99% - - -
Dominican Republic 53% 19% 10% 17% 1%
Source: Annual Reports and websites of each utility

Pre-Feasibility Study of the Potential Market for Natural Gas as a Fuel for Power Generation in the Caribbean84
THE COST OF FUEL ACCOUNTS FOR MORE THAN 50 PERCENT OF THE COST OF SERVICE
Because of the high dependence on fuel oil to generate electricity, the cost of fuel represents the largest portion of the cost of service in these countries. Figure 2.7 provides a breakdown of the cost of service per kWh sold in 2012 for five utilities in the Caribbean. It shows that the average cost of service for these utilities is 37.0 US$ cents per kWh, and that all utilities have a cost of service above 30.0 US$ cents per kWh. The figure also shows the percentage of fuel costs as a percentage of total cost of service for each utility. The figure shows that for all the utilities, the cost of fuel accounts for more than 50 percent of the costs.
Figure 2.7: 2012 Cost of service for five utilities in The Caribbean (2012)
0,220,25 0,23 0,23 0,21
0,06
0,080,06
0,120,12
0,02
0,020,04
0,03 0,040,31
0,36 0,37
0,41 0,41
0,00
0,05
0,10
0,15
0,20
0,25
0,30
0,35
0,40
0,45
Barbados(BLPC)
Jamaica(JPS)
St. Lucia(LUCELEC)
Grenada(GRENLEC)
Dominica(DOMLEC)
US$/
kWh
Dividends
Taxes
Interest
D&A
Non-Fuel OpExFuel Cost
Total
51,4%56,1%
62,4%68,4% 69,9%
0%
10%
20%
30%
40%
50%
60%
70%
80%
Dominica(DOMLEC)
Grenada(GRENLEC)
St. Lucia(LUCELEC)
Jamaica(JPS)
Barbados(BLPC)
Fuel
Cost
as
a %
of T
otal
Cos
t
Source: 2012 Annual Reports of BLPC, DOMLEC, GRENLEC, JPS, and LUCELEC

85
The result of this high cost of service is that, in countries where tariffs are set to cover the total cost of service, which is the case for most of the utilities in the Caribbean, the tariffs have a high compo-nent of fuel costs. This is the main reason why electricity prices presented in section 2.1 are so high. In addition to the information on cost of service for five in utilities in Figure 2.7, I also have informa-tion on cost of service for two utilities in 2011, and one utility in 2009. Table 2.4 shows the cost of service of these three utilities.
Table 2.4: Cost of Service for Utilities in 2009-2011
COUNTRY(UTILITY)
BAHAMAS(BEC)
GAS COAL
Year 2009 2011 2011
Non-Fuel Opex $0.15 $0.17 $0.26
Fuel Cost $0.09 $0.11 $0.09
Total Opex $0.24 $0.28 $0.35
D&A $0.02 $0.06 $0.02
Interest $0.01 $0.01 $0.01
Taxes $0.00 $0.01 $0.01
Dividends $0.00 $0.01 $0.00
Total Cost of Service $0.27 $0.38 $0.39
Fuel cost as a % of total cost 33.3% 28.9% 23.1%
Source: 2011 Annual Reports of VINLEC and GPL, and 2009 Financial Statements of BEC
THE AVERAGE COST OF ELECTRICITY SYSTEMS IN THE CARIBBEAN IS HIGH DUE TO THE HIGH PRICE OF FUEL
The result of this high cost of service is that, in countries where tariffs are set to cover the total cost of service, which is the case for most of the utilities in the Caribbean, the tariffs have a high compo-nent of fuel costs. This is the main reason why electricity prices presented in section 2.1 are so high. In addition to the information on cost of service for five in utilities in Figure 2.7, we also have infor-mation on cost of service for two utilities in 2011, and one utility in 2009. Table 2.4 shows the cost of service of these three utilities.
THE LONG-RUN MARGINAL COST OF FUEL OIL PLANTS
We have estimated the long-run marginal costs of the fuel oil plants based on information for Barba-dos for two types of plants: low speed diesel plants and gas turbine plants. We assume that the LRMC of these plants will be the same for all countries where fuel oil is the main source of generation.

Pre-Feasibility Study of the Potential Market for Natural Gas as a Fuel for Power Generation in the Caribbean86
Low speed diesel plants, running on heavy fuel oil, are the cheapest form of generation in Barbados. At an oil price of US$80 per barrel,1 the long-run marginal cost for these plants is 15.72 US$ cents per kWh. This is the all-in cost of generation which includes capital costs, non-fuel operating costs, fuel costs, and major maintenance costs. These plants are the most cost-efficient of the current mix because even though they do not have the lowest capital cost, their fuel efficiency is significantly higher than the cost of fuel of a diesel gas turbine. The other type of generation plant operating in Barbados is gas turbine plants, which run on diesel fuel and jet fuel. Figure 2.8 shows the all-in costs of genera-tion for these two types of plants.
Figure 2.8: All-in Costs of Generation of Fuel Oil Plants
0,11
0,15
0,03
0,01
-
0,02
0,04
0,06
0,08
0,10
0,12
0,14
0,16
0,18
0,20
Low Speed Diesel (HFO) Gas Turbine (Diesel)
US$/
kWh Major maintenance
Variable O&M CostsFixed O&M CostsCapital CostsFuel costs
0.16
0.18
Source: BL&P data on current plants, and Castalia estimates on capital costs, weighted-average cost of capital (WACC), and tax rate.
Note: Figure based on fuel cost of US$80 per barrel.
To calculate the all-in costs of the average generator in the Caribbean, We include all costs that are part of the long-run marginal cost of electricity generation:
• Capital costs
• Fixed O&M costs
• Variable O&M costs
• Fuel costs
• Major maintenance.
1 Based on the price of ten-year futures for light sweet crude oil (WTI). See http://www.cmegroup.com/trading/energy/crude-oil/light-sweet-crude.html.

87
Our calculations for capital costs and non-fuel O&M costs are based on data, for 2009, provided by BL&P on its existing plants.2 The capital costs of generation plants and the efficiency of those plants have not changed much since then. Our calculations for fuel costs are based on current future prices of fuel oil.3
THE AVERAGE COST FOR EACH SYSTEM IS BASED ON THE LONG-RUN MARGINAL COST OF THE GENERATION MATRIX
The calculations presented in the previous section, show the LRMC for a fuel oil plant. However, in order to conduct a cost-benefit analysis for introducing natural gas, it is necessary to have a coun-try-specific average cost of the system, based on the current generation matrix. In this section, we present this average cost of generation for each system. We calculate the average cost for each system in the Caribbean with the following assumptions:
• The proportion that each energy source contributes to the generation mix is the same as the installed capacity for that source as a proportion of total installed capacity. For example, in Dominica, the installed capacity for fuel oil and hydro as a percent of the total installed ca-pacity is 75 percent and 25 percent respectively. So, we assume that the 75 percent of energy is generated based on fuel oil and the remainder generated based on hydro
• The average cost for each system is calculated using the weighted average of the LRMC of each energy source multiplied by the percent of electricity that is generated with each source. The calculation for that is:
System average cost = (LRMC source1 x % generation source1) + (LRMC source2 x % generation source2) + LRMC sourcen x % generation sourcen)
• The price of fuel oil ( 15.72 US$ cents per kWh) and coal ( 7.70 US$ cents per kWh) are the same for every country in this study
• The price of natural gas is the same for all countries, only for this scenario.4 It is based on the price of natural gas in the Dominican Republic (10.08 US$ cents per kWh)
• The price of hydro, and wind is the same for every country (refer to section 2.3 where we discuss these prices).
2 BL&P, System Expansion Study 2007, Final Report; and data sent by BL&P management on 25 September 2009.3 Retrieved from www.cmegroup.com/trading/energy/crude-oil/light-sweet-crude.html, on 30 August 20124 The price of natural gas in the Dominican Republic was calculated by Jed Bailey based on the cost of importing natural gas from Sabine Pass in the U.S. The price of natural gas for Trinidad and Tobago will likely be lower because they do not factor in transportation costs. However, since we do not have information about the transportation cost, we used the price of natural gas in the Dominican Republic for illustrative purposes. We chose this price because it was the most conservative estimate.

Pre-Feasibility Study of the Potential Market for Natural Gas as a Fuel for Power Generation in the Caribbean88
Figure 2.9 below compares the average cost of each system for the 14 Caribbean countries included in this study. The average cost varies from 10.08 US$ cents per kWh (in Trinidad and Tobago where 99 percent of the installed capacity is based on natural gas) to 15.72 US$ cents per kWh (in six coun-tries where 100 percent of the installed capacity is based on fuel oil).
Figure 2.9: Average Cost for Caribbean systems
10,13
13,18 13,91
14,83 15,01 15,29 15,49 15,50 15,72 15,72 15,72 15,72 15,72 15,72
-
2,00
4,00
6,00
8,00
10,00
12,00
14,00
16,00
18,00
US ce
nts/
kWh
Source: BL&P data on current plants, and Castalia estimates on capital costs, weighted-average cost of capital (WACC), and tax rate.
Note: Figure based on fuel cost of US$80 per barrel.
CURRENT RE AND EE COST CURVES
Since electricity prices are high in the Caribbean, the introduction of RE and EE technologies can help reduce the cost of generating electricity. In other words, introducing any technologies where the long run marginal cost is lower than that of fuel fired plants means that the cost of producing electricity will decrease.
Therefore, we now analyze the economic viability of a range of renewable energy and energy effi-ciency technologies for the countries in this study. By ‘economically viable’ we mean technologies that can reduce the cost of energy to a country as a whole. ‘Commercially viable’ are technologies that save or make money for an individual customer or business. All economically viable technologies are also commercially viable, but not vice versa. We find that a large set of RE and EE technologies would be viable in the Caribbean, given the high costs and prices of electricity. In particular, we find that:

89
• Most renewable energies may be economically viable, with the exception of OTEC, wind at a small scale, and some solar technologies (Section 2.3.1)
• At least half of the energy efficiency technologies considered are economically viable (Section 2.3.2).
We explain these conclusions in more detail below.
RENEWABLE ENERGY COST CURVES
The analysis below suggests that the renewable energy technologies that make economic sense and represent the greatest market potential in the countries in this study are the following, ordered from smallest to largest LRMC:
• Geothermal energy in Dominica, Grenada, Saint Kitts and Nevis (also, assuming the resources are adequate for generating electricity, Saint Lucia, and Saint Vincent and the Grenadines)
• Various waste-based renewable energy technologies in all countries where fuel oil is the main source of generation
• Solar water heating at commercial and residential scale in all countries where fuel oil is the main source of generation
• Biomass cogeneration with bagasse in all countries where fuel oil is the main source of generation
• Wind energy in all countries where fuel oil is the main source of generation
• Hydroelectric energy in Dominica, the Dominican Republic, Guyana, Haiti, Jamaica, Saint Vincent and the Grenadines
To reach these conclusions, in this section we:
• Estimate a general cost curve that allows us to determine which technologies are economi-cally viable, in general. By in general, I mean a cost curve that is applicable to most countries in the region, where fuel oil is the main source of generation and it is appropriate to use the LRMC of fuel oil plants as the avoided cost benchmark
• Analyze which countries this curve does not apply to, or which technologies cannot be implemented in some countries—for example, Hydro in small countries where there are no hydro resources

Pre-Feasibility Study of the Potential Market for Natural Gas as a Fuel for Power Generation in the Caribbean90
We explain each one below.
RE COST GENERAL COST CURVE
Figure 2.10 shows the general cost curve for the countries in this study. The avoided cost benchmarks (vertical lines) are based on low speed diesel (LSD) and diesel fired gas turbines. The figure shows that (for all countries where the current generation technology is fuel oil, and where the renewable ener-gy technologies are available) all firm technologies are economically and commercially viable—this means that all renewable energy technologies have LRMC lower than the all-in cost of a low speed diesel plant. The figure also shows that wind is only viable at a larger scale (equal to or greater than 850kW). The figure also shows that of the solar technologies, only commercial and residential solar water heaters are economically viable. The other solar technologies are commercially viable for all countries except Trinidad and Tobago and Suriname, and the Dominican Republic.
Figure 2.10: RE Cost Curve
0,50
0,47
0,29
0,26
0,23
0,20
0,14
0,12
0,10
0,09
0,09
0,09
0,08
0,05
- 0,05 0,10 0,15 0,20 0,25 0,30 0,35 0,40 0,45 0,50 0,55
OTEC (5MW)
Wind (10kW)
Solar PV (small scale)
Solar PV (comm. scale)
Seawater Air Conditioning (2MW)
Solar PV (utility scale)
Residential SWH (2kW)
Hydro*
Wind (850kW)
Commercial SWH (70 kW)
Bagasse cogeneration
Land�ll gas to energy (internal combustion)
Anaerobic Digestion / Biogas (2MW)
Geothermal (100MW)**
RE Cost Curve in Current Scenario
Retail Tari� DRUS$0.20/kWh
LSD/HFO, all -in cost: US$ 0.16/kWh
Gas turbine, fuel cost: US$ 0.15/kWh
LSD/HFO, fuel cost: US $0.11/kWh
Retail Tari� Others*US$0.32-0.43/kWh
Firm technologyNon-�rm, less relaible technologyNon-�rm technology
Economically viable
Commercially viable
Source: Castalia Report, Sustainable Energy Framework for Barbados Final Report, 2010. The figures from this report were updated to reflect current process of fuel oil. In particular, I updated the long run cost of fuel oil, from US$100 in the Barbados Report, to US$80 per barrel (retrieved from www.cmegroup.com/trading/energy/crude-oil/light-sweet-crude.html)
*Hydro costs are a preliminary estimate based on Guyana. However, hydro is site specific and need to be studied further for each of the countries.
**Geothermal costs are based on 100MW plants in the US. These costs are site specific and need to be studied further for each of the countries
To produce the cost curve we:
• Estimate the avoided cost benchmarks, that is the long-run marginal cost of fuel oil fired plants (section 2.2.3)

91
• Estimate costs for renewable energy—this is done by calculating the Long Run Marginal Cost (LRMC) of generation in US Dollars per kilowatt hour for each of the available re-newable energy technologies (the detail for each technology can be found in Appendix A).
• Compare the LRMC of the renewable energy technologies with the avoided costs bench-marks to understand which renewable energy technologies are economically viable—ap-propriate avoided costs benchmarks are different for different kinds of renewable energy technologies. Firm technologies are compared with the LRMC of the cheapest generation option available to the grid. We assume this is a LSD plant. This is because firm options do not require backup capacity and can, therefore, offset the operating and maintenance, fuel, and capital costs that the utility would incur building new capacity. Non-firm technologies, however, require backup capacity for when their primary source of energy—for example, the sun—is not available. As a result, non-firm technologies can only offset variable opera-tions and maintenance costs and fuel costs.
• Compare the LRMC of the renewable energy technologies with the current tariffs to under-stand which renewable energy technologies are commercially viable
THE RENEWABLE ENERGY CURVE DOES NOT APPLY TO ALL COUNTRIES
The above analysis does not apply equally to all countries. Although it shows the general overview of the countries in this study, there are two main reasons why the renewable energy cost curves are different in some particular cases:
• Some countries have lower avoided cost benchmarks. This is the case for Trinidad and Tobago and Suriname, where diesel is not the primary source for generating electricity. (for more detail on the avoided cost benchmark for each country, see section 2.2.3).
• Not all resources are available for all countries. For example geothermal and hydro energy is only available in some countries.
Table 2.5 presents a summary of the technologies that are viable in each of the countries. Viable means that, the technology is technically viable (the resource is available in the country or easy to import), and that the technology is economically viable. For countries such as Trinidad and Tobago and Suriname, where the RE curve in section 0 does not apply, we use the information from external sources.5
5 Mainly from World Bank and Public Private Infrastructure Advisory, “Caribbean Regional Electricity Supply Options: Toward Greater Secu-rity, Renewables and Resilience” 2011.

Pre-Feasibility Study of the Potential Market for Natural Gas as a Fuel for Power Generation in the Caribbean92
Table 2.5: Summary of Individual Countries’ Viable Future Options
COUNTRY COAL WIND GEOTHERMAL HYDRO BIOMASS
Antigua and Barbuda • • •
Bahamas • •
Barbados • • • •
Dominica • • • •
Dominican Republic • • • •
Grenada • • • •
Guyana •
Jamaica • • • •
Haiti • • • •
St. Kitts & Nevis • • •
St. Lucia • • • •
St. Vincent and the Grenadines • • • • •
Suriname •
Trinidad and Tobago •
Source: World Bank and Public Private Infrastructure Advisory, “Caribbean Regional Electricity Supply Options: Toward Greater Security, Renewables and Resilience” 2011.
In particular, regarding the specific technologies, the table uses the following resource constraints:
• Hydro: Given the decreased water flow, with the exception of the larger Caribbean coun-tries (Haiti, Jamaica, DR) that still have some rivers of note, only Dominica, and to a lesser extent St. Vincent and the Grenadines, may be able to economically exploit hydropower. However, hydro is highly site specific and detailed studies must be conducted at potential sites to arrive at more accurate projections of the economic viability of development
• Geothermal: Only Dominica has advanced studies. There are potential resources or possi-ble interconnection projects that can help include geothermal in the generation matrix in Grenada, Saint Kitts and Nevis, Saint Lucia, and Saint Vincent and the Grenadines
• Bagasse: Although in principle it is viable to generate electricity from bagasse, it is important to conduct country specific studies to understand where the fuel stock will come from.
EE COST CURVES
The analysis below suggests that the technologies that make economic sense and represent the greatest market potential are T8 Fluorescent Lamps w/Occupancy Sensor, Efficient Split A/C Systems, Vari-

93
able Frequency Drives, Efficient Window A/C Systems, Premium Efficiency Motors, Power Mon-itors, and Compact Fluorescent Lamps (CFLs). These technologies are economically viable in all countries where fuel oil is the main source for generating electricity
Figure 2.11 shows the general cost curve for the countries in this study. The figure shows that all en-ergy efficiency technologies with costs of 15.72 US$ cents per kWh or less are economically viable—that is seven of the thirteen technologies studied.
To determine economic viability, energy efficiency technologies are compared with the LRMC of the cheapest generation option available to the grid—the avoided cost benchmarks. The avoided cost benchmarks (vertical lines) are based on low speed diesel (LSD) power plants. Because increasing en-ergy efficiency reduces peak demand (and reduces the need for capacity), these technologies offset the operating and maintenance, fuel, and capital costs that the utility would incur building new capacity.
Figure 2.11: EE Cost Curve
0,32
0,32
0,30
0,25
0,22
0,20
0,16
0,11
0,10
0,09
0,08
0,04
0,02
- 0,05 0,10 0,15 0,20 0,25 0,30 0,35 0,40 0,45
E�cient Retail Refrigerators (Condensing Unit)
LED Street Lighting
E�cient Residential Refrigerators
LCD Computer Monitors
T5 High Output Fluorescent Lamps
E�cient Chillers
T8 Fluorescent Lamps w/Occupancy Sensor
E�cient Split A/C Systems
Variable Frequency Drives
E�cient Window A/C Systems
Premium E�ciency Motors
Power Monitors
Compact Fluorescent Lamps (CFLs)
EE Cost Curve in Current Scenario
Commercially viableEconomically
viable
Retail Tari� DRUS$0.20/kWh
LSD/HFO, all -in cost: US$ 0.16/kWh
Retail Tari� Others*US$0.32-0.43/kWh
Source: Castalia, Sustainable Energy Barbados Report, 2010. The figures from this report were updated to reflect current process of fuel oil. In particular, I updated the long run cost of fuel oil, from US$100 in the Barbados Report, to US$80 per barrel (retrieved from www.cmegroup.com/trading/energy/crude-oil/light-sweet-crude.html)
The above curve applies to all countries where fuel oil is the main source of generation. This means that the economic and commercial viability of energy efficient technologies in Trinidad and Tobago and Suriname needs to be assessed in greater detail (at a scope beyond the terms of reference for this assignment).

Pre-Feasibility Study of the Potential Market for Natural Gas as a Fuel for Power Generation in the Caribbean94
IMPACT OF NATURAL GAS IN ELECTRICITY
In this section, we show the impact that natural gas would have on the cost and price of electricity in the Caribbean. We also show how introducing natural gas into the generation matrices of the coun-tries in the Caribbean would affect the RE and EE technologies are economically viable. To explain the impact of natural gas in the electricity systems in the Caribbean, in this section we:
• Explain how introducing natural gas would reduce the costs of generating electricity in most Caribbean countries (Section 3.1)
• Present the impact of introducing natural gas on electricity prices (Section 3.2)
• Present the impact of introducing natural gas on RE and EE curves (Section 3.3)
• To reach these conclusions, we use the following assumptions:
• We use LNG from Sabine Pass as the source of natural gas for all countries in the Caribbe-an. We use this source because, as Section A of this study explains, LNG would be the best (and in most cases the least cost) alternative.6
• All current generation based on fuel oil will be completely substituted with generation based on natural gas
• Natural gas will use oil burning engines similar to the low speed diesel engines installed in Barbados—which we used for estimating the LRMC of fuel oil in Section 2.2.3. We also assume that natural gas has the same heat rate as fuel oil, and that all other costs used for calculating LRMC (capital costs, fixed O&M costs, variable O&M costs, and major mainte-nance) are the same for natural gas and fuel oil
• Therefore, the only difference in the LRMC of low speed diesel plants using natural gas ver-sus ones using fuel oil is due to the difference in fuel costs. Some cost savings from switching to natural gas will be passed on to customers. More precisely, we assume that 50 and 100 percent of savings will be passed on to customers
Additionally, it is worth noting that we have excluded Trinidad and Tobago from this section be-cause 99 percent of the installed capacity of this country is already based on natural gas.
IMPACT OF INTRODUCING NATURAL GAS ON GENERATION COSTS
Introducing natural gas into the energy matrices of the Caribbean would reduce the cost of generat-ing electricity. The main reason for this is that the fuel price for natural gas is lower than the price for fuel oil; this is true for all countries included in this study. Therefore, the impact of introducing natural gas will lead to following results:
6 Jed Bailey. Section A: Pre-Feasibility Study of the Potential Market for Natural Gas as a Fuel for Power Generation in the Caribbean. p. 47

95
• The LRMC of a natural gas power plant will be lower than the LRMC of fuel oil power plant (section 3.1.1)
• The average cost of generation will decrease with natural gas plants (section 3.1.2)
• Fuel costs will account for a lower percentage of generation costs (section 3.1.3)
LRMC OF GAS FIRED POWER PLANTS
Section A: Prefeasibility Study of the Potential Market for Natural Gas as a Fuel for Power Gener-ation in the Caribbean prepared by Jed Bailey (Section A of this Report), presented an estimate of the LRMC of gas fired plants, for each country in this study for each of the natural gas technologies (LNT, CNG, and pipelines), and for different sources for importing gas (including Colombia, Mexico, Peru, Trinidad and Tobago, U.S.A, and Venezuela). For all the calculations in Section B, I use the LRMC of LNG imported from Sabine Pass in the United States.7 Figure 3.1 compares the LRMC of gas fired power plants in each country, with the LRMC of fuel fired plants for all countries (15.72 US$ cents per kWh as presented in section 2.2.3).
Figure 3.1: LRMC of Natural Gas v. LRMC of Fuel oil (US$ cents per kWh)
10,08 10,45 10,54 10,85 10,88 10,91 11,15 11,18 11,37 11,74 11,94 11,94
13,9815,72
0,00
2,00
4,00
6,00
8,00
10,00
12,00
14,00
16,00
18,00
Dominican Republic
Jamaica The Bahamas
Barbados Guyana Suriname Haiti Antigua and
Barbuda
St. Lucia St. Kitts and Nevis
St. Vincent and the
Grenadines
Grenada Dominica LRMC fuel -oil
Source: The LRMC of natural gas plants for each country is based on Jed Bailey’s calculations, presented in Section A (Table 18) of this report.. The LRMC of fuel oil, which I have assumed is the same for each country, is based on the LRMC of fuel oil plant in Barbados.
Figure 3.1 shows that the LRMC for fuel fired plants is higher than the LRMC for gas fired plants in all countries. Table 3.1 presents the savings that each country can benefit from switching from natural gas to fuel oil. The percentage savings will be between 11 percent and 36 percent. In the following section, we show how the difference in the LRMC of these plants, impacts the average cost of gener-ation for the electricity systems in each country.
7 This is because, as explained above, Section A of this Study explains, LNG would be the best (and in most cases the least cost) alternative

Pre-Feasibility Study of the Potential Market for Natural Gas as a Fuel for Power Generation in the Caribbean96
Table 3.1: Percentage savings of natural gas v. fuel oil, as a percent of LRMC (U.S. Sabine Pass)
11%
24% 24% 25%28% 29% 29% 31% 31% 31% 33% 34% 36%
0%
5%
10%
15%
20%
25%
30%
35%
40%
% Sa
ving
s of
Nat
ural
Gas v
. Fue
l oi
l as a
% o
f LRM
C
Source: Section A, Table 26
THE AVERAGE COST OF GENERATION WILL BE LOWER WITH NATURAL GAS PLANTS
As explained in Section 2, some systems have sources other than fuel oil in their generation matrices. Therefore, in this section, we compare how the average cost of each system would change by intro-ducing natural gas as a generation source, and using it as a substitute for fuel oil. To estimate the average cost for each system with the introduction of natural gas, we follow the same methodology we used for estimating the cost of each system with the current generation matrix (Section 2.2.3), that is, we use a weighted average of the LRMC of each of the electricity sources that each country has.
Therefore, we calculate the average cost for each system based on the following assumptions:
• The LRMC of natural gas plants for each country is based on the calculations of the cost of natural gas using LNG from Sabine Pass, as estimated in Section A of this report and presented in Section 3.1.1
• All current generation based on fuel oil will be completely substituted with generation based on natural gas
• The heat rate for a natural gas power plant is the same as the heat rate for a fuel oil power plant
• The proportion that each energy source contributes to the generation mix is the same as the installed capacity for that source as a proportion of total installed capacity
• The cost for each system is calculated using the weighted average of the LRMC of each en-ergy source multiplied by the percent that each energy source contributes to the generation matrix. In other words:

97
System cost = (LRMC source1 x % generation source1) + (LRMC source2 x % generation source2) +…(LRMC sourcen x % generation sourcen)
• The price of coal is the same for each country ( 7.70 US$ cents per kWh)
• The price of hydro and wind is the same for each country (refer to section 2.3 where we discuss these prices)
Based on these assumptions, Figure 2.10 shows the system cost for each country in a scenario where natural gas is included in the generation matrix and replaces all fuel oil generation. The figure also compares the cost under this natural gas scenario with the cost in the current (fuel oil) scenario (refer to section 2.2.3).
Figure 3.2: Average Cost of System with Natural Gas
10,14 10,42 10,47 10,78 10,81 11,11 11,30 11,30 11,52 11,60 11,87 11,91
13,47 13,18
15,50 15,72 15,72 15,72 15,72 15,01
15,72
13,91
15,49 15,72 15,29 14,83
-
2,00
4,00
6,00
8,00
10,00
12,00
14,00
16,00
Dominican Republic
Jamaica The Bahamas
Barbados Guyana Antigua and Barbuda
Haiti St. Lucia Suriname St. Kitts and Nevis
Grenada St. Vincent and the
Grenadines
Dominica
US$ c
ents
/kW
h
Average cost of system natural gas Average cost of system fuel-oil
Fuel as a % of all-in generation costs
Dom
inic
an
Rep
ublic
Jam
aica
Bah
amas
Bar
bado
s
Guy
ana
Ant
igua
&
Bar
buda
Hai
ti
St. L
ucia
Suri
nam
e
St. K
itts
and
Nev
is
Gre
nada
St. V
ince
&
Gre
nadi
nes
Dom
inic
a
% change
29% 48% 49% 45% 45% 41% 32% 39% 20% 33% 32% 28% 10%
Note: The percentage difference is calculated based on the change of the average cost of a system using fuel-oil (which I assume to be the same for all countries) and the average cost of each system using natural gas.
The average cost of a system using natural gas is lower for all Caribbean countries. The difference in the average cost in the current scenario (fuel oil) and the average cost in the scenario with natural

Pre-Feasibility Study of the Potential Market for Natural Gas as a Fuel for Power Generation in the Caribbean98
gas implies an average cost saving of almost 3.91 US$ cents per kWh.8 The cost savings vary from US$1.31 (in Dominica) to more than US$5.18 (in the Bahamas and Jamaica). In Section 4 we will analyze in more detail different scenarios and the savings in net benefits of introducing natural gas in the generation matrix of countries in the Caribbean.
A LOWER PERCENTAGE OF GENERATION COSTS ARE EXPECTED TO BE FUEL COSTS
In substituting fuel oil with natural gas, the fuel cost as a percent of total all-in costs, will decrease. This is because the price of natural gas is lower than that of fuel oil, for all countries in this study. As can be seen in Figure 3.3, the LRCM of natural gas varies from 5.64 US$ cents per kWh to 9.54 US$ cents per kWh. Compared to the LRCM of fuel oil, which is 11.28 US$ cents per kWh, the price of natural gas is 4 percent to 16 percent lower than that of fuel oil.
Figure 3.3: All-in Costs of Generation of Natural Gas Plants v. Fuel Oil Plants
5,64 6,01 6,10 6,41 6,45 6,47 6,72 6,74 6,93 7,30 7,49 7,499,54
11.28
10,08 10,45 10,54 10,85 10,89 10,91 11,16 11,18 11,37 11,74 11,94 11,94
13,98
15,72
0,00
2,00
4,00
6,00
8,00
10,00
12,00
14,00
16,00
18,00
Dominican Republic
Jamaica The Bahamas
Barbados Guyana Suriname Haiti Antigua and
Barbuda
St. Lucia St. Kitts and Nevis
St. Vincent and the
Grenadines
Grenada Dominica Low Speed Diesel (HFO)
US$ c
ents
/kW
h
Fuel cost (NG)
Non-fuel costs
All-in cost of generation
Fuel as a % of all-in generation costs
Dom
inic
an
Rep
ublic
Jam
aica
Bah
amas
Bar
bado
s
Guy
ana
Ant
igua
&
Bar
buda
Hai
ti
St. L
ucia
Suri
nam
e
St. K
itts
and
Nev
is
Gre
nada
St. V
ince
&
Gre
nadi
nes
Dom
inic
a
Fuel
-Oil
56% 57% 58% 59% 59% 59% 60% 60% 61% 62% 63% 63% 68% 72%
Source: Price of natural gas taken from Section A (Table 18) of this report..
8 Calculated as the difference in the average of average costs of all systems using fuel oil (15.19 US$ cents per kWh) and the average of aver-age costs of all systems using natural gas (11.28 US$ cents per kWh).

99
As Figure 3.3 above shows, by switching to natural gas, fuel cost will make up between 56 percent and 68 percent of all-in cost of generation, where as fuel oil makes up 72 percent of all-in costs of generation. It is worth noting that in some countries (like Dominica) the difference in price between natural gas and fuel oil is minimal, in which case the benefits gained from switching to natural gas will be lower. We will analyze the cost and benefits for each country in more detail in Section 4.
IMPACT OF INTRODUCING NATURAL GAS ON PRICES
The impacts of natural gas on generation costs will likely be reflected in the electricity prices that customers pay. This is because it is likely that the reduction in the price of fuel would be passed on as savings to customers. Though we cannot calculate the savings that would be distributed—this depends on each country’s regulatory regime— we assume that a good percentage of that reduction will be transferred to customers (section 3.2.1).
Another positive impact of introducing natural gas is that it will provide more stability in electricity prices—which customers will see as less volatile fuel surcharges. As mentioned in Section 2.1.3, the price of fuel oil is tied to the global price of fuel. This price has fluctuated significantly in past years, which accounts for volatility in electricity prices seen in the Caribbean. By substituting fuel oil for natural gas (which is less volatile), we expect there will be more stability in electricity prices (Section 3.2.2).
AVERAGE RETAIL PRICES WOULD BE LOWER WITH THE INTRODUCTION OF NATURAL GAS
Considering that each country has its own laws and regulations that decide the tariff structure, in this study we cannot determine the exact reduction in average prices for each utility. However, we can assume that at least some part of the cost reductions will be passed on to customers via lower fuel sur-charges, or lower tariffs in countries where there is no fuel surcharge. For the purposes of illustrating the possible reduction in electricity prices, we have assumed that for all countries between 50 percent and 100 percent of the savings from switching to natural gas would be passed on to the customer.
Figure 3.4 below compares, for each country, the current average tariff with the average tariff assum-ing natural gas is used to generate electricity. We have estimated the range of average tariffs assuming that customers might see between 50 and 100 percent savings of fuel costs (due to use of natural gas) reflected in the average tariff. The dark blue triangle identifies the current average tariff, the orange square represents the average tariff assuming that 50 percent of savings from fuel cost, and lastly the light purple diamond represents the average tariff assuming that 100 percent of savings from fuel cost. We expect that if natural gas replaces fuel oil, the average tariff falls between the orange square and light purple diamond for each country. That is between 50 and 100 percent savings of using natural gas will be reflected in the average tariff

Pre-Feasibility Study of the Potential Market for Natural Gas as a Fuel for Power Generation in the Caribbean100
Figure 3.4: Tariffs based on Natural Gas vs. Tariffs based on Fuel oil
$0,14 $0,14$0,15
$0,18$0,19
$0,23
$0,26$0,27
$0,25
$0,39
$0,17 $0,17$0,18
$0,25$0,28
$0,30$0,32
$0,34 $0,34
$0,41
$0,20 $0,20$0,22
$0,32
$0,36$0,38 $0,38
$0,40$0,43 $0,43
$0,00
$0,05
$0,10
$0,15
$0,20
$0,25
$0,30
$0,35
$0,40
$0,45
$0,50
EDEESTE(Dominican Republic)
EDENORTE(Dominican Republic)
EDESUR(Dominican Republic)
BLPC(Barbados)
JPS(Jamaica)
LUCELEC(St. Lucia)
EDH(Haiti)
GRENLEC(Grenada)
APUA(Antigua and
Barbuda)
DOMLEC(Dominica)
US$ c
ents
/kW
h
Tari� assuming 100% savings passed on to customers
Tari� assuming 50% savings passed on to customers
Current tari� based on fuel-oil
Based on our assumptions, we estimate that prices would decrease between 2.20 US$ cents and 8.80 US$ cents per kWh if 50 percent of price savings were passed on to the customer, and that prices would between 4.30 US$ cents and 17.5 US$ cents per kWh if 100 percent of price savings were passed on to the customer.
PRICES MIGHT ALSO BE LESS VOLATILE
Furthermore, we would also expect prices to be less volatile for customers who pay fuel surcharges as part of their electricity bills. If we assume that similar regulatory regimes remain in place, where fuel (now gas) is a pass-through, fuel costs can be expected to be a lower percentage of the tariff. Therefore, volatility that customers perceive due to a fuel surcharge could be lower. However, it is worth noting that lower volatility will depend on the contracts that the utilities establish for natural gas delivery.
IMPACT ON RE AND EE COST CURVES
In Section 3.1, we presented the price of natural gas for each of the countries in this study. We also presented the LRMC for natural gas fired plants in each country based on the range of natural gas prices presented in Section A (Table 18) of this report. Both the price of natural gas and the LRMC of natural gas-fired plants have proven to be lower than the price of fuel oil and the LRMC of a

101
fuel oil plant. This reduction in fuel price and LRMC of power plants would impact the RE and EE technologies that are economically and commercially viable in each country. In this section, we explain how introducing natural gas in the Caribbean would impact the RE and EE cost curves that we present in Section 2.3.
Table 3.2: Viability of RE technologies in fuel oil v. natural gas scenarios
COUNTRY Geothermal Waste Based Technologies
Bagasse Cogeneration
Commercial & Residential Swh
Wind Hydro
Antigua and Barbuda 0 4 4 2 2 0
Bahamas 0 4 4 2 2 0
Barbados 0 4 4 2 2 0
Dominica 4 4 4 4 4 2
Dominican Republic 0 4 4 2 2 2
Grenada 4 4 4 2 2 2
Guyana 0 4 4 2 2 2
Jamaica 0 4 4 2 2 2
Haiti 0 4 4 2 2 2
St.Kitts and Nevis 4 4 4 2 2 0
St. Lucia 4 4 4 2 2 0
St. Vincent and the Grenadines
4 4 4 2 2 2
*0 technology is not viable in any scenario; 2 technology is viable in scenario with fuel oil only; 4 technology is viable in scenario with fuel oil and natural gas
** Solar PVs, Seawater AC and OTEC are not viable for any country under any scenario, and so have been excluded here.
RE COST CURVES WITH NATURAL GAS
Introducing natural gas would affect which RE technologies are economically and commercially viable. Taking into account that the fuel price of natural gas is between 5.64 US$ cents and 9.64 US$ cents per kWh, and that the LRMC of a natural gas plant is estimated to be between 10.08 US$ cents and 13.98 US$ cents per kWh, the RE technologies that no longer make sense under this scenario are:
• Residential solar water heaters in all countries except Dominica. In Dominica, the fuel price of natural gas (9.54 US$ cents per kWh) is greater than the price of solar water heaters (9.0 US$ cents per kWh). So, solar water heaters still make sense in Dominica
• Wind for all countries. The LRMC for wind is 10.0 US$ cents per kWh. Because wind is an intermittent technology, the LRMC of wind should be compared the fuel price of a firm tech-

Pre-Feasibility Study of the Potential Market for Natural Gas as a Fuel for Power Generation in the Caribbean102
nology (such as low speed diesel plants or natural gas plants). In a scenario with natural gas, all fuel prices (which range from 5.64 to 9.54 US$ cents per kWh) are below the LRMC of wind (10.0 US$ cents per kWh), meaning that wind is no longer viable in a scenario with natural gas
• Hydro for most countries except Dominica. The LRMC for a hydro plant is 12.0 US$ cents per kWh. The only country where the LRMC of a natural gas plant is higher than the LRMC of hydro plant is Dominica, where the estimated LRMC of a natural gas plant would be 13.98 US$ cents per kWh. So, hydro still make sense in Dominica.
In addition to the technologies mentioned above, the remainder of the RE technologies mentioned in section 2.3.1 are still viable. Figure 3.5 below shows the RE cost curve in a scenario where natural gas substitutes fuel oil. The firm technologies (shown in blue) that still make sense in this scenario are those with a cost of 10.08 US$ cents per kWh (lowest all in price for natural gas plant) or less. In turn, the intermittent technologies (shown in orange) that make sense are those that have a lower cost than the price of fuel (varies between 5.64 US$ cents and 9.64 US$ cents per kWh).
Figure 3.5: RE Cost Curve with Natural Gas
0,50
0,47
0,29
0,26
0,23
0,20
0,14
0,12
0,10
0,09
0,09
0,09
0,08
0,05
- 0,05 0,10 0,15 0,20 0,25 0,30 0,35 0,40 0,45 0,50 0,55
OTEC (5MW)
Wind (10kW)
Solar PV (small scale)
Solar PV (comm. scale)
Seawater Air Conditioning (2MW)
Solar PV (utility scale)
Residential SWH (2kW)
Hydro*
Wind (850kW)
Commercial SWH (70 kW)
Bagasse cogeneration
Land�ll gas to energy (internal combustion)
Anaerobic Digestion / Biogas (2MW)
Geothermal (100MW)**
RE Cost Curve in Natural Gas Scenario
LSD/NG, all -in cost: US$0.10-0.14/kWh
LSD/NG, fuel cost: US $0.06-0.095/kWh
Retail Tari� Others US$0.25-0.41/kWh*
Commercially viableEconomically viable
Firm technologyNon-�rm technology
Retail Tari� DRUS$0.17/kWh
Source: Castalia Report, Sustainable Energy Framework for Barbados Final Report, 2010.
*Hydro costs are a preliminary estimate based on Guyana. However, hydro is site specific and need to be studied further for each of the countries.
**Geothermal costs are based on 100MW plants in the US. These costs are site specific and need to be studied further for each of the countries
***The range of fuel cost of natural gas is based on LRMC calculations for each country presented in Section A (Table 18) of this report.
****The retail tariff range is calculated assuming that customers will see 50 percent of the savings from using natural gas. These tariffs are presented in Figure 3.4 of this report.
EE COST CURVE WITH NATURAL GAS

103
Introducing natural gas will also impact the economic and commercial viability of EE technologies. The technologies that no longer make sense under a scenario where natural gas substitutes fuel oil are those that have cost greater than 10.0 US$ cents per kWh (the range of the all-in cost of natural gas plants is 10.08 US$ cents and 13.98 US$ cents per kWh):
• T8 Fluorescent Lamps with Occupancy Sensor (16.0 US$ cents per kWh)
• Efficient Split A/C Systems (11.0 US$ cents per kWh) in countries where the all-in cost of natural gas is less than 11.0 US$ cents per kWh, like Dominican Republic, Jamaica, The Bahamas, Barbados, and Guyana.
The remainder of the EE technologies mentioned in Section 2.3.2 would still make sense because customers would still save from using these technologies. Figure 3.6 below shows the EE cost curve in a scenario where natural gas substitutes fuel oil.
Figure 3.6: EE Cost Curve with Natural Gas
0,32
0,32
0,30
0,25
0,22
0,20
0,16
0,11
0,10
0,09
0,08
0,04
0,02
- 0,05 0,10 0,15 0,20 0,25 0,30 0,35 0,40 0,45
E�cient Retail Refrigerators (Condensing Unit)
LED Street Lighting
E�cient Residential Refrigerators
LCD Computer Monitors
T5 High Output Fluorescent Lamps
E�cient Chillers
T8 Fluorescent Lamps w/Occupancy Sensor
E�cient Split A/C Systems
Variable Frequency Drives
E�cient Window A/C Systems
Premium E�ciency Motors
Power Monitors
Compact Fluorescent Lamps (CFLs)
EE Cost Curve in Scenario with Natural GasCommercially viable
Economically viable
LSD/NG, all -in cost: US$0.10 -0.14/kWh
LSD/HFO, all -in cost: US$ 0.16 /kWh
Retail Tari� NG Others US$0.25 -0.41/kWh*
Retail Tari� NG DRUS$0.17/kWh
Source: The cost for EE technologies is based on Castalia Report Sustainable Energy Framework for Barbados Final Report, 2010.
*The range of fuel cost of natural gas is based on LRMC calculations for each country presented in Section A (Table 18) of this report.
**The retail tariff range is calculated assuming that customers will see 50 percent of the savings from using natural gas. These tariffs are presented in Figure 3.4 of this report.
COST BENEFIT ANALYSIS OF NATURAL

Pre-Feasibility Study of the Potential Market for Natural Gas as a Fuel for Power Generation in the Caribbean104
GAS ALTERNATIVES
In order to better understand the implications of introducing natural gas in the Caribbean, in this section we analyze the costs and benefits of the following three scenarios:
• Scenario 1: Liquid fuel in conjunction with RE and EE
• Scenario 2: Natural gas (replacing liquid fuels) in conjunction with RE and EE
• Scenario 3: Natural gas (replacing liquid fuels)
We define cost benefit analysis as the savings in net benefits between each of these scenarios and the business as usual scenario—that is the net benefits of the selected scenario minus the net benefits of the business as usual scenario. Net benefits for each scenario equal total benefits minus total costs.
The benefits for all scenarios equal electricity produced at a reliability level. We assume that all sce-narios will produce the same quantity of power with the same reliability. Based on this assumption, we do not estimate the benefits from generating electricity for each scenario, because all benefits would be the same and the incremental benefits for any scenario would be zero.
Furthermore, for each scenario, we calculate total costs as the sum of the cost of generation and the cost of carbon dioxide (CO2) emissions. Therefore, because the difference in benefits between sce-narios is zero, we derive the savings in net benefits for each scenario by subtracting the total costs of each scenario from the total costs of the business as usual scenario. We do this for every country in this study. Table 4.1 below presents the savings in net benefits of each scenario for each country in this study, and shows that Scenario 2 has the highest savings in net benefits for almost every country.

105
Table 4.1: Net Benefits of Three Scenarios
IN US$ MILLION SAVINGS IN NET BENEFITS OF SCENARIO 1: LIQUID FUEL + RE AND EE
SAVINGS IN NET BENEFITS OF SCENARIO 2: NATURAL GAS + RE AND EE
SAVINGS IN NET BENEFITS OF SCENARIO 3: NATURAL GAS
Dominican Republic 127 691 610
Suriname 15 71 60
Dominica 9 10 3
Haiti 11 70 62
St. Vincent and the Grenadines 2 9 8
St. Kitts and Nevis 5 31 28
Jamaica 48 357 329
Grenada 2 14 13
Antigua and Barbuda 4 27 25
St. Lucia 4 30 27
Guyana 54 59 51
Barbados 12 88 81
The Bahamas 25 186 172
For each scenario we also estimate financial benefits, which are the difference between costs of gener-ating electricity in each scenario—and excluding CO2 emission costs since these are not financial but economic costs. We also estimate electricity cost savings, due to the introduction of EE in some scenarios.
In estimating these costs and benefits, we have used the following assumptions for all scenarios:
• CO2 emissions will be treated as a cost for each scenario
• In the scenarios where EE technologies are introduced, these technologies reduce consump-tion by 5 percent
• Electricity generation in all markets will grow 3% each year
• The cost of CO2 emissions is US$50 per ton9
• A coal-fired power plant emits 1.03 tons per MWh, a diesel-fired power plant emits 0.73 tons per MWh, and a gas-fired power plant emits 0.34 tons per MWh10
• The cost of electricity for each system is calculated as GWh generated, multiplied by the average cost of the electricity system (calculated as explained in section 2.2.3)
9 United Kingdom Department of Energy and Climate Change. 2013: updated short-term traded carbon values. https://www.gov.uk/govern-ment/uploads/system/uploads/attachment_data/file/240095/short-term_traded_carbon_values_used_for_UK_policy_appraisal_2013_FINAL_URN.pdf 10 Castalia calculations

Pre-Feasibility Study of the Potential Market for Natural Gas as a Fuel for Power Generation in the Caribbean106
In this section, we will explain in more detail the costs associated with each scenario.
SCENARIO 0: BUSINESS AS USUAL
Table 4.2 presents the calculations of total cost of this scenario for each country. The table shows how these total costs include the cost of generating electricity as well as the cost of carbon dioxide emis-sions on the current sources of generation.
Table 4.2: Costs of Scenario 0: Business as usual
A B C D E F
ITE
M
TO
TA
L
GE
NE
RA
TIO
N1
(GW
h)
AVE
RA
GE
C
OST
OF
TH
E
SYST
EM
(US$
/KW
H)
TO
TA
L
GE
NE
RA
TIO
N
CO
STS
(US$
MIL
LIO
N)
CO
2
EM
ISSI
ON
S(T
ON
S)
TO
TA
L C
OST
O
F C
O2
EM
ISSI
ON
S(U
S$M
ILL
ION
)
TO
TA
L C
OST
S O
F SC
EN
AR
IO(U
S$M
ILL
ION
)
FORMULA A.0 B.0 C.0=A.0*B.0 D.0 E.0=D.0*50 F.0=C.0+E.0
Dominican Republic
15,170 13.18 2,000 8,411,909 421 2,421
Suriname 1,820 13.91 253 651,036 33 286
Dominica 118 14.83 17 64,457 3 21
Haiti 1,198 15.01 180 699,440 35 215
St. Vincent & Grenadines
163 15.29 25 104,788 5 30
St. Kitts and Nevis 493 15.49 76 345,499 17 94
Jamaica 4,795 15.50 743 3,325,099 166 909
Grenada 224 15.72 35 163,301 8 43
Antigua and Barbuda
378 15.72 59 276,208 14 73
St. Lucia 429 15.72 67 313,350 16 83
Guyana 757 15.72 119 552,614 28 147
Barbados 1,187 15.72 187 866,834 43 230
The Bahamas 2,406 15.72 378 1,756,137 88 466
Source: 1 Annual Reports for BEC (2010), BLPC (2012), DOMLEC (2012), GBPC (2011), GRENLEC (2012), JPS
(2012), LUCELEC (2012), VINLEC (2011); Business Plan for Trinidad and Tobago (2011-2016); National
Energy Policies and Action Plans for Antigua and Barbuda (2010), Bahamas (2010), Nevis (2010), St. Kitts
(2010), and St. Vincent and the Grenadines (2010)
To estimate these costs, we use the following assumptions (in addition to the ones presented in the introduction of this section) to assess the total costs of generation and the total cost of CO2 emissions:

107
• The percentage of installed capacity based on each energy source is the same as the percent-age of electricity generated by each source (refer to Table 2.3 for information regarding the installed capacity by energy source).
• All fuel oil generation is based on low-speed diesel plants using heavy fuel oil (LSD HFO), and the price of fuel is US$80 per barrel
• Five years from now the percentage of electricity generated from each source is the same
The total cost of this Scenario for each country is used to calculate the savings in net benefits of Sce-narios 1, 2 and 3 by using the formula:
Total costs of Scenario 0 –Total cost of Scenario x = Savings in Net benefits of Scenario x
SCENARIO 1: USE OF LIQUID FUEL IN CONJUNCTION WITH RE AND EE
In Scenario 1, countries continue generating electricity with fuel oil as the primary source but increase the amount of RE sources used to generate energy. Countries also increase the use of EE technol-ogies. In addition to the general assumptions listed in the introduction to this section, important as-sumptions that apply to this scenario are:
• A 165 MW hydro plant will come online in Guyana, according to plan
• A 10 MW geothermal plant will come online in Dominica. The plant will account for rough-ly 50 percent of the installed capacity of the system
• In all other countries, RE will increase by:
– Increasing the contribution of solar energy, which will contribute 3 percent more to the energy matrix than the amount it contributes under Scenario 0
– Increasing the contribution of wind energy, which will contribute 1 percent more to the energy matrix than the amount it contributes under Scenario 0

Pre-Feasibility Study of the Potential Market for Natural Gas as a Fuel for Power Generation in the Caribbean108
Table 4.3 below presents the assumed generation matrix for each country under Scenario 1.
Table 4.3: Generation Matrix by Source for Scenario 1: Use of liquid fuel in conjunction with RE and EE
COUNTRY FUEL OIL
GAS COAL HYDRO WIND SOLAR 14 GEOTHER-MAL
Dominican Republic
49% 19% 10% 17% 2% 3% -
Suriname 45% - - 51% 1% 3% -
Dominica 25% - - 25% - - 50%
Haiti 76% - - 20% 1% 3% -
St. Vincent and the Grenadines
84% - - 12% 1% 3% -
St. Kitts and Nevis 92% - - - 5% 3% -
Jamaica 91% - - 3% 3% 3% -
Grenada 96% - - - 1% 3% -
Antigua and Barbuda
96% - - - 1% 3% -
St. Lucia 96% - - - 1% 3% -
Guyana 10% - - 90% - - -
Barbados 96% - - - 1% 3% -
The Bahamas 96% - - - 1% 3% -
We believe that Solar PVs will likely be installed in most countries, so we have assumed that it will be used to generate energy in Scenarios 1 and 2.

109
In this Scenario, fuel oil is still a main source of generation, and contributes between 25 percent and 96 percent to the generation matrix. However, the fact that RE and EE technologies are also used under this scenario helps reduce the cost of generation as well as the cost of total CO2 emissions, which in turn leads to Scenario 1 having lower total costs than Scenario 0. Table 4.4 below presents the costs of Scenario 1.
Table 4.4: Costs of Scenario 1: Use of liquid fuel in conjunction with RE and EE
A B C D E F
ITE
M
TO
TA
L
GE
NE
RA
TIO
N1
(GW
h)
AVE
RA
GE
C
OST
OF
TH
E
SYST
EM
(US$
/KW
H)
TO
TA
L
GE
NE
RA
TIO
N
CO
STS2
(US$
MIL
LIO
N)
CO
2
EM
ISSI
ON
S(T
ON
S)
TO
TA
L C
OST
O
F C
O2
EM
ISSI
ON
S(U
S$M
ILL
ION
)
TO
TA
L C
OST
S O
F SC
EN
AR
IO(U
S$M
ILL
ION
)
FORMULA A.1 B.1 C.1=A.1*B.1 D.1 E.1=D.1*50 F.1=C.1+E.1
Dominican Republic
14,412 13.29 1,915 7,570,491 379 2,293
Suriname 1,729 13.99 242 567,995 28 270
Dominica 112 9.46 11 20,411 1 12
Haiti 1,138 15.09 172 631,244 32 203
St. Vincent & Grenadines
155 15.38 24 95,024 5 29
St. Kitts and Nevis 468 15.57 73 314,548 16 89
Jamaica 4,555 15.58 710 3,025,840 151 861
Grenada 213 15.80 34 148,931 7 41
Antigua and Barbuda
359 15.80 57 251,902 13 69
St. Lucia 408 15.80 64 285,775 14 79
Guyana 719 12.52 90 52,498 3 93
Barbados 1,128 15.80 178 790,553 40 218
The Bahamas 2,285 15.80 361 1,601,597 80 441

Pre-Feasibility Study of the Potential Market for Natural Gas as a Fuel for Power Generation in the Caribbean110
As previously mentioned, we assume that the benefits derived from the reliability of electricity will be the same for all scenarios. Therefore, any net benefits generated from switching to an alternative Scenario (1, 2 or 3), are generated due to the fact that these alternative Scenarios have lower total costs than the business as usual Scenario. Table 4.5 below supports that Scenario 1 has higher net benefits than Scenario 0.
Table 4.5: Benefits of Scenario 1: Use of liquid fuel in conjunction with RE and EE
G H I
ITEM SAVINGS IN NET BENEFITS(US$ MILLION)
FINANCIAL SAVINGS(US$ MILLION)
ENERGY SAVINGS(GWH)
FORMULA G.1=F.0-F.1 H.1=C.0-C.1 I.1=A.0-A.1
Dominican Republic 127 85 759
Suriname 15 11 91
Dominica 9 7 6
Haiti 11 8 60
St. Vincent and the Grenadines 2 1 8
St. Kitts and Nevis 5 3) 25
Jamaica 48 33 240
Grenada 2 2 11
Antigua and Barbuda 4 3 19
St. Lucia 4 3 21
Guyana 54 29 38
Barbados 12 8 59
The Bahamas 25 17 120
As Table 4.5 shows, all countries would perceive savings in terms of net benefits by switching to this Scenario. This means that Scenario 1 is favorable to the business as usual scenario, because it has lower economic and financial costs, which in turn creates economic benefits. Though the savings in net benefits for each country vary considerably—between US$2 million and US$127 million11 —each country does have a higher net benefit under Scenario 1 than under the business as usual scenario.
11 Though the shift in the percent of energy generated by each source is not that great for each country the net benefits in savings vary greatly due to the difference in market size and annual energy sales. For example, in the Dominican Republic there is only a 3 percent decrease in the energy generated based on fuel-oil and a 3 percent increase in the use of solar energy. But, this country has the largest net benefits in Scenario 1 due to the size of its market and the amount of energy it sells.

111
SCENARIO 2: INTRODUCING NATURAL GAS (REPLACING LIQUID FUELS) IN CONJUNCTION WITH RE AND EE
In Scenario 2 all the energy generated based on fuel oil under Scenario 1, will now be generated with natural gas. Additionally, RE and EE technologies will also be used in this scenario. However, considering that the cost of natural gas is lower than the cost of fuel oil, countries will introduce low-er amounts of RE than the amounts introduced under Scenario1. This means that the use of these technologies will vary slightly from what was presented in Scenario 1. Table 4.6 below shows the generation matrix for Scenario 2.
Table 4.6: Generation Matrix by Source for Scenario 2: Introducing natural gas (replacing liquid fuels) in conjunction with RE and EE
COUNTRY FUEL OIL
GAS COAL HYDRO WIND GEOTHER-MAL
SOLAR 15
Dominican Republic
- 71% 10% 17% 1% - 1%
Suriname - 48% - 51% - - 1%
Dominica 25% - 25% - 50%
Haiti - 79% - 20% - - 1%
St. Vincent and the Grenadines
- 87% - 12% - - 1%
St. Kitts and Nevis - 95% - - 4% - 1%
Jamaica - 94% - 3% 2% - 1%
Grenada - 99% - - - - 1%
Antigua and Barbuda
- 99% - - - - 1%
St. Lucia - 99% - - - - 1%
Guyana - 10% - 90% - -
Barbados - 99% - - - - 1%
The Bahamas - 99% - - - - 1%
15 We believe that Solar PVs will likely be installed in most countries, so we have assumed that it will be used to generate energy in Scenarios 1 and 2.
Scenario 2 has a lower total cost than the business as usual Scenario as well as Scenario 1. As ex-plained in Section 2, the average cost of an electricity system using natural gas is lower than that of a system using fuel oil. Therefore, the total costs of generation under Scenario 2 will be lower than the total costs of generation under the previous two scenarios. Additionally, natural gas-fired power plants emit about half the amount of CO2 per kWh than fuel-fired power plants. So, the switch to natural gas reduces the amount and cost of total CO2 emissions as well. Table 4.7 below presents the costs associated with this Scenario.

Pre-Feasibility Study of the Potential Market for Natural Gas as a Fuel for Power Generation in the Caribbean112
Table 4.7: Costs of Scenario 2: Introducing natural gas (replacing liquid fuels) in conjunction with RE and EE
A B C D E F
ITE
M
TO
TA
L
GE
NE
RA
TIO
N1
(GW
H)
AVE
RA
GE
C
OST
OF
TH
E
SYST
EM
(US$
/KW
H)
TO
TA
L
GE
NE
RA
TIO
N
CO
STS2
(US$
MIL
LIO
N)
CO
2
EM
ISSI
ON
S(T
ON
S)
TO
TA
L C
OST
O
F C
O2
EM
ISSI
ON
S(U
S$M
ILL
ION
)
TO
TA
L C
OST
S O
F SC
EN
AR
IO(U
S$M
ILL
ION
)
FORMULA A.2 B.2 C.2=A.2*B.2 D.2 E.2=D.2*50 F.2=C.2+E.2
Dominican Republic
14,412 10.28 1,481 4,963,406 248 1,730
Suriname 1,729 11.61 201 282,182 14 215
Dominica 112 9.00 10 9,507 0.5 11
Haiti 1,138 11.39 130 305,610 15 145
St. Vincent & Grenadines
155 11.99 19 45,838 2 21
St. Kitts and Nevis 468 11.69 55 151,279 8 62
Jamaica 4,555 10.53 479 1,455,756 73 552
Grenada 213 11.96 25 71,533 4 29
Antigua and Barbuda
359 11.20 40 120,991 6 46
St. Lucia 408 11.39 46 137,260 7 53
Guyana 719 12.03 87 24,451 1 88
Barbados 1,128 10.88 123 379,709 19 142
The Bahamas 2,285 10.57 242 769,260 38 280

113
Further, the lower costs of Scenario 2 as compared to Scenario 0 and Scenario 1, explains why Sce-nario 2 has even higher net benefits than the two scenarios presented before (see Table 4.8).
Table 4.8: Benefits of Scenario 2: Introducing natural gas (replacing liquid fuels) in conjunction with RE and EE
G H I
ITEM SAVINGS IN NET BENEFITS(US$ MILLION)
FINANCIAL SAVINGS(US$ MILLION)
ENERGY SAVINGS(GWh)
FORMULA G.2=F.0-F.2 H.2=C.0-C.2 I.2=A.0-A.2
Dominican Republic 691 519 759
Suriname 71 52 91
Dominica 10 7 6
Haiti 70 50 60
St. Vincent and the Grenadines 9 6 8
St. Kitts and Nevis 31 22 25
Jamaica 57 264 240
Grenada 14 10 11
Antigua and Barbuda 27 19 19
St. Lucia 30 21 21
Guyana 59 32 38
Barbados 88 64 59
The Bahamas 186 137 120
The net benefits from Scenario 2 range from US$9 million to US$691 million. These net benefits are substantially higher than the net benefits derived from Scenario 1. So, if there is a switch from the current scenario, Scenario 2 makes more economic sense than Scenario 1.

Pre-Feasibility Study of the Potential Market for Natural Gas as a Fuel for Power Generation in the Caribbean114
SCENARIO 3: INTRODUCING NATURAL GAS (REPLACING LIQUID FUELS)
Scenario 3 is very similar to the business as usual Scenario, with the exception that all energy that is generated based on fuel oil in the business as usual Scenario is generated based on natural gas in Scenario 3. Generation based on other sources, such as coal, hydro and wind, remains the same as the one currently installed. In order to calculate the costs and benefits for this scenario, we assume that five years from now the percentage of electricity generated from each source is the same, with the exception that natural gas will replace almost all fuel oil. Table 4.9 presents the generation matrix we have assumed for Scenario 3
Table 4.9: Generation Matrix by Source for Scenario 3: Introducing natural gas (replacing liquid fuels)
COUNTRY FUEL OIL
GAS COAL HYDRO WIND GEOTHER-MAL
SOLAR
Dominican Republic
- 72% 10% 17% 1% - -
Suriname - 49% - 51% - - -
Dominica 75% - 25% - - -
Haiti - 80% - 20% - - -
St. Vincent and the Grenadines
- 88% - 12% - - -
St. Kitts and Nevis - 96% - - 4% - -
Jamaica - 95% - 3% 2% - -
Grenada - - - - - -
Antigua and Barbuda
- - - - - -
St. Lucia - - - - - -
Guyana - - - - - -
Barbados - - - - - -
The Bahamas - - - - - -

115
The generation matrix presented in Table 4.9 indicates that between 49 percent and 100 percent will be generated based on natural gas. The use of natural gas in place of fuel oil, would reduce total generation costs, as well as the amount of CO2 emissions, and therefore reduce the cost of CO2 emis-sions. So, because of the savings in costs of fuel, the total costs of Scenario 3 would be lower than the total costs of the business as usual Scenario. Table 4.10 presents the costs derived from this Scenario.
Table 4.10: Costs of Scenario 3: Introducing natural gas (replacing liquid fuels)
A B C D E F
ITE
M
TO
TA
L
GE
NE
RA
TIO
N1
(GW
h)
AVE
RA
GE
C
OST
OF
TH
E
SYST
EM
(US$
/KW
H)
TO
TA
L
GE
NE
RA
TIO
N
CO
STS2
(US$
MIL
LIO
N)
CO
2
EM
ISSI
ON
S(T
ON
S)
TO
TA
L C
OST
O
F C
O2
EM
ISSI
ON
S3
(US$
MIL
LIO
N)
TO
TA
L C
OST
S O
F SC
EN
AR
IO(U
S$M
ILL
ION
)
FORMULA A.3 B.3 C.3=A.3*B.3 D.3 E.3=D.3*50 F.3=C.3+E.3
Dominican Republic
15,170 10.19 1,546 5,276,217 264 1,810
Suriname 1,820 11.55 210 303,222 15 225
Dominica 118 13.52 16 30,021 2 17
Haiti 1,198 11.35 136 325,766 16 152
St. Vincent & Grenadines
163 11.96 20 48,805 2 22
St. Kitts and Nevis 493 11.67 58 160,917 8 66
Jamaica 4,795 10.49 503 1,548,676 77 580
Grenada 224 11.94 27 76,058 4 31
Antigua and Barbuda
378 11.18 42 128,645 6 49
St. Lucia 429 11.37 49 145,944 7 56
Guyana 757 10.88 82 257,382 13 95
Barbados 1,187 10.85 129 403,731 20 149
The Bahamas 2,406 10.54 253 817,927 41 294

Pre-Feasibility Study of the Potential Market for Natural Gas as a Fuel for Power Generation in the Caribbean116
Though Scenario 3 has lower costs than Scenario 1, it has higher costs than Scenario 2. For this rea-son, the net benefits generated by this Scenario will not be as high as those generated under Scenario 2 (see Table 4.11).
Table 4.11: Benefits Analysis of Scenario 3: Introducing natural gas (replacing liquid fuels)
G H I
ITEM SAVINGS IN NET BENEFITS(US$ MILLION)
FINANCIAL SAVINGS(US$ MILLION)
ENERGY SAVINGS(GWh)
FORMULA G.3=F.0-F.3 H.3=C.0-C.3 I.2=A.3-A.3
Dominican Republic 610 454 -
Suriname 60 43 -
Dominica 3 2 -
Haiti 62 44 -
St. Vincent and the Grenadines 8 5 -
St. Kitts and Nevis 28 19 -
Jamaica 329 240 -
Grenada 13 8 -
Antigua and Barbuda 25 17 -
St. Lucia 27 19 -
Guyana 51 37 -
Barbados 81 58 -
The Bahamas 172 125 -
Upon comparing Scenario 2 and Scenario 3, it is evident that Scenario 2 has higher net benefits, fi-nancial savings and energy savings than Scenario 3 for all countries. But, Scenario 3 does have higher net benefits and financial savings than Scenarios 0 and 1 for all countries. This comparison indicates that, considering the economic savings in net benefits, and assuming that countries chose the option that maximizes their net benefit, all countries would get the highest savings in net benefits by switching to Scenario 2 as an alternative to the business as usual Scenario. This means that it makes the most economic sense to choose Scenario 2 for every country.

117
FACTORS THAT MAY AFFECT THE VIABILITY OF NATURAL GAS AS AN ALTERNATIVE TO FUEL OIL
We have shown throughout this report that switching to natural gas could reduce the cost of service and price of electricity, as well as generate economic benefits. However, it is important to recognize factors that may affect the viability of natural gas as an alternative to fuel oil. These factors include:
• Conflicting “best option” at the country level—Even under a purely economic assessment there may be different options to bring natural gas are optimal for each country in the re-gion. Some countries may benefit more if natural gas is delivered only to one country and gas-fired power is exported to the rest of the region via transmission lines. In contrast, there may be countries that benefit if the pipeline is extended further and they build their own gas-fired power capacity. This inherent conflict in country-level economic interests makes it difficult to reach consensus on a region-wide project
• Sovereignty vs. Regional Coordination—A related challenge to a more coordinated ap-proach is the implicit requirement that each country cede substantial control over their energy supply (whether fuel for their power sector or electricity supply direction) and in-stead rely on their neighbors. The scenarios with a single integrated power market would require a single regulatory regime and centralized dispatch. These institutions cannot operate effectively if each member country has an effective veto. This centralization of control necessarily constrains the member countries’ sovereignty, a prospect that can be politically difficult. The options involving a region-wide pipeline would also require co-ordination and cooperation across all countries along its path, potentially requiring a treaty-level agreement. While countries would not depend on each other for power supply, any country along the pipeline’s route could potentially disrupt the flow of natural gas, leaving each country at the mercy of the countries before it. This dynamic suggests that without a concerted effort from regional institutions or interested outside stakeholders, country-level options would be the quickest route to bringing natural gas to the region. In this way, each country would be able to move at its own pace and focus on its own inter-ests, with minimal coordination with its neighbors.
• Market structure disparities—Each country has its own power market structure, rang-ing from the largely vertically integrated power sector to the more fragmented and mar-ket-based power market. Long-term contracts between generators and off-takers can vary dramatically from prevailing spot market prices, making it difficult for new generators to enter the market and compete effectively. In a similar way, contracts between fuel sup-pliers and power generators can vary from prevailing global fuel markets (a prominent example are the favorable financing terms the Venezuela provides to members of its Pet-roCaribe program).

Pre-Feasibility Study of the Potential Market for Natural Gas as a Fuel for Power Generation in the Caribbean118
In addition to these examples, it is worth noting that there would be a need to address what to do with the existing diesel-fired plants. It is not realistic to assume that utilities will stop using all their diesel-fired plants overnight. In fact, most utilities will probably still need diesel back up plants, and will continue to generate a small percentage of the total based on fuel oil (so we did not consider this in our cost benefit analysis). It is possible to convert fuel-oil fired power plants to burn on natural gas. Though there would be a capital cost associated with that, and a potential change in efficiency. This should be however, less expensive than replacing the existing capacity with new units.
Lastly, it is important to keep in mind that natural gas is a viable option based on current prices rela-tive to those of oil. However, considering that recently regional gas prices have reflected the effect of different drivers than those of global oil prices, it is possible that the cost of natural gas could increase to a level where it would no longer be lower than that of fuel oil. In other words, a rise in gas prices at current oil prices, or a drop in oil prices at current gas prices, would undermine the economic benefits of switching to natural gas. Therefore, it is important to carefully assess this risk in the analysis of any potential natural gas projects in the Caribbean.

119

Pre-Feasibility Study of the Potential Market for Natural Gas as a Fuel for Power Generation in the Caribbean120

APPENDIX

Pre-Feasibility Study of the Potential Market for Natural Gas as a Fuel for Power Generation in the Caribbean122
APPENDIX A: TRANSPORTATION ROUTE MAPS
The maps below show the seaborne routes that were created in Google Earth to measure the distanc-es between each potential regional supply source and the identified Caribbean destination ports. The maps are organized based on supply source.
Figure A.1: Shipping routes from U.S. Gulf Coast (Sabine Pass)

123
Figure A.2: Shipping routes from Southern Florida (West Palm Beach)
Figure A.3: Shipping routes from Altamira, Mexico

Pre-Feasibility Study of the Potential Market for Natural Gas as a Fuel for Power Generation in the Caribbean124
Figure A.4: Shipping routes from Point Fortin, Trinidad

125
Figure A.5: Shipping routes from Guiria, Venezuela

Pre-Feasibility Study of the Potential Market for Natural Gas as a Fuel for Power Generation in the Caribbean126
Figure A.6: Shipping routes from Coveñas, Colombia

127
Figure A.7: Shipping routes from Peru LNG

Pre-Feasibility Study of the Potential Market for Natural Gas as a Fuel for Power Generation in the Caribbean128
APPENDIX B: COUNTRY LEVEL NATURAL GAS DELIVERED PRICE CHARTS
Bahamas: Delivered Natural Gas Price
US$ per MMBtu
6,00 8,50 11,00 13,50 16,00
Pipe
line
Rout
esCN
G So
urce
Coun
try
LNG
Sour
ce Co
untr
y Peru Peru LNGColombia CovenaVenezuela Guiria
Trinidad Point FortinMexico Altamira
United States S. FloridaUnited States Sabine Pass
Peru Peru LNGColombia CovenaVenezuela Guiria
Trinidad Point FortinMexico Altamira
United States S. FloridaUnited States Sabine Pass
Venezuela - SurinameTrinidad - SurinameVenezuela - Guyana
Trinidad - GuyanaT&T/VZ - Puerto Rico w/ Barbados
T&T/VZ - Puerto Rico T&T/VZ - Antigua & Barbuda w/ Barbados
T&T/VZ - Antigua & BarbudaT&T/VZ - St. Lucia w/ Barbados
T&T/VZ - St. Lucia Tobago - Barbados
Dominican Republic - HaitiColombia - Dominican Republic
Colombia - HaitiColombia - Jamaica
S. Florida - Bahamas
Jamaica: Delivered Natural Gas Price
US$ per MMBtu
6,00 8,50 11,00 13,50 16,00
Pipe
line
Rout
esCN
G So
urce
Coun
try
LNG
Sour
ce Co
untr
y Peru Peru LNGColombia CovenaVenezuela Guiria
Trinidad Point FortinMexico Altamira
United States S. FloridaUnited States Sabine Pass
Peru Peru LNGColombia CovenaVenezuela Guiria
Trinidad Point FortinMexico Altamira
United States S. FloridaUnited States Sabine Pass
Venezuela - SurinameTrinidad - SurinameVenezuela - Guyana
Trinidad - GuyanaT&T/VZ - Puerto Rico w/ Barbados
T&T/VZ - Puerto Rico T&T/VZ - Antigua & Barbuda w/ Barbados
T&T/VZ - Antigua & BarbudaT&T/VZ - St. Lucia w/ Barbados
T&T/VZ - St. Lucia Tobago - Barbados
Dominican Republic - HaitiColombia - Dominican Republic
Colombia - HaitiColombia - Jamaica
S. Florida - Bahamas

129
Haiti: Delivered Natural Gas Price
US$ per MMBtu
0,00 4,00 8,00 12,00 16,00
Pipe
line
Rout
esCN
G So
urce
Coun
try
LNG
Sour
ce Co
untr
y Peru Peru LNGColombia CovenaVenezuela Guiria
Trinidad Point FortinMexico Altamira
United States S. FloridaUnited States Sabine Pass
Peru Peru LNGColombia CovenaVenezuela Guiria
Trinidad Point FortinMexico Altamira
United States S. FloridaUnited States Sabine Pass
Venezuela - SurinameTrinidad - SurinameVenezuela - Guyana
Trinidad - GuyanaT&T/VZ - Puerto Rico w/ Barbados
T&T/VZ - Puerto Rico T&T/VZ - Antigua & Barbuda w/ Barbados
T&T/VZ - Antigua & BarbudaT&T/VZ - St. Lucia w/ Barbados
T&T/VZ - St. Lucia Tobago - Barbados
Dominican Republic - HaitiColombia - Dominican Republic
Colombia - HaitiColombia - Jamaica
S. Florida - Bahamas
Dominican Republic: Delivered Natural Gas Price
US$ per MMBtu
0,00 4,00 8,00 12,00 16,00
Pipe
line
Rout
esCN
G So
urce
Coun
try
LNG
Sour
ce Co
untr
y Peru Peru LNGColombia CovenaVenezuela Guiria
Trinidad Point FortinMexico Altamira
United States S. FloridaUnited States Sabine Pass
Peru Peru LNGColombia CovenaVenezuela Guiria
Trinidad Point FortinMexico Altamira
United States S. FloridaUnited States Sabine Pass
Venezuela - SurinameTrinidad - SurinameVenezuela - Guyana
Trinidad - GuyanaT&T/VZ - Puerto Rico w/ Barbados
T&T/VZ - Puerto Rico T&T/VZ - Antigua & Barbuda w/ Barbados
T&T/VZ - Antigua & BarbudaT&T/VZ - St. Lucia w/ Barbados
T&T/VZ - St. Lucia Tobago - Barbados
Dominican Republic - HaitiColombia - Dominican Republic
Colombia - HaitiColombia - Jamaica
S. Florida - Bahamas

Pre-Feasibility Study of the Potential Market for Natural Gas as a Fuel for Power Generation in the Caribbean130
Grenada: Delivered Natural Gas Price
US$ per MMBtu
0,00 4,00 8,00 12,00 16,00
Pipe
line
Rout
esCN
G So
urce
Coun
try
LNG
Sour
ce Co
untr
y Peru Peru LNGColombia CovenaVenezuela Guiria
Trinidad Point FortinMexico Altamira
United States S. FloridaUnited States Sabine Pass
Peru Peru LNGColombia CovenaVenezuela Guiria
Trinidad Point FortinMexico Altamira
United States S. FloridaUnited States Sabine Pass
Venezuela - SurinameTrinidad - SurinameVenezuela - Guyana
Trinidad - GuyanaT&T/VZ - Puerto Rico w/ Barbados
T&T/VZ - Puerto Rico T&T/VZ - Antigua & Barbuda w/ Barbados
T&T/VZ - Antigua & BarbudaT&T/VZ - St. Lucia w/ Barbados
T&T/VZ - St. Lucia Tobago - Barbados
Dominican Republic - HaitiColombia - Dominican Republic
Colombia - HaitiColombia - Jamaica
S. Florida - Bahamas
St. Vincent and the Grenadines: Delivered Natural Gas Price
US$ per MMBtu
0,00 4,00 8,00 12,00 16,00
Pipe
line
Rout
esCN
G So
urce
Coun
try
LNG
Sour
ce Co
untr
y Peru Peru LNGColombia CovenaVenezuela Guiria
Trinidad Point FortinMexico Altamira
United States S. FloridaUnited States Sabine Pass
Peru Peru LNGColombia CovenaVenezuela Guiria
Trinidad Point FortinMexico Altamira
United States S. FloridaUnited States Sabine Pass
Venezuela - SurinameTrinidad - SurinameVenezuela - Guyana
Trinidad - GuyanaT&T/VZ - Puerto Rico w/ Barbados
T&T/VZ - Puerto Rico T&T/VZ - Antigua & Barbuda w/ Barbados
T&T/VZ - Antigua & BarbudaT&T/VZ - St. Lucia w/ Barbados
T&T/VZ - St. Lucia Tobago - Barbados
Dominican Republic - HaitiColombia - Dominican Republic
Colombia - HaitiColombia - Jamaica
S. Florida - Bahamas

131
Barbados: Delivered Natural Gas Price
US$ per MMBtu
0,00 4,00 8,00 12,00 16,00
Pipe
line
Rout
esCN
G So
urce
Coun
try
LNG
Sour
ce Co
untr
y Peru Peru LNGColombia CovenaVenezuela Guiria
Trinidad Point FortinMexico Altamira
United States S. FloridaUnited States Sabine Pass
Peru Peru LNGColombia CovenaVenezuela Guiria
Trinidad Point FortinMexico Altamira
United States S. FloridaUnited States Sabine Pass
Venezuela - SurinameTrinidad - SurinameVenezuela - Guyana
Trinidad - GuyanaT&T/VZ - Puerto Rico w/ Barbados
T&T/VZ - Puerto Rico T&T/VZ - Antigua & Barbuda w/ Barbados
T&T/VZ - Antigua & BarbudaT&T/VZ - St. Lucia w/ Barbados
T&T/VZ - St. Lucia Tobago - Barbados
Dominican Republic - HaitiColombia - Dominican Republic
Colombia - HaitiColombia - Jamaica
S. Florida - Bahamas
St. Lucia: Delivered Natural Gas Price
US$ per MMBtu
0,00 4,00 8,00 12,00 16,00
Pipe
line
Rout
esCN
G So
urce
Coun
try
LNG
Sour
ce Co
untr
y Peru Peru LNGColombia CovenaVenezuela Guiria
Trinidad Point FortinMexico Altamira
United States S. FloridaUnited States Sabine Pass
Peru Peru LNGColombia CovenaVenezuela Guiria
Trinidad Point FortinMexico Altamira
United States S. FloridaUnited States Sabine Pass
Venezuela - SurinameTrinidad - SurinameVenezuela - Guyana
Trinidad - GuyanaT&T/VZ - Puerto Rico w/ Barbados
T&T/VZ - Puerto Rico T&T/VZ - Antigua & Barbuda w/ Barbados
T&T/VZ - Antigua & BarbudaT&T/VZ - St. Lucia w/ Barbados
T&T/VZ - St. Lucia Tobago - Barbados
Dominican Republic - HaitiColombia - Dominican Republic
Colombia - HaitiColombia - Jamaica
S. Florida - Bahamas

Pre-Feasibility Study of the Potential Market for Natural Gas as a Fuel for Power Generation in the Caribbean132
Dominica: Delivered Natural Gas Price
US$ per MMBtu
0,00 4,00 8,00 12,00 16,00
Pipe
line
Rout
esCN
G So
urce
Coun
try
LNG
Sour
ce Co
untr
y Peru Peru LNGColombia CovenaVenezuela Guiria
Trinidad Point FortinMexico Altamira
United States S. FloridaUnited States Sabine Pass
Peru Peru LNGColombia CovenaVenezuela Guiria
Trinidad Point FortinMexico Altamira
United States S. FloridaUnited States Sabine Pass
Venezuela - SurinameTrinidad - SurinameVenezuela - Guyana
Trinidad - GuyanaT&T/VZ - Puerto Rico w/ Barbados
T&T/VZ - Puerto Rico T&T/VZ - Antigua & Barbuda w/ Barbados
T&T/VZ - Antigua & BarbudaT&T/VZ - St. Lucia w/ Barbados
T&T/VZ - St. Lucia Tobago - Barbados
Dominican Republic - HaitiColombia - Dominican Republic
Colombia - HaitiColombia - Jamaica
S. Florida - Bahamas
Antigua & Barbuda: Delivered Natural Gas Price
US$ per MMBtu
0,00 4,00 8,00 12,00 16,00
Pipe
line
Rout
esCN
G So
urce
Coun
try
LNG
Sour
ce Co
untr
y Peru Peru LNGColombia CovenaVenezuela Guiria
Trinidad Point FortinMexico Altamira
United States S. FloridaUnited States Sabine Pass
Peru Peru LNGColombia CovenaVenezuela Guiria
Trinidad Point FortinMexico Altamira
United States S. FloridaUnited States Sabine Pass
Venezuela - SurinameTrinidad - SurinameVenezuela - Guyana
Trinidad - GuyanaT&T/VZ - Puerto Rico w/ Barbados
T&T/VZ - Puerto Rico T&T/VZ - Antigua & Barbuda w/ Barbados
T&T/VZ - Antigua & BarbudaT&T/VZ - St. Lucia w/ Barbados
T&T/VZ - St. Lucia Tobago - Barbados
Dominican Republic - HaitiColombia - Dominican Republic
Colombia - HaitiColombia - Jamaica
S. Florida - Bahamas

133
St. Kitts & Nevis: Delivered Natural Gas Price
US$ per MMBtu
0,00 4,00 8,00 12,00 16,00
Pipe
line
Rout
esCN
G So
urce
Coun
try
LNG
Sour
ce Co
untr
y Peru Peru LNGColombia CovenaVenezuela Guiria
Trinidad Point FortinMexico Altamira
United States S. FloridaUnited States Sabine Pass
Peru Peru LNGColombia CovenaVenezuela Guiria
Trinidad Point FortinMexico Altamira
United States S. FloridaUnited States Sabine Pass
Venezuela - SurinameTrinidad - SurinameVenezuela - Guyana
Trinidad - GuyanaT&T/VZ - Puerto Rico w/ Barbados
T&T/VZ - Puerto Rico T&T/VZ - Antigua & Barbuda w/ Barbados
T&T/VZ - Antigua & BarbudaT&T/VZ - St. Lucia w/ Barbados
T&T/VZ - St. Lucia Tobago - Barbados
Dominican Republic - HaitiColombia - Dominican Republic
Colombia - HaitiColombia - Jamaica
S. Florida - Bahamas
Guyana: Delivered Natural Gas Price
US$ per MMBtu
0,00 4,00 8,00 12,00 16,00
Pipe
line
Rout
esCN
G So
urce
Coun
try
LNG
Sour
ce Co
untr
y Peru Peru LNGColombia CovenaVenezuela Guiria
Trinidad Point FortinMexico Altamira
United States S. FloridaUnited States Sabine Pass
Peru Peru LNGColombia CovenaVenezuela Guiria
Trinidad Point FortinMexico Altamira
United States S. FloridaUnited States Sabine Pass
Venezuela - SurinameTrinidad - SurinameVenezuela - Guyana
Trinidad - GuyanaT&T/VZ - Puerto Rico w/ Barbados
T&T/VZ - Puerto Rico T&T/VZ - Antigua & Barbuda w/ Barbados
T&T/VZ - Antigua & BarbudaT&T/VZ - St. Lucia w/ Barbados
T&T/VZ - St. Lucia Tobago - Barbados
Dominican Republic - HaitiColombia - Dominican Republic
Colombia - HaitiColombia - Jamaica
S. Florida - Bahamas

Pre-Feasibility Study of the Potential Market for Natural Gas as a Fuel for Power Generation in the Caribbean134
Suriname: Delivered Natural Gas Price
US$ per MMBtu
0,00 4,00 8,00 12,00 16,00
Pipe
line
Rout
esCN
G So
urce
Coun
try
LNG
Sour
ce Co
untr
y Peru Peru LNGColombia CovenaVenezuela Guiria
Trinidad Point FortinMexico Altamira
United States S. FloridaUnited States Sabine Pass
Peru Peru LNGColombia CovenaVenezuela Guiria
Trinidad Point FortinMexico Altamira
United States S. FloridaUnited States Sabine Pass
Venezuela - SurinameTrinidad - SurinameVenezuela - Guyana
Trinidad - GuyanaT&T/VZ - Puerto Rico w/ Barbados
T&T/VZ - Puerto Rico T&T/VZ - Antigua & Barbuda w/ Barbados
T&T/VZ - Antigua & BarbudaT&T/VZ - St. Lucia w/ Barbados
T&T/VZ - St. Lucia Tobago - Barbados
Dominican Republic - HaitiColombia - Dominican Republic
Colombia - HaitiColombia - Jamaica
S. Florida - Bahamas

135
Bahamas: Long-Run Marginal Cost of Power
U.S. Cents per kWh
9,00 11,75 14,50 17,25 20,00
Pipe
line
Rout
esCN
G So
urce
Coun
try
LNG
Sour
ce Co
untr
y Peru Peru LNGColombia CovenaVenezuela Guiria
Trinidad Point FortinMexico Altamira
United States S. FloridaUnited States Sabine Pass
Peru Peru LNGColombia CovenaVenezuela Guiria
Trinidad Point FortinMexico Altamira
United States S. FloridaUnited States Sabine Pass
Venezuela - SurinameTrinidad - SurinameVenezuela - Guyana
Trinidad - GuyanaT&T/VZ - Puerto Rico w/ Barbados
T&T/VZ - Puerto Rico T&T/VZ - Antigua & Barbuda w/ Barbados
T&T/VZ - Antigua & BarbudaT&T/VZ - St. Lucia w/ Barbados
T&T/VZ - St. Lucia Tobago - Barbados
Dominican Republic - HaitiColombia - Dominican Republic
Colombia - HaitiColombia - Jamaica
S. Florida - Bahamas
Jamaica: Long-Run Marginal Cost of Power
U.S. Cents per kWh
9,00 11,75 14,50 17,25 20,00
Pipe
line
Rout
esCN
G So
urce
Coun
try
LNG
Sour
ce Co
untr
y Peru Peru LNGColombia CovenaVenezuela Guiria
Trinidad Point FortinMexico Altamira
United States S. FloridaUnited States Sabine Pass
Peru Peru LNGColombia CovenaVenezuela Guiria
Trinidad Point FortinMexico Altamira
United States S. FloridaUnited States Sabine Pass
Venezuela - SurinameTrinidad - SurinameVenezuela - Guyana
Trinidad - GuyanaT&T/VZ - Puerto Rico w/ Barbados
T&T/VZ - Puerto Rico T&T/VZ - Antigua & Barbuda w/ Barbados
T&T/VZ - Antigua & BarbudaT&T/VZ - St. Lucia w/ Barbados
T&T/VZ - St. Lucia Tobago - Barbados
Dominican Republic - HaitiColombia - Dominican Republic
Colombia - HaitiColombia - Jamaica
S. Florida - Bahamas
APPENDIX C: COUNTRY LEVEL LONG-RUN MARGINAL COST OF POWER GENERATION CHARTS

Pre-Feasibility Study of the Potential Market for Natural Gas as a Fuel for Power Generation in the Caribbean136
Pipe
line
Rout
esCN
G So
urce
Coun
try
LNG
Sour
ce Co
untr
y Peru Peru LNGColombia CovenaVenezuela Guiria
Trinidad Point FortinMexico Altamira
United States S. FloridaUnited States Sabine Pass
Peru Peru LNGColombia CovenaVenezuela Guiria
Trinidad Point FortinMexico Altamira
United States S. FloridaUnited States Sabine Pass
Venezuela - SurinameTrinidad - SurinameVenezuela - Guyana
Trinidad - GuyanaT&T/VZ - Puerto Rico w/ Barbados
T&T/VZ - Puerto Rico T&T/VZ - Antigua & Barbuda w/ Barbados
T&T/VZ - Antigua & BarbudaT&T/VZ - St. Lucia w/ Barbados
T&T/VZ - St. Lucia Tobago - Barbados
Dominican Republic - HaitiColombia - Dominican Republic
Colombia - HaitiColombia - Jamaica
S. Florida - Bahamas
Haiti: Long-Run Marginal Cost of Power
U.S. Cents per kWh
0,00 5,00 10,00 15,00 20,00
Dominican Republic: Long-Run Marginal Cost of Power
U.S. Cents per kWh
9,00 11,75 14,50 17,25 20,00
Pipe
line
Rout
esCN
G So
urce
Coun
try
LNG
Sour
ce Co
untr
y Peru Peru LNGColombia CovenaVenezuela Guiria
Trinidad Point FortinMexico Altamira
United States S. FloridaUnited States Sabine Pass
Peru Peru LNGColombia CovenaVenezuela Guiria
Trinidad Point FortinMexico Altamira
United States S. FloridaUnited States Sabine Pass
Venezuela - SurinameTrinidad - SurinameVenezuela - Guyana
Trinidad - GuyanaT&T/VZ - Puerto Rico w/ Barbados
T&T/VZ - Puerto Rico T&T/VZ - Antigua & Barbuda w/ Barbados
T&T/VZ - Antigua & BarbudaT&T/VZ - St. Lucia w/ Barbados
T&T/VZ - St. Lucia Tobago - Barbados
Dominican Republic - HaitiColombia - Dominican Republic
Colombia - HaitiColombia - Jamaica
S. Florida - Bahamas

137
Grenada: Long-Run Marginal Cost of Power
U.S. Cents per kWh
0,00 5,00 10,00 15,00 20,00
Peru Peru LNGColombia CovenaVenezuela Guiria
Trinidad Point FortinMexico Altamira
United States S. FloridaUnited States Sabine Pass
Peru Peru LNGColombia CovenaVenezuela Guiria
Trinidad Point FortinMexico Altamira
United States S. FloridaUnited States Sabine Pass
Venezuela - SurinameTrinidad - SurinameVenezuela - Guyana
Trinidad - GuyanaT&T/VZ - Puerto Rico w/ Barbados
T&T/VZ - Puerto Rico T&T/VZ - Antigua & Barbuda w/ Barbados
T&T/VZ - Antigua & BarbudaT&T/VZ - St. Lucia w/ Barbados
T&T/VZ - St. Lucia Tobago - Barbados
Dominican Republic - HaitiColombia - Dominican Republic
Colombia - HaitiColombia - Jamaica
S. Florida - Bahamas
St. Vincent and the Grenadines: Long-Run Marginal Cost of Power
U.S. Cents per kWh
0,00 5,00 10,00 15,00 20,00
Pipe
line
Rout
esCN
G So
urce
Coun
try
LNG
Sour
ce Co
untr
y Peru Peru LNGColombia CovenaVenezuela Guiria
Trinidad Point FortinMexico Altamira
United States S. FloridaUnited States Sabine Pass
Peru Peru LNGColombia CovenaVenezuela Guiria
Trinidad Point FortinMexico Altamira
United States S. FloridaUnited States Sabine Pass
Venezuela - SurinameTrinidad - SurinameVenezuela - Guyana
Trinidad - GuyanaT&T/VZ - Puerto Rico w/ Barbados
T&T/VZ - Puerto Rico T&T/VZ - Antigua & Barbuda w/ Barbados
T&T/VZ - Antigua & BarbudaT&T/VZ - St. Lucia w/ Barbados
T&T/VZ - St. Lucia Tobago - Barbados
Dominican Republic - HaitiColombia - Dominican Republic
Colombia - HaitiColombia - Jamaica
S. Florida - Bahamas
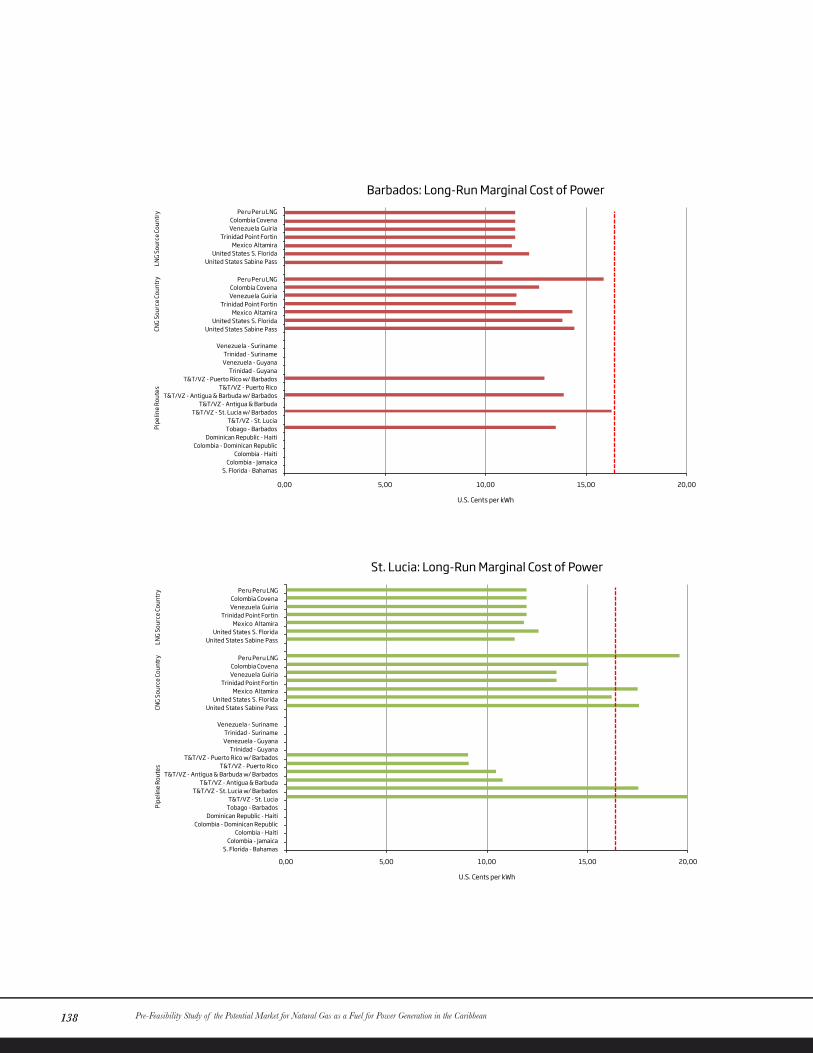
Pre-Feasibility Study of the Potential Market for Natural Gas as a Fuel for Power Generation in the Caribbean138
Barbados: Long-Run Marginal Cost of Power
U.S. Cents per kWh
0,00 5,00 10,00 15,00 20,00
Pipe
line
Rout
esCN
G So
urce
Coun
try
LNG
Sour
ce Co
untr
y Peru Peru LNGColombia CovenaVenezuela Guiria
Trinidad Point FortinMexico Altamira
United States S. FloridaUnited States Sabine Pass
Peru Peru LNGColombia CovenaVenezuela Guiria
Trinidad Point FortinMexico Altamira
United States S. FloridaUnited States Sabine Pass
Venezuela - SurinameTrinidad - SurinameVenezuela - Guyana
Trinidad - GuyanaT&T/VZ - Puerto Rico w/ Barbados
T&T/VZ - Puerto Rico T&T/VZ - Antigua & Barbuda w/ Barbados
T&T/VZ - Antigua & BarbudaT&T/VZ - St. Lucia w/ Barbados
T&T/VZ - St. Lucia Tobago - Barbados
Dominican Republic - HaitiColombia - Dominican Republic
Colombia - HaitiColombia - Jamaica
S. Florida - Bahamas
St. Lucia: Long-Run Marginal Cost of Power
U.S. Cents per kWh
0,00 5,00 10,00 15,00 20,00
Pipe
line
Rout
esCN
G So
urce
Coun
try
LNG
Sour
ce Co
untr
y Peru Peru LNGColombia CovenaVenezuela Guiria
Trinidad Point FortinMexico Altamira
United States S. FloridaUnited States Sabine Pass
Peru Peru LNGColombia CovenaVenezuela Guiria
Trinidad Point FortinMexico Altamira
United States S. FloridaUnited States Sabine Pass
Venezuela - SurinameTrinidad - SurinameVenezuela - Guyana
Trinidad - GuyanaT&T/VZ - Puerto Rico w/ Barbados
T&T/VZ - Puerto Rico T&T/VZ - Antigua & Barbuda w/ Barbados
T&T/VZ - Antigua & BarbudaT&T/VZ - St. Lucia w/ Barbados
T&T/VZ - St. Lucia Tobago - Barbados
Dominican Republic - HaitiColombia - Dominican Republic
Colombia - HaitiColombia - Jamaica
S. Florida - Bahamas

139
Dominica: Long-Run Marginal Cost of Power
U.S. Cents per kWh
0,00 5,00 10,00 15,00 20,00
Pipe
line
Rout
esCN
G So
urce
Coun
try
LNG
Sour
ce Co
untr
y Peru Peru LNGColombia CovenaVenezuela Guiria
Trinidad Point FortinMexico Altamira
United States S. FloridaUnited States Sabine Pass
Peru Peru LNGColombia CovenaVenezuela Guiria
Trinidad Point FortinMexico Altamira
United States S. FloridaUnited States Sabine Pass
Venezuela - SurinameTrinidad - SurinameVenezuela - Guyana
Trinidad - GuyanaT&T/VZ - Puerto Rico w/ Barbados
T&T/VZ - Puerto Rico T&T/VZ - Antigua & Barbuda w/ Barbados
T&T/VZ - Antigua & BarbudaT&T/VZ - St. Lucia w/ Barbados
T&T/VZ - St. Lucia Tobago - Barbados
Dominican Republic - HaitiColombia - Dominican Republic
Colombia - HaitiColombia - Jamaica
S. Florida - Bahamas
Antigua & Barbuda: Long-Run Marginal Cost of Power
U.S. Cents per kWh
0,00 5,00 10,00 15,00 20,00

Pre-Feasibility Study of the Potential Market for Natural Gas as a Fuel for Power Generation in the Caribbean140
St. Kitts and Nevis: Long-Run Marginal Cost of Power
U.S. Cents per kWh
0,00 5,00 10,00 15,00 20,00
Pipe
line
Rout
esCN
G So
urce
Coun
try
LNG
Sour
ce Co
untr
y Peru Peru LNGColombia CovenaVenezuela Guiria
Trinidad Point FortinMexico Altamira
United States S. FloridaUnited States Sabine Pass
Peru Peru LNGColombia CovenaVenezuela Guiria
Trinidad Point FortinMexico Altamira
United States S. FloridaUnited States Sabine Pass
Venezuela - SurinameTrinidad - SurinameVenezuela - Guyana
Trinidad - GuyanaT&T/VZ - Puerto Rico w/ Barbados
T&T/VZ - Puerto Rico T&T/VZ - Antigua & Barbuda w/ Barbados
T&T/VZ - Antigua & BarbudaT&T/VZ - St. Lucia w/ Barbados
T&T/VZ - St. Lucia Tobago - Barbados
Dominican Republic - HaitiColombia - Dominican Republic
Colombia - HaitiColombia - Jamaica
S. Florida - Bahamas
Guyana: Long-Run Marginal Cost of Power
U.S. Cents per kWh
0,00 5,00 10,00 15,00 20,00
Pipe
line
Rout
esCN
G So
urce
Coun
try
LNG
Sour
ce Co
untr
y Peru Peru LNGColombia CovenaVenezuela Guiria
Trinidad Point FortinMexico Altamira
United States S. FloridaUnited States Sabine Pass
Peru Peru LNGColombia CovenaVenezuela Guiria
Trinidad Point FortinMexico Altamira
United States S. FloridaUnited States Sabine Pass
Venezuela - SurinameTrinidad - SurinameVenezuela - Guyana
Trinidad - GuyanaT&T/VZ - Puerto Rico w/ Barbados
T&T/VZ - Puerto Rico T&T/VZ - Antigua & Barbuda w/ Barbados
T&T/VZ - Antigua & BarbudaT&T/VZ - St. Lucia w/ Barbados
T&T/VZ - St. Lucia Tobago - Barbados
Dominican Republic - HaitiColombia - Dominican Republic
Colombia - HaitiColombia - Jamaica
S. Florida - Bahamas

141
Suriname: Long-Run Marginal Cost of Power
U.S. Cents per kWh
0,00 5,00 10,00 15,00 20,00
Pipe
line
Rout
esCN
G So
urce
Coun
try
LNG
Sour
ce Co
untr
y Peru Peru LNGColombia CovenaVenezuela Guiria
Trinidad Point FortinMexico Altamira
United States S. FloridaUnited States Sabine Pass
Peru Peru LNGColombia CovenaVenezuela Guiria
Trinidad Point FortinMexico Altamira
United States S. FloridaUnited States Sabine Pass
Venezuela - SurinameTrinidad - SurinameVenezuela - Guyana
Trinidad - GuyanaT&T/VZ - Puerto Rico w/ Barbados
T&T/VZ - Puerto Rico T&T/VZ - Antigua & Barbuda w/ Barbados
T&T/VZ - Antigua & BarbudaT&T/VZ - St. Lucia w/ Barbados
T&T/VZ - St. Lucia Tobago - Barbados
Dominican Republic - HaitiColombia - Dominican Republic
Colombia - HaitiColombia - Jamaica
S. Florida - Bahamas

Pre-Feasibility Study of the Potential Market for Natural Gas as a Fuel for Power Generation in the Caribbean142
APPENDIX D: BIBLIOGRAPHY
Black & Veatch. 2012. Jobs and Economic Benefits of Midstream Infrastructure Development, U.S. Economic Im-pacts through 2035. B&V Project No. 175464, prepared for the INGAA Foundation, Inc.
NERA. 2012. Macroeconomic Impacts of LNG Exports from the United States, prepared for the United States Department of Energy. (Washington, D.C.)
APPENDIX E: COSTS FOR RENEWABLE ENERGY TECHNOLOGY
In this appendix we review the LRMCs of potential renewable energy technologies in the countries of this study. We start the description of each technology by briefly introducing the technology. Next, we provide the estimated costs that we use to derive the LRMC for each technology.
SOLAR PHOTOVOLTAIC
The countries in this study are very well endowed with sunlight, which is the energy resource for solar photovoltaic (PV) systems. Because sunlight is intermittent, solar PV systems—a mature and internationally widespread technology—provide non-firm power, mostly as small or commercial sys-tems distributed on the grid. Capital costs of solar PV systems are expected to fall further, following a downward trend that has brought their generation costs to competitive levels in some countries with high electricity price environment. Conversion efficiency of PV panels is also expected to further im-prove; expected improvements in batteries for backup are more uncertain.
TECHNOLOGY FOR SOLAR PV ENERGY
Solar PV technology transforms solar radiation into electricity. The basic component of a PV system is the PV cell, a semiconductor device that converts solar radiation into direct-current electricity. (‘Conversion efficiency’ is the ratio between the electrical power produced by a solar PV cell and the amount of incident solar energy received per second.) PV cells are interconnected to form a PV panel (or module). PV panels combined with a set of additional application-dependent system components (such as inverters, batteries, electrical components, and mounting systems) form a PV system. PV sys-tems can be used individually, or grouped together in arrays.
There are currently two types of commercial PV modules: wafer-based crystalline silicon (c-Si, which currently represent about 85 to 90 percent of the global annual market ) and thin films. Other tech-nologies, such as advanced thin films, organic cells, and more novel concepts, are being developed, but are not commercially available. The efficiency of solar cells has increased considerably over the past

143
few years, and is expected to increase further, especially for newer types of cells.
There are two categories of wafer-based crystalline silicon modules:
• Monocrystalline modules are made from a single large silicon crystal cut from ingots. This is the most efficient (up to 15 to 20 percent efficiency or more) , but also the most expensive type of solar PV panel
• Polycrystalline modules are cast in ingots of silicon that contain several small silicon crystals. This is the most common type of panel currently available on the market, and is somewhat less efficient (down to 13 to 15 percent efficiency)
Thin film panels are more economical to produce, but less efficient (efficiency ranges from 6 to 12 percent). They include amorphous silicon (a-Si) and micromorph silicon; cadmium-telluride (CdTe); and Copper-Indium-Diselenide (CIS) and Copper-Indium-Gallium-Diselenide (CIGS).
Mounting systems for the panels can be fixed, or integrate a tracking system. Tracking systems tilt panels (along one or two axes) towards the sun to increase exposure to radiation. Tracking systems are a mature technology, and increase the overall efficiency of a panel by over 20 percent (depending on panel type). However, they are more fragile and expensive than fixed mounting systems, and are less cost-benefit justified where the solar resource is good; they are also used to a limited extent in areas prone to hurricanes such as the countries in the Caribbean.
Costs assumptions for solar PV energy
INSTALLED CAPACITY
UNIT CAPITAL COST (US$/KW)
O&M COSTS (US$/KW/YR)
CAPACITY FACTOR (%)
ANNUAL OUTPUT (GWH/YEAR)
LIFETIME (YEARS)
LRMC (US$/KWH)
SOLAR PV (POLYCRYSTALLINE, FIXED, COMMERCIAL)
60kW 3,500 50 21% 0.0108 20 20
SOLAR PV (THIN FILM, FIXED, SMALL)
2kW 4,000 60 21% 0.0036 20 0.29
SOLAR PV (MONOCRYSTALLINE, FIXED, UTILITY)
2MW 3,000 60 23% 4.028 20 0.20
Source: Estimates based on information provided by Comet Systems, Siemens, Salomon Energy.Note: discount rate of 10%
SOLAR WATER HEATING
Unlike solar PV, capital costs of solar thermal energy systems used to heat water—a relatively simple and very mature technology—are already low, making this an even more viable renewable energy option for the countries.

Pre-Feasibility Study of the Potential Market for Natural Gas as a Fuel for Power Generation in the Caribbean144
TECHNOLOGY FOR SOLAR WATER HEATING
The main components of a solar water heater system are the storage tank, and the solar collector. There are two main types of solar collectors utilized for low grade thermal applications:
• Flat plate panels are the most common type of solar collectors. A flat plate collector is an insulated box with a glazed cover, an absorber, and copper pipes. The solar radiation passes through the glazed cover and heats the absorber. The circulation water in the pipes captures the thermal energy. The water can move by natural convection to an elevated tank, or be actively pumped through the collector. The intercept efficiency 1 for flat plate collectors may be as high as 80 percent, but decreases rapidly with the increased difference between the temperature of the heated fluid and the ambient temperature
• Intercept efficiency is defined as the efficiency of the collector in converting solar energy to heat when the average temperature of the panel is equal to the ambient temperature. At intercept efficiency, there are no losses or gains from the environment.
• Evacuated glass tube collectors use shallow glass tubes to reduce the heat loss to the surrounding environment. The absorber is located inside the tube and is heated by the sun radiation passing through the glass. The intercept efficiency of an evacuated tube collector is slightly lower than a flat plate collector. However, the efficiency of the collector is less impacted when the temperature difference between the heated fluid and the surrounding environment increases, therefore maintaining a higher efficiency even with a higher oper-ating temperature. This makes evacuated tube collectors better suited to providing process heating in the temperature range from 80 to 90°C.
In terms of scale, solar water heater systems range from a domestic system for one family storage tank capacity of 50 to 80 gallons and capacity of 1 to 2kW, to a commercial system with storage tank capacity of 1800 to 2600 gallons and capacity of 70 or 100kW. Scale corresponds to the sec-tor—smaller systems are used in the residential sector, while larger ones are used in the commercial and industrial sectors. Commercial applications include in particular hotels and restaurants; indus-trial applications vary greatly—ranging from processing of poultry to horticulture (although this is less likely in warm climates).
Transfer of heat to a hot water system may be done through a ‘solar fluid’ flowing through a tube attached to the absorber plate (or through heat pipes integrated in the solar plates) to fluid contained in a manifold at the top of the collector, which in turn is connected to the storage cylinder by a heat exchanger. The ‘solar fluid’ may contain a non-toxic anti-freeze solution.
1 Intercept efficiency is defined as the efficiency of the collector in converting solar energy to heat when the average temperature of the panel is equal to the ambient temperature. At intercept efficiency, there are no losses or gains from the environment.

145
Costs assumptions for solar water heaters
INSTALLED CAPACITY
UNIT CAPITAL COST (US$/KW)
O&M COSTS (US$/KW/YR)
CAPACITY FACTOR (%)
ANNUAL OUTPUT (GWH/YEAR)
LIFETIME (YEARS)
LRMC (US$/KWH)
SOLAR WATER HEATER (FLAT PLATE, COMMERCIAL) 2
70kW 1,100 24 19% 0.115 20 0.09
SOLAR WATER HEATER (FLAT PLATE, SMALL)
2kW 1,600 20 17% 0.003 20 0.14
Source: Estimate based on data provided by Solar Dynamics for Barbados.Note: discount rate of 10%.
For the assessment, we use cost figures collected from Solar Dynamics, whose systems are being pro-duced in Barbados and exported throughout the region. Estimated generation costs for residential and commercial solar hot water systems are as low as US$0.14 and US$0.09 per kWh, respectively.
WIND ENERGY
Wind energy is a mature technology that provides non-firm energy at both utility scale and distributed scale. Detailed wind resource studies are needed to confirm preliminary estimates in many countries (except Jamaica), and land availability would need to be assured for a period equivalent to plant life-time for actual projects to be developed successfully.
TECHNOLOGY FOR WIND ENERGY
Wind turbines capture with their blades the kinetic energy in surface winds, and use the mechanical power generated by the rotation of the blades to turn a generator, thereby converting kinetic power into electrical energy. Wind turbines are an established, widespread technology that has recently in-creased its penetration worldwide (159GW installed worldwide by end-2009 according to the World Wind Association; a tenfold increase since 1997). Grid systems that have high penetration of wind energy include Denmark (over 19 percent of electricity generation), Spain and Portugal (over 11 per-cent), and Germany and the Republic of Ireland (over 6 percent).
In terms of types of technology, wind turbines come in three-blade or two-blade configurations—three-blade turbines capture more wind energy, but two-blade turbines are more suited to high wind speeds (and their higher rotational speed produces louder noise).
In terms of scale, larger turbines (from 1MW to 5MW) yield more power at relatively lower capital
2 To calculate the cost of a 70 kW system—which is a combination of smaller units) we calculated that it would require twelve of Solar Dynamic’s 160 Gallon, 5.7 kW systems. These are the largest systems that they sell. The cost, therefore, reflects the cost of twelve of those units, sold in Barbados with installation for US$5,190.

Pre-Feasibility Study of the Potential Market for Natural Gas as a Fuel for Power Generation in the Caribbean146
cost, and are preferred whenever it is possible to carry and install them—also because there are high fixed costs for developing a wind farm that must be sustained, regardless of installed capacity.
In terms of location where the technology can be installed, wind turbines can be installed onshore or offshore—the key technological aspect involved in offshore developments concerns the foundations, which are best placed in shallow waters (up to 20 meters) and close to shore (up to 20 kilometers).3
Costs assumptions for wind energy
INSTALLED CAPACITY
UNIT CAPITAL COST (US$/KW)
O&M COSTS (US$/KW/YR)
CAPACITY FACTOR (%)
ANNUAL OUTPUT (GWH/YEAR)
LIFETIME (YEARS)
LRMC (US$/KWH)
WIND ENERGY (850KW ‘CLASS 1’ TURBINES)
3.4MW 1,800 50 30% 8.9 20 0.10
WIND ENERGY (10KW DISTRIBUTED TURBINES)
10kW 6,000 110 20% 0.017 20 0.47
Source: Capital and O&M Costs, lifetime: based on information provided by Vestas (Class 1 turbines), and information from a 10MW wind farm proposed by BL&P in Barbados. Capacity factor: conservative estimate based on a preliminary assessment by Mistaya Engineering of 39-44 percent in Corito and East End.Note: discount rate of 10%.
The estimated LRMC for the utility scale wind farm is US$0.10 per kWh, based on an 850kW ‘Class 1’ turbine with a capacity factor of 30 percent. This is a conservative estimate We adopt for the anal-ysis lacking a detailed estimate. LRMCs of distributed scale turbines, assuming a lower 20 percent capacity factor (since it may be assumed that the best sites would be those for utility scale wind), would be US$0.47 per kWh for a 10kW turbine.
WASTE-BASED ENERGY
Waste-based energy technologies use waste collected by sanitation authorities to produce energy. Technologies belong to three broad categories: landfill gas to energy, waste to energy, and biomass cogeneration.
• Landfill gas to energy harvests the gas created by the action of microorganisms within a landfill after the materials have already been deposited in the landfill. Landfill gas is then combined with various types of technologies (most of them mature) for converting gas to energy. It can be done at both utility scale and distributed scale
• Waste to energy technologies actually use the waste as fuel, before it is put into the landfill. This has the benefit of reducing waste that goes into the landfill
• Cogeneration consists of using fuel to generate both heat and electricity, using combined
3 European Wind Energy Association, Oceans of Opportunity, September 2009.

147
heat and power (CHP) plants. Sugarcane producers in the Caribbean region have been using steam turbine cogeneration plants to burn bagasse, a byproduct of sugarcane har-vesting, since the beginning of the twentieth century. Steam turbine cogeneration plants are a proven, reliable, and cost-effective technology used both at utility scale and for dis-tributed generation.
TECHNOLOGY FOR WASTE-BASED ENERGY
Technologies for landfill gas to energy and waste to energy are proven and commercial. Currently, waste to energy is used in more than 25 countries.4 Several different technologies can be used for con-verting producing waste-based energy. Most processes produce electricity directly through combus-tion, while others produce combustible fuels such as methane, methanol, ethanol, or synthetic fuels.
The key technologies include the following:
• For Landfill gas to energy:
– Internal combustion engines are the most commonly used option for landfill gas energy conversion projects. They have comparatively low capital costs, a high efficiency, and a high degree of standardization
– Gas turbines are most economical for capacities of over 3MW. However, they typ-ically have parasitic energy losses of 17 percent of gross output compared to internal combustion turbines (which have parasitic losses of seven percent). The turndown performance of gas-fed turbines is poor compared to internal combustion engines, and difficulties may occur when they are operated at less than a full load. Other prob-lems include combustion chamber melting, corrosion, and accumulation of deposits on turbine blades
– Fuel cells may become attractive in the future because of their higher energy efficiency, negligible emissions impact, lower maintenance costs, and suitability for all landfill sizes (although previous studies have suggested that fuel cells would be more competitive in small to medium projects5). At present, however, fuel cells re-main uncompetitive with conventional applications, due to economic and technical disadvantages
• For Waste to energy:
– Anaerobic digestion (biogas) consists of a series of processes in which microor-ganisms break down biodegradable material in the absence of oxygen; it is used for industrial or domestic purposes to manage waste and/or to release energy. The tech-
4 Gamma Energy Ltd. http://www.gammaenergy.mu/index.php?item=16&lang=15 United States Department of Energy (1997). Renewable Energy Annual 1996. Chapter 10 – Growth in the Landfill Gas Industry, http://www.p2pays.org/ref/11/10589/chap10.html

Pre-Feasibility Study of the Potential Market for Natural Gas as a Fuel for Power Generation in the Caribbean148
nical expertise required to maintain industrial scale anaerobic digesters coupled with high capital costs and low process efficiencies has limited the level of its industrial application as a waste treatment technology
– Incineration (the combustion of organic material) with energy recovery is the most commonly used waste to energy generation technology. Modern incinerators have de-creased emissions of fine particulate, heavy metals, trace dioxin and acid gas emissions
– Pyrolysis is a thermo-chemical decomposition of organic material at elevated tem-peratures in the absence of oxygen. Pyrolysis is useful for producing combustible fuels: charcoal, biochar, or biofuel
– Plasma arc gasification is an experimental technology that uses an electric cur-rent that passes through a gas (air) to create plasma, a collection of free-moving elec-trons and ions. When plasma gas passes over waste, it causes rapid decomposition of the waste into its primary chemical constituents which is normally a mixture of pre-dominantly carbon monoxide and hydrogen gas, known as syngas. (The extreme heat causes the inorganic portion of the waste to become a liquefied slag, which is cooled and forms a vitrified solid upon exiting the chamber.) The syngas can be combusted in a second stage in order to produce process heat and electricity
• For biomass cogeneration—steam turbines generate electricity as a by-product of heat (steam generation). Water is heated, and turns into steam. Steam spins a turbine that drives an electri-cal generator to produce electricity. After it passes through the turbine, the steam is condensed in a condenser, and recycled to where it was heated—this is known as a “Rankine cycle”.
Costs assumptions for waste-based energy
INSTALLED CAPACITY
UNIT CAPITAL COST (US$/KW)
O&M COSTS (US$/KW/YR)
CAPACITY FACTOR (%)
ANNUAL OUTPUT (GWH/YEAR)
LIFETIME (YEARS)
LRMC (US$/KWH)
LARGE ANAEROBIC DIGESTER/BIOGAS
2MW 3,500 150 85% 14.9 20 0.08
SOLAR PV (THIN FILM, FIXED, SMALL)
270kW 4,000 149 85% 2.01 20 0.09
SOLAR PV (MONOCRYSTALLINE, FIXED, UTILITY)
3MW 3,800 200 85% 22.3 20 0.09
Source: Confidential.Note : discount rate of 10%.

149
GEOTHERMAL ENERGY
Geothermal energy is a mature technology that can provide firm power for base load generation at a competitive cost. However, a good primary resource must be ascertained through exploratory drilling, which is an expensive activity. Due to their volcanic origin, many of the countries in the Caribbean are endowed with geothermal sources. Geothermal potential has been identified in Dominica, Gre-nada, St. Kitts and Nevis, St. Lucia, and Saint Vincent and the Grenadines.
The characteristics of geothermal systems vary widely, but the following components are essential to all geothermal energy development:
• A heat source, at the deepest level. This can be volcanic magma (molten rock); or very hot geothermal water contained in deep sedimentary basins; or deep hot dry rocks (this is actually a misnomer as very few basement rocks are completely dry—generally, however, this term refers to very hot rocks that store little or no water, and through which little or no water can flow)
• An aquifer, above the heat source. The aquifer consists of porous rocks (that is, rocks that store water) that are permeable. Where the heat source consists of hot dry rocks, there is no natural aquifer: an artificial aquifer must be created by fracturing the hot dry rocks and injecting water into the fractures to exploit the heat stored in the hot dry rocks
• Above the aquifer, a relatively impermeable cap rock that seals the aquifer and prevents most geothermal fluids (steam and water) from escaping upwards. Some steam and water do escape naturally through faults in the cap rock forming fumaroles (steam only), hot springs (water only), or geysers (steam and water).
TECHNOLOGY FOR GEOTHERMAL ENERGY
Geothermal energy uses the natural heat of the Earth to generate electrical or thermal energy. This is a particularly attractive renewable energy technology because of its potential to provide firm power at a competitive cost—at least, using conventional technologies, while newer technologies are still not commercially viable:
• Conventional technologies, all of which rely on the presence of water naturally circulating through porous, permeable rock to extract the heat and bring it to the surface. These technol-ogies include dry steam power plants, flash steam power plants, and binary cycle power plants
• Enhanced Geothermal Systems (EGS), where reinjection (or injection) of water into the earth is essential to maintain production at commercially useful levels. Hot Dry Rock (HDR) systems are an emerging type of EGS. Hot Dry Rock geothermal energy systems are still in their experimental stage. This technology is expected to reach commercial stage

Pre-Feasibility Study of the Potential Market for Natural Gas as a Fuel for Power Generation in the Caribbean150
within the next ten years,6 thanks to progress made by recent pilot projects.
Geothermal power plant installations can vary greatly in terms of size, from a few megawatts to 10MW, and up to several hundred megawatts7.
The estimated average LRMC for the large geothermal is US$0.05 per kWh, based on a 100MW plant with a capacity factor of 95 percent. This is an estimate we adopt for the analysis lacking de-tailed estimates at the various potential sites in the Caribbean—actual LRMCs can vary significantly based on the quality of the resource.
HYDROELECTRIC ENERGY
Hydroelectric energy is a mature, well-established renewable energy technology that—provided there is sufficient water available over long periods—can supply firm power for base load generation. Hy-dropower has been developed almost to its full potential in Jamaica; there is some unexploited poten-tial in Dominica, Grenada, Guyana, St. Lucia, and Saint Vincent and the Grenadines.
TECHNOLOGY FOR HYDROELECTRIC ENERGY
Hydropower systems convert the energy from falling or flowing water into electricity. In terms of plant types, hydropower plants come in the following three:
• Conventional or storage plants use a dam to store river water in a reservoir. The reservoir typically has enough capacity to store large quantities of water for compensating seasonal variations in water flow, and providing a constant supply of electricity throughout the year—base load as well as peak load
• Run-of-river plants use the natural flow of a river to generate electricity, and involve little or no water storage—most have none, and therefore only generate electricity when water is available. Run-of-river plants divert the river flow into a pipe leading to electricity generat-ing turbines; and then return water into the river downstream
• Pumped storage plants produce electricity by re-using water, carrying it through differ-ent reservoirs and turbines at different elevations. Pumped storage systems are often used to generate electricity during peak demand. During periods of low electricity demand, excess generation capacity is used to pump water into a higher reservoir. This water is then reused during periods of peak demand.
6 G. Boyle, Renewable Energy—Power for a Sustainable Future (Chapter 9: Geothermal Energy), 20067 National Geothermal Association of the Philippines, Glacier Partners Economics of a 35MW Binary Cycle Geothermal Plant, October 2009, http://ngap.netfirms.com/Tiwi/Tiwi.htm

151
There are two types of turbine technologies: impulse turbines are used in sites with a high head (the difference in height between the incoming water source and the outflow) and high flows, while reac-tion turbines are used in sites with a lower head and lower water flows). In terms of scale, hydropower plants are developed in all sizes—from 1kW to over 10GW, depending on the site.
Costs assumptions for hydroelectric energy
INSTALLED CAPACITY
UNIT CAPITAL COST (US$/KW)
O&M COSTS (US$/KW/YR)
CAPACITY FACTOR (%)
ANNUAL OUTPUT (GWH/YEAR)
LIFETIME (YEARS)
LRMC (US$/KWH)
LARGE CONVENTIONAL HYDRO (GUYANA)
165MW 3,000 250 62% 900 25 0.11
Source: Castalia estimates from work in Latin America and the Caribbean, and MauritiusNote : discount rate of 10%.
The estimated average LRMC for the large conventional hydro is US$0.11 per kWh, based on a planned 165MW plant with a capacity factor of 62 percent in Guyana. Hydropower is very site spe-cific, therefore we adopt this estimate for our analysis since we lack detailed estimates at the various potential sites in the Caribbean.
APPENDIX F: COSTS FOR ENERGY EFFICIENCY TECHNOLOGY
In this section, we present the savings costs of energy efficiency technologies, and key assumptions for determining the potential savings costs for each energy efficiency technology. Technologies in-cluded are:
• Lighting—Compact Fluorescent Lamps (CFLs), T8 Fluorescent Lamps with Occupancy Sensor, T5 High Output Fluorescent Lamps, and LED Street Lighting
• Air Conditioning—Efficient Window A/C Systems, and Efficient Split A/C Systems
• Refrigeration—Efficient Residential Refrigerators, and Efficient Retail Refrigerators (replace-ment of condensing unit)
• Mechanical—Premium Efficiency Motors, Variable Frequency Drives, and Efficient Chillers
• Other efficient appliances—LCD Computer Monitors and Power Monitors.

Pre-Feasibility Study of the Potential Market for Natural Gas as a Fuel for Power Generation in the Caribbean152
KEY ASSUMPTIONS FOR SAVINGS COSTS OF ENERGY EFFICIENCY TECHNOLOGY
In the table below, we summarize the key features of each energy efficiency technology and estimated cost savings compared to a typical baseline.
Table F.1: Key Features of Energy Efficiency Technologies
ENERGY EFFICIENCY MEASURE
APP
LIC
AB
LE
SE
C-
TO
RS*
INST
AL
LE
D C
A-
PAC
ITY
LIF
ET
IME
YE
AR
LY E
NE
RG
Y
SAV
ING
S*
AN
NU
AL
IZE
D
CA
PIT
AL
CO
ST
CA
PIT
AL
CO
ST
RE
CO
VE
RY
FA
C-
TO
R
O&
M C
OST
S***
SAV
ING
S C
OST
(KW) (YEARS) (KWH/YEAR) (US$) (US$/
KWH)(US$/KWH)
(US$/KWH)
Compact Fluorescent Lamps (CFLs)
R, C, I, P
0.015 5 82.1 $1.33 0.016 - 0.02
T8 Fluorescent Lamps w/Occupancy Sensor
C, I, P 0.048 19 116.0 $18.02 0.155 - 0.16
T5 High Output Fluores-cent Lamps
I, P 0.352 16 318.0 $70.30 0.221 - 0.22
LED Street Lighting P 0.059 12 258.4 $73.38 0.284 0.04 0.32
LCD Computer Mon-itors
R, C, I, P
0.040 15 160.0 $39.44 0.247 - 0.25
Efficient Window A/C Systems
R 1.000 15 730.0 $65.74 0.090 - 0.09
Efficient Split A/C Systems
R, C, I, P
1.846 15 2,308.0 $262.95 0.114 - 0.11
Efficient Residential Refrigerators
R 0.105 12 481.8 $146.76 0.305 - 0.30
Efficient Retail Refrigera-tors (Condensing Unit)
C 0.525 15 812.0 $262.95 0.324 - 0.32
Premium Efficiency Motors
I, P 9.846 20 2,191.2 $176.19 0.080 - 0.08
Variable Frequency Drives
I, P 7.178 10 11,687.2 $1,139.22 0.097 0.01 0.10
Efficient Chillers I, P 14.064 20 23,439.8 $4,698.38 0.200 - 0.20
Power Monitors R NA 20 315.6 $11.75 0.037 - 0.04
Weighted Averages 0.86 9.62 1024.47 2% 0.11 0.12
* R=Residential, C=Commercial, I=Industrial, P=Public
** Compared to baseline
*** O&M costs considered only if different (more or less) than under baseline
Source: Sustainable Energy Framework for Barbados, July 2010 (and subsequent updates under the same assignment)

153
THE KEY ITEMS CONTAINED IN TABLE F.1 ARE DEFINED AS FOLLOWS:
KEY FEATURES AND ESTIMATED SAVINGS OF EE MEASURES
Applicable sectors Sectors where the EE measure can be implemented—Residential, Com-mercial, Industrial, and Public
Installed capacity (in Watts) Power of the measure
Baseline replaced The baseline equipment or technology that we assumed to calculate estimated savings
Lifetime (in years) EE measures’ lifetime (where applicable, such as for lighting measures, based on assumed time of use per day and per year)
Energy savings per year (in kWh) Yearly savings compared to the baseline
Annualized Capital Cost The cost of the equipment averaged over the equipment’s lifetime, ac-counting for the discount rate.
Capital Cost Recovery Factor per kWh The cost of capital for each kWh saved in a given year. Represented by the annual capital cost of the equipment divided by the annual energy savings
O&M costs per year (in US$) Annual costs of operating and maintaining the measure costs—only considered if more (or less) than the baseline’s O&M costs
Savings cost (in US$ per kWh) Cost in US$ cents to save 1kWh over the measure’s lifetime, on a NPV basis (ratio of PV of all costs and PV of all kWh saved)

Pre-Feasibility Study of the Potential Market for Natural Gas as a Fuel for Power Generation in the Caribbean154

PRE-FEASIBILITY STUDY OF THE POTENTIAL MARKET FOR NATURAL GAS AS A FUEL FOR POWER GENERATION IN THE CARIBBEAN
TECHNICAL NOTE