Infrared spectra of noble gases (10500 to 13000 A) · INFRARED SPECTRA OF NOBLE GASES (10500 TO...
11
r' U. S. DEPARTMENT OF COMMERCE NATIONAL BUREAU OF STANDARDS RESEARCH PAPER RP781 Part of Journal of Research of the N.ational Bureau of Standards, Volume 14, April 1935 INFRARED SPECTRA OF NOBLE GASES (10500 TO 13000 A) By William F. Meggers ABSTRACT The first spectra of helium, neon, argon, krypton, and xenon, excited by uncon- densed discharges in Geissler tubes, have been explored in the infrared (10500 to 13000 A) with Eastman I- Z photographic plates. In each spectrum new lines hav e been r ecorded , most of which are accounted for as combinations of established terms, thu s confirming the structural analyses of the spectra. Two missing 28 terms are revealed for xenon and possibly one new I-type term each for neon and for argon. Among the stronger lines those which involve accurately determin ed relative terms may serve as preliminary standards of wave length in the infrared. CONTENTS Paga I. Introduction ___ ____ ____ ____ __________________________________ __ 487 II. Wave-length measuremen ts _ _ _ _ ___ _ ___ _ _ __ __ _ __ __ __ ___ __ ___ _ __ ___ 488 TIl. Results _____ ____ __ _____ __ ___________________________________ ___ 488 1. Helium _____ ___ _______ __ _____________________________ ___ 489 2. ___ _____________________________________________ ___ 490 3. Argon __ ______________________________________________ __ _ 492 4. Krypton _ _ _ __ __ __ ___ __ __ __ ___ __ _ _ __ _ __ __ __ __ _ _ ___ __ ___ __ 494 5. JCenon __ ____________ ________________ ____________ _____ ___ 495 6. Impuriti es_ _ ___ _ __ ___ ___ __ _ ___ __ __ __ _ __ ____ __ __ _ __ __ 496 1. INTRODUCTION On I1ccount of the" closed-shell" electron configurl1tions in atoms of the noble gases, these elements are chemically inert, the I1toms have exceptional stability, and their characteristic spectra extend over a very large range of wave lengths. For example, lines I1ssociated with neutral atoms of helium have been recorded photographically in the extreme ultraviolet down to 515 A, and radiometrically in the infrared to 20582 A. Neutral neon gives lines in the extreme ultra- violet (587 to 744 A), but the majority of its lines are distributed throughout the near ultraviolet, visible, and infrared. The first spectra of the noble gases have been inve stigated inten- sively both for theoretical reasons connected with spectral and atomic structure, and for practical purposes, such as the use of monochro- matic radiations as wave-length standards in spectroscopy and as standards of length in metrology. Most of this work has been done photographically since this is the best method for studying the details of a spectrum, but it was greatly handicapped by the limited range of infrared sensitiveness of photographic materials. A great advance was made several years ago when the discovery of new photosensi- tizing dyes 1 displaced this practical limit from about 9000 to approxi- 1 O. E. K. Mees, J.Opt.Soc .Am. 22, 204 (1932); 23, 229 (1933). 487
Transcript of Infrared spectra of noble gases (10500 to 13000 A) · INFRARED SPECTRA OF NOBLE GASES (10500 TO...

r '
U. S. DEPARTMENT OF COMMERCE NATIONAL BUREAU OF STANDARDS
RESEARCH PAPER RP781
Part of Journal of Research of the N.ational Bureau of Standards, Volume 14, April 1935
INFRARED SPECTRA OF NOBLE GASES (10500 TO 13000 A)
By William F. Meggers
ABSTRACT
The first spectra of helium, neon, argon, krypton, and xenon, excited by uncondensed discharges in Geissler tubes, have been explored in the infrared (10500 to 13000 A) with Eastman I- Z photographic plates. In each spectrum new lines have been recorded, most of which are accounted for as combinations of established terms, thus confirming the structural analyses of the spectra. Two missing 28 terms are revealed for xenon and possibly one new I-type term each for neon and for argon. Among the stronger lines those which involve accurately determined relative terms may serve as preliminary standards of wave length in the infrared.
CONTENTS Paga
I. Introduction ___ ____ ____ ____ __________________________________ __ 487 II. Wave-length measuremen ts _ _ _ _ _ _ _ _ _ _ _ _ _ _ _ _ _ _ _ _ _ _ _ _ _ _ _ _ _ _ _ _ _ _ _ _ _ _ 488
TIl. Results _____ ____ __ _____ __ ___________________________________ ___ 488 1. Helium _____ ___ _______ __ _____________________________ ___ 489 2. ~eon ___ _____________________________________________ ___ 490 3. Argon __ ______________________________________________ __ _ 492 4. Krypton _ _ _ _ _ _ _ _ _ _ _ _ _ _ _ _ _ _ _ _ _ _ _ _ _ _ _ _ _ _ _ _ _ _ _ _ _ _ _ _ _ _ _ _ _ _ _ _ 494 5. JCenon __ ____________ ________________ ____________ _____ ___ 495 6. Impurities_ _ _ _ _ _ _ _ _ _ _ _ _ _ _ _ _ _ _ _ _ _ _ _ _ _ _ _ _ _ _ _ _ _ _ _ _ _ _ _ _ _ 496
1. INTRODUCTION
On I1ccount of the" closed-shell" electron configurl1tions in atoms of the noble gases, these elements are chemically inert, the I1toms have exceptional stability, and their characteristic spectra extend over a very large range of wave lengths. For example, lines I1ssociated with neutral atoms of helium have been recorded photographically in the extreme ultraviolet down to 515 A, and radiometrically in the infrared to 20582 A. Neutral neon gives lines in the extreme ultraviolet (587 to 744 A), but the majority of its lines are distributed throughout the near ultraviolet, visible, and infrared.
The first spectra of the noble gases have been investigated intensively both for theoretical reasons connected with spectral and atomic structure, and for practical purposes, such as the use of monochromatic radiations as wave-length standards in spectroscopy and as standards of length in metrology. Most of this work has been done photographically since this is the best method for studying the details of a spectrum, but it was greatly handicapped by the limited range of infrared sensitiveness of photographic materials. A great advance was made several years ago when the discovery of new photosensitizing dyes 1 displaced this practical limit from about 9000 to approxi-
1 O. E. K . Mees, J.Opt.Soc.Am. 22, 204 (1932); 23, 229 (1933). 487
~~~~--------------------------------------~~r--------
488 Journal oj Reseatch of the Nat'ional B'u,reau oj Standards 1101 . II,
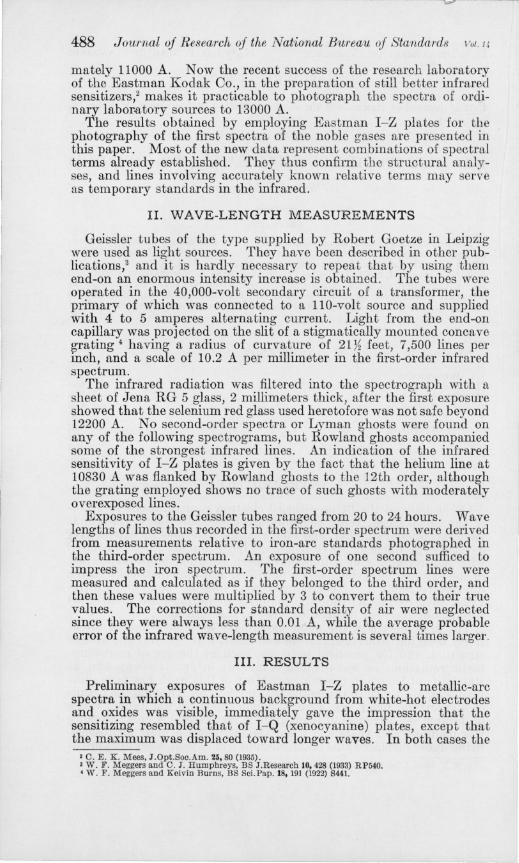
mately 11000 A. Now the recent success of the research laboratory of the Eastman Kodak Co., in the preparation of still better infrared sensitizers/ makes it practicable to photograph the spectra of ordinary labor.atory sources to 13000 A.
The results obtained by employing Eastman I- Z plates for the photography of the first spectra of the noble gases are presented in this paper. Most of the new data represent combinations of spectral terms already established. They thus confirm the structural analyses, and lines involving accurately known relative terms may serve as temporary standards in the infrared.
II. WAVE-LENGTH MEASUREMENTS
Geissler tubes of the type supplied by Robert Goetze in Leipzig were used as light sources. They have been described in other publications,3 and it is hardly necessary to repeat that. by using them end-on an enormous intensity increase is obtained. The tubes were operated in the 40,000-volt secondary circuit of a transformer, the primary of which was connected to a 110-volt source and supplied with 4 to 5 amperes alternating current. Light from the end-on capillary was projected on the slit of a stigmatically mounted concave grating 4 having a radius of curvature of 21% feet, 7,500 lines per inch, and a scale of 10.2 A per millimeter in the first-order infrared spectrum.
The infrared radiation was filtered into the spectrograph with a sheet of Jena RG 5 glass, 2 millimeters thick, after the first exposure showed that the selenium red glass used heretofore was not safe beyond 12200 A. No second-order spectra or Lyman ghosts were found on any of the following spectrograms, but Rowland ghosts accompanied some of the strongest infrared lines. An indication of the infrared sensitivity of I-Z plates is given by the fact that the helium line at 10830 A was flanked by Rowland ghosts to the 12th order, although the grating employed shows no trace of such ghosts with moderately overexposed lines.
Exposures to the Geissler tubes ranged from 20 to 24 hours. Wave lengths of lines thus recorded in the first-order spectrum were derived from measurements relative to iron-arc standards photographed. in the third-order spectrum. An exposure of one second sufficed to impress the iron spectrum. The first-order spectrum lines were measured and calculated as if they belonged to the third order, and then these values were multiplied by 3 to convert them to their true values. The corrections for standard density of air were neglected since they were always less than 0.01 A, while the average probable error of the infrared wave-length measurement is several times larger.
III. RESULTS
Preliminary exposures of Eastman I-Z plates to metallic-arc spectra in which a continuous background from white-hot electrodes and oxides was visible, immediately gave the impression that the sensitizing resembled that of I-Q (xenocyanine) plates, except that the maximum was displaced toward longer waves. In both cases the
, c. E. K. Mees, J .Opt.Soc.Am. 25,80 (1935). 3 W. F . Meggers and C . J. Humphreys, BS J.Research 10,428 (1933) RP540. • W. F. Meggers and Kei,in Burns, BS ScLPap. 18, 191 (1922) 8441.

Meygers] Infrared Spectra of Noble Gases 489
sensitizing band is very broad, in Q the maximum action is at 9700 A, while in Z it is near 10900 A. The Z plates were found inferior to Q for wave lengths below 10300 A, but they run well ahead at 10500 A, and appear to be more sensitive at 13000 A than the latter are at 12000 A. Since no new lines short of 10500 A were detected with I- Z plates, the results are given only for lines of great.er wave length . The data are presented in the following tables, in which successive columns contain estimate:;, of relative intensity, measured wave lengths, wave numbers in vacuum, term combinations, and numerical differences of the terms. The intensity estimates are not corrected for variations in the photographic spectral sensitivity and as usual are comparable only over more or less limited regions.
In each table, the vacuum wave number (column 3) is derived from the observed wave length (column 2) by converting the wave length in air to vacuum value by means of the atmospheric-dispersion formula of Meggers and Peters/ and then calculating its reciprocal.
The modern quantum notation for spectral terms is used for helium, while for the remaining noble gases the notation is that first employed by Paschen 6 for the representation of neon terms.
1. HELIUM
Previous knowledge of the first spectrum of helium has been summarized in treatises on spectral series,1 and in a paper on the infrared spectra photographed with xenocyanine. 8 Observations for the longer waves are displayed in table 1. For the sake of completeness, some lines probably due to He2 molecules are included, but no attempt has been made to classify them. Values for the 2 3S-2 3p group at 10830 A are quoted from another paper;9 they represent interferometer comparisons with neon standards.
' W. F. Meggers and C. G. Peters, BS ScLPap. H, 722 (1918) S327 . • F . Paschen, Ann. P hysik 60, 405 (1919). 7 A. Fowler, Series in Line Spectra, page 91 (E'leetway Press, London. 1922). F. Paschen and R. Goetze.
Seriengesotze der Linienspektren, page 26 (Julius Springer, Berlin, 1922). W. Grotrian, Handb uch der Astrophysik, 3, 555 (Julius Springer, Berlin, 1930). R. Bacher and S. Goudsmit, Atom ic Energy States, page 220 (McGraw-Hill , New York, 1932).
• W. F. Meggers and G. H. Dieke. BS J.Research 9,121 (1932) RP4G2. • W. F. M eggers and C. J . Humphreys, BS J.Research n, 293 (1934) RP71O.

490 Journal of Research of the National Bureau of Standards Vot. 14
TABLE I. - Infrared spectra of helium
Intensity X.;r A. Vvao cm- l Term combi- Vvae cm-1
observed nation calculated
I? 12790. 9 7815. 9 31D- 51Fo 7815. 1 2 12784. 65 7819. 74 33D-53Fo 7819. 89 3 12527. 40 7980. 32 33S- 43p O 7980. 28
20 11969.07 8352. 59 33po- 53D 8352. 59 6 11225. 83 8905. 59 31p o-61S 8905. 39
2 11065.69 9034. 47 40 11044.95 9051. 44 31po- 61D 9051. 23
2 11017. 14 9074. 29 30 11012.97 9077. 72 31S- 51po 9077.78 5 10996. 55 9091. 27 33D- 63po 9091. 44
50 10916. 98 9157. 53 31D-61Fo 91 57. 53 100 10912. 92 9160. 94 33D-63Fo 9160. 94
1 10902. 1 9170.04 31D-61p o 9170.04 2500 10830. 341 9230. 793 23S1- 23PZ 9230. 79 1500 10830. 250 9230. 871 23S1- 23P! 9230. 87
I 500 10829. 081 9231. 867 23S1- 23PO 9231. 86
2 10753. 36 9296. 88 3 10675. 68 9364. 52
30 10667. 60
I 9371. 61 33po- 63S 9371. 66
1- 10653.7 9383. 8
1 10651. 48 9385. 79 2 10644. 62 9391. 85 3 10633. 50 9401. 67 3 10618. 24 9415. 18 3 10599. 17 9432. 12
3 10576. 38 9452. 45 2 10550. 06 9476. 02 1 10504. 48 9517. 14 2 10470. 28 9548. 22 2 10433. 19 9582. 17
2 10393. 30 9618. 95 2 10350. 90 9658. 35
2. NEON
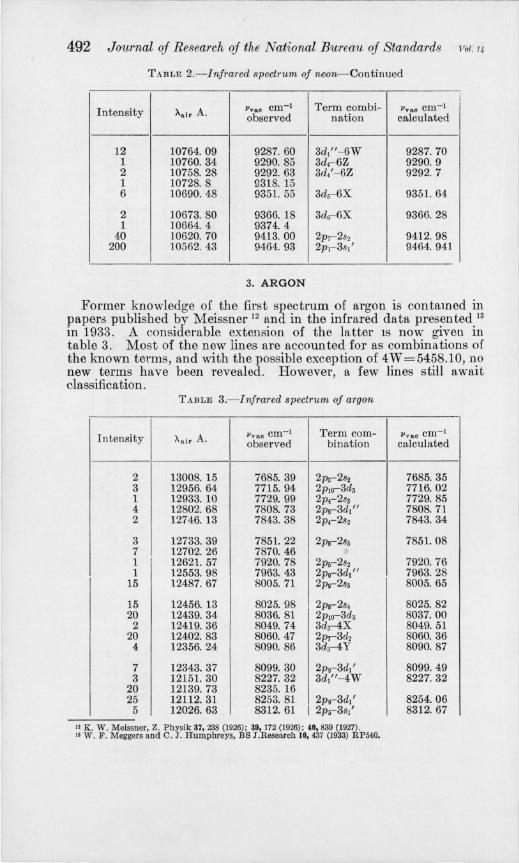
To Paschen's 10 description and analysis of the neon spectrum a considerable extension was made when mesocyanine and xenocyanine plates were employed 11 in 1932. Additional lines have been found with I- Z plates (table 2), but these represent for the most part, combinations of established terms. Possibly one new term (3068.9) of 6f type is revealed, but a few lines of very low intensity remain unclassified in this and in the preceding lists of neon lines.
10 F . Paschen, Ann.Physik 60, 405 (1919). 11 W. F. Meggers and O. J. Humphre,s, BS J. Research 10, 430 (1933) RP540.

Meuuersl Infrared Spectra of Noble Gases 491
TABLE 2.-Infrared spectrum of neon
i
Intensity Asi. A. VVBO cm-1 Term combi- Vvao cm- J
observed nation calculated
1 12689.2 7878. 56 2pa- 2s, 7878. 54 2 12459. 49 80.23. 81 2ps- 2s, 80.23.87
15 120.66. 38 8285. 22 2p6- 2sS 8285.28 10. 11984.99 8341. 49 2P2- 2sa 8341. 53 10. 11789.93 8479. 50. 2P7- 2s5 8479. 54
50. 11789.11 8480.. 0.9 2P6- 2s, 8480..12 60. 11766.87 8496. 12 2p2-2s2 8496. 13 10. 11688.0.8 8553. 39 2Pl- 3ds 8553.485 80. 11614. 18 860.7. 82 2ps- 2sa 860.7.87 25 1160.1. 62 8617.13 2pa-2s2 8617. 14
50. 11536.41 8665. 84 2pr-3d2 8665.865 90. 11525.11 8674. 34 2P7- 2s, 8674. 38
150. 11522. 82 8676. 0.6 2pC 2s2 8676.0.7 1 11477.33 8710.. 44
10.0. 1140.9.24 8762. 43 2ps-2sz 8762. 47
110. 11390.. 53 8776. 83 2ps-2ss 8776. 92 3 11366.80. 8795. 14 2sc 4ps 8795.32 3 11333.60. 8820.. 91 2s2- 4ps 8820.. 97 1 11329.56 8824. 0.5 2s2-4P2 8824. 12 2 1130.4.47 8843. 64 2s,-4p7 8843.66
5 1130.3.96 8844. 0.4 2s2-4p, 8844. 22 1 11298.45 8848. 35 2ss- 4pIO 8848. 38 2 11293. DO. 8852. 62 2s,- 4p6 8852. 76 1 11261. 60. 8877. 31
30.0. 11177. 59 8944. 0.2 2P9-2sS 8944. 10.
10. 11160..29 8957. 89 2ss- 4p9 8958. 0.2 30.0. 11143.0.9 8971. 72 2ps-2s. 8971. 76
4 11138. 55 8975. 37 2sa-4ps 8975.57 4 11134. 62 8978. 55 2sa-4pz 8978. 72 5 11120..37 8990.. 0.5 2sz-4ps 8990.. 16
2 110.60..88 90.38. 40. 2ss-4p7 90.38. 50. 20. 110.49.80. 90.47. 46 2ss- 4p6 90.47. 60. 15 110.44.0.6 90.52.17 2sz-4pl 90.52. 43 10. 110.20..93 90.71. 17 2s,- 4p3 90.71. 32 1 10.959. 6 9121. 9
1 10.937. 7 9140.. 2 1 10.921. 16 9154. 0.3 2 10.891. 23 9179. 19 8 10.888.53 9181. 46 3d!,- 6Z 9181. 6 5 10886. 35 9183. 3D 3d!" - 6Z 9183.4
20.0. 10.844.54 9218. 71 2p6- 2s2 9218. 72 3 10.838. 3D 9224. 0.1 3d2-3o.68.9 9224. 0. 5 10.819. 95 9239. 66 3s1" - 6U 9239.92 4 10.814.83 9244.0.3 3d2- 6Y 9244. 2 7 10.80.8.22 9249. 68 3s!'''-6U 9249. 68
5 10.80.6. 43 9251. 22 3s!""-6U 9251. 24 150. 10.798. 12 9258. 34 2P7- 2sa 9258.38
2 10.789. 37 9268. 38 3dc 3D68.9 9268. 4 6 10.780.. 57 9273. 41 3da- 7Y 9273.6
10. 10.766. 15 9285. 83 3d1'- 6W 9285 93
492 Journal of Research of the National Bureau of Standards 1701.14
TABLE 2.-Infrared spectrum of neon-Continued
I Intensity A.i. A. Pvao cm-1 Term combi- Vvao cm-1
observed nation calculated
12 10764.09 9287. 60 3d," - 6W 9287. 70 1 10760. 34 9290. 85 3dc 6Z 9290. 9 2 10758. 28 9292. 63 3d/- 6Z 9292. 7 1 10728.8 9318. 15 6 10690.48 9351. 55 3d5- 6X 9351. 64
2 10673. 80 9366. 18 3dr 6X 9366.28 1 10664. 4 9374.4
40 10620. 70 9413. 00 2p,2sz 9412. 98 200 10562. 43 9464. 93 2p,- 3s,' 9464. 941
3. ARGON
Former knowledge of the first spectrum of argon is contallled in papers published by Meissner 12 and in the infrared data presented 13
in 1933. A considerable extension of the latter IS now given in table 3. Most of the new lines are accounted for as combinations of the known terms, and with the possible exception of 4W =5458.10, no new terms have been revealed. However, a few lines still await classification.
TABLE 3.- Infrared spectrum of argon
Intensity A.i. A. JlV80 cm-1 Term com- lI VRO cm- 1
observed bination calculated
2 13008. 15 7685. 39 2ps-2s2 7685. 35 3 12956. 64 7715.94 2PlO-3ds 7716.02 1 12933. 10 7729.99 2pc2ss 7729. 85 4 12802. 68 7808. 73 2pr 3dt" 7808.71 2 12746. 13 7843. 38 2pC2s2 7843. 34
3 12733. 39 7851. 22 2pr2s5 7851. 08 7 12702. 26 7870.46 1 12621. 57 7920. 78 2p.-2s2 7920. 76 1 12553. 98 7963.43 2pg-3dt" 7963. 28
15 12487. 67 8005.71 2pg-2s5 8005. 65
15 12456. 13 8025.98 2ps-2s4 8025. 82 20 12439. 34 8036.81 2pto-3ds 8037. 00 2 12419. 36 8049. 74 3ds-4X 8049. 51
20 12402. 83 8060. 47 2p,3d2 8060. 36 4 12356. 24 8090.86 3d3-4Y 8090. 87
7 12343.37 8099. 30 2ps- 3dt' 8099.49 3 12151. 30 8227. 32 3dt" - 4W 8227.32
20 12139. 73 8235. 16 25 12112.31 8253.81 2pg-3dt' 8254.06 5 12026.63 8312.61 2p.-3s,' 8312. 67
12 K. W . Meissner. Z. Physik 37. 238 (1926): 39,172 (1926); 40,839 (1927). IS w. F. Meggers and C. J. Humphreys. BS 1.Research 10,437 (1933) RP540.

Meogers] Infrared Spectra of Noble Gases 493
TABLE 3.- I nfrared spectrum of argon- Continued
Intensity I A.i, A. P vR e cm- 1 Term com- Jl v ne cm-1
observed bination calculated
- -25 11943. 50 8370. 46 3d5- 4X 8370. 49 3 11896.60 8403. 47 2p6- 3s/' " 8403. 58 5 11884. 47 8412. 04 3ds- 4Y 8411. 85 2 11879. 97 8415. 23
20 11733.26 8520. 45 3d6- 4X 8520. 59
30 11719. 51 8530. 44 2Ps-3d2 8530. 29 3 11708.22 8538. 67 3d2- 5X 8538. 74 5 11687. 61 8553.73 2p,- 3s/' " 8553. 87 4 11678.47 8560. 43 3dz-5Y 8560. 58
100 11668.72 8567. 58 2P6- 3s1" 8567. 56
8 11580.39 8632. 92 3d.-4W 8632. 91 150 11488. 12 8702. 27 I s2- 2plO 8702. 20 30 11467.57 8717.86 2p7- 3s/' 8717.98 80 11441. 83 8737. 47 2p6- 2s2 8737. 50
7 11398.63 8770. 58 3s,'- 5Z 8770. 38
50 11393.66 8774. 42 2p,- 2s3 8774. 30 8 11248.33 8887. 77 2p, 2s2 8887. 70 1 11209. 67 8918. 43 3d1'- 4p3 8918. 46 2 11195.37 8929. 82 3d3- 4p lO 8929. 92 2 11145.40 8969. 86
20 11133. 86 8979. 15 3d]'- 5V 8979. 13 20 11118.75 8991. 36 3d]'- 5Y 8991. 55 60 11106.44 9001. 32 5rl/- 5U 9001. 19
200 11078. 87 9023. 72 2ps-3s/ '" 9023. 67 2 11075.54 9026. 44
1 11055.40 9042. 88 2 11043.13 9052.93 3d3-4ps 9052. 94 1 11028.60 9064. 86 2s.-5Y 9065. 06 1 10977. 30 9107.22 3d2-5p7 9107. 41 2 10964. 00 9118.26 3d3- 4p7 9118.23
120 10950. 74 9129. 30 2p6-3s / 9129. 31 20 10947. 90 9131. 67 3d3-4p6 9131. 96
1 10911. 22 9162. 38 1 10895. 9 9175.3 3d/'- 4p, 9175.49
30 10892. 37 £178. 23 2po- 3s/'" 9178.24
2 10885.9 9183. 68 3d/'- 4p2 9183. 68 150 10880. 96 9187. 88 2ps-3s]" 9187. 78 25 10861. 04 9204. 70 2ps-3s ]'" 9204. 69
2 10845. 43 9217. 95 2s5-5X 9217.96 1 10837. 39 9224. 79 3s/"- 6V 9224. 77
1 10831. 88 9229. 49 3s/"- 6Y 9229. 59
1 10824. 00 9236. 20 es/'- 6X 9236. 04 3s/"- 6U 9236. 42
1 10822. 74 9237. 28 3dz-5p5 9237.54 6 10820. 18 9239.46 2ss- 5Y 9239. 80 1 1081 2. 16 9246. 31 3s!" - 6Y 9246. 50
Jl8i;87-3&--~

494 Journal of Research of the National Bureau of Standa1'(is [Vol. 14
TABLE 3.-Infrared spectrum of argon-Continued
Intensity A.i' A. V Y 1\O cm-1
I Term com- VYM cm-1
observed bination calculated
5 10807. 04 9250. 69 3ds- 4plO 9250. 90 2 10795. 91 9260. 24 3d/ '-5X 9260. 40 1 10787. 4 9267.5
30 10773. 35 9279. 62 2p7- 3st' 9279. 60 15 10770. 35 9282. 21 3d." - 5Y 9282.17
60 10759. 13 9291. 88 3d/ '- 5U 9291. 97 50 10733. 87 9313. 75 3s/"-5W 9313. 81
2 10732. 10 9315. 29 3S,"'-5Z 9315. 22 6 10722. 22 9323. 87 2PlO- 3d," 9324. 00
40 10712. 77 9332. 10 3s,"- 5Z 9332. 13
80 10700. 98 9342. 38 2p~-3s1" 9342. 35 50 10683. 40 9357. 76 2ps-2s2 9357. 72
200 10681. 78 9359. 18 2p9-3s1' " 9359. 36 500 10673. 55 9366. 43 2plO-2sS 9366. 37
1 10644. 9 9391. 6
5 10634. 25 9401. 00 3ds- 4plO 9401. 00 2 10623.38 9410. 62 3S/"'-6Y 9410.61 1 10615. 7 9417.43 3S/"'-6U 9417.44 2 10591. 23 9439. 13 3ds-4pl 9439.21 1 10581. 63 9447. 75
4 10576. 18 9452. 62 3d5-4p6 9452.94 1 10559. 6 9467. 5
50 10529. 32 9494. 69 3S/"'-5W 9494.83 2 10527. 34 9496. 48 3S/"'-5Z 9496.24
100 10506. 47 9515. 34 3d3-4Z 9515. 46
200 10478. 10 8541. 10 2PlO-2s j 9541. 11 500 10470. 051 9548. 43 ls3-2plO 9548.36
4. KRYPTON
Complete information concerning the first spectrum of krypton 14
was summarized in 1933, when an extension to the infrared data was publishedY Some additional lines (table 4) have been found on spectrograms made with I-Z plates, but most of them represent combinations of terms already known. In a few cases, the differences between observed and calculated wave numbers suggest a slight revision of term values. The term 2 S5 (=13287.96), previously proposed on the basis of a single transition of the type (P-s), is now confirmed by double-electron (s-j) transitions, but two of the lines beyond 12000 still remain unclassified.
"w. F. Meggers, T. L. DeBruin, and C. J. Humphreys, BS J. Research 7, 643 (1931) RP364. II W. F. Me~gers and C. J. Humphreys, BS J . Research 10, 443 (1933) RP540.
l

Meagers] Infrared Spectra of Noble Gases 495
TABLE 4.- Infrared spectrum of krypton
Intensity X.lrA. vvsocm- 1 Term combi- JlvAoCm-1
observed nation calculated
10 12204. 54 8191. 43 3 12123. 56 8246. 15 l sz-2p5 8246. 153 4 12117.81 8250.06 4 12077. 22 8277. 79 3d3-4Z 8277. 62
10 11997.15 8333. 03 3d3- 4Y 8333. 64
100 11819.43 8458. 33 2PlO- 2s5 8458.43 10 11792.47 8477. 67 2PlO-3dz 8477. 10
1 11655.8 8577. 1 2s4-5Z 8577. 00 1 11611. 6 8609. 7 2s,-5Y 8609. 56
80 11457.52 8725. 51 2PlO-2s4 8725. 60
1 11333.44 8821. 03 2PI-5d5 8821. 09 4 11328.51 8824. 87 3d2-5Z 8825. 43 1 11316. 1 8834. 6 3d2- 5X 8835. 06 1 11303.8 8844. 2 2s5-5Z 8844.17 2 11262.71 8876. 43 2s5-5Y 8876. 73
50 11259. 16 8879. 23 3d5-4X 8879. 48 80 11257.74 8880. 35 3ds- 4Z 8880. 28
5 11214.58 8914. 52 e d;-4P8 8914.42 3d4-4p9 8914.70
40 11187. 13 8936. 40 3ds-4Y 8936. 30 100 10874. 92 9192. 95 3d6-4X 9193. 02
1 10801. 3 9255. 6 2 10729. 43 9317.61 3d3-4pJO 9317.63
20 10699. 33 9343. 82 3d';-4pg 9343. 62 1 10647. 63 9391. 76 3d'l-5Z 9391. 76 8 10626. 70 9407. 68 3d'l-5U 9407. 80
20 10608. 43 9423. 89 3d'l-5Y 9424. 32 100 10593. 01 9437.60 3d'l-5W 9437.71
2 10575. 50 9453.23 ed3-4P8 9453. 07 3d:r4pg 9453. 35
1 10549. 64 9476. 40 2 10486. 29 9533.65 3d3-4p7 9533. 60
6 10458. 56 9558. 93 3d3-4p6 9558. 97
5. XENON
The most complete description and analysis of the first spectrum of xenon is that published by Humphreys and Meggers 16 in 1933 . With xenocyanine (I-Q) plates, it was impossible to record lines beyond 11141 A, but with I-Z plates, 21 lines of greater wave length have been measured (table 5). Here also the majority of new lines is accounted for by known terms, but two new terms of 28 type are suggested. If the last observed line 12623.40 A is assumed to represent the transition 2PIO-28s, the faint line at 11175.5 A is explained as the combination 285-5pS, and the term 285 acquires a value of 12645.09. The line at 12235 .24 A is similarly assumed to represent 2PIO-28" giving the term 28, a value of 12393 .87, but unfortunately no lines remain with which to check it.
11 0.1. Humphreys and W. F . Meggers, BS 1. Research 10,139 (1933) RP521.

496 Journal oj Research oj the National Bureau oj Standards rVol.14
TABLE 5.-Infrared spectrum of xenon
~ Intensity Aair A. VV8C cm-1 Term combi- JlY80 cm-1
observed nation calculated
5 12623. 40 7919. 63 2PIO-2ss 7919. 66 1 12257. 81 8155.83 3do-3PIO 8155. 85 5 12235. 24 8170.88 2PlO-2s4 8170.88 3 12084. 80 8272. 60 3d/-3ps 8272. 57 3 11953.00 8363. 81 3d3-3po 8363. 74
1 11951. 1 8365. 1 3ds-3po 8365. 04 2 11912. 10 8392. 53 3ds-2p4 8392.49 1 11874.36 8419. 20 3d1'-4Y 8419. 25 2 11857.86 8430.92 2P5-4d" 8430. 81 6 11857.31 8431. 31 3d1'-4Z 8431. 34
10 11793.56 8476. 89 3d1'-4U 8476. 89 50 11742.26 8513. 92 3d l '-4W 8513. 84 25 11614.08 8607. 89 3do-2p4 8607.85
1 11537. 4 8665. 1 3dz-4p5 8665. 19 15 114!H.22 8699. 92 3d5-3po 8699.86
15 11415.04 8757. 98 3ds-3p7 8757.92 5 11309.56 8839. 66 3d3-2pa 8839. 60
10 11289.10 8855. 68 3dD-3ps 8855. 62 5 11214.89 8914. 28 3d1"-4X 8914. 18 1 11175.5 8945. 7 2S5-5pS 8945. 73
10 11162.67 8955. 98 3d3-2pz 8955. 95 50 11141. 09 8973. 33 3do-3p7 8973. 28
8 11130. 81 8981. 62 3d l "-4U 8981. 49 100 11127.20 8984. 53 3d/'-4V 8984.46 250 11085.25 9018. 53 3d l "-4W 9018.44
200 10895.32 9175.74 3d5-2p3 9175.72 1000 10838.34 9223. 98 lsc 2plO 9223. 986
100 10758. 86 9292. 13 3ds-2pz 9292.07 150 10706. 78 9337. 32 2Po-4ds 9337.31 20 10549. 76 9476. 30 3d2-5Y 9476. 30
6. IMPURITIES
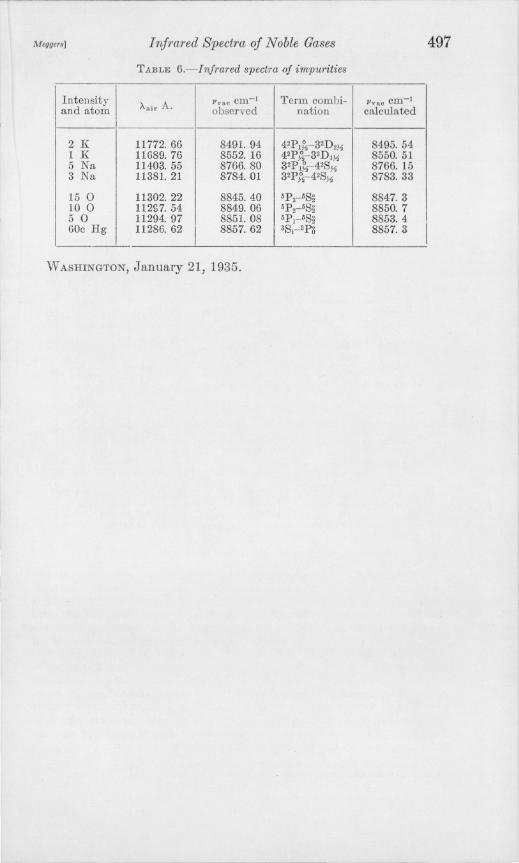
A small number of impurity lines were found on some of the spectrograms. Mercury and oxygen are fairly common contaminants of gases in Geissler tubes, and it happens occasionally that the glass becomes overheated to such a degree that sodium and potassium lines appear in the discharge. These impurity lines are listed in table 6. They are possibly of interest as additional or accidental standards in further infrared investigations of Geisslertube spectra. In this table, the classification and calculated wave numbers are quoted from Atomic Energy StatesY If the sodium and potassium lines observed here in low-pressure sources are compared with values reported for arcs at atmospheric pressure 18 they will be seen to be 0041 A smaller, or 0.31 greater in wave number This difference may be regarded as a reasonable measure of the displacement due to one atmosphere of pressure.
" R. Bacher and S. Goudsmit, (McGraw·Hill, New York, 1932). I' W . F. Meggers, BS J.Research 10, 669 (1933) RP568.
Megyersl Irifrared Spectra of Noble Gases 497
TABLE 6.-Infrared spectra of impurities
Intensity Aair A.
VVtle em- I Term combi- V vtLe cm- 1
and atom observed nation calculated
2 K 11772.66 8491. 94 42PJf,-32D2M 8495. 54 1 K 11689.76 8552. 16 42Py,- 32D"" 8550. 51 5 Na 11403.55 8766. 80 32P 1f,- 42SjO 8766. 15 3 Na 11381. 21 8784. 01 32P~-42S;,; 8783. 33
15 0 11302.22 8845. 40 5P3_5S2 8847. 3 10 0 112£7.54 8849. 06 5P2_5S2 8850. 7 5 0 11294.97 8851. 08 5P1_5S2 8853. 4 60c Hg 11286.62 8857.62 3S1_3P(i 8857. 3 I -----
WASHINGTON, January 21, 1935.