Infrared Optical Properties of Materials...Figure 2: The Digilab FTS 7000 FTIR wavelength range in...
78
NIST Special Publication 250-94 Infrared Optical Properties of Materials Leonard Hanssen Simon Kaplan Raju Datla This publication is available free of charge from: http://dx.doi.org/10.6028/NIST.SP.250-94
Transcript of Infrared Optical Properties of Materials...Figure 2: The Digilab FTS 7000 FTIR wavelength range in...
NIST Special Publication 250-94
Infrared Optical Properties of Materials
Leonard Hanssen
Simon Kaplan
Raju Datla
This publication is available free of charge from:
http://dx.doi.org/10.6028/NIST.SP.250-94

NIST Special Publication 250-94
Infrared Optical Properties of Materials
Leonard Hanssen
Simon Kaplan
Raju Datla
Infrared Technology Group
Sensor Science Division
This publication is available free of charge from:
http://dx.doi.org/10.6028/NIST.SP.250-94
February 2015
U.S. Department of Commerce Penny Pritzker, Secretary
National Institute of Standards and Technology
Patrick D. Gallagher, Under Secretary of Commerce for Standards and Technology and Director

Certain commercial entities, equipment, or materials may be identified in this
document in order to describe an experimental procedure or concept adequately.
Such identification is not intended to imply recommendation or endorsement by the
National Institute of Standards and Technology, nor is it intended to imply that the
entities, materials, or equipment are necessarily the best available for the purpose.
National Institute of Standards and Technology Special Publication 250-94
Natl. Inst. Stand. Technol. Spec. Publ. 250-94, 76 pages (February 2015)
CODEN: NSPUE2
This publication is available free of charge from:
http://dx.doi.org/10.6028/NIST.SP.250-94

iii
Abstract
This document describes the Fourier Transform Infrared Spectrophotometry (FTIS) Facility
at the Sensor Science Division (SSD) of the National Institute of Standards and Technology
(NIST), which provides the infrared optical properties of materials (IROPM) calibration service,
38075 S, over the infrared spectral range of 1 µm to 25 µm. It is organized as follows. Section 1
introduces the FTIS facility for measuring the infrared reflectance, transmittance, absorptance
and emittance of materials and the services available. Section 2 describes the physics basis for
the measurements. Section 3 describes the setups and measurements. Section 4 describes the
measurement assurance process with various publications as appendices on the FTIS
measurement uncertainties and intercomparisons. A template for the calibration service report for
customers is provided in Sec. 5 and references are added in Sec. 6.
Key Words: diffuse reflectance; directional hemispherical reflectance; reflectance; Fourier
Transform Spectrophotometer; integrating sphere; specular reflectance; transmittance;
absorptance; emittance.

iv
Table of Contents
Abstract ........................................................................................................................................................ iii
1. Introduction ........................................................................................................................................... 1
2. Reflectance, Transmittance, and Absorptance/Emittance ..................................................................... 2
3. Setups and measurements ..................................................................................................................... 3
3.1. “Conventional” transmittance measurements .................................................................................... 6
3.1.1 Standard reference materials for τr ............................................................................................... 8
3.1.2 Filter transmission measurements for aerospace applications – GOES -13 filters .................... 10
3.1.3 Analysis of uncertainties in the transmittance data ................................................................... 17
3.1.3.1 Uncertainty in ordinate (transmittance) scale ..................................................................... 17
3.1.3.2 Uncertainty in abscissa (wavenumber) scale: ..................................................................... 23
3.2. The Infrared Reference Integrating Sphere (IRIS) setup ................................................................. 25
3.2.1 Description of the integrating sphere ......................................................................................... 29
3.2.2. Sphere mounting and manipulation hardware ........................................................................... 33
3.2.3. Configuring the Integrating sphere for measuring, ρ, τ , α, and ............................................. 35
3.2.3.1. Measurement conditions and sphere characterization ........................................................ 37
3.2.4. Specular sample measurement results of ρ, τ, and α ................................................................. 44
3.2.4.1. Advantages of using IRIS for measurements of ρ, τ and α of specular samples ................ 55
3.2.5 Absolute total scatter (diffuse reflectance, ρd; diffuse transmittance, d) measurements. .......... 56
3.2.5.1. Calibration methodology for measuring ργ,h of non-specular samples .............................. 58
3.3. Infrared Gonio-Reflectometer-Transmissometer (IGRT) ................................................................ 61
3.3.1. Detectors for the IGRT .............................................................................................................. 64
3.3.2. Calibration measurement procedure – Example of a gold mirror sample ................................. 67
v
4.0. Measurement Assurance ...................................................................................................................... 69
4.1. Sources of Error studies ................................................................................................................... 69
4.1.1. FTIR errors ................................................................................................................................ 69
4.1.2. Sphere method and associated errors ........................................................................................ 69
4.1.3 Goniometer associated errors ..................................................................................................... 69
4.2 Internal and external intercomparisons ............................................................................................. 70
4.2.1 Internal w/ STARR / monochromator/transmittance/reflectance ............................................... 70
4.2.2 Internal sapphire disk compared to handbook n & k calculations ............................................. 70
4.2.3 External w/ National Physical Laboratory (NPL – UK) ............................................................ 70
4.2.4 External w/ National Metrology Institute of Japan (NMIJ) ....................................................... 70
4.2.5 External/Nationwide Intercomparison ....................................................................................... 70
5.0 Template for Calibration Report ..................................................................................................... 71
6.0 References ....................................................................................................................................... 71

1
1. Introduction
Reflectance, transmittance, and absorptance/emittance are essential optical properties of
materials needed for optical science research and industrial applications. The interaction of light
with matter is different at different wavelengths and the techniques to measure the optical
properties differ based on the spectral region of interest. This document addresses the techniques
developed and implemented at NIST for measuring infrared optical properties of materials
(IROPM) over the spectral range of 1 µm to 25 µm. The techniques are based on measuring the
reflected and transmitted radiation from the sample. Commercial Fourier Transform Infrared
(FTIR) spectrophotometer instruments are used to resolve and analyze infrared spectral
information. One FTIR is connected to custom built integrating sphere and goniometer setups
equipped with state of the art infrared detectors for reflectance and transmittance measurements
of samples to meet customer requirements. Also, special cryostats and a modified sample
compartment are used for determining the spectral transmittance of filters to meet customer
requirements. This specialized instrumentation is part of the Fourier Transform Infrared
Spectrophotometry (FTIS) Facility at the Sensor Science Division (SSD). Section 2 provides the
physics basis for the measurements. The instrumentation setups and measurements are described
in Section 3. In Section 4 the measurement assurance process with uncertainty evaluations and
intercomparisons is presented. Section 5 provides a template for the calibration service report for
customers. Section 6 contains the references. Appendices at the end provide additional
information supporting the main discussion in the document.
NIST strives to provide the best possible measurement services and a research program to
support the national requirements for such measurements. NIST maintains trained personnel for
realizing and disseminating the absolute scales for the IROPM, and they follow the NIST Quality
System for measurement assurance.

2
2. Reflectance, Transmittance, and Absorptance/Emittance
Reflection is the process by which radiant flux is returned at the boundary between two
media (surface reflection) or at the interior of a medium (volume reflection). Transmission is the
process of passage of radiant flux through a medium. Both processes can undergo scattering
(also called diffusion), which is the deflection of the unidirectional beam of radiation into other
directions. When no diffusion occurs the beam of radiation obeys the laws of geometrical optics
and the unidirectional beam results in unidirectional beams called specular (or regular) reflection
and direct (or regular) transmission. The wavelength of radiation is unchanged in these processes
if the medium is stationary. The total reflectance ρ is subdivided into regular reflectance ρr, and
diffuse reflectance ρd. The transmittance τ of a medium is defined by the ratio of transmitted
radiant flux to incident radiant flux. The total transmittance τ is subdivided into specular
transmittance τr and diffuse transmittance τd and the terminology for transmittance follows the
same definitions as reflectance except the process is transmission and the word reflectance is
replaced with transmittance. The absorptance α of a medium is defined by the ratio of absorbed
radiant flux to incident radiant flux. By the conservation of energy principle the following
relationship holds:
𝜌 + 𝜏 + 𝛼 = 1 . (1)
The emittance (also called emissivity) of a body at temperature T is equal to the absorptance
according to Kirchhoff’s law:
𝜀 (𝜆, 𝑇) = 𝛼 (𝜆, 𝑇) . (2)
Therefore, based on Eq. 1 the emittance of a body can be deduced in principle by measuring ρ
and τ. For opaque materials no transmission takes place and τ is zero. In such cases the
absorptance/emittance can be derived from the measurement of reflectance ρ alone. In this
document, Eq. 1 and Eq. 2 are applied to deduce the absorptance/emittance of materials. These
quantities are defined using an independent vocabulary to account for the effects of geometry
and other parameters such as polarization and temperature of the material, etc. The details of
such common vocabulary can be found in Ref. 1.

3
3. Setups and measurements
The typical setup of equipment for the calibration service 38075S is shown schematically in
Fig. 1. In general, the primary spectral source has been a Digilab FTS-70001commercial Fourier
transform spectrophotometer, shown in Fig. 2. If necessary, this instrument can be
Figure 1: Schematic of the typical equipment setup for the calibration service 38075S. The
automatic sample changer in the IRIS setup allows multiple samples to be measured under
identical beam alignment. The Mercury Cadmium Telluride (MCT) detector sits on the top port
of the integrating sphere and does not interfere with the rotation stages of the integrating sphere.
The sample slide on top of the rotation stage of the IGRT allows multiple samples to be
measured in identical beam alignment. The sample angle alignment laser and the sample depth
alignment laser, and their respective quadrant detectors shown in the IGRT setup allow precise
and well defined positioning of the sample in the IGRT setup. The Indium Antimonide (InSb)
detector and the DTGS detector located on the heavy duty rotation stage of the goniometer cover
the mid IR and the far IR in the IGRT setup.
1 See NIST disclaimer on the front cover

4
Figure 2: The Digilab FTS 7000 FTIR wavelength range in our setup is 0.8 µm to 50 µm and
resolution is ≥ 0.5 cm-1. It is configured for our system with a W–halogen lamp and coated
quartz beam splitter for the near-IR spectral region of 1 µm to 3 µm (10,000 cm-1 to 3300 cm-1 )
and a SiC source and coated KBr beam splitter for the mid-IR region of 2 m to 18 m
(5000 cm-1 to 550 cm-1). The available manuals on this instrument are the Digilab FTS-6000
Operating Manual and the Digilab WIN-IR Pro Software Manual, located in the laboratory at
Bldg 220, Room B331.

5
replaced by a similar FTIR, such as the Bruker Vertex 80v, available in the laboratory, without
significant modification of the custom external systems described below. The spectrometer with
its internal sample testing beam geometry for spectral transmittance measurements is shown in
the right box in Fig. 1 labeled Digilab FTS 7000. The mirror on the kinematic mount located in
the right box allows the beam to enter the the purged enclosure to the left that houses the Infrared
Reference Integrating Sphere (IRIS) and the Infrared Gonio-Reflectometer Transmissometer
(IGRT). The equipment is set up on two 122 cm x 183 cm highly stable optical tables.
The interface optics consisting of the field stop selection plate on an x-y stage and polarizer
on a slide are commonly available to the IRIS and IGRT with the off-axis paraboloids (OAPs)
and an elliptical mirror along with beam steering flat mirrors mounted on translation stages, to
select between the instruments. A field stop selection plate shown at the focus of the OAP 1 in
the top part of the mid section of the schematic is available to select field stop sizes from 0.25
mm to 2 mm in 0.25 mm intervals, 2 mm to 5 mm at 0.5 mm intervals, and 5 mm to 8 mm at 1
mm intervals. Three polarizers mounted on the polarizer slide and covering the spectral ranges
of 0.5 µm to 2.0 µm (NIR), 1.0 µm to 5.0 µm (MIR), and 2 µm to 200 µm (FIR), respectively,
are available to provide linear polarization for the incident beam in the measurement. The
retractable elliptical mirror allows the beam to be directed to the IGRT section or to the OAP #2
to project to the aperture stop and OAP #3 for the IRIS setup of measurements. The
measurement geometry setups for the IRIS and IGRT are described separately in more detail in
Section 3.2 and Section 3.3 respectively.
For conventional transmittance measurements other FTIR spectrometers including
BOMEM-DA 3, Bruker Vertex 70 and Bruker Vertex 80v are also available at the facility. A
liquid He flow-through cryostat is available for measurements at cryogenic sample temperatures.
In addition, special filter wheel assemblies have been designed and built to accommodate
specific user requirements.
The wavelength scales of the FTIR instruments are set following the methods developed
at NIST to provide polystyrene IR wavelength reference standards, SRM 1921 for customers as
described in Ref. 2 for high spectral resolution applications and the SRM itself as a secondary
standard for low resolution applications.

6
3.1. “Conventional” transmittance measurements
For transmittance (τ) measurements of fairly thin samples, which do not significantly modify
the IR beam geometry, a modified version of the standard sample compartment geometry is used,
as shown in Fig. 3. An OAP focuses the input beam at f/3. Half-blocks made of IR absorbing
black felt are used to eliminate inter-reflections among the sample, detector and interferometer,
while providing an input beam geometry onto the sample equivalent to that of the unblocked
case. Neutral density or band pass filters can be placed (tilted, to avoid inter-reflections) before
the sample position.Or, they may be used as the reference for the transmittance measurement, in
order to provide equivalent levels of flux to the detector and hence minimize any errors due to a
detector’s non-linear response. Also, a field stop can be placed just before the sample position to
limit inclusion of thermal radiation from the source aperture itself. The ratio of IR beam signal
measured with the sample-in to sample-out provides the transmittance of the sample.
With the use of appropriate filters and detectors, it is possible to measure transmittance levels
as low as 10−6 with this configuration [3]. For optically thin (<1 mm) samples with fairly neutral
attenuation, the contributions of various error sources to the total uncertainty have been
estimated [Appendix A]. Expanded (k = 2) relative uncertainties are in the range of 0.5 % to1 %
for samples with optical densities up to 3. These uncertainty estimates have been tested by inter-
comparison between two FTIR systems and by inter-comparison with laser measurements on
etalon-free samples [4].
Figure 4 shows a comparison between transmittance measurements from 11 to 20 μm on thin
metal-coated Si samples with optical densities near 1, 2, and 3 made on the Bio-Rad 60A
(predecessor to the Digilab FTS 7000) and DA-3 FTIR spectrometers using the configuration
shown in Fig. 3. Both systems were set up with a SiC2 source and KBr:Ge beamsplitter, and the
spectral resolution was 8 cm−1.
2 Bomem refers it as Globar, their tradename for it. Digilab refers to it as ceramic source.

7
SampleDetector
Half-block
Half-block
Source
ApertureStop
FieldStop
Filter
Reference
Figure 3: Optical layout for FTIR transmittance measurements as described in the text.
Figure 4: Comparison between measurements of three different metal film/Si neutral density
filters performed with two different FTIR systems.
0.012
0.013
0.014
0.015
12 14 16 18 20
0.09
0.1
0.11
Bio-Rad FTS-60A
Bomem DA3
12 14 16 18 20
6 10-4
7 10-4
8 10-4
12 14 16 18 20
Wavelength (m)
Tra
nsm
itta
nc
e
(a) (c)(b)

8
A 2 mm room temperature pyroelectric detector was used with the 60A, while a 1 mm 77 K
mercury–cadmium–telluride (MCT) detector was used with the DA-3. The beam geometry at the
sample position was f/3 in the Bio-Rad and f/4 in the DA-3. For the OD 1 (OD=−log10 T) sample
in frame (a), the two measurement results agree to within 0.5 % over most of the region. For the
higher OD samples results shown in (b) and (c), the signal-to-noise ratio is lower, but the
measurements still agree to within 1 % to 2 %. The OD 2 measurement was performed with the
OD 1 filter as a reference, while the OD 3 measurement was performed with the OD 2 filter as a
reference on the DA-3, and the OD 1 filter on the 60A.
3.1.1 Standard reference materials for τr
NIST Standard Reference Materials (SRMs) 2053, 2054, 2055, and 2056, for IR
transmittance were developed, consisting of thin metallic (Ni:Cr or Cu:Ni) coatings on 0.25 mm
thick, 25 mm diameter high-resistivity Si wafer substrates. The coatings were designed to give
nominally spectrally neutral attenuation with optical densities near 1, 2, 3, and 4 respectively,
over a wavelength range of 2 µm to 25 μm. The thin substrates were chosen to both minimize the
Si absorption peaks at 9 µm and 16 μm, and the effects on the geometry of the transmitted beam.
A plot of the optical density of representative samples for the four OD levels is shown in
Fig. 5. As is evident in this figure, the OD 1 samples have very neutral attenuation versus
wavelength, but the relative spectral variation is larger for the higher OD samples, with the OD 4
filters having a total variation of about 0.6 OD over the measured range. A comparison of the
spectra of these filters with previous commercially available Ni:Cr coated filters has been
presented [5], and a patent has been issued for the Cu:Ni coatings [6], which provide much more
neutral attenuation at the OD 3 and 4 level than do Ni:Cr coatings.

9
Figure 5: Spectra for neutral density filter SRMs.
0
1
2
3
4
5
5 10 15 20 25
Op
tical D
en
sit
y
Wavelength (microns)
Ni:Cr on Si
Ni:Cr on Si
Cu:Ni on Si
Cu:Ni on Si

10
A set of 10 samples for each OD level have been produced and the filters have been
measured to determine the repeatability and reproducibility of the transmittance over a period of
6 months. The metal coatings have been over-coated with 20 nm of SiOx to protect the films
from oxidation, and it has been found that the transmittance of the samples is stable within the
resolution of the measurements over the 6 month time period. Additional measurements have
been performed to determine the spatial uniformity over the central 10 mm diameter circle and
temperature dependence of the filters. Table 1 shows estimates for the various uncertainty
components in the measured transmittances for the OD 1–4 filters, along with the expanded
uncertainties at 10.6 μm wavelength [7]. Some of these filters were sold to customers and the
remaining filters were archived by the NIST SRM office. However, such filters can be newly
produced and characterized for interested parties through the NIST calibration service 38075 S.
3.1.2 Filter transmission measurements for aerospace applications – GOES -13 filters
Four witness filter samples for the GOES-13 channel 6, 13.3 µm band, were measured as a
special calibration test to the researchers at the Satellite Applications Branch (STAR)3 of the
National Oceanic and Atmospheric Administration (NOAA). The requirements were to measure
transmittance with an f/6.5 beam geometry at sample temperatures of 296 K and 84 K at
resolutions of 0.5 cm-1 and 0.2 cm-1 and also to compare results with an f/4 geometry at a sample
temperature of 296 K. The provided samples were identified with serial numbers (SN) 1, 2, 4,
and 28. The samples were all approximately 25 mm in diameter and 2 mm in thickness. They
consisted of dielectric coatings on both sides of crystalline Ge substrates.
The measurements performed consisted of three components: (1) measurement of the filter
transmittances under conditions that simulated as closely as possible their temperature and
incident beam geometry as used in the satellite instrument, (2) dependence of the filter band
passes on temperature, and (3) dependence of the filter band passes on incident beam geometry.
All four filters were measured at temperatures of 84 K and 296 K, at normal incidence with an
f/6.5 geometry and both spectral resolutions of 0.5 cm-1 and 2 cm-1. One filter (SN 1) was also
3 For information on STAR at NOAA, visit http://www.star.nesdis.noaa.gov/star/index.php

11
Table 1: Uncertainty estimates for ND filter transmittances, in % of measured values
Uncertainty source OD 1 OD 2 OD 3 OD 4
Type B
Inter-reflections 0.2 0.3 0.3 0.3
Detector non-linearity 0.1 0.1 0.05 0.05
Detector non-equivalence 0.2 0.2 0.1 0.1
Non-source emission 0.15 0.15 0.15 0.15
Beam non-uniformity 0.2 0.2 0.2 0.2
Beam displacement, deviation, focus shift 0.1 0.1 0.1 0.1
Beam-geometry, polarization 0.2 0.2 0.2 0.2
Sample vignetting 0.03 0.03 0.03 0.03
Sample scattering 0.02 0.02 0.02 0.02
Phase errors 0.1 0.1 0.1 0.1
Sample non-uniformity 0.3 0.4 3.5 4.0
Sample temperature 0.05 0.05 0.05 0.05
Sample aging 0.2 0.2 0.2 0.2
Quadrature sum 0.59 0.68 3.5 4.0
Type A
Relative standard uncertainty in mean at
10.6 μm 0.2 0.2 0.5 2.0
Relative expanded uncertainty at 10.6 μm 1.2 1.4 8.1 9.0

12
measured at 81 K and 94 K. A separate set of transmittance measurements at room temperature
were performed for all four filters at normal incidence with an f/4 incident beam geometry.
The sample temperatures were controlled by using a liquid-He-cooled cryostat in the
schematic setup shown in Fig. 3. The transmittance spectra were measured using a Bomem DA-3
FTIR spectrometer with a Globar source, Ge coated KBr beamsplitter, and Deuterated
TriGlycine Sulfate (DTGS) pyroelectric detector.
The sample was aligned to normal incidence by retro-reflecting the incident beam within
± 0.5. Semi-circular half-blocks were placed in the beam just after the entrance paraboloidal
and before the exit ellipsoidal mirrors in order to prevent inter-reflections among the
interferometer, sample, and detector. The cryostat windows were tilted relative to the sample to
prevent inter-reflections.
For each of the filter transmittance measurements, the filter was moved in and out of the
beam to record sample and reference spectra, which were ratioed to produce the transmittance
spectrum of the filter. Each sample or reference spectrum consisted of the Fourier transform of a
co-addition of 512 or 128 successive interferogram scans of the FTIR, respectively. The process
was repeated three times for each transmittance measurement in order to assess the effects of
drift in the FTIR and positioning repeatability of the sample. The resulting transmittance spectra
were averaged, and the standard deviation was used to produce a type-A uncertainty component
for the repeatability of the measurements.
The sample temperature was set and monitored with a microprocessor-based temperature
controller with PID (proportional-integral-derivative) control. The set temperature was stable to
within ± 0.3 K during a run, after allowing approximately 1 h settling time. A Si diode
temperature sensor at the top of the Cu sample holder in the cryostat, rated to ± 0.5 K
uncertainty, was used to monitor the sample temperature. The estimated standard uncertainty in
sample temperature is ± 0.6 K.
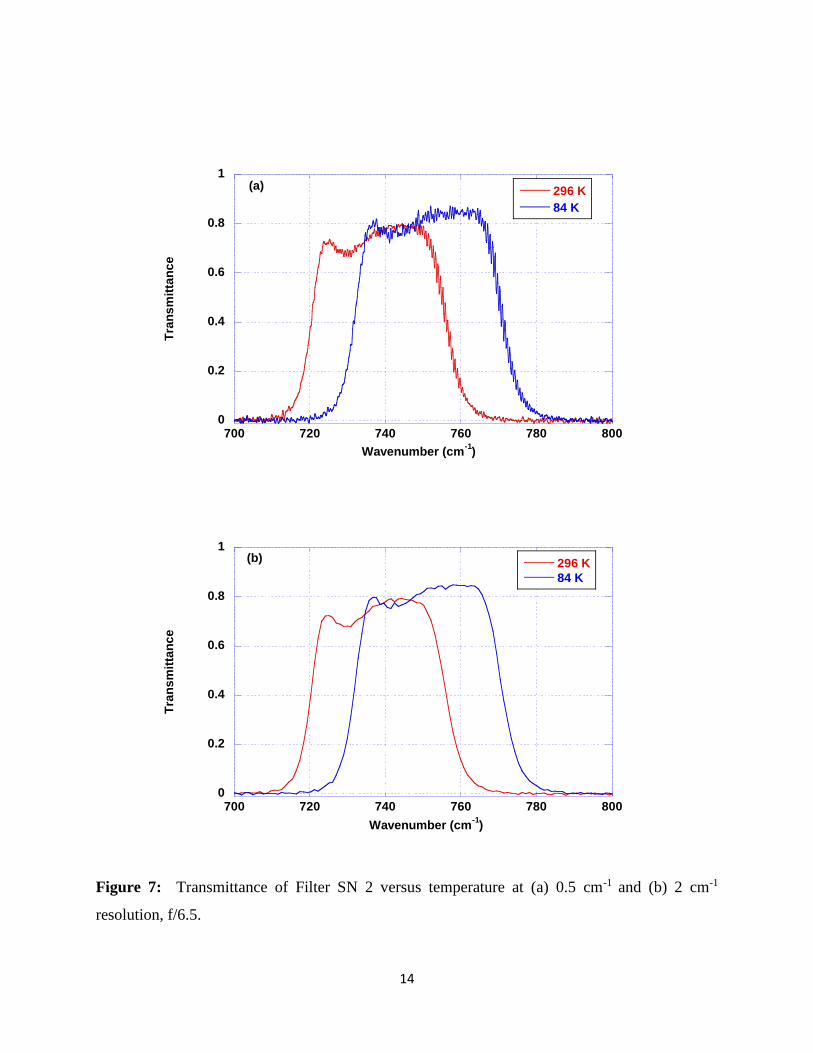
The f/6.5 normal incidence transmittance spectra at 84 K and 296 K for the four filters are
shown in Fig. 6 through Fig. 9. In each figure frame (a) shows the transmittance at 0.5 cm-1
resolution, while frame (b) shows the transmittance at the reduced resolution of 2 cm-1 obtained
by truncating the collected interferograms from the data shown in frame (a). Figure 6 also shows

13
Figure 6: Transmittance of Filter SN 1 versus temperature at (a) 0.5 cm-1 and (b) 2 cm-1
resolution, f/6.5.
0
0.2
0.4
0.6
0.8
1
700 720 740 760 780 800
Filter SN1 f/6.5 0.5 cm-1
resolution
296 K94 K84 K81 K
Tra
ns
mit
tan
ce
Wavenumber (cm-1
)
(a)
0
0.2
0.4
0.6
0.8
1
700 720 740 760 780 800
Filter SN1 f/6.5 2 cm-1
resolution
296 K94 K84 K81 K
Tra
ns
mit
tan
ce
Wavenumber (cm-1
)
(b)
14
Figure 7: Transmittance of Filter SN 2 versus temperature at (a) 0.5 cm-1 and (b) 2 cm-1
resolution, f/6.5.
0
0.2
0.4
0.6
0.8
1
700 720 740 760 780 800
Filter SN2 f/6.5 0.5 cm-1
resolution
296 K
84 K
Tra
ns
mit
tan
ce
Wavenumber (cm-1
)
(a)
0
0.2
0.4
0.6
0.8
1
700 720 740 760 780 800
Filter SN2 f/6.5 2 cm-1
resolution
296 K
84 K
Tra
ns
mit
tan
ce
Wavenumber (cm-1
)
(b)

15
Figure 8: Transmittance of Filter SN 4 versus temperature at (a) 0.5 cm-1 and (b) 2 cm-1
resolution, f/6.5.
0
0.2
0.4
0.6
0.8
1
700 720 740 760 780 800
Filter SN4 f/6.5 0.5 cm-1
resolution
296 K84 K
Tra
ns
mit
tan
ce
Wavenumber (cm-1
)
(a)
0
0.2
0.4
0.6
0.8
1
700 720 740 760 780 800
Filter SN4 f/6.5 2 cm-1
resolution
296 K84 K
Tra
ns
mit
tan
ce
Wavenumber (cm-1
)
(b)

16
Figure 9: Transmittance of Filter SN 28 versus temperature at (a) 0.5 cm-1 and (b) 2 cm-1
resolution, f/6.5.
0
0.2
0.4
0.6
0.8
1
700 720 740 760 780 800
Filter SN28 f/6.5 0.5 cm-1
resolution
296 K84 K
Tra
ns
mit
tan
ce
Wavenumber (cm-1
)
(a)
0
0.2
0.4
0.6
0.8
1
700 720 740 760 780 800
Filter SN28 f/6.5 2 cm-1
resolution
296 K84 K
Tra
ns
mit
tan
ce
Wavenumber (cm-1
)
(b)

17
the data taken at 81 K and 94 K for Filter SN 1. The 0.5 cm-1 data for these filters show Fabry-
Perot fringes due to interference in the Ge substrates. The fringes are eliminated by reducing the
spectral resolution to 2 cm-1, and the signal-to-noise ratio is increased as well. There does not
appear to be a significant shift in the filter band edge positions between these two resolutions, as
the 10 % to 90 % relative transmittance band edges are approximately 7.5 cm-1 to 10 cm-1 in
width. The transmission band shifted to shorter wavelengths as sample temperature was reduced,
as expected.
Figures 10 to 13 show the data taken at 296 K on each of the four filters at both f/4 and f/6.5
incident geometry. Shifts of approximately 0.5 cm-1 to 1 cm-1 are seen in the band edges for
filters SN 1, 2, and 4, while almost no shift is seen for filter SN 28. Again, frame (a) in each plot
displays the data at 0.5 cm-1 resolution and frame (b) at 2 cm-1 resolution. These results were
presented to National Oceanic and Atmospheric Administration (NOAA) researchers as a
calibration report with the data also made available in digital format.
3.1.3 Analysis of uncertainties in the transmittance data
3.1.3.1 Uncertainty in ordinate (transmittance) scale
The largest potential contributors to uncertainty in the ordinate scale for the GOES-13 filter
transmittance measurements are errors due to detector nonlinearity, inter-reflections, beam
geometry changes produced by the sample, non-source emission, and phase errors in the FTIR.
These error sources have been investigated and estimates have been made of their size for IR
neutral density filters [3, 4]. The chief difference for these measurements is the optically thick
substrate, 2 mm thick Ge. The effects of sample emission are reduced because the filters are
nearly non-absorbing in the bands of interest, especially at low temperature. The effects of inter-
reflections are somewhat smaller for in-band measurements because of the filter anti-reflective
design; the half beam blocks eliminate nearly all of this effect, along with the tilting of the
cryostat windows.
Table 2 lists estimated ordinate relative uncertainty components. The various uncertainty
components are added in quadrature to produce a combined systematic, type-B uncertainty
component [8].

18
Figure 10: Transmittance of Filter SN 1 at 296 K, comparing f/4 and f/6.5 incident geometry, at
(a) 0.5 cm-1 and (b) 2 cm-1 resolution.
0
0.2
0.4
0.6
0.8
1
700 720 740 760 780 800
Filter SN1 296 K Resolution = 0.5 cm-1
f/4f/6.5
Tra
ns
mit
tan
ce
Wavenumber (cm-1
)
(a)
0
0.2
0.4
0.6
0.8
1
700 720 740 760 780 800
Filter SN1 296 K Resolution = 2 cm-1
f/4f/6.5
Tra
ns
mit
tan
ce
Wavenumber (cm-1
)
(b)

19
Figure 11: Transmittance of Filter SN 2 at 296 K, comparing f/4 and f/6.5 incident geometry, at
(a) 0.5 cm-1 and (b) 2 cm-1 resolution.
0
0.2
0.4
0.6
0.8
1
700 720 740 760 780 800
Filter SN2 296 K Resolution = 0.5 cm-1
f/4f/6.5
Tra
ns
mit
tan
ce
Wavenumber (cm-1
)
(a)
0
0.2
0.4
0.6
0.8
1
700 720 740 760 780 800
Filter SN2 296 K Resolution = 2 cm-1
f/4f/6.5
Tra
ns
mit
tan
ce
Wavenumber (cm-1
)
(b)

20
Figure 12: Transmittance of Filter SN 4 at 296 K, comparing f/4 and f/6.5 incident geometry, at
(a) 0.5 cm-1 and (b) 2 cm-1 resolution.
0
0.2
0.4
0.6
0.8
1
700 720 740 760 780 800
Filter SN4 296 K Resolution = 0.5 cm-1
f/4f/6.5
Tra
ns
mit
tan
ce
Wavenumber (cm-1
)
(a)
0
0.2
0.4
0.6
0.8
1
700 720 740 760 780 800
Filter SN4 296 K Resolution = 2 cm-1
f/4f/6.5
Tra
ns
mit
tan
ce
Wavenumber (cm-1
)
(b)

21
Figure 13: Transmittance of Filter SN 28 at 296 K, comparing f/4 and f/6.5 incident geometry,
at (a) 0.5 cm-1 and (b) 2 cm-1 resolution.
0
0.2
0.4
0.6
0.8
1
700 720 740 760 780 800
Filter SN28 296 K Resolution = 0.5 cm-1
f/4f/6.5
Tra
ns
mit
tan
ce
Wavenumber (cm-1
)
(a)
0
0.2
0.4
0.6
0.8
1
700 720 740 760 780 800
Filter SN28 296 K Resolution = 2 cm-1
f/4f/6.5
Tra
ns
mit
tan
ce
Wavenumber (cm-1
)
(b)

22
Table 2: Type-B estimated relative uncertainty components for transmittance measurements of
the narrow-band filters.
Detector nonlinearity 0.001
Inter-reflections 0.001
Beam-shifting from sample 0.004
Beam geometry/polarization 0.001
Sample emission 0.001
Sample vignetting 0.000
Sample scattering 0.000
FT Phase Error 0.003
Beam/sample/detector nonuniformity 0.001
Quadrature Sum 0.005

23
The final uncertainties for the in-band transmittance are dominated by beam-shifting from the
sample and FT phase error. A type-A component evaluated from the standard deviation of
successive measurements of each filter is then added in quadrature to the type-B component at
each wavenumber, with the result multiplied by 2 to produce a final expanded uncertainty value
with coverage factor k=2, representing a 95 % confidence interval [7].
3.1.3.2 Uncertainty in abscissa (wavenumber) scale:
The uncertainties in wavenumber can be divided into two classes: (1) intrinsic wavenumber
uncertainty in the FTIR instrument and (2) uncertainty in the filter edge positions propagating
from uncertainties in temperature, beam geometry and average angle of incidence, non-
uniformity in the coating thickness, and the wavenumber-dependent radiometric error sources
listed above [2]. The intrinsic wavenumber uncertainty of the FTIR instrument is small, and is
reduced by measuring the positions of H2O and CO2 vapor lines and comparing with handbook
values. The main component of wavenumber error comes from the difference between the
average HeNe laser path and the IR beam path, including the imperfect collimation of the IR
beam coming from the finite source size. The error tends to be linear in wavenumber, allowing a
constant correction factor to eliminate most of it. We have measured vapor lines and applied
appropriate corrections; the residual relative wavenumber errors are estimated to be on the order
of 5x10⁻⁶. A comprehensive discussion of the wavenumber accuracy in our FTIR measurements
can be found in Ref. 2 which is a report of the development of polystyrene films (SRM 1921) for
calibrating the wavelength scale of infrared spectrophotometers at the FTIS facility.
More important sources of error in the measured filter edge positions include the geometry
and temperature effects listed above. We did not test for the effects of filter non-uniformity.
The shift of the filter edge is linear in temperature and quadratic in angle of incidence. For these
measurements, uncertainty in the actual incident flux distribution in the nominally f/6.5 beam
leads to an appreciable additional component of wavenumber uncertainty. Combined
nonlinearity and phase error in the FTIR can affect the sign of the spectrum near the band edge
and thus produce a shift in the apparent edge position.

24
Table 3 lists uncertainty components in cm-1 for the filter band edge positions for the four
measured filters due to instrument wavenumber error, temperature, angle of incidence, focusing
geometry, non-uniformity, phase error, and wavenumber-dependent radiometric (transmittance
scale) error. The contributions are added in quadrature and the result multiplied by 2 to give an
expanded k=2 uncertainty.
Table 3: Sources of uncertainty in the filter edge positions, along with the quadrature sum and
k=2 expanded uncertainty for each filter. The values are given in cm-1.
Uncertainty
component
(cm-1)
Instrument Wavenumber
Error
0.02
Temperature 0.05
Angle of Incidence 0.1
Focusing Geometry 0.1
Phase error 0.2
Ordinate Error 0.03
Quadrature Sum 0.25
Expanded Uncertainty 0.51

25
3.2. The Infrared Reference Integrating Sphere (IRIS) setup
The schematic in Fig. 14 shows the integrating sphere measurement geometry at the NIST
FTIS facility for diffuse reflectance measurement; for diffuse transmittance measurement with
the sphere, the arrow (input beam) comes from below the sample. We can obtain specular
(regular) reflectance indirectly by performing specular/diffuse measurement. In addition to those
terms defined earlier, the following definitions and symbols are used for describing the
measurements.
reflectance factor R: the ratio of flux reflected from a surface to that reflected from a
perfect reflecting diffuser under the same incident beam geometry.
● directional-hemispherical reflectance (DHR) ργ,h: reflectance, where the incident flux is
confined (in a narrow range) to a single direction to an input angle γ as, for example 8
degrees off normal and the reflected flux is collected over the complete hemisphere
above the surface.
● hemispherical-directional reflectance factor (HDRF) Rh,d: reflectance factor, where the
incident flux is uniformly distributed over the hemisphere above the surface, and the
measured reflected flux is collected (in a narrow range) in a single direction (θ,φ).
● bidirectional reflectance distribution function (BRDF) f(γ; θ, φ): the ratio of reflected
radiance from, to incident irradiance on, a surface, where γ represents the input angle
geometry, as, for example 8 degrees off normal, and θ, φ the exit angles of the reflected
light. This quantity gives a complete description of the manner in which a sample reflects
light.
● integrating sphere throughput (or simply, throughput ), = d/0 the efficiency of the
integrating sphere system, where d is the flux incident on the detector, and 0 the input
flux. [Author’s Note: we will use τ for throughput only in this part of section 3.2 and revert to designating
transmittance starting again with section 3.2.3 ]
● measurement ratio, ρ0 = Vs/Vr, , where Vs is the measured signal in the sample
reflectance geometry and Vr is the signal in the reference geometry. The signals can be
single beam spectra in the FTIR.

26
Figure 14: Sphere measurement geometry for directional-hemispherical: single direction input
and detection over all angles. The schematic shows the setup for Regular/diffuse measurement.
For diffuse transmittance measurement the input beam is from the bottom of the sample.
Input Beam for
Regular/Diffuse Reflectance

27
One of the authors, Leonard Hanssen, developed the absolute DHR method at NIST and
designed the integrating sphere that was custom made and implemented the setup for the
calibration service 38075 S. The complete details of the method and comparison to other
methods can be found in Ref. 9.
The measurement method involves a one-time characterization of the sphere throughput
uniformity over the entire sphere, relative to the specular reflection direction. Subsequent
characterization of samples involve simply performing the reflectance ratio measurement to
produce a DHR value, ρ0 = Vs/Vr. (Details of the sample and reference measurement geometries
discussed here are provided in Section 3.2.3). Small corrections to ρ0 can be performed to reduce
the uncertainty. For a sample known to be nearly Lambertian, the correction to ρ0 is given by
Eq. (3):
𝜌 =𝜌0
𝜏′avg
(3)
𝜏′avg =
1
2𝜋 ∫ ∫ {𝜏 (𝜃, 𝜑)
𝜋
20
2𝜋
0 / 𝜏0}. sin(𝜃) . 𝑑𝜃. 𝑑𝜑 , (4)
where Eq. (4) is the relative throughput (relative to the throughput (τ0) in the specular direction)
averaged over the sphere surface and (θ,φ) are the output angles of the reflected light leaving the
sample. For a sample with arbitrary scattering character, we would use Eq. (5),
𝜌 = 𝜌0 (1+1/𝜏′
avg)
2, (5)
and cite a relative expanded uncertainty given by Eq. 6,
𝑈 ={(
1
𝜏′avg
)−1}
2, (6)

28
reasoning that most samples would have the reflected light encounter a sphere throughput
somewhere in between the perfectly specular and perfectly diffuse case.
For some samples, such as the DHR standards, a reduction in the uncertainty of the DHR
values can be achieved by directly measuring the sample's scattering character, i.e. by measuring
its bi-directional reflectance distribution function (BRDF), f(8°;θ ,φ) under the sphere
measurement condition of 8° incidence angle. After further analysis, Hanssen in Ref. 9 arrives at
the following expression where the absolute DHR will be realized by combining four measured
quantities: (1) a ratio of sample (Vs) to reference (Vr) measurements with the sphere system,
Vs/Vr (or ρ0) ; (2) a ratio of sample-removed (V0s) to reference (V0r) measurements with the
sphere system, V0s/V0r; (3) the relative sphere throughput, as a function of polar (θ) and
azimuthal (φ) angles (relative to the sample surface), τ(θ, φ)/τ0, where τ0 is the
throughput for the direction corresponding to the sample-removed measurement (generally,
the specular direction); and (4) the relative BRDF of the sample for the incidence (80) angle
of the sphere measurement, f(80; θ, φ)/f0, where f0 is an arbitrary constant.
Then the absolute DHR is given by
𝜌8°,2𝜋 = 𝜌0
𝑉0𝑟
𝑉0𝑠 [
∫ ∫ [𝑓(80;𝜃,𝜑)
𝑓0⁄ ]
𝜋2
0
2𝜋0
sin(2𝜃)𝑑𝜃𝑑𝜑
∫ ∫ [𝑓(80;𝜃,𝜑)
𝑓0⁄ ]
𝜋2
0
2𝜋0 [
𝜏(𝜃,𝜑)𝜏0
⁄ ] sin(2𝜃)𝑑𝜃𝑑𝜑
]. (7)
Effectively, the four measurements that form the term outside the brackets of the right-
hand side of Eq. 7 reduce to a ratio of the sample-in signal (Vs) to the sample-out signal (Vr)
(properly corrected for sphere throughput change). Measurements of V0s/V0r for an IR sphere
with the NIST geometry vary from 1 by only 0.2 % to 0.5 %. In this case the sample removed
measurement becomes unnecessary for diffuse samples where the other sources of uncertainty
may be significantly larger. For specular samples, the sample removed measurement is useful to
obtain the highest accuracy.
By combining BRDF and integrating sphere measurements, the NIST method
appears to combine redundant information, since a complete BRDF measurement over a

29
hemisphere of output angles can also be used to obtain ργ,h. However, it is difficult to obtain
sufficiently accurate BRDF over a sufficiently large fraction of the hemisphere (to viewing
angles near grazing) to obtain an accurate ργ,h value. For the method described above,
however, only relative BRDF are required. Since Eq. 7 contains a ratio of integrals over the
same hemispherical angular range, if the measured data are not complete or require
extrapolation, the ratio effectively removes a significant part of the error that would remain in
both individual components. Note that if the throughput is perfectly uniform, the relative
throughput τ(θ,φ)/τ0=1, and Eq. 7 reduces to ργ,h = ρ0, so that corrections to the directly measured
reflectance ratio are only to the extent of the throughput non-uniformity. Note also that there
always is one non-uniform feature: the entrance port. For the NIST sphere, for a Lambertian
sample, the entrance port loss is ≈1 %.
3.2.1 Description of the integrating sphere
The integrating sphere system has been designed and constructed [11] according to the
specifications detailed in the following paragraphs. A photo of the integrating sphere is shown in
Fig. 15. The description and analysis of the detector/nonimaging concentrator system of the
sphere has been described in Ref. 12. The system consists of a nonimaging compound hyperbolic
concentrator (CHC) and a lens in front of 6 mm diameter Hg:Cd:Te (MCT) detector. The CHC
was fabricated out of electroplated nickel with a polished stainless steel mandril and was gold
coated. The lens material chosen was potassium chloride which has one of the lowest refractive
indices of IR lens materials and is the most suitable for reducing the Fresnel effects of the lens.
The CHC and the lens restricted the field of view (FOV) of the detector with minimal loss in the
throughput of the integrating sphere.
The inside wall of the sphere is coated with a material that is a nearly Lambertian diffuser
and at the same time has a high directional hemispherical reflectance (≥ 0.9) for the infrared
spectral range: plasma sprayed copper on a brass substrate, electroplated with gold.

30
Figure 15: Photograph of the integrating sphere for absolute infrared spectral transmittance and
reflectance. On the top is mounted an LN2 cooled MCT detector with a built-in compound
hyperbolic concentrator and lens which views the bottom of the sphere. To the right is some of
the FTIR interface optics, which brings the beam into the sphere through the entrance port on the
sphere side hidden from view. The reference (empty) and sample (with a KRS-5 window) ports
can be seen with adjustable mounts astride them. Due to scattering in the sample, the focused
FTIR beam is visible in the center of the sample.

31
The sphere has entrance, sample, and reference ports all centered on a great circle of the
sphere as shown in Fig. 16. There also is a detector port, with its center located along the normal
to the great circle. The MCT detector dewar located on the port can be seen mounted on the top
of the sphere in Fig.15 and Fig. 16. The detector’s field of view is centered on the same normal
and corresponds to the bottom region of the sphere. The sample and reference ports are located
symmetrically with respect to the entrance port and can be seen in the foreground of Fig. 15 (the
sample port has a KRS-5 sample mounted on it).
The exact locations of the sample and reference ports are in general determined by the angle
of incidence for which the reflectance and transmittance are to be determined. An arrangement
of ports could, in principle, be set up for any angle of incidence from approximately 2° to 28°,
and 32° to 75°, depending on the input beam geometry of the source (or spectrophotometer). For
this sphere, we have selected port locations for 8°, which is close to normal incidence, yet for
which no portion of the f/5 (6° half angle) input beam will be reflected back onto itself. [For
incidence angles in the neighborhood of 30°, a variation of the design would be required so that
the reflected beam from the sample port does not hit the reference port and vice-versa.] The
entrance port is of sufficient size (3.3 cm dia.) to accept the entire input beam, and the sample
and reference ports are also sized (2.22 cm dia.) to accept the entire beam (at the focus, in a
focused geometry). All the ports are circular in shape, with the sphere inside and outside
surfaces forming a knife-edge at the port edge where they meet. In this sphere, as seen in
Fig. 16, the measurement of reflectance is designed for an incident angle of 8° (in general θ), the
sample and reference ports are located at 16° (in general +2θ) and -16° (in general -2θ),
respectively, measured from the center of the sphere and with respect to the line through the
sphere center and the sphere wall (at a point directly opposite the entrance port). Baffles
separating the detector port and the detector field-of-view region from the sample and the

32
Figure 16: Schematic of the integrating sphere geometry

33
reference ports are shown in Fig. 15. The baffles are critical to the sphere performance for
characterization of diffuse samples. The spatial non-uniformity of the integrating sphere
throughput has been evaluated at 10.6 µm wavelength using a CO2 laser system [10] using
diffuse baffles as well as specular baffles. The relative throughput mapping (τ(θ,φ) /τ0) was
performed across the entire spectral measurement range of 1 µm to 18 µm using the FTIR beam
itself as the source [13]. The specular baffles design showed superior throughput performance.
In a raw measurement the diffuse baffle case results were 4.5 % to 9 % below the actual
hemispherical reflectance, whereas this is reduced to only 2.5 % for the specular baffles case.
The arrangement of the ports described above will result in the regions of the sphere wall
illuminated by the specularly reflected or transmitted light and the reference beam to be centered
on the same great circle as the entrance, sample and reference ports. In addition, the regions will
be symmetrically positioned around the entrance port. The reflected or transmitted light also will
be incident at the same angle on these regions. As a result, the reflected or transmitted light will
have nearly identical throughput to the detector. The procedure for orienting the sphere for the
reflectance, transmittance and reference measurements is described in Section 3.2.2.
3.2.2. Sphere mounting and manipulation hardware
The sample and reference mounts, a pair of which can be seen on the sphere in Fig. 15, are
constructed to hold the sample against and centered on the sample port from the outside of the
sphere. During sphere movement, the holders prevent the sample from moving or shifting
relative to the sample port. This is done in such a way as to leave the back of the sample free
and open, so that the beam centered on the sample can proceed through it (for a transparent
sample) without obstruction. This is required to perform either transmittance or reflectance
measurements on transparent samples. This arrangement can also be used to check thin-film
mirrors for optical opacity. In such a case, after passing through the sample, the beam travels to
the purge box enclosure wall, covered by a diffuse black cloth. The reflected light from this
black cloth, which returns to the integrating sphere was measured to be less than 0.5 x 10⁻⁴.
The integrating sphere system includes two motorized rotation stages stacked on top of each
other. The stages are mounted with their axes of rotation parallel to each other. The rotation
axes of the stages are identified in Fig. 17, where each sketch is a top view of the sphere.

34
Figure 17: Sphere measurement geometries for reflectance and transmittance and rotation steps
used to orient the sphere for each (a) reflectance measurement geometry, (c) reference
measurement, and (e) transmittance measurement geometry, (b) and (d) are diffuse component of
transmittance.

35
Stage #1 has its axis of rotation oriented parallel to the normal of the great circle formed by the
entrance, sample and reference port centers, as well as passing through the edge of this circle.
This base stage remains fixed to the optical table. Its rotation axis is perpendicular to the input
beam and passes through the beam focus position. Stage #2 is mounted on the rotation table of
the base stage so that its axis of rotation is located a distance away from the base stage axis
exactly equal to the sphere radius. The integrating sphere is mounted to the rotation table of
stage #2 so that the stage’s axis of rotation is along the sphere axis that includes the center of the
detector port and the sphere center. Two rotation stages, stage 1 centered at the input-beam focus
and sphere wall and stage 2 centered at the sphere center, are used to change geometries.
The function of the base stage (#1) is to vary the angle of incidence of the input beam on the
sphere surface and to switch between reflectance and transmittance measurement geometries.
The function of the stage #2 is to select between the entrance, sample and reference ports for the
beam to be incident upon.
3.2.3. Configuring the Integrating sphere for measuring, ρ, τ , α, and
The arrangement of the input beam and the integrating sphere for absolute reflectance and
transmittance measurements is shown in Fig. 17. The sample reflectance measurement setup is
shown in Fig. 17 (a) (as well as in Fig. 16), the reference measurement in Fig. 17 (c), and the
sample transmittance measurement in Fig. 17 (e). In each diagram, the rotation required to reach
the following diagram is shown as a curved arrow around the appropriate rotation axis. In the
reflectance measurement geometry (a), the input beam passes from the FTIR spectrometer
through the sphere entrance port and onto the sample surface facing the sphere. This is the
typical reflectance geometry for directional-hemispherical sample reflectance in most sphere
systems. The only difference in (a) is the empty reference port (as opposed to one occupied with
a standard for a relative measurement). Upon reflection off the sample, the beam transverses the
sphere and is incident on a region we will denote as the ‘sample specular’ region (see Fig. 16).
From this point, the reflected flux is distributed throughout the sphere in an even fashion due to
the Lambertian coating and ‘integrating’ nature of the sphere.

36
In Fig. 17(a) a clockwise rotation about axis #1 turns the back of the sample to the beam in
Fig. 17(b). An additional clockwise rotation about axis #2 places the (empty) reference port at
the input beam focus in (c) where it continues on to strike the sphere wall at the reference
specular region (labeled in Fig. 16), producing the reference measurement. Figure 17(b) further
illustrates the beam geometry for the reference measurement. Another counterclockwise rotation
about axis #2 results in (d), a repeat of (b). A final counterclockwise rotation about axis #1
positions the sphere in (e) for the transmittance measurement, with the same, as in Fig. 17(a),
angle of incidence on the sample and incidence region on the sphere wall (the sample specular
region).
For absolute specular reflectance the reference measurement, Fig. 17(c), the input beam is
not moved, but enters the sphere through the empty reference port, transverses the sphere, and is
incident on a spot denoted as the ‘reference specular’ region (Fig. 16) This somewhat unusual
geometry is chosen in order to achieve the highest degree of symmetry between the reflectance
and reference measurements. The sample and reference specular regions are symmetrically
located on either side of the entrance port. Because of the symmetry of the sphere design, the
throughput is very nearly equal for these two regions. Since the only other difference between
the sample reflectance and reference measurements is the initial reflection off the sample, the
ratio of sample reflectance and reference measurements is equal to the absolute sample
reflectance (for specular samples). Various sources of error, including the difference in the
sample and reference specular region throughputs, can be included in the expanded measurement
uncertainty, or can be corrected for. The important feature of this measurement technique is there
is no need to use a reference reflectance artifact as a standard for reflectance measurement. The
integrating sphere itself serves the purpose.
For absolute transmittance, the geometry shown in Fig. 17(e) is similar to the reference
measurement geometry, except that the sphere is again reoriented with two rotations so that the
input beam is incident on the back side of the sample surface mounted on the sample port. The
regularly transmitted beam transverses the sphere and is incident on the same specular region as
in the reflectance geometry case, Fig. 17(a). The ratio of the transmittance measurement to the
reference measurement, Fig. 17(c) is equal to the absolute sample transmittance (for specular
samples).

37
By conservation of energy, the absolute absorptance is indirectly obtained by subtracting the
sum of the absolute reflectance and transmittance from unity. The reflectance and transmittance
measurements are made under identical conditions of geometry and wavelength(s). The input
beam is incident on opposite surfaces of a sample for the reflectance and transmittance
measurements. For a uniform sample with identical front and back surfaces, the side of
incidence is immaterial. For samples with some asymmetry, due to for example, a coating on
one or both sides, the sample can be reversed to make a pair of reflectance measurements and
obtain the corresponding pair of absorptance results. And, by Kirchoff’s Law (Eq. 2), this
process provides the sample emittance. Due to this equality of absorptance/emittance, we limit
further discussion to only absorptance, but with the understanding that “emittance” can be
substituted for “absorptance” at all times.
3.2.3.1. Measurement conditions and sphere characterization
The FTIR was configured in two separate modes, a near-infrared mode with a tungsten-
halogen lamp and coated quartz beamsplitter for the spectral region of 1 µm to 3 m (10,000
cm– 1 to 3,300 cm–1), and a mid-infrared mode with a SiC source and coated KBr beamsplitter for
the region of 2 µm to 18 m (5,000 cm–1 to 550 cm–1). The spectral resolution is either 4 cm-1 or
8 cm-1 for all results shown.
Every plot of transmittance and reflectance is obtained by the following procedure. A
number of alternating measurements of reference, sample reflectance, and sample transmittance
(where appropriate) single beam spectra, are performed according to Fig. 17, and repeated
between 8 and 24 times. For each repetition, the transmittance and reflectance are calculated by
taking ratios of the corresponding single beam spectra and a reference single beam spectrum
(obtained by interpolation to reduce error due to instrumental drift). From the resulting series of
individual transmittance and reflectance spectra, the mean transmittance (τ) and reflectance (ρ),
along with the standard deviation and standard error, spectra are calculated. Finally, the
absorptance spectrum is obtained from Sec. 2 Eq. 1.
Each single beam spectrum is obtained by coadding 512 or 1024 scans of the FTIR. The
total measurement time for most of the results shown is several hours (from 2 to 10). The long
measurement times are required to obtain the lowest noise level in the spectra. For less stringent

38
requirements of 1 % uncertainty, shorter measurement times on the order of 10 min to 20 min
will suffice.
In addition to the various potential sources of error due to the Fourier transform
spectrometer, [Appendix A] several other sources of error may play a role in the sphere system
measurements. These are: (1) spatial non-uniformity of the sphere wall regions directly
illuminated by the input beam (reference specular region) or sample first reflection (sample
specular region); (2) non-uniformity of the throughput of the sphere wall region directly
illuminated by the input beam as compared to the region illuminated by the sample first
reflection; (3) overfilling of the entrance port in the sample reflectance measurement; and (4)
overfilling of the sample port in any of the measurements.
Regarding error source (1), the spatial non-uniformity of the sphere, the throughput
evaluation at the 10.6 µm by use of the CO2 laser system [9] showed the local spatial variation
across the region illuminated directly by the reference beam or indirectly by a specularly
reflected or transmitted beam is approximately ± 0.4 % [8]. A translation of the incident light on
the sphere wall of 0.5 cm through deflection or deviation (of 2°), should result in a ± 0.1 %
relative change in throughput. Thus a transmittance measurement of a sample with an effective
wedge of 1° could lead to a 0.1 % relative error in transmittance. Due to the decrease in wall
reflectance and corresponding decrease in throughput with decreasing wavelength, the error due
to spatial non-uniformity is greater at shorter wavelengths, especially in the near infrared
approaching 1 µm [7].
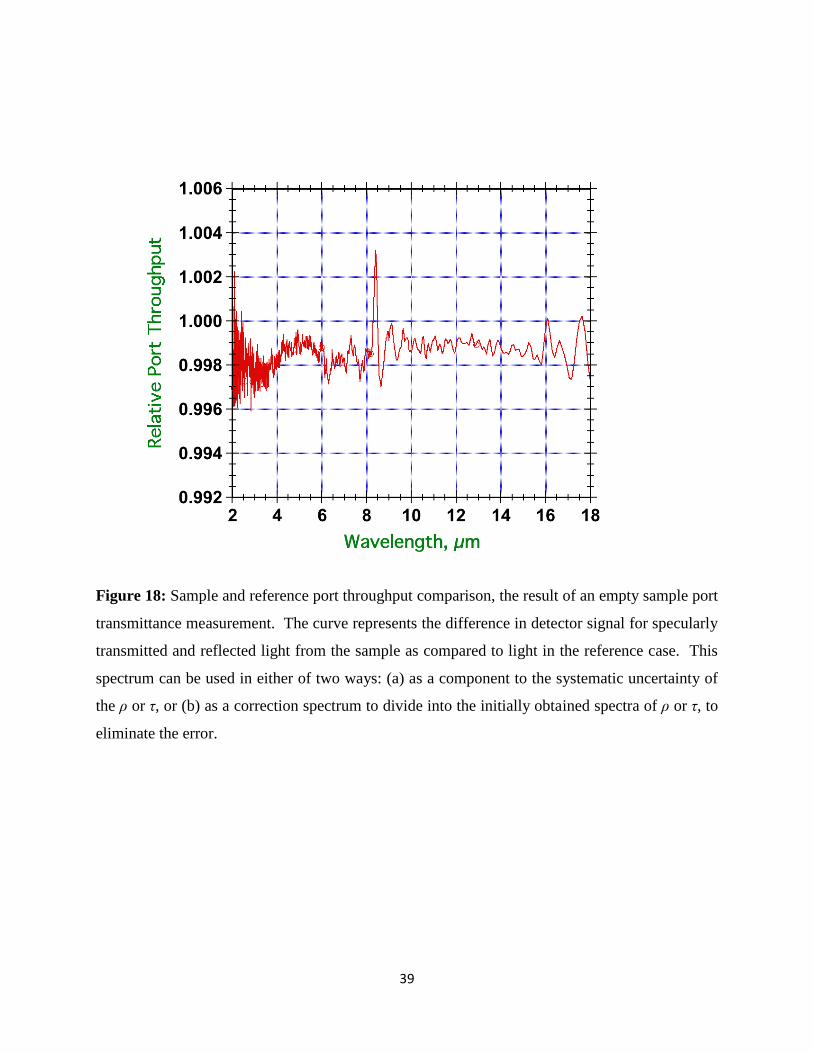
Regarding error sources (2), the difference in throughput between sample and reference port
measurement geometries can lead to a small relative error, varying between 0 % and 0.5 %,
depending on wavelength. The direct measurement of transmittance or reflectance for specular
samples will include this error, but an additional measurement of the transmittance ratio of
empty sample and reference ports can be used to correct for the error. This has been done with
good reproducibility, and need not be repeated unless the optical input system geometry or
alignment is altered. A plot of such a throughput ratio is shown in Fig. 18. Besides the generally
featureless spectral curve, a sharp structure occurs at approximately 8.5 µm. This structure
occurs at the only wavelength where the incident beam from the FTIR is significantly polarized.
39
Figure 18: Sample and reference port throughput comparison, the result of an empty sample port
transmittance measurement. The curve represents the difference in detector signal for specularly
transmitted and reflected light from the sample as compared to light in the reference case. This
spectrum can be used in either of two ways: (a) as a component to the systematic uncertainty of
the ρ or τ, or (b) as a correction spectrum to divide into the initially obtained spectra of ρ or τ, to
eliminate the error.

40
For specular samples, a correction must be made to the measured transmittance or reflectance
values to account for the light from the sphere wall that is back-reflected to the sample (Figs.
17(a) or 17(b)) and lost out of the entrance port of the sphere. In the reference measurement,
(Figure 17(c)), the light back-reflected to the sample ends up striking the sphere wall and is not
lost. The lost flux has been measured to be 0.25 % of the light reflected from the sample. The
measured reflectance or transmittance is thus corrected by multiplying by 1 + 0.0025R, where R
is the sample reflectance. The size of the correction is dependent on the sample reflectance and
shown in Fig. 19.
Regarding error sources (3) and (4), the extent of overfilling the entrance, sample and
reference ports can be examined by a measurement of an empty sample or reference port in
reflectance mode. Any light coming through the entrance port and overfilling the sample (or
reference) port will be measured as a reflectance component with nearly unity reflectance of the
sphere wall region surrounding the port. In addition, any overfilling of the entrance port in that
measurement will result in some light scattering off the rim of the entrance port into the sphere
resulting also in a reflectance component with high effective reflectance. A knife-edge design
could be used to reduce the result of entrance port overfilling, but it is preferable to be very
sensitive to it in order to quantify it (set an upper limit to it). An example of the entrance port
overfilling, obtained by measuring the transmittance of a variable aperture matching the diameter
and location of the sphere entrance port, is shown in Fig. 20. An example of the sample
overfilling error reflectance measurement is shown in Fig. 21. This was obtained after careful
alignment of the sphere system and input FTIR beam.
The remaining important sources of error are related to the FTIR spectrometer, detector,
electronics and FT processing, which are discussed in Appendix A. The combined measurement
error for the transmittance and reflectance measurements will include both FTIR related errors
and the integrating sphere system errors. A straightforward method of evaluating the
measurement accuracy of the system is in comparison with expected results for the optical
properties of common infrared optical materials. Measurements of a few common materials are
presented in Sec. 3.2.4 and the results are used to perform this comparison.

41
Figure 19: Additive correction for specular samples made when using the IRIS; variation with
sample reflectance.

42
Figure 20: Entrance port overfilling measurements in the near infrared and mid infrared setups.

43
Figure 21: Sample port overfill measurement, the result of an empty sample port reflectance
measurement. This is a characterization of the baseline measurement capability of the
integrating sphere system. The result can be used to apply corrections to a black sample
measurement.

44
3.2.4. Specular sample measurement results of ρ, τ, and α
A number of samples of optical components have been characterized using the
integrating sphere system including windows, filters and mirrors. Several examples of window
materials are shown in Fig. 22 to Fig. 29. Both transmittance and reflectance are measured using
the same geometry. From these two quantities the absorptance is simply determined by
subtracting their sum from 1. Comparisons can be made with calculated values from handbook
index of refraction data. This can be done in two ways: (1) a comparison can be made with
calculated transmittance and reflectance; and (2) a comparison can be made with calculated
absorptance.
The calculated τ and ρ values from the n and k in handbooks will have finite uncertainty
values. These will be based on the uncertainties of the original data and the mathematical
processes with which, the index values, n and k, were obtained. Other sources of error in this
comparison include variations in the material itself, such as the method of growth and
processing.
For specific spectral regions for many materials, however, the calculated absorptance can be
determined with insignificant (<10–4) error to be 0. Because of this, the indirectly measured
absorptance in these spectral regions can be used as an accurate evaluation of the total
measurement error, not just as an estimate of uncertainty. If, in addition, a number of materials
with transmittance and reflectance values spanning a significant fraction of their range (0 to 1)
are measured, the measurement error can then be used with reasonable confidence for all
transmittance and reflectance results.
Four common infrared window materials were characterized using the sphere system, with
results plotted in Fig. 22 to Fig. 25. They are Si (0.5 mm thick), ZnSe (3 mm thick), KRS-5 (5
mm thick), and MgF2 (5 mm thick), respectively. For each sample, the transmittance, reflectance
and absorptance are plotted over a spectral range of 2 µm to 18 m (1 µm to 18 µm for Figs. 22).
Each material has a non-absorbing spectral region over some portion of that range. The
reflectance values (in the non-absorbing range) for the selected materials range from 0.05 to
0.45, and the corresponding transmittance values range from 0.55 to 0.95, in the non-absorbing
regions. The MgF2 spectrum exhibits a wide range of values for ρ, τ, and α within the spectral

45
Figure 22: Transmittance, reflectance and absorptance (obtained from 1-ρ-τ) of several common
IR window materials, ranging in index from 3.4 to 1.3: (a) Si.

46
Figure 23: Transmittance, reflectance and absorptance (obtained from 1-ρ-τ) of several common
IR window materials, ranging in index from 3.4 to 1.3: (b) ZnSe.

47
Figure 24: Transmittance, reflectance and absorptance (obtained from 1-ρ-τ) of several common
IR window materials, ranging in index from 3.4 to 1.3: (c) KRS-5.

48
Figure 25: Transmittance, reflectance and absorptance (obtained from 1-ρ-τ) of several common
IR window materials, ranging in index from 3.4 to 1.3: (d) MgF2.

49
range. At 12.5 µm, both the reflectance and the transmittance are 0, at which the absorption
coefficient is substantial (τ 0) and the index is close to 1 (ρ 0).
A closer examination of the indirectly measured absorptance in those regions is shown in
Fig. 26 to Fig. 29. For each material, an absorptance very close to 0 is observed in the regions
with very small k value. These are, repectively: 1.2 m to 5.5 m, 2 m to 13.5 m, 2 m to 18
m, and 2 m to 4.5 m. In some of the results, some spectral features are seen that can be
attributed to contaminants, primarily on the surface, such as water and hydrocarbon modes.
Features from 6 m to 7 m, and 9 m to 10 m, appear in both the ZnSe and KRS-5 spectra.
These features could also, in part, be associated with spectral structure seen in the integrating
sphere throughput variation mapping, performed for characterization of the sphere for absolute
reflectance measurements of non-specular materials.
The indirectly measured absorptance levels in Fig. 26 to Fig. 29 over the spectral ranges cited
above, when interpreted as arising from cumulative measurement error, indicate an absolute level
of error ranging from 0 to 0.002 for the structureless spectral regions and where structure is
observed, up to a maximum of 0.004, at which a structure is observed.
The evaluation of measurement error (using the zero absorptance level) for reflectance of the
transparent materials can be transferred with confidence to the opaque sample case (for which a
zero absorptance test is not feasible). An example is a gold mirror reflectance measurement
shown in Fig. 30. In the opaque sample case, there is only a single reflection, whereas for the
transparent sample case, multiple reflections contribute to the reflectance result. The higher order
reflected beams will be displaced (due to angle of incidence), enlarged (due to focus shift) and
perhaps deviated (due to sample wedge). Hence the effects of spatial non-uniformity of the
sphere throughput will be smaller for the opaque mirror measurement, resulting in a
correspondingly smaller relative measurement uncertainty for the sample reflectance. This is
corroborated by the relative lack of spectral structure in the gold mirror reflectance in Fig. 30.

50
Figure 26: Expanded plot of spectra shown in Fig. 21 highlighting regions with absorptance near
zero: (a) Si. The spectra, in regions where k should be negligible, [11] result from a combination
of (1) cumulative measurement error from all sources in transmittance and reflectance, and (2)
additional absorption due to volume or surface contaminants such as hydrocarbons and water.

51
Figure 27: Expanded plot of spectra shown in Fig. 21 highlighting regions with absorptance near
zero: (b) ZnSe. The spectra, in regions where k should be negligible, [11] result from a
combination of (1) cumulative measurement error from all sources in transmittance and
reflectance, and (2) additional absorption due to volume or surface contaminants such as
hydrocarbons and water.

52
Figure 28: Expanded plot of spectra shown in Fig. 21 highlighting regions with absorptance
near zero: (c) KRS-5. The spectra, in regions where k should be negligible, [11] result from a
combination of (1) cumulative measurement error from all sources in transmittance and
reflectance, and (2) additional absorption due to volume or surface contaminants such as
hydrocarbons and water

53
Figure 29: Expanded plot of spectra shown in Fig. 21 highlighting regions with absorptance near
zero: (d) MgF2. The spectra, in regions where k should be negligible, [11] result from a
combination of (1) cumulative measurement error from all sources in transmittance and
reflectance, and (2) additional absorption due to volume or surface contaminants such as
hydrocarbons and water. The MgF2 spectrum also shows regions of near-zero transmittance and
reflectance, at longer wavelengths.

54
Figure 30: Gold electroplated mirror reflectance.

55
3.2.4.1. Advantages of using IRIS for measurements of ρ, τ and α of specular samples
The benefits of using the integrating sphere for more accurate detection of light played an
important role in the NIST design and development of IRIS for the absolute measurement of ρ, τ
and α of samples. The method is demonstrated in the case of infrared windows and mirror
characterization. The ability to measure both transmittance τ and reflectance ρ in the same
geometry is used to directly quantify the total measurement error for non-absorbing spectral
regions, and thereby also obtain reliable uncertainty values for results outside these regions.
Upon careful study and consideration, it can be observed that use of the integrating sphere
significantly reduces several important sources of measurement error, enabling the levels of
accuracy demonstrated in this paper. These error sources include sample-detector and detector-
interferometer inter-reflections, detector non-linearity, detector spatial non-uniformity, and
sample-beam geometry interaction (beam deviation, deflection and focus shift) [Appendix A].
The integrating sphere system is not suitable for high sample throughput applications. For
these applications other instrumentation designed for fast relative measurements can be used.
Such instruments, in turn, can be calibrated with transfer standard samples that are characterized
with the sphere system. This approach has allowed us to improve the accuracy of all our FTIR
measurement instrumentation, [7] including those designed for variable sample temperature and
variable incident angle characterization, not directly feasible with the sphere system.
For accurate characterization of specular samples, direct mounting onto the sphere is not an
absolute requirement. Effective systems have been built, especially for the ultraviolet-visible-
near-infrared spectral region, that incorporate integrating spheres with detector(s) in the standard
“averaging” mode. However, there are at least two important advantages of mounting the
sample directly onto the sphere. Both of these relate to the characterization of non-ideal
samples. The first is that this design can better handle the worst samples and allow for the
greatest amount of beam deflection, deviation, distortion, and focus shift. The second is that one
can measure samples that are not perfectly specular, but also exhibit some degree of scatter.

56
3.2.5 Absolute total scatter (diffuse reflectance, ρd; diffuse transmittance, d)
measurements.
The IRIS described in Sec. 3.2.3 is an absolute DHR measurement setup and the sphere will
collect all or most of the scattered light in addition to the specular component [11]. To enable
accurate measurements, the mounting hardware is designed to hold samples from the outside
edges. The addition of an 8° compensating wedge enables measurement of normal incidence
reflectance and transmittance and to separate each into diffuse and specular components as
shown in Fig. 31. The wedge is designed with a port slightly smaller than the sample port, whose
sides are polished and gold coated, and tapered to redirect any high angle diffusely reflected light
from the samples, onto the sphere wall. Through use of the compensating wedge for achieving
normal incidence on the sample, a supplementary measurement is made to determine the
scattered component alone as the specular component exits through the entrance window. This
measurement, in addition to the standard reflectance or transmittance measurement, which
includes both specular and diffuse components, allows separation of the specular and diffuse
(scattering) components. For important infrared window materials such as ZnS and CVD
diamond, some scatter is unavoidable and typically wavelength dependent. The ability to detect
and evaluate scattered light is important to understanding infrared materials, quantifying their
behavior and how they can be used appropriately in optical systems. For transmittance, the
specular component can be removed without the aid of a wedge. This is accomplished by
rotating the sphere to the position for −8° incidence on the sample, for which the specularly
transmitted beam will exit the sphere through the entrance port [See Fig. 17 (b) or 17 (d)].
However, with the wedge, normal incidence transmittance can also be measured, using the
wedge as shown in Fig. 31 for the diffuse measurement, and with the wedge inverted for the
standard transmittance measurement. For scattering4 measurement, the reflected (or transmitted)
light is spread out over the entire sphere and encounters a non-uniform throughput. The ratio of
measurements would produce an accurate absolute result if the throughput were perfectly
4 We assume the scatter is Lambertian. We subtract the total scatter measurement from the DHR measurement, and
take the result as the specular component, which requires a minimal correction. Then we multiply the total scatter
measurement by the diffuse calibration curve (Fig. 32) to obtain the diffuse component. Then we add the two results
to get the corrected DHR result. (See next section)

57
Figure 31: Schematic of the Integrating sphere geometry for diffuse component measurement at
normal incidence.

58
uniform. The uncertainty of the DHR result will then depend on the size of the non-uniformity
and the extent to which it can be corrected for, which is described in the following section.
result will then depend on the size of the non-uniformity and the extent to which it can be
corrected for, which is described in the following section.
3.2.5.1. Calibration methodology for measuring ργ,h of non-specular samples
Equation 7 and the following discussion in Sec. 3.2 form the basis for the calibration
methodology. For samples known as diffuse scatterers the term in the long bracket (the integral
ratio) is determined as a correction factor to the ratio of the sample-in signal to the sample-out
signal. The calibration factor for the ideal NIST DHR standard is shown in Fig. 32. These curves
are obtained by the integral ratio in Eq. 1, where the relative BRDF terms are set to 1. The
measured sphere throughput non-uniformity results are used for this evaluation.
Since the integrating sphere coating was selected, we decided to use similar materials for the
calibrated internal DHR standards. This material has consisted of an aluminum substrate coated
with plasma sprayed copper and then over-coated with electroplated gold. As mentioned earlier,
this material reasonably approaches a Lambertian scatterer [10].
Examples of DHR measurements for two other types of diffuse gold samples are shown in Fig.
33 [14]. The simple ratio of sample to reference spectra is shown in Fig. 33 (a). The spectral
structure seen is due to a combination of the integrating sphere throughput (which is a function
of the coating spectral reflectance) and the reflectance of the sample. Application of the
calibration curve for a Lambertian sample [Fig. 32] provides the calibrated value spectra in
Fig. 33 (b). The spectral structure in sample Rough Gold 1 is eliminated, whereas Rough Gold 2
retains structure of several percent. This shows the inherent difference between the types of
coatings, as well as showing the effectiveness of the calibration procedure as well as the
Lambertian character of sample Rough Gold 1.

59
Figure 32: Calibration curves for the near IR and mid IR for a Lambertian (ideal diffuse)
sample.

60
Figure 33: Absolute DHR obtained for two types of diffuse gold samples produced by different
methods.

61
Table 4 shows the uncertainty budget for absolute DHR measurements of a non-specular sample.
The dominant component of uncertainty is that due to the spatial non-uniformity of the
integrating sphere. This component is reduced for samples with known relative BRDF. Appendix
H shows the results of a nationwide inter-laboratory comparison of infrared reflectance. It shows
the case of in plane BRDF measured at 1.55 µm and 10.6 µm used to generate a 3 dimensional
BRDF data and folded with the integrating sphere uniformity map to produce spectral correction
curves for DHR measurement. This procedure is adopted to measure the DHR of Krylon Silver
paint (Appendix H).
3.3. Infrared Gonio-Reflectometer-Transmissometer (IGRT)
The optical layout showing the IGRT setup for angle dependent reflectance measurements is
shown in Fig. 34 [14]. The 50 mm diameter collimated ( f/50) output beam from the FTIR
spectrometer is collected by a 90 off-axis paraboloidal (OAP) mirror with a reflected effective
focal length of 200 mm and focused at f/4 onto a variable aperture plate. The diverging beam
from the aperture is then collected by an insertable (via a translation stage) folding flat mirror
and directed onto a 20° off-axis ellipsoidal (OAE) mirror, which sends a slowly converging
beam to the sample position at the center of the goniometer. Two flat steering mirrors are used
to align the beam to pass through the rotation axis of the goniometer, perpendicular to the plane
of the sample surface. The selected plate aperture produces a spot diameter increased by a factor
of 10 at the sample surface.
The sample is front-surface mounted on a slotted sample holder designed to allow optical
access up to an angle of incidence of 70. Manual tilt and translation stages are used to bring the
surface plane of the sample onto the axis of the motorized sample rotation stage and
perpendicular to the incident beam within 0.3 to define normal incidence. Precision
alignment of the reflectometer is done using the visible output beam of the FTIR spectrometer,
making small adjustments in the sample holder tilt and translation along the beam direction to
ensure that the reflected spot strikes the detector within 0.1 mm of the same place as the
straight through beam with the sample removed from the path. The relative alignment of the

62
Table 4: Uncertainty budget for DHR measurement of a non-specular sample
Uncertainty source Value
(unit less)
Type B Standard Uncertainty Component
Inter-reflections 0.0002
Detector nonlinearity 0.0006
Atmospheric absorption variation 0.0001
Beam flip 0.0010
Inequivalent sample/reference beam alignment 0.0005
Retro-reflected light lost out entrance port 0.0040
Spatial variation of throughput 0.0150
Errors in sphere mapping 0.0050
Entrance port overfill 0.0001
Sample port overfill 0.0002
Beam geometry, polarization 0.0002
Phase errors 0.0002
Quadrature sum 0.016
Type A Standard Uncertainty Component 0.0010
Expanded Uncertainty (k=2) 0.033

63
Figure 34: Optical layout of the goniometric reflectometer system described in text. OAP, 90
off-axis paraboloidal mirror; A, variable aperture plate; M, folding mirror; P, polarizer; RS,
rotation stage; TS, translation stage; S, sample; L, lens; W, vacuum window. Also shown are the
Si:As BIB and InSb photodetectors. The FTIR spectrometer and reflectometer setups are housed
in separate sealed enclosures purged with dry, CO2-free air.
IGRT setup (Goniometer Arrangement)
Purge Enclosures

64
inner and outer goniometer stages is controlled using a small diode laser and quadrant detector
system. Once the system is aligned, the sample is held on the axis of rotation of the
goniometer on which the detector rotates to intercept and measure the reflected beam
(Vs) from the sample. In the reference measurement, the sample is moved out of the
incident beam and the detector is rotated to collect the incident beam and measure directly
(Vr). The sample reflectance (ρo) is thus simply the measurement ratio of the two measured
fluxes:
𝜌𝑜 =𝑉s
𝑉r⁄ (8)
This approach has the advantage of allowing the angle of incidence to be varied easily. To vary
the sample temperature a cryostat shown in Fig. 35, is used. The cryostat holds the sample within
a temperature range of 10 K - 575 K. The cryostat with the sample can be installed at the center
of the goniometer circle for measurements of the sample at various temperature settings.
3.3.1. Detectors for the IGRT
For the 1 µm to 5 µm spectral region, the beam passes through a CaF2 plano-convex lens
and CaF2 window onto a 3.5 mm diameter 77 K photoconductive InSb detector. For the 2 µm to
20 µm spectral region, the beam is reflected through a ZnSe lens and NaCl window onto a
3.1 mm x 3.1 mm photoconductive Si:As BIB detector housed in a liquid helium-cooled cryostat
and maintained at a temperature of 12 K. A cooled NiCr-coated Ge neutral density filter with a
transmittance of 0.001 is placed in front of the BIB detector to attenuate the thermal
background radiation and keep the response within the linear regime. In each case, the spot
diameter on the detector is approximately 2 mm. Both detectors are tilted by 10 relative to the
input beam to avoid inter-reflections with the spectrometer. The photoconductor signals are fed
through a low-noise current pre-amplifier and back into the FTIR for data collection and Fourier
processing.
Figure 36 shows a photograph of the two detector cryostat systems mounted on the
motorized outer rotation stage of the goniometer [15]. When filled with cryogens, the InSb and
BIB detector cryostats are able to maintain the detector temperatures for approximately 30 h and
48 h, respectively. Also visible in Fig. 36 is the two-axis translation stage and rotary table on

65
Figure 35: IGRT setup and the Cryostat to hold samples at chosen temperature

66
Figure 36: Photograph of goniometer showing the two detector cryostats mounted on the outer
rotation stage. The small InSb detector system is visible behind and to the left of the 50 cm tall
liquid-He cryostat housing the Si:As BIB detector.

67
which the BIB detector cryostat is mounted. This is used to manually position the detector
relative to the input beam.
3.3.2. Calibration measurement procedure – Example of a gold mirror sample
For the reflectance measurements in this example [14], the FTIR spectrometer was equipped
with a SiC source and a Ge-coated KBr beamsplitter. The variable aperture in Fig. 34 was set to
1.25 mm diameter. The spectrometer was scanned with a 20 kHz modulation rate for the
reference HeNe laser (15,800 cm-1 wavenumber) with a spectral resolution of 16 cm-1 and boxcar
apodization. 1,500 scans were averaged for each sample or reference spectrum, and the
sequence of measurements was repeated to reduce the effects of drift in the modulated FTIR
spectra or in the detector responsivity. Data were acquired with both the InSb and Si:As BIB
detector systems, for three incident angles from 10 to 65 and both s- and p- polarization. The
total averaging time for each angle and polarization was approximately 20 min. The sample
temperature was near ambient (22 C). Figure 37(a) shows the measured reflectance from 2 µm
to 5 µm wavelength of a 25.4 mm diameter electroplated gold mirror for three incident angles.
While the reflectance of 0.99 at near-normal incidence is not quite as high as that achieved
by protected silver mirrors, there is no apparent H2O-band absorption in the p-polarized data,
with only the weak hydrocarbon absorption near 3.4 µm affecting the smooth variation of
reflectance versus wavelength. The optical response of gold films is also very sensitive to
deposition and environmental exposure conditions, although good quality films are very stable
over time. In Fig. 37(b) and Fig. 37(c) we show calculated reflectance of gold using two
different sets of optical constants that can be found in handbooks [15, 16]. The values in Fig.
37(b) are probably closer to typical commercially available gold mirrors, while those in Fig.
37(c) represent the best values obtained from fresh vacuum-deposited gold measured in-situ with
an ellipsometer. The measured values in Fig. 37(a) fall between these two limits, showing very
good results for an electroplated gold mirror. The relative expanded uncertainty (k = 2) for our
measurements is 0.5 %. A detailed typical error budget is provided in Appendix D.

68
Figure 37: Comparison of measured reflectance values for a gold mirror with predicted values
using two different sets of literature values for n and k of gold. (a) Measurements on a 25.4 mm
diameter electroplated gold mirror for three incident angles, (b) and (c) Calculations using
optical constants from two different sources in the literature.
0.95
0.96
0.97
0.98
0.99
1.00Gold, Measured(a)
0.95
0.96
0.97
0.98
0.99
1.00Gold, Calculated ref 14(b)
0.95
0.96
0.97
0.98
0.99
1.00
2 3 4 5
Gold, Calculated ref 15
Rs(10
o)
Rp(10
o)
Rs(45
o)
Rp(45
o)
Rs(65
o)
Rp(65
o)
Wavelength (um)
(c)

69
4.0. Measurement Assurance
The measurement assurance for the calibration service 38075S is reviewed as two parts. The
first part deals with the work done and published on the sources of error in the measurement
procedures. The second part deals with inter-comparisons of measurements with other methods
at NIST and other laboratories to assess and validate mutual uncertainties. The latter activity is
continued with repeated inter-comparisons internally at NIST and externally with other standard
laboratories to maintain measurement assurance.
4.1. Sources of Error studies
4.1.1. FTIR errors
Appendix A is the complete description of the FTIR errors. The following errors are
addressed and corrections are provided: 1. Inter-reflection; 2. Linearity / Non-equivalence; 3.
Aperture heating; Beam Deviation/Deflection/Detector Non-uniformity; 4. Beam Polarization.
4.1.2. Sphere method and associated errors
Appendix B is the complete description of the work done to establish linearity in the
measurements and any corrections to be applied.
Appendix C describes the following errors due to beam geometry and non-uniformity of the
sphere coating: 1. Port Compensation; 2. Sample Port Overfill; 3. Entrance Port Overfill; 4.
Spatial Uniformity.
4.1.3 Goniometer associated errors
Appendix D describes the alignment errors for the sample and detector on the goniometer
and how to use the laser alignment for improving relative accuracy.

70
4.2 Internal and external intercomparisons
4.2.1 Internal w/ STARR / monochromator/transmittance/reflectance
Appendix E describes the inter-comparison for the regular reflectance and transmittance
measurements with the NIST Spectral Tri-Function Automated Reference Reflectometer
(STARR) and the monochromator facilities at the overlapping wavelengths. The agreement was
within the quoted uncertainties of these facilities. Appendix D, Fig. 6 also shows an
intercomparison with STARR for a gold mirror and the agreement is within quoted uncertainties.
4.2.2 Internal sapphire disk compared to handbook n & k calculations
Appendix D, Fig. 7 shows the measurements using the goniometer and prediction from
theory. The agreement is within the quoted uncertainties.
4.2.3 External w/ National Physical Laboratory (NPL – UK)
Appendix F shows the intercomparison with NPL measurement service that uses
monochromator based methodology and the agreement is within the quoted uncertainties of both
facilities.
4.2.4 External w/ National Metrology Institute of Japan (NMIJ)
Appendix G describes the intercomparison on the absorptance/emittance scales and the
agreement is within quoted uncertainties.
4.2.5 External/Nationwide Intercomparison
Appendix H describes the intercomparison on the IR reflectance scales with NIST as the
Pilot Laboratory and the agreement between laboratories is presented.

71
5.0 Template for Calibration Report
Appendix I shows a template of a calibration report.
6.0 References
[1] J.M. Palmer, "The Measurement of Transmission, Absorption, Emission and Reflection,"
in Handbook of Optics, second ed., Part II, M. Bass, editor, McGraw-Hill, NY (1994).
http://photonics.intec.ugent.be/education/ivpv/res_handbook/v2ch25.pdf
[2] D. Gupta, L. Wang, L. M. Hanssen, J. J. Hsia, and R. U. Datla “Polystyrene films for
calibrating the wavelength scale of infrared spectrophotometers - SRM 1921,” NIST Special Pub.
260-122, U. S. Dept. of Commerce (1995).
[3] Z. M. Zhang, L. M. Hanssen, R. U. Datla, “High-optical-density out-of-band spectral
transmittance measurements of bandpass filters”, Opt. Lett. 20 (1995) 1077-1079.
[4] Appendix A
[5] Z. M. Zhang, R. U. Datla, and L. M. Hanssen, "Development of neutral density infrared
filters using metallic thin films," Mat. Res. Soc. Symp. Proc. 374, 117 (1995).
[6] Z. M. Zhang, R. U. Datla, and L. M. Hanssen, “Copper-Nickel Alloy Films for Infrared
Neutral Density Filters”, U.S. Patent, No. 5,726,797, (1998).
[7] S. G. Kaplan and L. M. Hanssen, “Infrared regular reflectance and transmittance
Instrumentation and standards at NIST,” Analytica Chimica Acta 380, 303-310 (1998).
[8] B. N. Taylor and C. E. Kuyatt, “Guidelines for Evaluating and Expressing the
Uncertainty of NIST Measurement Results,” NIST Technical Note 1297 (1994).
(http://physics.nist.gov/cuu/Uncertainty/index.html)
[9] L. M. Hanssen and K. A. Snail, "Integrating Spheres for Mid- and Near Infrared
Reflection Spectroscopy", in Handbook of Vibrational Spectroscopy, J.M. Chalmers and P.R.
Griffiths (Eds), John Wiley & Sons, Ltd, Volume 2, pp. 1175 - 1192 (2002).
[10] L. M. Hanssen and S. G. Kaplan, “Infrared diffuse reflectance instrumentation and
standards at NIST," Analytica Chimica Acta 380, 289-302 (1998).
[11] L. M. Hanssen, “Integrating-sphere system and method for absolute measurement of
transmittance, reflectance, and absorptance of specular samples,” Applied Optics 40 (19), 3196-
3204 (2001).

72
[12] D. B. Chenault, K. A. Snail, and L. M. Hanssen, “Improved integrating-sphere
throughput with a lens and nonimaging concentrator,” Appl. Opt. 34, 7959-7964 (1995).
[13] L. M. Hanssen, A. V. Prokhorov, V. B. Kromchenko, “Specular baffle for improved
infrared integrating sphere performance”, Proc. of the SPIE, 5192, 101-110 (2003).
[14] S. G. Kaplan, E. J. Iglesias, and L. M. Hanssen, “Angle-dependent infrared reflectance
measurements in support of VIIRS”, Proc. of SPIE, 7082, (2008)
[15] D. W. Lynch and W. R. Hunter, in Handbook of Optical Constants of Solids, ed. E. D.
Palik (Academic Press, San Diego 1998), pp. 286-295.
[16] OPTIMATR 2.1, Johns Hopkins University/Applied Physics Laboratory and AR
Software, Inc., Landover, MD (1993).