
Infrared Investigations of the Composition and Structure ...
158
Rochester Institute of Technology Rochester Institute of Technology RIT Scholar Works RIT Scholar Works Theses 7-2015 Infrared Investigations of the Composition and Structure of Infrared Investigations of the Composition and Structure of Nearby Protoplanetary Disks Nearby Protoplanetary Disks Valerie Ann Rapson Follow this and additional works at: https://scholarworks.rit.edu/theses Recommended Citation Recommended Citation Rapson, Valerie Ann, "Infrared Investigations of the Composition and Structure of Nearby Protoplanetary Disks" (2015). Thesis. Rochester Institute of Technology. Accessed from This Dissertation is brought to you for free and open access by RIT Scholar Works. It has been accepted for inclusion in Theses by an authorized administrator of RIT Scholar Works. For more information, please contact [email protected].
Transcript of Infrared Investigations of the Composition and Structure ...

Rochester Institute of Technology Rochester Institute of Technology
RIT Scholar Works RIT Scholar Works
Theses
7-2015
Infrared Investigations of the Composition and Structure of Infrared Investigations of the Composition and Structure of
Nearby Protoplanetary Disks Nearby Protoplanetary Disks
Valerie Ann Rapson
Follow this and additional works at: https://scholarworks.rit.edu/theses
Recommended Citation Recommended Citation Rapson, Valerie Ann, "Infrared Investigations of the Composition and Structure of Nearby Protoplanetary Disks" (2015). Thesis. Rochester Institute of Technology. Accessed from
This Dissertation is brought to you for free and open access by RIT Scholar Works. It has been accepted for inclusion in Theses by an authorized administrator of RIT Scholar Works. For more information, please contact [email protected].

Infrared Investigations of the Composition andStructure of Nearby Protoplanetary Disks
by
Valerie Ann Rapson
A Dissertation submitted in partial fulfillment of the requirements for the Degree ofDoctor of Philosophy in Astrophysical Sciences and Technology,
in the College of Science, Rochester Institute of Technology
July 2015
Approved by:
Dr. Andrew RobinsonDirector, Astrophysical Sciences and Technology

ASTROPHYSICAL SCIENCES AND TECHNOLOGY
COLLEGE OF SCIENCE
ROCHESTER INSTITUTE OF TECHNOLOGY
ROCHESTER, NEW YORK
CERTIFICATE OF APPROVAL
Ph.D. DEGREE DISSERTATION
The Ph.D. Degree Dissertation of Valerie Ann Rapson has been examined and approved
by the dissertation committee as satisfactory for the dissertation requirement for the Ph.D.
degree in Astrophysical Sciences and Technology.
Dr. Joel Kastner, ProfessorThesis Advisor, Chester F. Carlson Center for Imaging Science
Dr. Joshua Faber, Associate ProfessorCommittee Member, Center for Computational Relativity and Gravitation
Dr. Dan Watson, ProfessorCommittee Member, University of Rochester, Department of Physics & Astronomy
Peter Bajorski, ProfessorProvost’s Representative, Kate Gleason College of Engineering
Date:

iii
Dedication
For my loved ones.
Without their support, this dream would have never become a reality.

iv
Acknowledgments
The completion of my dissertation would not have been possible without the support of my
friends, family and colleagues.
First, I would like to thank my parents Aaron and Ann Rapson, and sister Theresa
Rapson, for their continual love and encouragement to dream big and reach for the stars.
From the early days of Star Trek and Coast to Coast AM to Graduation day in 2015, they
have supported me and my love all things space without question. It is because of their
support and generosity that I was able to attend college and obtain my Ph.D.
I’m incredibly thankful to have Nick Ruffle and his family in my life. Over the last ten
years, he has selflessly encouraged me to pursue my education, whether it be 15 or 1500
miles away from home. Thanks to his encouragement and support, I had the courage to
attend and succeed in graduate school, and for that I am eternally grateful.
My research endeavors and career goals would never have been met without the guid-
ance of my advisor, Joel Kastner. Joel has assisted with everything from research questions
to grant writing to career decisions, and his hard work and confidence in my abilities as an
astronomer have helped me become the person I am today. I’m very thankful for all the
opportunities Joel provided me with to travel across the world and extend my knowledge of
astronomy by networking with fellow astronomers and educators. Thanks to Joel’s support,
I was able to experience life as a researcher, adjunct professor, and STEM educator, and
these experiences ultimately shaped my career goals and allowed me to succeed in life.
Graduate school was one of the most difficult times in my life, and I would not have
survived if it weren’t for my fellow graduate students. Long days at the white board com-
pleting homework and studying for tests, and late night messaging with research project
questions are just a few of the memories I will both cherish and tuck deeply away as we all
complete our dissertations and move on to the next stages of life. I’m especially thankful

v
to my officemates Dave Principe and Kristina Punzi for helping with proposal writing, an-
swering programming questions, and giving me much needed breaks from my research via
ridiculousness on the internet.
I would also like to thank all of my collaborators for their help with data reduction,
insightful discussions, and paper revisions. Specifically, I would like to thank Ben Sargent
and Germano Sacco for their assistance with reducing and analyzing Spitzer and Herschel
data, along with David Wilner, Katherine Rosenfeld, and Sean Andrews for their discus-
sions and previous studies which helped make this work possible. I appreciate the insightful
discussions and use of Herschel data from Greg Herczeg and Nienke van der Marel, which
greatly enhanced parts of this dissertation. Max Millar-Blancher, Bruce Macintosh, Dean
Hines, Motohide Tamura and Marshall Perrin were instrumental in helping me obtain, re-
duce and analyze the GPI data, which produced incredibly successful results. I’m also very
thankful for my committee members Josh Faber, Peter Bajorski and Dan Watson for their
comments and suggestions which greatly improved my research projects. For without my
colleagues’ endless assistance with proposal writing, data reduction and paper revisions,
none of this would have been possible.
Finally, I would like to thank the AST graduate program and the faculty and staff at RIT
for their support and assistance over the years. Specifically, I would like to thank Michael
Richmond for giving me my first opportunity to do real, hands-on observational astronomy,
and for inspiring me to make science education as fun, silly, and enlightening as he does in
his classroom.

vi
Abstract
Near- to far-infrared imaging and spectroscopy of nearby (.100 pc), low mass pre-main
sequence stars that are orbited by gaseous and dusty circumstellar disks allow astronomers
to probe the chemical composition and structure of protoplanetary disks, and further un-
derstand disk evolution and planet formation processes. In this dissertation, I present an
infrared imaging and spectral analysis of the young star-disk systems V4046 Sgr, T Cha
and MP Mus. V4046 Sgr is a nearby (D∼73 pc), ∼20 Myr-old spectroscopic binary sur-
rounded by a large (R∼350 AU) circumbinary disk. T Cha and MP Mus are similarly
nearby (D.110 pc) and young (.22 Myr old) single-star systems orbited by relatively
gas-rich circumstellar disks. Both V4046 Sgr and T Cha display evidence for recent or on-
going planet formation in the form of large inner disk holes detected via submm imaging.
Spitzer and Herschel spectroscopy of V4046 Sgr reveals emission from atomic and molec-
ular species (e.g., [Ne II], [O I], OH) suggesting that high-energy photons from the central
stars are driving the disk chemistry. Modeling of the Spitzer spectra reveals the presence of
large (µm-sized) dust grains and a high crystallinity fraction, signifying that grain growth
and planet formation may be occurring within the inner disk hole. Analysis of the Spitzer
and Herschel spectra of T Cha and MP Mus reveal that MP Mus shows emission from
[O I] and has a high mass fraction of crystalline dust, whereas T Cha shows emission from
[Ne II] and has a low crystallinity fraction. Polarimetric/coronagraphic imaging of V4046
Sgr at near-infrared wavelengths with the new Gemini Planet Imager (GPI) traces starlight
scattered off small (.µm-sized) dust grains in the inner disk. The GPI imaging reveals
a double ring structure with gaps at R.12 AU and R∼18 AU, suggesting one or more
Jupiter-sized planets are forming in the disk. These data, combined with current and future
infrared to sub-mm imaging and spectroscopy of nearby young star-disk systems, provide
essential constraints on simulations aimed at understanding the conditions in which giant
planets might form in protoplanetary disks.

vii
Contents
Dedication . . . . . . . . . . . . . . . . . . . . . . . . . . . . . . . . . . . . . . iii
Acknowledgments . . . . . . . . . . . . . . . . . . . . . . . . . . . . . . . . . iv
Abstract . . . . . . . . . . . . . . . . . . . . . . . . . . . . . . . . . . . . . . . vi
1 Introduction . . . . . . . . . . . . . . . . . . . . . . . . . . . . . . . . . . . 11.1 Star Formation in Giant Molecular Clouds . . . . . . . . . . . . . . . . . . 1
1.1.1 Disk Evolution and Lifetimes . . . . . . . . . . . . . . . . . . . . 21.2 Young Low-Mass Stars and Circumstellar Disks . . . . . . . . . . . . . . . 4
1.2.1 Finding and Observing Young Stars with Circumstellar Disks . . . 61.2.2 Disk Properties . . . . . . . . . . . . . . . . . . . . . . . . . . . . 10
1.3 Planets and Circumstellar Disks . . . . . . . . . . . . . . . . . . . . . . . 131.3.1 Planet Formation in Circumstellar Disks . . . . . . . . . . . . . . . 141.3.2 Modeling of Planet-disk interactions . . . . . . . . . . . . . . . . 16
1.4 Targets . . . . . . . . . . . . . . . . . . . . . . . . . . . . . . . . . . . . . 191.4.1 Case Study: V4046 Sgr . . . . . . . . . . . . . . . . . . . . . . . . 191.4.2 Accretion and Magnetic Processes in V4046 Sgr . . . . . . . . . . 201.4.3 Structure and Composition of the Disk Around V4046 Sgr . . . . . 211.4.4 Other Nearby Young Stars of Interest . . . . . . . . . . . . . . . . 24
1.5 Infrared Telescopes and Detectors . . . . . . . . . . . . . . . . . . . . . . 291.5.1 Spitzer Space Telescope . . . . . . . . . . . . . . . . . . . . . . . 301.5.2 Herschel Space Observatory . . . . . . . . . . . . . . . . . . . . . 311.5.3 Gemini Observatory . . . . . . . . . . . . . . . . . . . . . . . . . 32
2 A Combined Spitzer and Herschel Infrared Study of Gas and Dust in theCircumbinary Disk Orbiting V4046 Sgr . . . . . . . . . . . . . . . . . . . . 362.1 Introduction . . . . . . . . . . . . . . . . . . . . . . . . . . . . . . . . . . 382.2 Observations and Data Reduction . . . . . . . . . . . . . . . . . . . . . . . 40
2.2.1 Spitzer IRS . . . . . . . . . . . . . . . . . . . . . . . . . . . . . . 40
viii
2.2.2 Herschel PACS and SPIRE . . . . . . . . . . . . . . . . . . . . . . 412.3 Analysis: Gas Emission Features . . . . . . . . . . . . . . . . . . . . . . . 45
2.3.1 Emission line identification . . . . . . . . . . . . . . . . . . . . . 452.4 Discussion . . . . . . . . . . . . . . . . . . . . . . . . . . . . . . . . . . . 50
2.4.1 H2 . . . . . . . . . . . . . . . . . . . . . . . . . . . . . . . . . . . 502.4.2 [Ne II] and [Ne III] . . . . . . . . . . . . . . . . . . . . . . . . . . 532.4.3 H2O and OH . . . . . . . . . . . . . . . . . . . . . . . . . . . . . 552.4.4 [O I] . . . . . . . . . . . . . . . . . . . . . . . . . . . . . . . . . . 572.4.5 HCN . . . . . . . . . . . . . . . . . . . . . . . . . . . . . . . . . 582.4.6 CO . . . . . . . . . . . . . . . . . . . . . . . . . . . . . . . . . . 58
2.5 Silicate Dust . . . . . . . . . . . . . . . . . . . . . . . . . . . . . . . . . . 592.5.1 Dust grain modeling . . . . . . . . . . . . . . . . . . . . . . . . . 592.5.2 Dust Composition . . . . . . . . . . . . . . . . . . . . . . . . . . 602.5.3 Amending the Rosenfeld et al. (2013) model . . . . . . . . . . . . 63
2.6 Conclusions . . . . . . . . . . . . . . . . . . . . . . . . . . . . . . . . . . 66
3 A Spitzer and Herschel Spectral Analysis of the Disks Around the YoungStars MP Mus and T Cha . . . . . . . . . . . . . . . . . . . . . . . . . . . 683.1 Introduction . . . . . . . . . . . . . . . . . . . . . . . . . . . . . . . . . . 683.2 Observations and Data Reduction . . . . . . . . . . . . . . . . . . . . . . . 70
3.2.1 Spitzer IRS . . . . . . . . . . . . . . . . . . . . . . . . . . . . . . 703.2.2 Herschel PACS and SPIRE . . . . . . . . . . . . . . . . . . . . . . 73
3.3 Analysis . . . . . . . . . . . . . . . . . . . . . . . . . . . . . . . . . . . . 763.3.1 Silicate Dust Grain modeling . . . . . . . . . . . . . . . . . . . . . 763.3.2 Spectral line identification . . . . . . . . . . . . . . . . . . . . . . 78
3.4 Discussion . . . . . . . . . . . . . . . . . . . . . . . . . . . . . . . . . . . 813.4.1 Ne II emission from T Cha and MP Mus . . . . . . . . . . . . . . . 823.4.2 Emission Features in Herschel Spectra of MP Mus . . . . . . . . . 863.4.3 Dust . . . . . . . . . . . . . . . . . . . . . . . . . . . . . . . . . . 88
3.5 Conclusions . . . . . . . . . . . . . . . . . . . . . . . . . . . . . . . . . . 94
4 Near-infrared Scattered Light Imaging of V4046 Sgr with the GeminiPlanet Imager . . . . . . . . . . . . . . . . . . . . . . . . . . . . . . . . . . 964.1 Introduction . . . . . . . . . . . . . . . . . . . . . . . . . . . . . . . . . . 984.2 GPI Integral Field Polarimetry Data reduction . . . . . . . . . . . . . . . . 99

ix
4.2.1 Calibration Files . . . . . . . . . . . . . . . . . . . . . . . . . . . 1004.2.2 Science Frames . . . . . . . . . . . . . . . . . . . . . . . . . . . . 104
4.3 Observations and Data Reduction for V4046 Sgr . . . . . . . . . . . . . . 1094.4 Results . . . . . . . . . . . . . . . . . . . . . . . . . . . . . . . . . . . . . 1114.5 Discussion . . . . . . . . . . . . . . . . . . . . . . . . . . . . . . . . . . . 115
4.5.1 Comparison of GPI and SMA imaging of V4046 Sgr . . . . . . . . 1154.5.2 Evidence for radial dust segregation by size . . . . . . . . . . . . . 1164.5.3 Implications for planet formation in the disk around V4046 Sgr . . 118
4.6 Conclusions . . . . . . . . . . . . . . . . . . . . . . . . . . . . . . . . . . 119
5 Conclusions & Future work . . . . . . . . . . . . . . . . . . . . . . . . . . 1215.1 Summary . . . . . . . . . . . . . . . . . . . . . . . . . . . . . . . . . . . 1215.2 Future Work . . . . . . . . . . . . . . . . . . . . . . . . . . . . . . . . . . 123
5.2.1 High Resolution Near-infrared Imaging . . . . . . . . . . . . . . . 1235.2.2 Modeling of Nearby Young Stars . . . . . . . . . . . . . . . . . . 1245.2.3 High Resolution Submm/radio Imaging and Spectroscopy . . . . . 1255.2.4 Spectral Type Determination With Near-Infrared Spectra . . . . . . 1255.2.5 TMT and James Webb . . . . . . . . . . . . . . . . . . . . . . . . 126

x
List of Tables
1.1 Properties of V4046 Sgr from the literature adopted in this dissertation . . . 251.2 Properties of T Cha from the literature adopted in this dissertation . . . . . 281.3 Properties of MP Mus from the literature adopted in this dissertation . . . . 30
2.1 Emission lines in the Spitzer IRS spectrum of V4046 Sgr . . . . . . . . . . 462.2 Emission lines in all Herschel spectra of V4046 Sgr . . . . . . . . . . . . . 472.3 Model dust mass percentages for the V4046 Sgr disk . . . . . . . . . . . . 60
3.1 Model dust mass percentages for the MP Mus, T Cha and V4046 Sgr disks . 773.2 Spectral lines in the Spitzer IRS spectrum of T Cha . . . . . . . . . . . . . 813.3 Emission features in the Spitzer IRS and Herschel PACS and SPIRE spectra
of MP Mus . . . . . . . . . . . . . . . . . . . . . . . . . . . . . . . . . . 823.4 Observations of [Ne II] emission at 12.8 µm from T Cha . . . . . . . . . . 843.5 [Ne II] and X-ray luminosity and mass accretion rate for T Cha, MP Mus
and V4046 Sgr . . . . . . . . . . . . . . . . . . . . . . . . . . . . . . . . 853.6 Observations of [O I] emission at 63 µm from nearby young stars . . . . . . 88

xi
List of Figures
1.1 Cartoon showing the evolution of a circumstellar disk around a single starthroughout its lifetime. Image reproduced from Williams & Cieza (2011) . 2
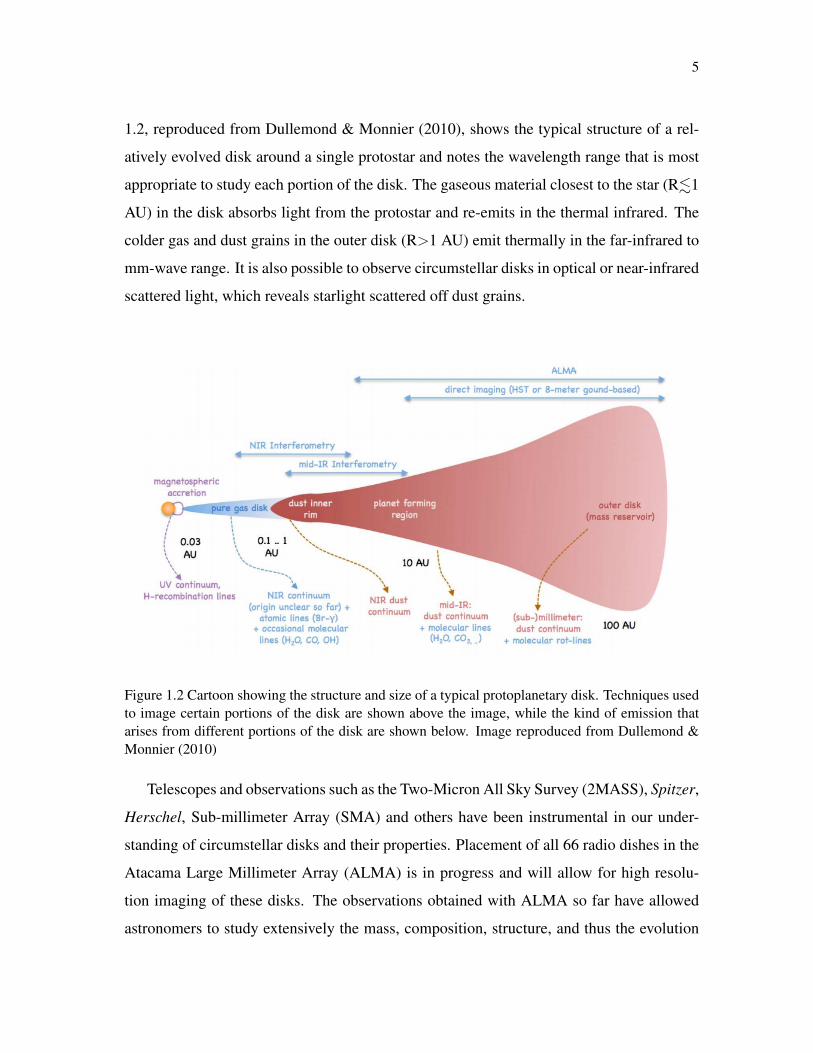
1.2 Cartoon showing the structure and size of a typical protoplanetary disk.Techniques used to image certain portions of the disk are shown above theimage, while the kind of emission that arises from different portions of thedisk are shown below. Image reproduced from Dullemond & Monnier (2010) 5
1.3 Representative graphs of flux versus wavelength for three different classesof YSOs. Top: Class 0/I YSOs show a large infrared excess with a largepositive SED slope, and display no evidence of stellar photospheric emis-sion. Middle: Class II YSOs have a moderate infrared excess, a flatter SEDslope, and the stellar photosphere is readily detectable. Bottom: Class IIIstars have little to no infrared excess as they are just protostars whose diskhas dissipated. Image reproduced from Lada (1987) . . . . . . . . . . . . . 7
1.4 Top: ALMA 870 µm continuum image of HL Tau, reproduced from ALMAPartnership et al. (2015). Bottom: Raw and gaussian-convolved model im-ages of the HL Tau disk at H-band (1.6 µm; left) and 870 µm (right), as-suming three planets with M=0.2 MJ are located at 12, 30 and 65 AU.The top row shows the apparent image assuming the disk is face on, whilethe bottom assumes and inclination of 45 . Figure reproduced from Donget al. (2014). . . . . . . . . . . . . . . . . . . . . . . . . . . . . . . . . . . 18
1.5 Information about the Spitzer IRS modules from the IRS handbook:irsa.ipac.caltech.edu/data/SPITZER/docs/irs/irsinstrumenthandbook/ 31
1.6 Schematic of the optical path of the Gemini Planet Imager in imaging po-larimetry mode. Figure reproduced from Perrin et al. (2015). . . . . . . . . 33
1.7 Left: Schematic of the polarized spot pairs for GPI images taken in polari-metric mode. Center: Raw GPI image taken in coronagraphic/polarizationmode with 36,000 spot pairs. Right: Zoom-in of the spot pairs near thecenter of the raw image. Figure reproduced from Perrin et al. (2015). . . . . 35

xii
2.1 Spitzer IRS spectrum of V4046 Sgr with emission features labeled. Top:5.5-19.5 µm spectrum with an inset showing the H2 0-0 S(1) (J=3→1) lineat 17.035 µm. Bottom: 19.5-35 µm spectrum with emission features labeled. 42
2.2 Top: Herschel PACS (black) and SPIRE (blue) spectra of V4046 Sgr. Thedata have been rebinned by a factor of 3 . . . . . . . . . . . . . . . . . . . 43
2.3 [O I] (top left), o-H2O (top right), OH 2Π3/2 J= 32→ 5
2(bottom left) and
CO J=17→16 (bottom right) emission features detected (or tentatively de-tected) in the unbinned V4046 Sgr Herschel PACS SED spectrum withgaussian fits overlaid (red) . . . . . . . . . . . . . . . . . . . . . . . . . . 44
2.4 H2O emission features tentatively detected in the Spitzer IRS spectrum ofV4046 Sgr with Gaussian fits overlaid . . . . . . . . . . . . . . . . . . . . 48
2.5 Herschel PACS line scan spectroscopy data with emission features labeled. 492.6 H2 gas mass inferred from the strength of the 17 µm S(1) emission line as a
function of temperature (solid curve). The horizontal dashed lines representthe masses of Jupiter, canonical solar nebula, and the total gas+dust massof the disk around V4046 Sgr (Rosenfeld et al., 2013). . . . . . . . . . . . 52
2.7 Spitzer IRS spectra (black) with best fit silicate model overlaid (green).The cool dust components of the model are shown in red, and the warmdust components are shown in blue. . . . . . . . . . . . . . . . . . . . . . 61
2.8 Spitzer and Herschel spectra (black) with our silicate dust model (blue)from 7-33 µm and the Rosenfeld et al. (2013) model (red solid) from 33-600 µm overlaid. The Rosenfeld et al. (2013) model from 0.25-33 µm isshown as the red dotted line. Orange asterisks are photometric data pointsfrom the literature (B & V from Høg et al. (2000), I from Messina et al.(2010), J,H & K from Cutri et al. (2003), AKARI 65 & 90 µm data fromYamamura et al. (2010), WISE bands 1-4 data from Cutri & et al. (2013),and 350,450, 800 & 1100 µm data from Jensen et al. (1996)). . . . . . . . . 64
2.9 Temperature at a given disk radius in the Rosenfeld et al. (2013) model forlarge grains (R >5 µm; black solid line) and small grains (R ∼5 µm; bluesolid line). The horizontal dashed lines at 340 K and 116 K represent thetwo temperatures of the micron-sized silicate dust grains in our model. . . . 65
3.1 Top: Combined SL and LL Spitzer IRS data for MP Mus obtained in Au-gust 2004. Bottom: Combined SH and LH Spitzer IRS data for MP Musobtained in April 2005. The SL and SH modules have been scaled by 1.09and 1.05, respectively, to correct for a flux mismatch between the modules. 71
xiii
3.2 Original reduction of the LH Spitzer IRS data for T Cha obtained in May2005. The data exhibit a stair-step or scalloped pattern due to high darkcurrent near the blue end of the spectral images. This results in a fluxmismatch between the spectral orders. . . . . . . . . . . . . . . . . . . . . 72
3.3 SH nod 1 (left) and nod 2 (right) Spitzer IRS data for T Cha obtained in May2005. The spectral orders are the vertical white columns where wavelengthincreases from bottom to top and left to right. The background dark current(lighter pixels between the spectral orders) appears brighter near the blueend (bottom) of each image, causing the scalloping and artificially highflux at the blue end of the spectral orders seen in Figure 3.2. . . . . . . . . 73
3.4 Top: Combined SH and LH Spitzer IRS data for T Cha obtained in July2004. Bottom: Combined SL, SH and LH Spitzer IRS data for T Chaobtained in May 2005. The excess dark current in the LH data has beencorrected and the resulting spectrum no longer exhibits order scalloping. . . 74
3.5 Herschel PACS (blue) and SPIRE (black) spectra of MP Mus. . . . . . . . 753.6 Low resolution Spitzer IRS spectra (black) of MP Mus with best fit silicate
model overlaid (green). The cool dust components of the model are shownin red, and the warm dust component are shown in blue. . . . . . . . . . . 78
3.7 High resolution Spitzer IRS spectra (black) of T Cha from July 2004 withbest fit silicate model overlaid (green). The cool dust components of themodel are shown in red, and the warm dust component are shown in blue. . 79
3.8 High resolution Spitzer IRS spectra (black) of T Cha from May 2005 withbest fit silicate model overlaid (green). The cool dust components of themodel are shown in red, and the warm dust component are shown in blue. . 80
3.9 Zoom-in of [Ne II] detection in the Spitzer IRS spectra (black) of T Chawith gaussian fits to the data overlaid (red). Left feature is from July 2004and right feature is from May 2005. . . . . . . . . . . . . . . . . . . . . . 81
3.10 Zoom-in of H I (top left) Spitzer IRS detection (black) and the [O I] (topright) and OH doublet (bottom) Herschel PACS spectra (black) of MP Muswith gaussian fits to the data overlaid (red). . . . . . . . . . . . . . . . . . 83
3.11 Luminosity of the [O I] emission at 63 µm compared to X-ray luminos-ity (top left), mass accretion rate (top right), effective temperature (bot-tom left), and disk gap size (bottom right) for transitional disk (blue),non-transitional disks (red) and outflow sources (black) from Keane et al.(2014). Data for MP Mus, T Cha, V4046 Sgr, and TW Hya are shown asgreen asterisks. . . . . . . . . . . . . . . . . . . . . . . . . . . . . . . . . 87

xiv
3.12 Dust model fits to the Spitzer IRS spectra of T Cha from July 2004 (black)and May 2005 (blue). . . . . . . . . . . . . . . . . . . . . . . . . . . . . . 89
3.13 Comparison of the shapes of the MP Mus (blue), V4046 Sgr (red) lowresolution and July 2004 T Cha (black) high resolution Spitzer spectra. . . . 90
4.1 Example master dark frame with an exposure time of 60 s. Some verticalstriping is still visible even after the images have been processed with thedestriping primitive. . . . . . . . . . . . . . . . . . . . . . . . . . . . . . . 101
4.2 Example master sky flat taken through the K2 filter. The small dot patternacross the image represents the 36,000 spot pairs created by the IFS. . . . . 102
4.3 Example bad pixel map created from individual hot and cold pixel maps.White pixels in the image are marked as bad pixels. During data reduction,the corresponding bad pixels in the science frame are replaced with theaverage value of the eight surrounding pixels. . . . . . . . . . . . . . . . . 103
4.4 Example of a dark image with the location of the highest amount of micro-phonics noise circled in yellow . . . . . . . . . . . . . . . . . . . . . . . . 104
4.5 Left: Raw science image with the pol-cal grid overlaid. Note that the gridappears smooth across the entire image. Right: Zoomed-in portion of theimage to show that the grid is connecting pairs of orthogonal spots. Afew bright white (hot) pixels and black (cold) pixels are still visible in theimage, possibly due to cosmic rays or bad pixels not marked as such in thebad pixel map. . . . . . . . . . . . . . . . . . . . . . . . . . . . . . . . . . 105
4.6 Schematic of the data reduction process for GPI polarimetric data. Figurereproduced from Perrin et al. (2015). . . . . . . . . . . . . . . . . . . . . . 106
4.7 False-color orthogonally polarized J-band image of V4046 Sgr showingthe location of the four satellite spots (green circles) used to determine thelocation of the occulted star system. . . . . . . . . . . . . . . . . . . . . . 109
4.8 Example images of V4046 Sgr taken in coronagraphic/polarimetric modeat J-band with GPI showing the three main steps in the data reduction pro-cess. a) Raw image of V4046 Sgr at a waveplate angle of 0. b) Pair oforthogonally polarized images that result after step 6 of the data reductionprocess. c) Stokes I (left), Q (middle), and U (right) images of V4046 Sgrresulting after step 10 in the data reduction process. The stokes Q and Uimages show a clover-leaf pattern indicative of a strongly polarized source(e.g. Kastner & Weintraub, 1996) . . . . . . . . . . . . . . . . . . . . . . . 110

xv
4.9 Left : Total intensity J (top) and K2 (bottom) images with polarization de-gree (p=P/I) (pseudo-)vectors overlaid in green for pixels where the totalpolarized intensity is greater than 40 counts. Middle : J (top) and K2 (bot-tom) polarized intensity (Ur) images. Right: Ur scaled by r2, where r is thedistance in pixels from the central binary, corrected for projection effects.All images are shown on a linear scale. The coronagraph is represented bythe black filled circles and images are oriented with north up and east to theleft. A small artifact from slight telescope mispointing during acquisitionof the J-band image sequence can be seen to the west of the coronagraph inthe Ur images. . . . . . . . . . . . . . . . . . . . . . . . . . . . . . . . . . 112
4.10 Radial profile extracted from the J band Ur image binned 2x2 along the 76
position angle showing the East-West (black) and South-North (orange)brightness profile of the disk. The horizontal red lines show the locationof the coronagraph. The uncertainties in each bin of the Ur profiles, deter-mined from Qr, at both J and K2 is ∼6 counts. . . . . . . . . . . . . . . . . 114
4.11 Left: J (blue) and K2 (red) surface brightness (SB) curves. The error barsare smaller than the symbol size. The black dashed line represents r−2 fitfrom ∼14 - 28 AU and black solid line represents r−5.5 fit from ∼28 - 45AU. Right: Background subtracted surface brightness curves multiplied byr2 with the surface density of small (µm-sized; black dashed) and large(mm-sized; black solid) dust grains from the Rosenfeld et al. (2013) modeloverlaid. The surface density of both the small and large dust grains hasbeen scaled up by 104. . . . . . . . . . . . . . . . . . . . . . . . . . . . . 115
4.12 Azimuthal profile plots of the inner (11-18 AU; blue) and outer (18-30 AU;red) ring at J (left) and K2 (right) where the flux of the nearest five pixels atevery point has been averaged together. The azimuthal profile is measuredclockwise, where 0o is the eastern most point along the equatorial planeposition angle of 76o. . . . . . . . . . . . . . . . . . . . . . . . . . . . . . 116
4.13 Three color composite image comparing SMA 1.3mm continuum emis-sion (blue with yellow contours overlaid; Rosenfeld et al., 2013) and GPIJ (green) and K2 (red) total linear polarized intensity. The SMA data hasa beam size of 0.74” × 0.38” and has been registered such that the peaksof the mm-wave continuum emission lie equidistant from the coronagraphcenter. . . . . . . . . . . . . . . . . . . . . . . . . . . . . . . . . . . . . . 117

1
Chapter 1
Introduction
1.1 Star Formation in Giant Molecular Clouds
Giant molecular clouds (GMCs) are the birthplaces of stars. They are comprised mostly
of molecular hydrogen gas, but also contain a vast array of atoms and molecules such as
helium, carbon, nitrogen, oxygen, organic compounds, and water (e.g. Bergin & Tafalla,
2007). Initially, magnetic fields, turbulence and hydrodynamic waves support the cloud
against gravitational collapse (Nakano & Nakamura, 1978; Gammie & Ostriker, 1996).
Over time, the process of ambipolar diffusion causes neutral particles to decouple from the
ions in the cloud and this initially subcritical medium begins to gravitationally collapse.
A cloud fragment of uniform density, ρ, becomes supercritical and collapses to form a
protostar when the mass of the cloud is greater than the Jeans mass (Jeans, 1902). Assuming
no external pressure from the interstellar medium, the Jeans mass is given by
MJ = (5kT
GµmH
)32 (
3
4πρo)12 (1.1)
where k is the Boltzmann constant, T is temperature, µ is mean molecular weight, mH is
the mass of hydrogen, and G is the gravitational constant. In the absence of external factors
(turbulence, stellar radiation, magnetic fields, etc.), the cloud will collapse on roughly the
free-fall timescale, given by
tff = (3π
32
1
Gρo)12 . (1.2)
For a typical molecular cloud with ρ ∼ 10−17 kg m−3, the free fall time is ∼ 105 years.
Molecular clouds have angular momentum (Arquilla & Goldsmith, 1986; Goodman
et al., 1993; Caselli et al., 2002) which must be conserved as a cloud core collapses to

2
form a protostar. This results in the formation of a circumstellar or, in the case of a binary
system, a circumbinary disk around the young protostar(s). The disk tends to form quickly,
within about 0.5 Myr after initial collapse has begun (Evans et al., 2009), and extends out
to the centrifugal radius, defined as R(t) ∝ ω2t3, where t is time since disk formation and
ω is the angular rotation rate of the protostar (Terebey et al., 1984). Over the dynamical
timescale of a GMC (∼17 Myr), the cloud will fragment and ∼2% of the molecular gas
will form stars (Murray et al., 2010).
1.1.1 Disk Evolution and Lifetimes
Figure 1.1 Cartoon showing the evolution of a circumstellar disk around a single star throughout itslifetime. Image reproduced from Williams & Cieza (2011)
Circumstellar disks experience various evolutionary processes such as vicious accre-
tion, X-ray and ultraviolet (UV) photoevaporation, dust settling and grain growth, and
dynamical interactions with nearby stars and planetary companions (Williams & Cieza,
2011). Figure 1.1 outlines the evolutionary stages of a typical circumstellar disk. Initially,

3
protostars are surrounded by a radially continuous disk of gas and dust which extends from
R.1 AU to the full radius of the disk. Disk evolution is closely coupled to mass accretion
from the inner disk onto the star, as accretion generated UV and X-ray radiation photoe-
vaporates the gas out to a radius of up to 10 AU (Gorti et al., 2009). Material from the
inner disk accretes onto the star via magnetic field lines, causing the star to grow more
massive, while far-UV (FUV; ∼6-10 eV) photons begin to evaporate the outer flared disk.
At early times, the accretion rate dominates the evaporation rate as viscous evolution trans-
ports material from the outer disk to the inner disk and this material then accretes onto the
star (figure 1.1a).
Over time, dust grains begin to grow and settle towards the disk midplane, leading to
further grain coagulation and the possibility of planetesimal, and eventually planet, for-
mation (figure 1.1b). Observations of circumstellar disks at submm wavelengths, which
trace the large (& mm-sized) grains, show strong dust continuum intensities out to mm-
wavelengths, indicative of large grain growth at large disk radii (Rodmann et al., 2006;
Cortes et al., 2009). Gas and small dust grains continue to move inward and accrete onto
the star.
After a few million years, the disk mass is depleted to a point where the outer disk
can no longer fuel the inner disk, and the accretion rate and photoevaporation rate become
roughly equal (Alexander et al., 2006; Owen et al., 2010). At this point, photoevaporation
clears out an inner hole a few AU in radius on a timescale of . 105 year (figure 1.1c).1
Disks that exhibit a large inner gap or depletion of material at submm wavelengths are
often called transitional disks (Calvet et al., 2002; D’Alessio, 2009; Espaillat et al., 2014).
In these cases, the large dust grains in the inner disk have either sublimated, or been pushed
outwards due to dynamical interactions between the disk and any substellar or planetary
companions. Many transitional disk sources show near-infrared excess indicative of warm,
optically thick material within the submm gap, and are often referred to as pre-transitional
disks. This material may fill the inner gap, or be indicative of an inner and outer disk
1Andrews et al. (2011) show that photoevaporation does not act quickly enough to carve out holes tens of AU widein protoplanetary disks, and thus attribute large gaps observed in some protoplanetary disks to grain growth and planetformation.
4
component with a gap in between. Extreme-UV (EUV; ∼10-120 eV) photons continue to
expand the hole, preventing any material from flowing into the hole, thus halting accretion
onto the star. The result is a protoplanetary disk with a large inner gap and an outer disk
filled with grains of various sizes and a small amount of gas. Once all of the gas in the
disk dissipates, the dust grain evolution becomes dominated by effects such as planetary
system dynamics and stellar radiation; in particular, the smallest dust grains (r . 1 µm)
are blown out via radiation pressure. The resulting debris disk is filled with large grains
and/or planetesimals (figure 1.1d). Over time, these disks may evolve to become planetary
systems similar to our own; or the large bodies may collide, break apart and evaporate,
leaving behind a lone star. Planet formation is discussed further in Section 1.3.
It is difficult to associate an exact age with each step in the disk evolution process, as
these processes are dependent on initial disk and stellar mass, and perhaps the existence
of companion stars. In general, Spitzer studies (Meyer et al., 2006; Evans et al., 2009)
have shown that a typical disk survives for 2-3 Myr but rarely longer than 10 Myr (Padgett
et al., 2006; Cieza et al., 2007; Wahhaj et al., 2010, for example,). There are, of course,
important exceptions to this rule, such as the young systems V4046 Sgr, MP Mus and T
Cha, the focus of this dissertation. These three systems are between ∼5-20 Myr old, and
are still accreting from massive gaseous and dusty disks (see Section 1.4). The reason for
the longevity of these disks is an active area of research, and may be due to the presence of a
massive planetary companion, close binary stellar companion, or distant stellar companion
altering the dynamical state of these star-disk systems (e.g. Huelamo et al., 2011; Kastner
et al., 2011, 2012).
1.2 Young Low-Mass Stars and Circumstellar Disks
Young, low mass (M.1 M) stars surrounded by circumstellar disks have been observed
throughout the Milky Way galaxy, both in distant GMCs (D∼1000s of parsecs away) and
in nearby moving groups (D.100s of parsecs). The most convenient way of finding and
studying these disk sources is to search via the infrared, submm, mm and beyond. Figure
5
1.2, reproduced from Dullemond & Monnier (2010), shows the typical structure of a rel-
atively evolved disk around a single protostar and notes the wavelength range that is most
appropriate to study each portion of the disk. The gaseous material closest to the star (R.1
AU) in the disk absorbs light from the protostar and re-emits in the thermal infrared. The
colder gas and dust grains in the outer disk (R>1 AU) emit thermally in the far-infrared to
mm-wave range. It is also possible to observe circumstellar disks in optical or near-infrared
scattered light, which reveals starlight scattered off dust grains.
Figure 1.2 Cartoon showing the structure and size of a typical protoplanetary disk. Techniques usedto image certain portions of the disk are shown above the image, while the kind of emission thatarises from different portions of the disk are shown below. Image reproduced from Dullemond &Monnier (2010)
Telescopes and observations such as the Two-Micron All Sky Survey (2MASS), Spitzer,
Herschel, Sub-millimeter Array (SMA) and others have been instrumental in our under-
standing of circumstellar disks and their properties. Placement of all 66 radio dishes in the
Atacama Large Millimeter Array (ALMA) is in progress and will allow for high resolu-
tion imaging of these disks. The observations obtained with ALMA so far have allowed
astronomers to study extensively the mass, composition, structure, and thus the evolution

6
of circumstellar disks and how their evolution leads to planetary system formation.
1.2.1 Finding and Observing Young Stars with Circumstellar Disks
Classifying Young Stars
Most young stars in GMCs are too distant for any surrounding disk to be directly imaged
with current telescope technology. Therefore, we must supplement imaging with spectro-
scopic methods to determine the presence and evolutionary state of a circumstellar disk.
Since gas and dust in circumstellar disks glows thermally in the infrared, astronomers usu-
ally use the presence of infrared excess (i.e. excess flux at mid- to far-infrared wavelengths)
as a signature that a disk is present around a young star.
Since the late 1980’s, young stellar objects (YSOs) have been classified into different
categories, or “classes”, based on infrared emission and/or spectral characteristics signify-
ing the existence of an envelope or disk surrounding the young star. Such a classification
is accomplished most directly by studying the slope of the sources infrared spectral energy
distribution (SED) between 2 and 25 µm:
αIR =dlogνFνdlogν
=dlogλFλdlogλ
(1.3)
(Lada, 1987, Figure 1.3). Class 0/I sources that are deeply embedded in their natal gas
cloud (Lada, 1987; Andre et al., 1993) have a rising infrared continuum (αIR > 0.3) . Flat
spectrum sources (−0.3 < αIR < 0.3; Greene et al., 1994) are an intermediate class where
the envelope has recently dissipated, exposing the protostar and disk. Class II sources
(−1.6 < αIR < −0.3) are accreting material onto the protostar from an optically thick
circumstellar disk, and Class III sources (αIR < −1.6) are “diskless” (i.e., show little/no
evidence of circumstellar material out to ∼25 µm) pre-main sequence stars. Some sources
exhibit a lack of near-infrared excess, but show an increase in excess at longer wavelengths.
These are classified as transitional disk sources and have a hole in their inner disk that can
be up to a few tens of AU in radius, as determined, for example, by followup thermal
submm imaging. Where infrared spectra and/or full SED’s are unavailable, a combination
of select near and mid-infrared colors can also be used to classify YSOs (Gutermuth et al.,

7
2008, also see Rapson et al. (2014) for an application of this method), along with X-ray
activity at levels of LX /Lbol ∼ 10−3, which is a defining characteristic of young stars
(Feigelson & Montmerle, 1999).
Figure 1.3 Representative graphs of flux versus wavelength for three different classes of YSOs.Top: Class 0/I YSOs show a large infrared excess with a large positive SED slope, and display noevidence of stellar photospheric emission. Middle: Class II YSOs have a moderate infrared excess,a flatter SED slope, and the stellar photosphere is readily detectable. Bottom: Class III stars havelittle to no infrared excess as they are just protostars whose disk has dissipated. Image reproducedfrom Lada (1987)
A parallel spectroscopic based method of classifying YSOs exists for stars in Class II
and Class III. Low-mass optically visible YSOs with and without disks are often referred
to as T Tauri stars, and can be classified as Classical T Tauri stars (CTTS) or Weak T

8
Tauri stars (WTTS) based on their spectral properties (specifically, their H-alpha emission-
line equivalent widths). CTTS exhibit strong Hα and UV emission indicative of accre-
tion, whereas WTTS show weak or absent emission lines which suggests that accretion
has ceased. These characteristics are generally consistent with the infrared classifications
where Class II and Class III sources correspond to those of CTTS and WTTS, respectively.
Classification methods beyond the infrared are also useful when the orientation of the
source in unknown. For example, an edge-on, Class II YSO will appear highly extinguished
and deeply embedded, and may be improperly classified as a Class 0/I object. While in-
frared classification of YSOs seems to have worked well for most studies, information at
a variety of wavelengths is needed to obtain the most accurate source classifications and
thereby fully understand star-disk systems.
Resolving Nearby Circumstellar Disks
Young stars with disks that are within a few hundred parsecs are close enough for many
modern telescopes to image the disk directly and possibly resolve disk structure.
Circumstellar disks contain large amounts of dust that are easily resolved by submm
and radio telescopes such as the SMA, ALMA and others. Imaging the dust continuum
probes cool material in the disk, and interferometry allows for imaging at a variety of spa-
tial scales. For example, ALMA, with all 66 radio dishes working in tandem, will provide
an angular resolution of ∼5 milliarcseconds at the shortest wavelengths and widest config-
urations (Peck & Beasley, 2008). At these long wavelengths, dust continuum dominates
any contribution from the stellar photosphere and is believed to have a low optical depth.
Therefore, the emission traces the location and morphology of mm or larger dust grains
throughout the disk (Beckwith et al., 1990). Many of the sources imaged to date show
evidence for inner disk gaps or clearings at submm wavelengths, possibly due to photoe-
vaporation or grain growth and planet formation (see Figure 1.4, along with Espaillat et al.,
2014, for a compilation of images). These are prime targets for future imaging and model-
ing with radiative transfer codes to study the later stages of disk evolution and planet+disk
interactions.
9
Interferometry and single dish telescopes can also be used to trace emission from molecules
in the disk. CO, for example, traces the location of cool H2 gas and allows for determina-
tion of the full radius of the disk. CO also allows for determination of disk gas mass (given
inferences concerning CO abundance relative to H2) an disk kinematics (see Section 1.2.2).
Recently, a handful of unbiased single dish radio surveys (e.g., Kastner et al., 2014a; Punzi
et al., 2015) have been conducted to search for emission from molecules previously unde-
tected in circumstellar disks. These surveys, like previous, targeted molecular line studies,
have yielded detections of molecules such as HCN, CN, HCO+, C2H and many isotopo-
logues of these and other molecules. These observations allow for estimates of the column
density of these molecular species, as well as excitation temperatures and thus approximate
locations of different molecules in the disk.
Imaging of bright, nearby YSOs at infrared wavelengths traces emission from warm
gas and dust out to radii of ∼few tens of AU. These images allow astronomers to study
the structure of the disk at size scales similar to that of our own solar system, and trace
any material that is interior to the gaps images at submm wavelengths. Near-infrared direct
imaging with the Hubble Space Telescope has revealed spiral features, ring like structures,
and other asymmetries in the inner disk around young stars (e.g., Weinberger et al., 1999;
Schneider et al., 2014), possibly due to planet formation. Infrared interferometric imaging
with the Very Large Telescope Interferometer (VLTI) and Keck Interferometer (KI) traces
dust emission in the inner disk at milliarcsecond resolution. These data allow for deter-
mination of the inner disk shape, brightness profiles and inner disk radius (e.g. Anthonioz
et al., 2015). Near-infrared polarimetric imaging, which traces light scattered off small (.
µm-sized) dust grains, has been conducted for many nearby young stars and star groups as
part of the SEEDS program (Tamura, 2009) on the Subaru Telescope, as well as with the
new Gemini Planet Imager on Gemini South (Macintosh et al., 2014, see Chapter 4).
This high resolution imaging at infrared wavelengths opens up the possibility of directly
detecting stellar and sub-stellar companions that may be responsible for the inner disk gaps
observed around many nearby young stars. Low mass stellar companions are relatively
easy to detect, due to their inherent brightness at infrared wavelengths, and have been found

10
responsible for clearing gaps around some star-disk systems, such as CoKu Tau/4 (Ireland
& Kraus, 2008). Planetary-mass companions are more difficult to detect and require high
brightness contrast imaging to do so. Planetary-mass companions may have been detected
via high-contrast non-redundant mask interferometry around LkCa 15 (Kraus et al., 2011)
and T Cha (Huelamo et al., 2011), but it is very difficult to distinguish a planetary-mass
companion from brightness changes due to dust density asymmetries in the disk (Cieza
et al., 2013; Kraus et al., 2013; Olofsson et al., 2013).
Overall, imaging of nearby protoplanetary disks at infrared to radio wavelengths al-
lows for detailed studies of the structure and kinematics of these disks. As imaging tech-
niques improve, astronomers are able to probe closer to the central stars, and possibly image
planetary-mass companions in the disk. These data, combined with infrared spectroscopic
studies of the disk chemistry, will provide new insights on circumstellar disk evolution and
planet formation processes.
1.2.2 Disk Properties
Disk Mass and Kinematics
Initially, a circumstellar disk can extend to hundreds of AU from the star, and is composed
mostly of cold molecular hydrogen (H2). Since H2 does not readily emit photons due to
the electric quadrupole nature of its rotational transitions, it is not easily detectable (Bitner
et al., 2007). Thus, we must rely on measurements of other molecular tracers to determine
the size and mass of the disk. For young stars that are sufficiently nearby to resolve disk
structure, we can determine the structure, mass and kinematics of the disk by tracing other
molecules at submm wavelengths.
The total gas mass in circumstellar disks is often estimated from observations of CO
at mm and submm wavelengths, as CO is the second most abundant molecule in the disk
and its rotational transitions are easily observable from the ground. By assuming a CO/H2
ratio of ∼ 10−4 (the ratio for dark cloud cores; Goldsmith et al. (1997)) an estimating the
CO emission-line optical depths via the strengths of CO isotopologues, an approximate gas
mass of the disk can be obtained (e.g. Williams & Best, 2014; Punzi et al., 2015). This,
11
combined with the assumption that the gas:dust ratio of a circumstellar disk is similar to
that of the ISM (100:1, Bohlin et al. (1978)), reveals the total mass of the disk, assuming the
disk is optically thin. However, it has been shown that circumstellar disks are not optically
thin, and that the gas:dust ratio in circumstellar disks is likely not constant throughout its
lifetime and may vary dramatically from the 100:1 ratio assumed for the ISM (Dullemond
et al., 2007). Overall, circumstellar disks tend to have initial masses of .few percent that
of the central star (Hartmann et al., 2006; Vorobyov, 2009; Williams & Cieza, 2011). These
estimates are consistent with inferences concerning the “minimum mass solar nebula”, i.e.
the mass of the disk which formed our solar system, which is thought to have contained ∼
0.03M of material (Chiang & Youdin, 2010).
Sub-arcsecond imaging of disks at submm wavelengths also allows for the determina-
tion of disk radius, orientation and kinematics. Continuum dust emission traces disk radii,
often out to R∼100 AU, while CO emission traces the cool gas at larger radii. Modeling of
velocity-resolved CO surface brightnesses provides constraints on the (usually degenerate)
combination of disk inclination and central star mass (e.g. Qi et al., 2004; Rodriguez et al.,
2010; Rosenfeld et al., 2012b,a).
Disk Chemistry
Studies of circumstellar disks at infrared, submm and radio wavelengths have revealed the
existence of a variety of atoms and molecules that play a crucial role in the evolutionary
processes of disks. For example, gaseous molecules act as cooling agents throughout the
disk, while dust grains affect the opacity and therefore the thermal and density structure
of the disk (Semenov, 2010). Here, we briefly summarize previous work that has been
conducted on disk gas and dust composition, and how we use the presence or lack of
certain features to understand different processes of disk evolution.
Through infrared spectral studies, we detect many emission features due to significant
temperature gradients from the disk mid plane to the exterior (Calvet et al., 1991; Malbet &
Bertout, 1991). In most cases, observed spectral features only measure the disk atmosphere
as the gas becomes optically thick towards the mid plane. Emission features may also arise

12
from optically thin regions of the disk, such as gaps in transitional disks.
Observations at near- to far-infrared wavelengths also trace the warm gas in the inner
disk and help us understand the disk composition, as well as accretion and photoevapo-
ration processes and grain growth (Salyk, 2011). Emission from fundamental vibrational
transitions of CO at 4.6 µm has been detected in many circumstellar disks (e.g., Najita
et al., 2000, 2003; Rettig et al., 2004; Salyk et al., 2007) and traces hot gas at radii of
R.1 AU. The presence of this emission around Class II and transition disks (Rettig et al.,
2004; Salyk et al., 2007) suggests that high energy radiation from the central star(s) has not
completely photoevaporated all gas in the inner disk.
Water and OH molecules in gaseous form are also present in many circumstellar disks
(e.g., Carr & Najita, 2008; Salyk et al., 2008; Najita et al., 2010; Carr & Najita, 2011; Pon-
toppidan et al., 2011), especially around CTTSs. Emission features from these molecules
are detected at both mid- and far-infrared wavelengths, with mid-infrared features probing
the inner few AU of the disk, and far-infrared features probing the outer disk. These regions
of the disk are often optically thick, so the emission features are only tracing the molecules
near the disk surface. The amount of H2O and OH in emission from a circumstellar disk
appears to be directly correlated with the amount of UV radiation impinging on the disk
(Bethell & Bergin, 2009), as H2O can be photodissociated by UV photons. Tracing the
amount and location of H2O and OH in a circumstellar disk is also useful for determining
the location of the H2O snow line (Meijerink et al., 2009), the radius at which water freezes
onto dust grains in disks. Determining the true water content of a circumstellar disk re-
quires very high signal to noise spectra in the infrared, as water and OH both exhibit bands
of weak emission features throughout the infrared that can be easily blended with other
emission features, continuum dust features, or noise for poor quality spectra.
Carbon chemistry can be probed in circumstellar disks by observing emission from
molecules such as C2H, HCN and CN. These molecules tend to be common in circumstel-
lar disks (Carr & Najita, 2011; Pontoppidan et al., 2011), and help gauge the strength of
disk gas heating and photodissociation processes (e.g., Bergin et al., 2003; Pascucci et al.,

13
2009; Henning et al., 2010; Pascucci et al., 2013). Emission from atomic oxygen and car-
bon are also tracers of photodissociation, as these features tend to be present when X-ray
and UV radiation is strong enough to photodissociate CO and other carbon and oxygen
bearing molecules. Emission from [O I] and [C I] at far-infrared wavelengths has been de-
tected around young stars (e.g., Thi et al., 2010; Riviere-Marichalar et al., 2012a,b; Fedele
et al., 2013; Keane et al., 2014), but [C I] emission is apparently less common, especially
for older, more evolved disks (see Chapters 2 and 3). Free carbon molecules in the disk
may readily bind to other atoms/molecules, perhaps explaining why [C I] emission is less
common in disks.
Emission from [Ne II] at 12.8 µm in the mid-infrared has also been shown to be a strong
indicator of photoevaporative winds (Lahuis et al., 2007; Pascucci et al., 2007; Gudel et al.,
2010; Sacco et al., 2012). Emission from [Ne II], combined the with presence or lack of
carbon compounds that are easily photodissociated by X-ray/UV photons, can reveal much
about the structure of the inner few AU of the disk and the disk’s overall evolutionary state.
Much of the dust in circumstellar disks is comprised of silicate grains (Bouwman et al.,
2008; Sargent et al., 2009b,a, and references therein) which have broad spectral features
at mid-infrared wavelengths. Magnesium and iron-rich molecules such as pyroxene and
olivine show prominent features at 10 and 18 µm, while crystalline silicates like forsterite
and enstatite have multiple features throughout the 10-30 µm range. Modeling the con-
tinuum of mid-infrared spectra reveals the composition, size and temperature of the emit-
ting/absorbing dust grains (e.g. Sargent et al., 2006, 2009a), and the presence of crystalline
dust suggests dust settling and disk evolution (e.g. Watson et al., 2009).
1.3 Planets and Circumstellar Disks
All of the major planets in our solar system sit in the ecliptic plane, suggesting that they
originated from a circumstellar disk around our young sun. Observations of exoplanetary
system with the Kepler Space Telescope (Borucki et al., 2010) show a wide array of plane-
tary sizes and orbital radii, but most also sit in their ecliptic plane, suggesting that planets in
general form from the circumstellar matter around young stars. By studying nearby young

14
stars orbited by protoplanetary disks, we can directly observe the planet forming regions
of these disks to learn more about how planets form, and how planet formation affects disk
structure and evolution. Here, we briefly discuss the processes by which planets form inside
circumstellar disks, and the observational affects planet formation has on a circumstellar
disk.
1.3.1 Planet Formation in Circumstellar Disks
Observations of nearby protoplanetary disks at infrared to radio wavelengths reveal that
these disks contain large amounts of micron to cm-sized dust grains (see Section 1.2). Co-
agulation and growth of these dust particles into larger, meter-sized bodies (planetesimals)
is the first step in the planet formation process, but there are many challenges that these
dust particles must overcome to actually grow into a body the size of a planet. The process
of going from dust grain to planetesimal and then planetesimal to planet is covered in great
detail in Youdin & Kenyon (2013), and summarized below.
When dust grains encounter each other in the disk, electrostatic forces cause them to
stick together and grow larger. Dust grains that are roughly cm-sized or smaller experience
a drag or headwind as they orbit in the disk, resulting in a loss of angular momentum. This
loss of angular momentum causes these small dust grains located in the inner few AU of
the disk to spiral inward and accrete onto the star on short, ∼100 year time scales. During
this inspiral, dust particles may continue to collide and stick together, but models have
shown that collisions between ∼ meter-sized dust often results in bouncing or breaking
rather that sticking together (Blum & Wurm, 2000; Zsom et al., 2010; Weidling et al.,
2012). The rapid inspiral of small dust grains and inefficiency of growing small dust grains
into large bodies is often referred to as the “meter-sized barrier”. Possible solutions to the
meter-sized barrier include building planets from the bottom up via self-gravitating ultra
sticky ice grains that collide and stick efficiently at low speeds (Supulver et al., 1997), or
building planetesimals quickly from the top down via gravitational instabilities that cause
the gravitational collapse of a large amount of dust into a meter-sized body (Safronov &
Zvjagina, 1969; Goldreich & Ward, 1973). Problems arise for both of these theories when

15
turbulent motions in the disk are considered. Turbulence in the disk causes particles to
collide at higher speeds, likely causing them to break apart rather than stick together, and
models are still unclear as to whether turbulence helps or hinders gravitational collapse of
dust particles (see Youdin & Kenyon, 2013, for a more detailed look at these solutions).
Astronomers have turned towards our own solar system, hoping that studying the size
distribution of asteroids and Kuiper belt objects would aid in our understanding of the
meter-sized barrier, but this also led to inconclusive results. There is an observed break
is the size distribution of both asteroids and Kuiper belt objects at ∼50 km (Bernstein
et al., 2004; Morbidelli et al., 2009), suggesting that gravitational instabilities caused the
formation of these large bodies, and collisions between these bodies produced the smaller
objects (if self-gravity were the answer, we would have expected a more uniform distribu-
tion in the size of these objects). Recent modeling of growth via gravitational instabilities
supports these results (e.g. Johansen & Youdin, 2007), but others (e.g. Weidenschilling,
2010) point out that collisional growth is also a plausible mechanism for the formation of
the large asteroids. Even these plausible solutions are battling the fact that all of this growth
needs to happen in a short (∼100 years) time span, before the dust particles in the inner
tens of AU fall onto the star. Both theories are still actively being debated, and studies of
the thousands of known exoplanetary systems, along with studies of protoplanetary disk
that are actively forming planets, will lead to a more conclusive answer.
Assuming that planetesimals grow to reach a few kilometers in size (regardless of the
mechanism), the gravitational attraction and collisions with other particles dominate the
mechanism of growth from planetesimal to protoplanet (diameter ∼1000 km). Planetes-
imals do not posses enough velocity or energy to overcome the gravitational potential of
a protoplanet, so any collision that occurs just adds to the mass of the protoplanet. As
protoplanets grow larger, they enter a runaway growth period where they accrete all solid
material in their vicinity (Greenzweig & Lissauer, 1990). These large protoplanets do
not experience the large drag forces that planetesimals do, and therefore can spend mil-
lions of years accreting material and growing in size. If and when the protoplanet grows
large enough that the core’s gravitational binding energy exceeds the thermal energy of the

16
surrounding disk gas, it will begin to accrete gas and form an atmosphere. If the atmo-
sphere grows large enough that it roughly exceeds the core mass of the protoplanet, then
the atmosphere will collapse onto the protoplanet, leading to rapid accretion of any other
surrounding gas and the formation of a gas giant planet. At this point, the newly formed
gas giant planet begins to accrete material as is orbits the star, and this accretion, combined
with gravitational torques on the disk, begins to clear a wide disk gap. This opening of a
gap slows the accretion rate onto the planet and is perhaps the best way to explain why gas
giant planets are roughly the size of Jupiter and not the size of brown dwarfs (i.e. M&15
MJ ; D’Angelo & Lubow (2008)). Interactions between the planet and the disk and the
creation of these disk gaps is the topic of the next section.
1.3.2 Modeling of Planet-disk interactions
A great deal of modeling has been conducted to show how planetesimals grow to be meter-
sized (e.g. Dullemond & Dominik, 2005; Brauer et al., 2008; Birnstiel et al., 2011) and
how a circumstellar disk filled with protoplanets can evolve into a planetary system (e.g.
Liu et al., 2011; Bromley & Kenyon, 2011, 2015). As protoplanets begin to accrete material
and grow in size, they have dynamical affects on the surrounding protoplanetary disk that
are potentially visible at infrared to radio wavelengths. Protoplanets in the inner tens of AU
in a protoplanetary disk quickly accrete or scatter large dust grains (D’Angelo & Lubow,
2008), leaving behind a visible hole at submm wavelengths. Espaillat et al. (2014, and
references therein) compile a gallery of images of pre-transitional disks images at 880
µm that show an inner depletion of large dust grains, likely due to to gas giant planet
formation. Ring and spiral arm structures in the disk, like those seen with ALMA around
HL Tau (Figure 1.4; ALMA Partnership et al., 2015) or those seen in VLT imaging of SAO
206462 (Garufi et al., 2013), for example, are likely also due to gas giants clearing rings
and disrupting the disk as they orbit.
Inner disk clearings can be caused by single or multi-planet systems. For example,
Dodson-Robinson & Salyk (2011) show that a single gas giant planet does not have enough
tidal force to scatter dust particles and create the large (tens of AU) gaps seen in many

17
protoplanetary disks. Using hydrodynamical simulations, they find that tidal interactions
between multiple planets are required to open gaps in disks of &15 AU. This scenario
results in the inner disk being cleared of almost all gas and dust. On the other hand, Pinilla
et al. (2012) show that if dust coagulation and fragmentation are included in the modeling,
then a single planet can open up a large gap in the disk. The interactions between the
protoplanet and the disk also creates a single large pressure bump outside the planet’s orbit
where mm-sized dust can become trapped in a ring, preventing it from migrating inward.
Smaller (µm-sized) dust grains are not as strongly affected by the pressure bump and can
exist interior and exterior to the pressure bump/inner gap. This model is supported by
recent infrared observations (see Chapter 4) which reveal that these submm gaps are filled
with gas and µm-sized dust.
Three-dimensional radiative transfer codes have shown (e.g. Zhu et al., 2012; Dong
et al., 2014) that gas giant planets can carve both inner gaps and rings in the disk, observable
at infrared and submm wavelengths. Dong et al. (2014) model the HL Tau disk (ALMA
Partnership et al., 2015) and show that three planets with masses M=0.2 MJ located at at
12, 30 and 65 AU could cause the apparent ring structures seen in the disk (Figure 1.4).
Disk-planet interactions may also produce spiral density waves that propagate through-
out the disk and generate both a gap and spiral arm structure in the disk (e.g. Tanaka et al.,
2002; Crida et al., 2006). This, combined with planet induced disk clearing mechanisms
above may be the explanation for the spiral structure seen in the disk around SAO 206462
(Garufi et al., 2013), and others.
Other scenarios for inner disk clearings and gaps that do not directly involve planets are
photoevaporation (Alexander & Armitage, 2007), grain growth (Dullemond & Dominik,
2005), and magneto-rotational instabilities (Chiang & Murray-Clay, 2007). However, these
scenarios predict very specific stellar accretion rates and disk dust distributions that cur-
rently do not match observations, unless planet formation is also included. Many transition
disks exhibit inner and outer disks with a large gap in between (Kim et al., 2009, 2013)
which is unexpected if the gap was purely due to disk photoevaporation or grain growth.
Thus, there is reason to suspect that many if not most protoplanetary disk systems that show

18
Figure 1.4 Top: ALMA 870 µm continuum image of HL Tau, reproduced from ALMA Partnershipet al. (2015). Bottom: Raw and gaussian-convolved model images of the HL Tau disk at H-band(1.6 µm; left) and 870 µm (right), assuming three planets with M=0.2 MJ are located at 12, 30and 65 AU. The top row shows the apparent image assuming the disk is face on, while the bottomassumes and inclination of 45 . Figure reproduced from Dong et al. (2014).

19
gaps, rings or spiral structures are the result of active planet formation.
In summary, planet formation and planet-disk interactions are the leading theories to
explain the disk gaps seen at submm wavelengths, and the ring and spiral structures seen
at both infrared and submm wavelengths. Planets seem to govern the final stages of cir-
cumstellar disk evolution, and further imaging and modeling will help constrain the various
processes involved.
1.4 Targets
1.4.1 Case Study: V4046 Sgr
V4046 Sagittarius AB (V4046 Sgr) is an isolated, nearly equal mass, spectroscopic young
binary of spectral types K5Ve and K7Ve (Stempels & Gahm, 2004) and total mass 1.75 M
(Rosenfeld et al., 2012a). The stars are separated by 0.04 AU and have a period of ∼2.4
days (Stempels & Gahm, 2004). This system is surrounded by a large circumbinary disk of
gas and dust inclined at ∼33 from face on, which has been the focus of many submm and
mm studies (e.g., Kastner et al., 2008; Rodriguez et al., 2010; Oberg et al., 2011; Rosenfeld
et al., 2012a). The shape of the system’s infrared SED and its mid-infrared excess indicates
that V4046 Sgr is in the transitional disk stage, and has a large inner gap surrounding the
binary (Jensen & Mathieu, 1997). A depletion of mm-sized grains out to a radius of ∼29
AU was inferred from SMA observations (Rosenfeld et al., 2013) and is possibly due to
giant planet formation.
The age of the beta Pic MG – the nearby, young group of stars to which V4046 Sgr
evidently belongs – has been vigorously debated in recent years. Torres et al. (2006) used
their cluster convergence point method and the space motions (UVW velocities) of V4046
Sgr to determine that it likely belongs to the β Pic moving group. Isochrone fitting and
lithium abundances of β Pic members suggest the group, and thus V4046 Sgr, is ∼12 Myr
old (Zuckerman et al., 2001; Torres et al., 2006). Isochrone fitting of the individual stars
in the V4046 Sgr binary suggest that the system is ∼15 Myr old, in agreement with the
isochrone fitting age estimate of the moving group as a whole (Donati et al., 2011). Binks
& Jeffries (2014) use the strength of the Li I 6708 A absorption feature in low-mass β Pic

20
moving group members to determine the age-dependent lithium depletion boundary of the
group. This model independent age estimate places the β Pic moving group and V4046
Sgr at an age of 21 ± 4 Myr. Mamajek & Bell (2014) use revised Hipparcos astrometry
data and the most recent radial velocities published for β Pic members to reassess the age
of the group using the same cluster convergence point method as Torres et al. (2006). They
also use BV photometry from A-, F- and G-type group members to create color magnitude
diagrams and fit a variety of theoretical model isochrones to determine the group age.
This combined method produces an age of 22 ± 3 Myr. We adopt this most recent age
determination of 22 ± 3 Myr in this dissertation.
A moving cluster analysis places V4046 Sgr at ∼73 pc from Earth (Torres et al., 2008).
Basic models of stellar evolution, as described above, suggest that young stars should dis-
sipate their disks in 2-3 Myr, so the fact that V4046 Sgr is ∼22 Myr old and still accreting
from its apparently natal protoplanetary disk — combined with its proximity — makes it a
very interesting source to study. Kastner et al. (2011) discovered a widely separated com-
panion to V4046 Sgr at a distance of∼12,350 AU, and speculated that this companion may
have interacted with the central binary and/or protoplanetary disk and that such interactions
may explain why the disk is still present. A massive planet or substellar companion in the
inner disk may also be affecting the system (Donati et al., 2011). The work presented here
and in future publications will help us understand the mechanics of the disk and its peculiar
longevity.
1.4.2 Accretion and Magnetic Processes in V4046 Sgr
Stempels & Gahm (2004) determined that the V4046 Sgr binary is still accreting mass
from its protoplanetary disk by observing hydrogen emission line broadening with the VLT-
UVES spectrographs. Further evidence that accretion is still occurring comes from its X-
ray spectrum, which reveals evidence for accretion shocks. Gunther et al. (2006) observed
He-like Si XIII, O VII and Ne IX triplets in the Chandra X-ray spectrum of V4046 Sgr, and
when modeled together, are consistent with predictions of accretion funnel infall models
combined with a stellar corona.

21
Donati et al. (2011) observed V4046 Sgr with the optical spectropolarimeter on the
Canada-France-Hawaii Telescope (CFHT) and find that both stars in the system host large
scale and complex magnetic fields which are likely driven by dynamo processes. These
large scale magnetic fields around both stars are weak, with respect to other magnetically
active T Tauri stars, and have a non-axisymmetric poloidal component and a significant
toroidal component. These stars show a much more complex structure than other CTTS,
which tend to have only a strong poloidal component. This complex structure implies that
the stars in V4046 Sgr are only partly convective (Donati & Landstreet, 2009)
Using the equivalent widths of Ca II IRT and He I D3 as a proxy for accretion lumi-
nosity, Donati et al. (2011) estimate the average accretion luminosity of each component
star to be ∼10−2.3 L. This luminosity equates to a mass accretion rate of Macc= 10−9.3
M yr−1, which is somewhat low for a CTTS, yet large enough to inhibit photoevaporation
(Alexander et al., 2006). Donati et al. (2011) also find that, based on the distribution maps
of Ca emission, mass accretion is likely distributed over a large portion of the stars and not
confined to a specific region.
Long-duration XMM Newton observations of V4046 Sgr analyzed by Argiroffi et al.
(2012) reveal periodic X-ray emission line flux variations consistent with half of the bi-
nary orbital period (1.2 days). These modulations can be explained if there is high density
plasma located in small concentrated regions on the stellar surfaces due to X-ray emitting
accretion shocks funneled towards the stars via magnetic field lines. This appears inconsis-
tent with the work of Donati et al. (2011) who claim that accretion is occurring uniformly
over the stars. More work remains before we can understand the dynamics of accretion
onto the V4046 Sgr binary, but all of the above observations support the idea that V4046
Sgr, though “old” for a CTTS, is still actively accreting disk material.
1.4.3 Structure and Composition of the Disk Around V4046 Sgr
The structure and composition of the protoplanetary disk around V4046 Sgr has been stud-
ied extensively via (radio) mm-wave molecular line spectroscopy and interferometric imag-
ing (Kastner et al., 2008; Rodriguez et al., 2010; Oberg et al., 2011). These observations

22
are used to determine the chemistry of the gas and dust components of the disk, detect the
existence and extent of the disk, and ultimately ascertain if the conditions within the disk
are conducive for giant planet formation.
Kastner et al. (2008) detected rotational transitions of 12CO, 13CO, HCN, CN, and
HCO+ in the mm spectrum of V4046 Sgr with the 30 m telescope of the Institut de Radio
Astronomie Millimetrique (IRAM). At the time, these detections established V4046 Sgr
as only the fourth known nearby (D < 100 pc) pre-main sequence star with a molecular
disk (the others are TW Hya, 49 Cet, and HD 141569; Zuckerman et al., 1995), and the
only such nearby disk orbiting a binary system. The 12CO and 13CO (J = 2→1 rotational
transition) line profiles are double peaked, which allowed for a measurement of the radial
velocity of the material and thus, assuming the disk is Keplerian, an estimate for the size of
the disk. Line profile fitting of the 12CO line resulted in a projected rotational velocity of
∼1.5 km s−1 for the disk, which corresponds to an outer disk radius of∼ 250 AU, assuming
the total mass of the binary is 1.8 M (Kastner et al., 2008). Using the disk dust tempera-
ture estimated from the submm SED, Kastner et al. (2008) estimated the lower limit of the
dust mass in the disk to be 6×10⁻⁵ M (∼20 M⊕).
Rodriguez et al. (2010) imaged V4046 Sgr with the SMA and confirmed that the CO
detected by Kastner et al. (2008) arises from a rotating circumbinary disk. The SMA maps
show a disk which extends 5′′ in radius or ∼370 AU at a distance of 73 pc, thereby refining
the results of Kastner et al. (2008). The changes in position and morphology of the CO with
radial velocity are as expected for a Keplerian disk viewed at an intermediate inclination
(i∼ 35 Beckwith & Sargent, 1993; Rodriguez et al., 2010).
Rodriguez et al. (2010) also modeled the CO line maps as a Keplerian disk in hydro-
static equilibrium and the best fit model suggests a combined mass for the binary of 1.8 M
and a disk inclination of 33. Rosenfeld et al. (2012a) repeat the modeling of Rodriguez
et al. (2010) while including more recent sub-compact and very extended SMA data of12CO in their analysis, and further refined the Rodriguez et al. (2010) results, finding a
combined mass of 1.75 +0.09−0.06 M and a disk inclination of 33.5+0.7
−1.4. Previous work by
Quast et al. (2000) showed that the inclination of the orbit of the central binary was 35.

23
Thus, the binary and disk are inclined at roughly the same angle, with respect to our line of
sight, suggesting that the binary and disk formed in this configuration (Monin et al., 2007).
Since CO is often used as a tracer for molecular hydrogen gas, the CO line intensities
can be used to estimate the gas mass of the disk. Rodriguez et al. (2010) used 12CO and13CO line intensities to determine a gas mass for the V4046 Sgr disk (assuming 13CO is
optically thin) of ∼100 M⊕. Assuming a dust temperature of 37 K and a dust opacity of
1.15 cm2g−1, the dust mass is estimated to be 40 M⊕, double that estimated by Kastner et al.
(2008); the difference likely due to different assumed opacities. Regardless, the apparent
gas to dust mass ratio is much smaller than the typically assumed ratio of 100 for molecular
clouds and young circumstellar disks. This indicates that either the gas is heavily depleted
in this system that the CO is optically thick and not representative of the total gas mass of
the disk. Since the disk extends to large radii and is thus very cold, much of the CO in
the disk may be in the form of ice mantles on dust grains rather than gas (Rodriguez et al.,
2010).
SMA 12CO and 13CO line and 1.3 mm continuum data (Rodriguez et al., 2010; Rosen-
feld et al., 2012a) were also used by Rosenfeld et al. (2013) to study the distribution of large
(∼mm-sized) and small (∼µm-sized) dust grains in the V4046 Sgr disk. Rosenfeld et al.
(2013) developed a radiative transfer model that reproduces the CO and 1.3 mm continuum
emission, as well as optical to far-infrared photometry. This model suggests that the disk
around V4046 Sgr has three-components: 1) a “gap” at R.29 AU that is depleted of large
dust grains and contains only small amounts of µm-sized particles close to the central stars,
2) a narrow concentration or ring of mm-sized dust centered at a radius of ∼37 AU, and
3) an extended halo of CO gas and small dust particles. The model also suggests a total
gas+dust mass of ∼0.094 M and a gas to dust ratio of ∼20. Although the latter is larger
than the Rodriguez et al. (2010) estimate, it is nevertheless still somewhat smaller than the
gas to dust ratio of 100 calculated for the interstellar medium (Bohlin et al., 1978), and
typically assumed for circumstellar disks. The inner (R.29 AU) region of the disk is best
probed at near- to far-infrared wavelengths, and is the focus of Chapters 2 and 4 of this
dissertation.

24
Oberg et al. (2011) also used SMA observations of V4046 Sgr and 11 other young
stars with disks to study the structure and chemical composition of circumstellar disks.
They detected transitions of CN, HCN, H2CO, N2H+, DCO+, HCO+, and CO towards
V4046 Sgr and most of the other sources in their sample. There is little correlation in the
strength of the 12CO 2-1 line and the dust continuum emission, which is due to the fact
that the dust is optically thin and the CO emission is optically thick. It does not suggest
a lack of correlation between gas and dust mass. These maps also show that the HCO+
emission tends to be concentrated at higher velocities, whereas the CN emission extends to
larger radii. Models from Aikawa et al. (2002) attribute this steep decline of HCO+ to CO
freeze out at low temperatures, which would also help explain the apparent low gas to dust
ratio inferred by Rodriguez et al. (2010). Position velocity maps of the molecules detected
by Oberg et al. (2011) show that the H2CO and N2H+ emission peak at a slightly larger
position offset than other molecules and thus appear more abundant in the outer portions of
the disk (Oberg et al., 2011). These molecules require CO freeze-out to become abundant,
furthering the argument that CO must be locked up on dust grains at large radii. All of these
data suggests that CO is not an optimal tracer for the mass of gas in the protoplanetary disk
around V4046 Sgr, as much of it has frozen onto dust grains at radii >10 AU.
Table 1.1 summarizes the key properties of the V4046 Sgr AB star-disk system as de-
termined by the studies mentioned above and adopted in this thesis. Infrared observations
of V4046 Sgr are crucial for understanding the structure and gas content of the inner disk,
a region that has not been well studied in the literature so far. This dissertation explores
V4046 Sgr at near- to far-infrared wavelengths, which will fill in the gap (pun intended)
and reveal the molecular content and dynamics of the inner regions of this protoplanetary
disk.
1.4.4 Other Nearby Young Stars of Interest
Aside from V4046 Sgr, there are only three other known young, roughly solar mass stars
within∼100 pc that are actively accreting from a gaseous and dusty circumstellar disk: TW
Hya, MP Mus, and T Cha. These systems have been the focus of many multi-wavelength

25
Table 1.1. Properties of V4046 Sgr from the literature adopted in this dissertation
Parameter Value Reference
Distance 73 pc Torres et al. (2008)Age 22 Myr Mamajek & Bell (2014)Binary Separation/Period 0.04 AU/ 2.4 days Stempels & Gahm (2004)Spectral Types K5 & K7 Stempels & Gahm (2004)Total Stellar Mass 1.75 M Rosenfeld et al. (2012a)Binary & Disk Inclination 33.5 Argiroffi et al. (2012),Rosenfeld et al. (2012a)Systemic LSR velocity 2.92 km/s Rodriguez et al. (2010)Disk Position Angle 76.4 Rodriguez et al. (2010)Disk Inner Gap Radius 29 AU Rosenfeld et al. (2013)Disk Outer Radius 370 AU Rodriguez et al. (2010)Disk (gas+dust) Mass 0.094 M Rosenfeld et al. (2013)Accretion Rate 10−9.3 M yr−1 Donati et al. (2011)
studies, and have improved our understanding of star and planet formation and circumstel-
lar disk evolution. Here, we briefly summarize the properties of two of these systems: T
Cha and MP Mus. These star+disk systems will be the focus of Chapter 3, and our results
from this chapter will be compared with those for V4046 Sgr.
T Cha
T Chamaeleontis (T Cha) is a pre-main sequence star of spectral type K0IV and mass of ∼
1.5 M (Torres et al., 2006). UVW spatial motions of T Cha suggest that it is a member
of the ε Chamaeleontis (ε Cha) association and proper motion studies place the moving
group at∼110 pc (Torres et al., 2008; Murphy et al., 2013). T Cha has a distant companion
(Kastner et al., 2012) of spectral type M3 at a separation of∼38,000 AU, also a member of
the ε Cha association .
The age of ε Cha, and thus T Cha, is somewhat uncertain. Torres et al. (2006) use
the cluster convergence point method to estimate an age of ∼6-7 Myr for the entire ε Cha
association. Kastner et al. (2012) fit pre-main sequence evolutionary tracks to T Cha (and
its distant companion T Cha B) and find an age of ∼10 Myr. Murphy et al. (2013) plot the
location of all known members of ε Cha on a Hertzprung-Russel diagram and determine

26
the age of the moving group by fitting pre-main sequence isochrones to a majority of the
members. They find an age of ∼3-5 Myr, but also note that solar-type members (such as
T Cha) appear systemically older. Fitting isochrones to T Cha alone suggests an estimated
age of ∼12-22 Myr, slightly older than what Kastner et al. (2012) determined. This mass-
dependent age difference for ε Cha is puzzling, and Murphy et al. (2013) argue that it could
be due to systematic errors in the evolutionary models, or uncertainties in the luminosity
and temperature of the sources. Thus, we quote an age of 3-22 Myr, noting that the the
lower age range (i.e. the age of the moving group) is likely more accurate.
Optical to far-infrared photometry and spectroscopy of T Cha show a large infrared
excess beyond ∼10 µm, suggesting the star is surrounded by a circumstellar disk (Brown
et al., 2007). Modeling of these data, along with interferometric near-infrared images from
the VLTI, suggest that the disk is composed of a warm inner dust ring (R<0.1 AU), a large
inner gap, and an extended gaseous and dusty disk. Modeling of the full SED (Cieza et al.,
2011), which extends from ∼0.3-3200 µm, confirms the presence of this thin inner ring
and gap, and suggests that the dust disk extends out to only ∼40 AU, and either truncates
there, or is very tenuous beyond that point. submm imaging of the disk with the Atacama
Pathfinder Experiment (APEX) 12 m radio telescope (Sacco et al., 2014) suggests that the
CO disk extends out to R∼80 AU.
Olofsson et al. (2013) use interferometric data of T Cha from the VLT to more precisely
determine the structure, inclination, and position angle of the disk around T Cha. Modeling
of these data suggests an inner disk (R .0.11 AU) and outer disk (R &12 AU) with a ∼12
AU gap in between. The best-fit inclination is ∼60 from face-on and position angle is
∼110 (as measured clockwise from north) for both the inner and outer disk. This highly
inclined disk orientation likely explains the variability in optical emission line intensities,
extinction measured towards the source, and optical brightness (∼3 mag at V band). It also
likely explains the large hydrogen column density (NH ∼1022 cm−2) inferred from X-ray
spectroscopy (Gudel, 2010; Sacco et al., 2014).
Huelamo et al. (2015) obtained high resolution images of T Cha in CO (3-2), 13CO (3-
2) and 850 µm continuum with ALMA. The continuum emission traces the approximate

27
radius of the CO disk (R∼80 AU) as measured by Sacco et al. (2014), but the CO (3-2)
data reveal a gas disk that extends out to R∼230 AU. Modeling of these data suggest an
inclination of i =67± 5 and a position angle of PA=113 ± 6 for both the gas and dust
disk, in agreement with measurements by Olofsson et al. (2013).
The high inclination of the system also makes it difficult to infer accretion properties,
as UV excess and spectral features like Hα can be obscured by the dusty inclined disk.
Brown et al. (2007) classify T Cha as a WTTS, but note that the Hα feature is highly
variable and places the source right on the border between being classified as an accreting
vs non-accreting system. Using the width of Hα emission features, and noting a lack
of photospheric continuum veiling and UV excess, Schisano et al. (2009) estimate the
mass accretion rate to be Macc = 10−8.4 M yr−1. Overall, the variability in the strength
and shape of Hα and the potential high extinction due to the disk around T Cha make its
classification as a WTTS by Brown et al. (2007) questionable.
Near-infrared adaptive optics imaging with the VLT revealed a possible substellar or
planetary companion located ∼6.7 AU from the central star (Huelamo et al., 2011). This
object may be responsible for the inner disk clearing, but even at 80 MJ it would likely only
be able to clear a gap∼3.5 AU wide (Zhu et al., 2012) and thus could not account for the en-
tire 12 AU gap. The apparent gap could also be due, in whole or part, to disk self-shadowing
or anisotropic scattering in the disk. Emission from [Ne II] at mid-infrared wavelengths in-
dicates that a photoevaporative wind is escaping the disk (Pascucci & Sterzik, 2009; Sacco
et al., 2012) and could be actively contributing to the erosion of the disk.
Cheetham et al. (2015) repeated the VLT observations of T Cha over three years from
2011-2013 in an attempt to re-image the substellar companion and search for relative mo-
tion between the companion and the disk. The resulting images agree with models that
suggest a substellar companion as well as a model of an inclined disk, but no relative mo-
tion of the companion was observed. Therefore, the putative companion is likely forward
scattering from a highly inclined disk and not an actual substellar or planetary mass object.
Table 1.2 lists the most recently determined properties of T Cha that are adopted in this
dissertation.

28
Table 1.2. Properties of T Cha from the literature adopted in this dissertation
Parameter Value Reference
Distance 110 pc Torres et al. (2008); Murphy et al. (2013)Age 3-22 Myr Murphy et al. (2013)Spectral Type K0 Torres et al. (2006)Disk Inclination 67 Huelamo et al. (2015)Disk Position Angle -113 Huelamo et al. (2015)Disk Inner Gap Radius 12 AU Olofsson et al. (2013)Disk Outer Radius 230 AU Huelamo et al. (2015)Accretion Rate 10−8.4 M yr−1 Schisano et al. (2009)
MP Mus
MP Muscae (MP Mus; also referred to as PDS 66 or Hen 3-892 in the literature) is
a CTTS of spectral type K1 Ve (Torres et al., 2006). UVW spatial motions and proper
motions originally placed MP Mus as a member of Lower Centaurus Crux (LCC), a sub-
group of the Scorpius-Centaurus (Sco-Cen) OB association (Gregorio-Hetem et al., 1992;
Mamajek et al., 2002). A recent reanalysis of the proper motion and radial velocity of MP
Mus places it in ε Cha along with T Cha (Torres et al., 2008; Murphy et al., 2013), which is
spatially located just south of the LCC and Sco-Cen, though it is difficult to draw a distinct
line between these two associations. Parallax measurements from Hipparcos place MP
Mus at a distance of ∼86 pc (Mamajek et al., 2002), but its membership in ε Cha places
its distance at ∼110 pc (Murphy et al., 2013). Despite its proximity to Earth, MP Mus is
not as well studied as V4046 Sgr and T Cha, and, considering how much we’ve learned by
studying these similar systems, it is deserving of further, close scrutiny.
Analysis of Spitzer mid-infrared photometry reveals that MP Mus has a large infrared
excess (Silverstone et al., 2006; Hillenbrand et al., 2008), likely from a gaseous and dusty
circumstellar disk. HST/NICMOS near-infrared imaging of MP Mus (Cortes et al., 2009)
revealed that the disk in inclined at∼32.5±5. Recent imaging of MP Mus with HST/STIS
by Schneider et al. (2014) further revealed that the gas disk extends out to R&200 AU
(assuming a distance of 110 pc) and they further constrain the inclination to ∼27.3 ±3.3
29
and position angle to P.A. ∼10. Isochrone fitting and its membership in the LCC/ε Cha
group suggests the age of MP Mus is anywhere between∼3-17 Myr (Mamajek et al., 2002;
Preibisch & Mamajek, 2008; Murphy et al., 2013). Despite its potentially advanced age, the
infrared SED shows no clear signatures of an inner disk clearing (Preibisch & Mamajek,
2008; Cortes et al., 2009), which is atypical for a CTTS at this age. VLT near-infrared
imaging of the disk constrains any inner gap in the disk to a radius of R.15 AU (Grafe &
Wolf, 2013). Thus, the true age of MP Mus is likely closer to 3 Myr.
Modeling of the Hα line profile suggests that MP Mus is actively accreting material
from the disk, at a rate of Macc= 10−8.3 M yr−1 (Pascucci et al., 2007). Curran et al. (2011)
also measure the equivalent width of hydrogen emission features in the optical spectrum
that trace mass accretion, and find an average mass accretion rate of Macc= 10−9.01 M yr−1.
MP Mus also shows photometric variability of∼0.1 mag at V-band and a rotation period of
∼5.75 days (Batalha et al., 1998). The photometric variability is thought to be due to hot
spots formed by accretion onto the stellar surface that co-rotate with the star, which further
supports the idea that MP Mus is actively accreting material from the disk. Schneider et al.
(2014) find that the surface brightness of certain regions of the disk varied over month-
long timescales, suggesting time variable stellar illumination due to shadowing/beaming of
starlight by the disk, puffing of the inner disk, or accretion hotspots. Overall, MP Mus is
most likely surrounded by, and actively accreting from, its primordial gas disk, even though
its age suggests it should be in a much more evolved state.
Kastner et al. (2010) used the Atacama Pathfinder Experiment 12 m telescope to detect12CO (3-2) emission from the disk around MP Mus. The profile of the detected emission
suggests a disk radius of ∼120 AU and molecular gas mass of ∼3 M⊕. No other studies of
the molecular disk of MP Mus have been published to date. Table 1.3 lists the properties
of MP Mus that are adopted in this dissertation.
1.5 Infrared Telescopes and Detectors
Here, we briefly summarize the infrared telescopes and detectors that are used to study
V4046 Sgr, T Cha and MP Mus is this dissertation.
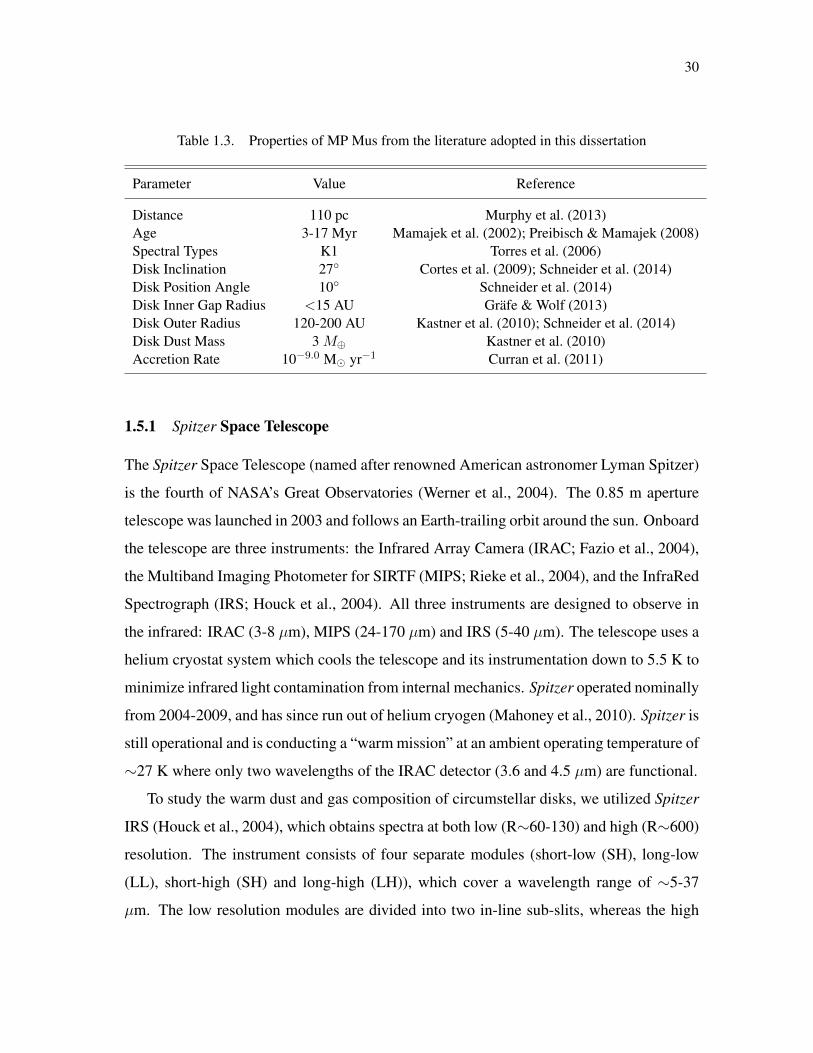
30
Table 1.3. Properties of MP Mus from the literature adopted in this dissertation
Parameter Value Reference
Distance 110 pc Murphy et al. (2013)Age 3-17 Myr Mamajek et al. (2002); Preibisch & Mamajek (2008)Spectral Types K1 Torres et al. (2006)Disk Inclination 27 Cortes et al. (2009); Schneider et al. (2014)Disk Position Angle 10 Schneider et al. (2014)Disk Inner Gap Radius <15 AU Grafe & Wolf (2013)Disk Outer Radius 120-200 AU Kastner et al. (2010); Schneider et al. (2014)Disk Dust Mass 3 M⊕ Kastner et al. (2010)Accretion Rate 10−9.0 M yr−1 Curran et al. (2011)
1.5.1 Spitzer Space Telescope
The Spitzer Space Telescope (named after renowned American astronomer Lyman Spitzer)
is the fourth of NASA’s Great Observatories (Werner et al., 2004). The 0.85 m aperture
telescope was launched in 2003 and follows an Earth-trailing orbit around the sun. Onboard
the telescope are three instruments: the Infrared Array Camera (IRAC; Fazio et al., 2004),
the Multiband Imaging Photometer for SIRTF (MIPS; Rieke et al., 2004), and the InfraRed
Spectrograph (IRS; Houck et al., 2004). All three instruments are designed to observe in
the infrared: IRAC (3-8 µm), MIPS (24-170 µm) and IRS (5-40 µm). The telescope uses a
helium cryostat system which cools the telescope and its instrumentation down to 5.5 K to
minimize infrared light contamination from internal mechanics. Spitzer operated nominally
from 2004-2009, and has since run out of helium cryogen (Mahoney et al., 2010). Spitzer is
still operational and is conducting a “warm mission” at an ambient operating temperature of
∼27 K where only two wavelengths of the IRAC detector (3.6 and 4.5 µm) are functional.
To study the warm dust and gas composition of circumstellar disks, we utilized Spitzer
IRS (Houck et al., 2004), which obtains spectra at both low (R∼60-130) and high (R∼600)
resolution. The instrument consists of four separate modules (short-low (SH), long-low
(LL), short-high (SH) and long-high (LH)), which cover a wavelength range of ∼5-37
µm. The low resolution modules are divided into two in-line sub-slits, whereas the high

31
resolution modules use a cross dispersed echelle design that allow broad spectral coverage
in a single exposure. Figure 1.5 summarizes the different modules, their wavelength ranges,
resolving power and slit dimensions.
Figure 1.5 Information about the Spitzer IRS modules from the IRS handbook:irsa.ipac.caltech.edu/data/SPITZER/docs/irs/irsinstrumenthandbook/
1.5.2 Herschel Space Observatory
The Herschel Space Observatory (named after German astronomer William Herschel) was
a European Space Agency telescope launched in 2009 (Pilbratt et al., 2010). The observa-
tory consists of a 3.5 m aperture Cassegrain telescope that is passively cooled to a temper-
ature of ∼85 K. The telescope contains three cryogenically cooled instruments designed
to observe at mid- to far-infrared wavelengths: the Photodetector Array Camera and Spec-
trometer (PACS; Poglitsch et al., 2010), the Spectral and Photometric Imaging REceiver
(SPIRE; Griffin et al., 2010), and the Heterodyne Instrument for the Far Infrared (HIFI; de
Graauw et al., 2010). Herschel operated nominally at the L2 Lagrange point from 2010-
2013 until all the cryogen was depleted.
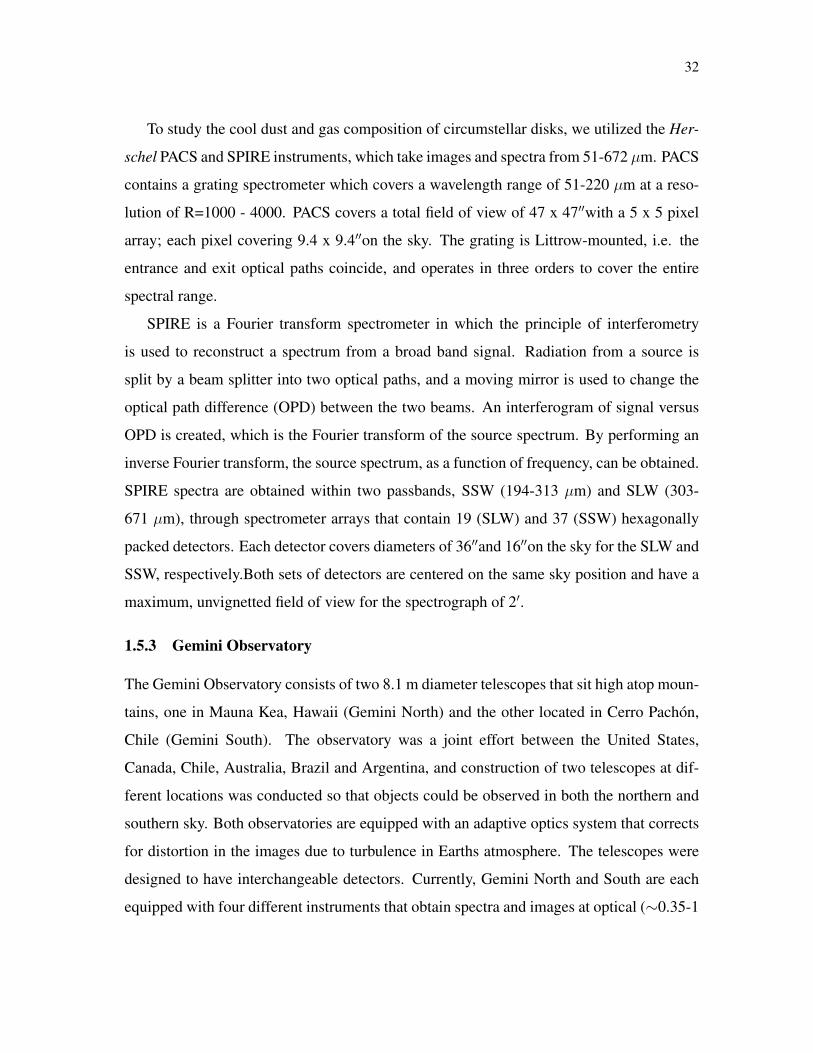
32
To study the cool dust and gas composition of circumstellar disks, we utilized the Her-
schel PACS and SPIRE instruments, which take images and spectra from 51-672 µm. PACS
contains a grating spectrometer which covers a wavelength range of 51-220 µm at a reso-
lution of R=1000 - 4000. PACS covers a total field of view of 47 x 47′′with a 5 x 5 pixel
array; each pixel covering 9.4 x 9.4′′on the sky. The grating is Littrow-mounted, i.e. the
entrance and exit optical paths coincide, and operates in three orders to cover the entire
spectral range.
SPIRE is a Fourier transform spectrometer in which the principle of interferometry
is used to reconstruct a spectrum from a broad band signal. Radiation from a source is
split by a beam splitter into two optical paths, and a moving mirror is used to change the
optical path difference (OPD) between the two beams. An interferogram of signal versus
OPD is created, which is the Fourier transform of the source spectrum. By performing an
inverse Fourier transform, the source spectrum, as a function of frequency, can be obtained.
SPIRE spectra are obtained within two passbands, SSW (194-313 µm) and SLW (303-
671 µm), through spectrometer arrays that contain 19 (SLW) and 37 (SSW) hexagonally
packed detectors. Each detector covers diameters of 36′′and 16′′on the sky for the SLW and
SSW, respectively.Both sets of detectors are centered on the same sky position and have a
maximum, unvignetted field of view for the spectrograph of 2′.
1.5.3 Gemini Observatory
The Gemini Observatory consists of two 8.1 m diameter telescopes that sit high atop moun-
tains, one in Mauna Kea, Hawaii (Gemini North) and the other located in Cerro Pachon,
Chile (Gemini South). The observatory was a joint effort between the United States,
Canada, Chile, Australia, Brazil and Argentina, and construction of two telescopes at dif-
ferent locations was conducted so that objects could be observed in both the northern and
southern sky. Both observatories are equipped with an adaptive optics system that corrects
for distortion in the images due to turbulence in Earths atmosphere. The telescopes were
designed to have interchangeable detectors. Currently, Gemini North and South are each
equipped with four different instruments that obtain spectra and images at optical (∼0.35-1

33
µm) and near-infrared (∼1-5 µm) wavelengths.
While many of these instruments could be used to observe circumstellar disks, we
chose to utilize the brand new Gemini Planet Imager (GPI). GPI is a near-infrared cam-
era mounted on the 8 meter Gemini South telescope that is dedicated to directly observing
and spectroscopically characterizing extrasolar planets and young circumstellar disks. GPI
combines high order adaptive optics (Poyneer & Dillon, 2008; Poyneer et al., 2014), a
diffraction suppressing coronagraph (Soummer et al., 2011), and an integral field spectro-
graph (Chilcote et al., 2012; Larkin et al., 2014) to obtain near-diffraction-limited images
of these objects in unprecedentedly short (∼few minutes) exposure times. GPI can obtain
images at Y (1.05µm), J (1.25µm), H (1.65µm), K1 (2.05µm) and K2 (2.25µm) in either
spectroscopic or polarimetric mode, with or without a coronagraph. The total field of view
is 2.7×2.7”, with a diffraction-limited resolution of . 0.05”.
Figure 1.6 Schematic of the optical path of the Gemini Planet Imager in imaging polarimetry mode.Figure reproduced from Perrin et al. (2015).
The GPI imaging polarimetry mode was used for the observations discussed in this dis-
sertation, and the optical path of this mode is shown in Figure 1.6 (Perrin et al., 2015).

34
To summarize, light from the source first passes through the GPI adaptive optics systems,
which measures the wavefront and corrects for it using two deformable mirrors. Next, the
light passes through the calibration unit (CAL) which is integrated with the coronagraph
module and designed to reduce wavefront errors and keep accurate pointing. CAL has an
interferometric high-order wavefront sensor which is responsible for measuring the incom-
ing wave front at the image and coronagraphic focal plane and making corrections so that
residual PSF speckles caused by wavefront errors are reduced. There is also a low-order
wavefront sensor that is responsible for keeping the object centered on the coronagraph and
the telescope pointed at an in-focus target.
The diffraction suppressing coronagraph (if in use) is the next step in the image chain.
The light first passes through the coronagraphic apodizer which reduces the light that will
reach the focal plane, smooths the PSF, and reduces any aberrations caused by the telescope
optics. The image is then focused at the focal plane mask, where the central core of the
PSF is removed from the image. The size of the coronagraphic mask at the focal plane is
changed based on the filter selected for the observation because the PSF of the instrument
increases with increasing wavelength. In coronagraphic mode, the light is collimated and
passed through a modulator (i.e. waveplate) that is tilted at 22.5 angles to allow only
starlight of a given polarization to pass through. If polarimetric mode is not being used, the
waveplate is moved out of the optical path. The final step in the coronagraph process is the
Lyot stop, which blocks any off-axis light from continuing through the system.
In a conventional polarimetric system, the modulator would be placed directly after the
adaptive optics module, to reduce the effects of instrumental polarization from optical sur-
faces prior to the modulator. Instead, GPI was designed with the starlight suppression capa-
bilities taking precedence over the polarimetry, and therefore the coronagraph was placed
earliest in the optical path the reduce wavefront error at the coronagraphic focal plane.
Thus, instrumental polarization induced by GPI’s optics must be modeled and subtracted
away during data reduction.
After passing the coronagraph and waveplate, the light is dispersed by a lenslet array
in the integral field spectrometer (IFS). The lenslet array breaks the image into 36,000

35
smaller images which are then passed through a prism and broken into 36,000 individual
spectra, simultaneously. These images are reassembled into a 190x190 pixel cube where
each element contains between 11 and 20 spectral channels based on the wavelength being
imaged. In polarization mode, the light enters a Wollaston prism instead of a spectral prism
which splits the light into two orthogonal linearly polarized outgoing beams. The result
is a single image on a 2048×2048 Teledyne HAWAII-2RG near-infrared sensor (Beletic
et al., 2008; Ingraham et al., 2014; Perrin et al., 2015) with 36,000 polarized spot pairs,
separated by 7 pixels (Figure 1.7). Obtaining these images at four polarization angles
in 22.5 increments allows for the calculation of the I, Q and U Stokes parameters (or,
equivalently, the radial and tangential Stokes parameters Qr and Ur; Schmid et al., 2006)
necessary to measure the degree of polarization and orientation of polarization across the
image. More details about the GPI instrumentation can be found in Perrin et al. (2015),
and references therein, and a detailed description of the data analysis for polarimetric data
is covered in Chapter 4.
Figure 1.7 Left: Schematic of the polarized spot pairs for GPI images taken in polarimetric mode.Center: Raw GPI image taken in coronagraphic/polarization mode with 36,000 spot pairs. Right:Zoom-in of the spot pairs near the center of the raw image. Figure reproduced from Perrin et al.(2015).

36
Chapter 2
A Combined Spitzer and Herschel Infrared Studyof Gas and Dust in the Circumbinary Disk Orbit-ing V4046 Sgr
This Chapter, in its entirety, has been submitted to the Astrophysical Journal and is cur-
rently under referee review.

Abstract
We present results from a spectroscopic Spitzer and Herschel mid-to-far-infrared study of
the circumbinary disk orbiting the evolved (age ∼12-23 Myr) close binary T Tauri system
V4046 Sgr. Spitzer IRS spectra show emission lines of [Ne II], H2 S(1), CO2 and HCN,
while Herschel PACS and SPIRE spectra reveal emission from [O I], OH, and tentative
detections of H2O and high-J transitions of CO. We measure [Ne III]/[Ne II] . 0.13, which
is comparable to other X-ray/EUV luminous T Tauri stars that lack jets. We use the H2
S(1) line luminosity to estimate the gas mass in the relatively warm surface layers of the
inner disk. The presence of [O I] emission suggests that CO, H2O, and/or OH is being
photodissociated, and the lack of [C I] emission suggests any excess C may be locked up in
HCN, CN and other organic molecules. Modeling of silicate dust grain emission features
in the mid-infrared indicates that the inner disk is composed mainly of large (r∼ 5 µm)
amorphous pyroxene and olivine grains (∼86% by mass) with a relatively large proportion
of crystalline silicates. These results are consistent with other lines of evidence indicating
that planet building is ongoing in regions of the disk within ∼30 AU of the central, close
binary.

38
2.1 Introduction
The relatively rare examples of nearby T Tauri stars (i.e., those within ∼100 pc of Earth)
are excellent candidates for studying planet formation processes. Their proximity allows
us to analyze the contents and structure of circumstellar disks in which young protoplanets
are likely forming. Near to far-infrared spectroscopy allows us to probe the contents of
these protoplanetary disks, as the strongest emission from such disks arises at infrared
and (sub)-mm wavelengths. Mid-IR (5-40 µm) spectroscopy traces both the gas and dust
components of the inner (R<10 AU) planet forming regions of the disk. At medium to
high resolution, we detect emission features due to increasing disk temperature from the
disk midplanes to their exteriors (Calvet et al., 1991; Malbet & Bertout, 1991). In most
cases, such spectral features only probe the disk atmosphere, as the disk becomes optically
thick towards the midplane. Emission features may also arise from optically thin regions of
the disk due to dust sublimation or grain growth and planetesimal formation (Pontoppidan
et al., 2014). Transition disks with an inner gap carved out by giant planet formation
and/or disk photoevaporation may display cavity walls with emission features due to being
directly exposed to stellar UV radiation (e.g. Cleeves et al., 2011). Far-IR (50-700 µm)
spectroscopy traces emission from colder gas and dust in the outer (R&10 AU) disk. At
these longer wavelengths, we expect emission features from gas mass tracers such as CO
and atomic species that trace photodissociation regions at disk surfaces.
Previous Spitzer space telescope and ground based mid-IR spectroscopic studies of pre-
main sequence (pre-MS) star/disk systems have revealed a variety of atomic and molecular
emission features (e.g. Pontoppidan et al., 2010; Salyk, 2011). Molecules such as C2H,
HCN, CN, OH, H2O and C2H2, whose abundances are sensitive to stellar UV and X-ray
radiation, are used to gauge the strength of disk gas photodissociation and radiative heating
processes (e.g. Bergin et al., 2003; Pascucci & Sterzik, 2009; Henning et al., 2010; Pascucci
et al., 2013). H2O has also been observed in the planet forming regions around many young
stars (e.g. Salyk et al., 2011). Metal ions such as [Ne II] have also been detected towards
transitional disks (Pascucci et al., 2007; Lahuis et al., 2007; Gudel et al., 2010; Sacco et al.,
2012) and may trace the influence of high energy radiation on disk photoevaporation rates.

39
Far-IR spectroscopic observations of pre-MS star/disk systems via the Herschel space
observatory help constrain the disk gas and dust mass, as well as the effects of high energy
radiation on outer disk heating and chemistry (e.g. Thi et al., 2010; Howard et al., 2012;
Fedele et al., 2013; Meeus et al., 2013; Riviere-Marichalar et al., 2013). Far-IR emission
from pure rotational CO lines probe temperature regimes between those of the near-IR
vibrational CO lines and the low-J submm/radio CO lines and can reveal information about
this distribution of gas throughout the disk (e.g. Bruderer et al., 2012). The presence of
far-IR [O I], [C I] and [C II] emission lines may indicate that UV or X-ray radiation is
incident on the outer disk and photodissociating CO or OH molecules (Mamon et al., 1988;
Aresu et al., 2012). Modeling these and other diagnostic emission lines in Herschel spectra,
combined with models of Spitzer spectroscopic observations, can constrain total disk mass,
as well as the composition and distribution of gas and dust throughout the disk.
Here, we present a combined spectroscopic Spitzer and Herschel study of the protoplan-
etary disk orbiting the nearby (D ∼73 pc; Torres et al., 2008) pre-MS binary V4046 Sgr.
V4046 Sgr is an isolated, spectroscopic binary that is a member of the β Pic Moving Group,
with an age ∼12-22 Myr old (Torres et al., 2006; Binks & Jeffries, 2014; Mamajek & Bell,
2014). The binary consists of nearly equal mass components with spectral types K5Ve and
K7Ve (Stempels & Gahm, 2004) and total mass 1.75 M (Rosenfeld et al., 2012a). The
stars are separated by 0.04 AU (p∼ 2.4 days; Stempels & Gahm, 2004) and are surrounded
by a large (R∼370 AU) circumbinary disk of gas and dust inclined at ∼33 from face on
(Rodriguez et al., 2010; Rosenfeld et al., 2012a). The central stars are actively accreting
material (Stempels & Gahm, 2004; Donati et al., 2011; Argiroffi et al., 2012) from the disk,
which has an inner gap of radius∼30 AU that is possibly due to ongoing Jovian planet for-
mation (Rosenfeld et al., 2013). The disk is also evidently undergoing photoevaporation
by high energy radiation from the central stars (Sacco et al., 2012), which, in conjunction
with planet formation, may contribute to the inner disk clearing (Alexander et al., 2014,
and references therein)
In this chapter, we present a census of atomic and molecular emission features detected
in the Spitzer and Herschel spectra of V4046 Sgr, and we model the continuum of the
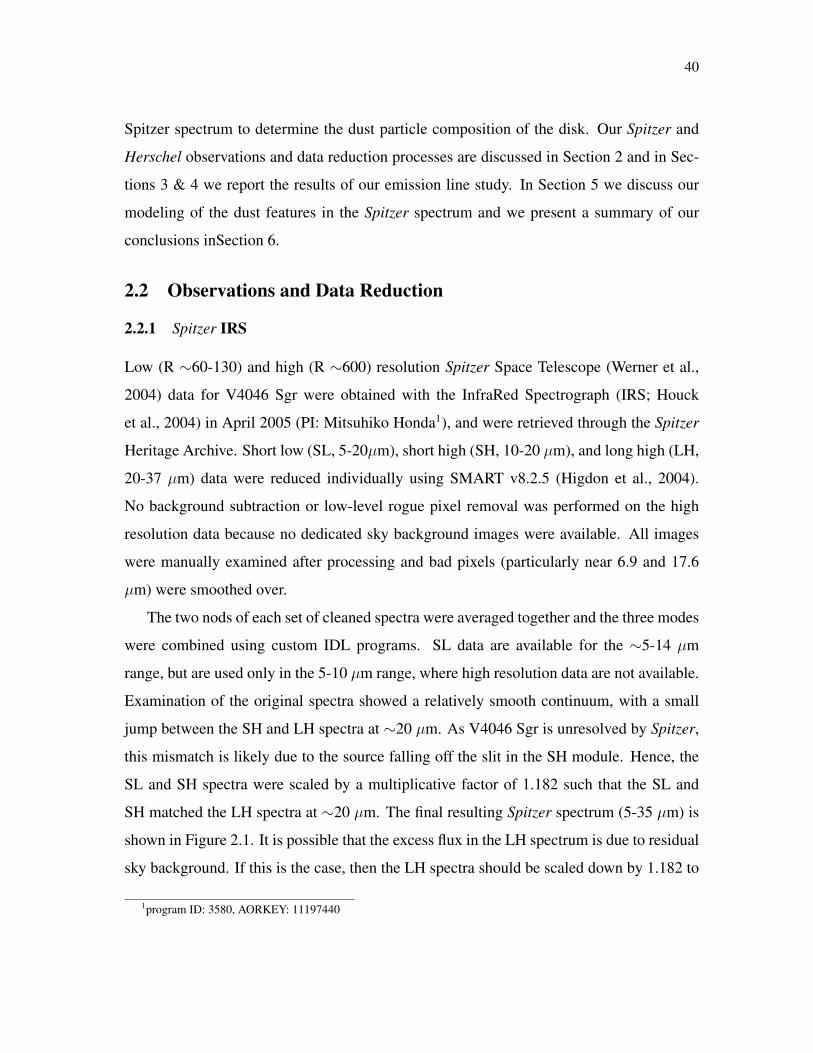
40
Spitzer spectrum to determine the dust particle composition of the disk. Our Spitzer and
Herschel observations and data reduction processes are discussed in Section 2 and in Sec-
tions 3 & 4 we report the results of our emission line study. In Section 5 we discuss our
modeling of the dust features in the Spitzer spectrum and we present a summary of our
conclusions inSection 6.
2.2 Observations and Data Reduction
2.2.1 Spitzer IRS
Low (R ∼60-130) and high (R ∼600) resolution Spitzer Space Telescope (Werner et al.,
2004) data for V4046 Sgr were obtained with the InfraRed Spectrograph (IRS; Houck
et al., 2004) in April 2005 (PI: Mitsuhiko Honda1), and were retrieved through the Spitzer
Heritage Archive. Short low (SL, 5-20µm), short high (SH, 10-20 µm), and long high (LH,
20-37 µm) data were reduced individually using SMART v8.2.5 (Higdon et al., 2004).
No background subtraction or low-level rogue pixel removal was performed on the high
resolution data because no dedicated sky background images were available. All images
were manually examined after processing and bad pixels (particularly near 6.9 and 17.6
µm) were smoothed over.
The two nods of each set of cleaned spectra were averaged together and the three modes
were combined using custom IDL programs. SL data are available for the ∼5-14 µm
range, but are used only in the 5-10 µm range, where high resolution data are not available.
Examination of the original spectra showed a relatively smooth continuum, with a small
jump between the SH and LH spectra at ∼20 µm. As V4046 Sgr is unresolved by Spitzer,
this mismatch is likely due to the source falling off the slit in the SH module. Hence, the
SL and SH spectra were scaled by a multiplicative factor of 1.182 such that the SL and
SH matched the LH spectra at ∼20 µm. The final resulting Spitzer spectrum (5-35 µm) is
shown in Figure 2.1. It is possible that the excess flux in the LH spectrum is due to residual
sky background. If this is the case, then the LH spectra should be scaled down by 1.182 to
1program ID: 3580, AORKEY: 11197440

41
match that of the SH and SL spectra.
2.2.2 Herschel PACS and SPIRE
Herschel Space Observatory (Pilbratt et al., 2010) Photodetector Array Camera and Spec-
trometer (PACS; Poglitsch et al., 2010) range scan spectra and Spectral and Photometric
Imaging Receiver (SPIRE; Griffin et al., 2010) spectra of V4046 Sgr were obtained as part
of the Cycle 1 General Observer Program2 (PI: G. Sacco) in June and July of 2012. SPIRE
data were obtained at medium resolution (R ∼160), and PACS data were obtained in SED
mode (R ∼940-5500). Together, these observations cover the 55-670 µm range. Exami-
nation of the SPIRE level 2 data products showed a discontinuity between the two bands
(190-310 µm and 300-670 µm), suggesting that the background was incorrectly subtracted
by the pipeline3. We therefore reduced both the PACS and SPIRE data from level 0 in
HIPE v10 (Ott, 2010) using interactive background normalization scripts, which allow us
to subtract the background more accurately than is done in the standard pipeline. Data from
calibration trees 48 and 10.1 for PACS and SPIRE, respectively, were used to correct for
instrumentation effects and to flux calibrate the spectra. The center spatial pixel (spaxel)
was extracted from the resulting 5x5 spaxel array and order edges and regions in the spec-
trum where light leakage occurs were removed. The resulting Herschel PACS and SPIRE
data are shown in Figures 2.2 and 2.3.
Herschel PACS line scan spectra were obtained in Cycle 24 (P.I. G. Herczeg) in June
2013 with the goal of searching for mid- to high-J lines of CO, as well as H2O and OH.
These data cover eight different wavelength regions. The PACS line scan data were reduced
from level 0 using background normalization scripts in HIPE v11 with PACS calibration
tree 56. Two output spectra were produced, one that was flux calibrated using the central
3x3 spaxel region and one that was not. Telescope jitter and slight pointing errors can cause
some of the source flux in Herschel observations to extend beyond the central spaxel. This
effect can be corrected by taking the flux ratio of the sum of the central 3x3 spaxels to the
2Observation IDs: 1342231043, 1342242448, 13422424493See section 6.4 in the SPIRE data reduction Guide v2.1.4Observation IDs: 1342269454 and 1342269455

42
Figure 2.1 Spitzer IRS spectrum of V4046 Sgr with emission features labeled. Top: 5.5-19.5 µmspectrum with an inset showing the H2 0-0 S(1) (J=3→1) line at 17.035 µm. Bottom: 19.5-35 µmspectrum with emission features labeled.

43
Figure 2.2 Top: Herschel PACS (black) and SPIRE (blue) spectra of V4046 Sgr. The data have beenrebinned by a factor of 3
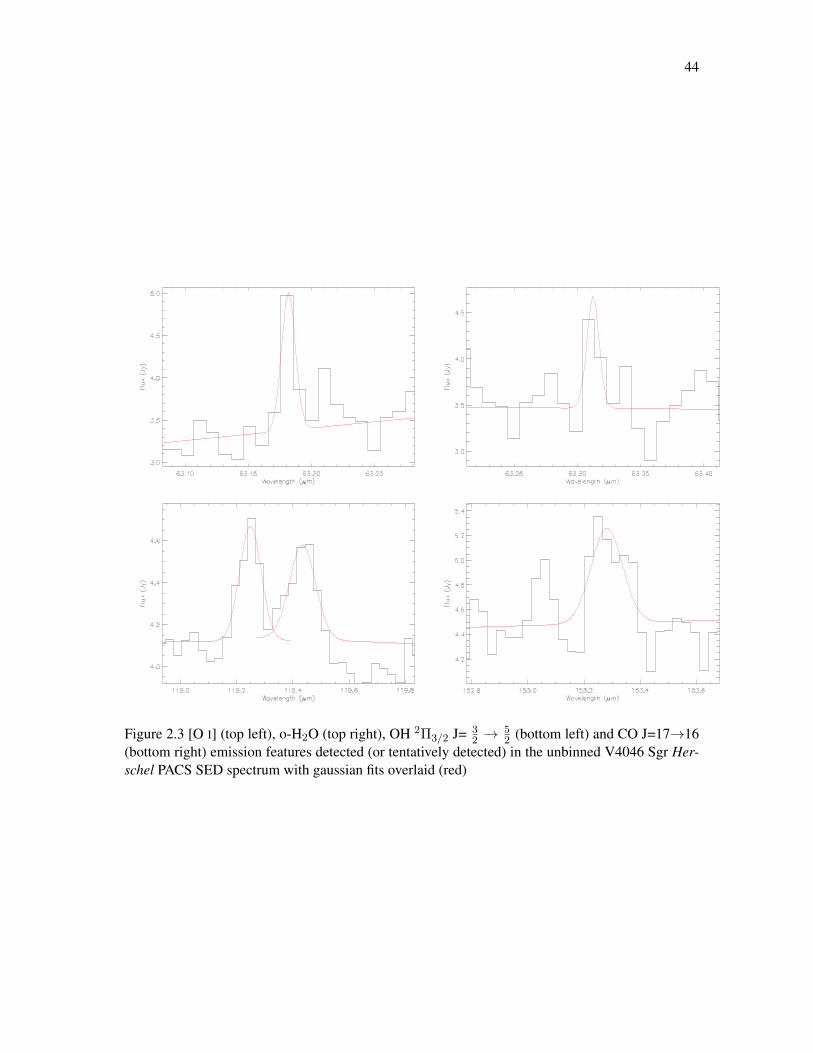
44
Figure 2.3 [O I] (top left), o-H2O (top right), OH 2Π3/2 J= 32 →
52 (bottom left) and CO J=17→16
(bottom right) emission features detected (or tentatively detected) in the unbinned V4046 Sgr Her-schel PACS SED spectrum with gaussian fits overlaid (red)

45
single center spaxel and comparing it with the ratio of a perfectly pointed observation of
a point source, then adjusting the source flux accordingly. A comparison between the 3x3
corrected spectra and the non-corrected spectra shows a ∼10% difference in continuum
flux values. Since this difference is small, and since the PACS SED spectra were not 3x3
corrected, we chose to use the non-3x3 corrected spectra. The continuum flux of the PACS
line scan and SED data for each region also matched to within ∼10%, consistent with the
level of systematic error. The PACS line scan spectra are shown in Figure 2.5.
2.3 Analysis: Gas Emission Features
2.3.1 Emission line identification
Spectral line identification in both the Spitzer and Herschel spectra was performed both
by eye and using custom IDL programs. To identify potential lines in the IRS spectrum,
we first fit the continuum regions of the SH and LH data with a high order polynomial,
then subtracted the data from the fitted continuum. We then identified candidate emission
lines as features that span at least two spectral bins and are at least 2σ above the continuum
(where σ is defined as the standard deviation of the continuum subtracted spectra). To con-
firm which of these detections are likely emission lines and not spurious detections or dust
features, we subtract the continuum dust model (see section 3.1) from the original spec-
tra, and repeat the above line detection process. The NIST atomic spectral database5, the
Splatalogue database for astronomical spectroscopy6, and previous publications pertaining
to mid- to far-infrared emission features from protoplanetary disks were used to determine
the species and transition potentially associated with each candidate emission feature.We
restrict these identifications to spectral features that are at least 2σ above the continuum
and that correspond to molecular or atomic features previously identified in protoplanetary
disks. Table 2.1 lists the candidate lines identified in the Spitzer spectrum and their mea-
sured wavelengths, energies, fluxes, full widths at half maximum, and equivalent widths.
5http : //physics.nist.gov/PhysRefData/ASD/lines form.html6http : //splatalogue.net/

46
Table 2.1. Emission lines in the Spitzer IRS spectrum of V4046 Sgr
Species Wavelengtha Eu Flux FWHM EW(µm) K (10−14 erg s−1 cm−2) (10−2µm) (10−3µm)
H I 7-6 12.37 154854 0.61 ±0.17 0.32 ±0.09 0.65 ±0.18Ne II 12.81 1124 8.67 ±0.13 1.51 ±0.02 10.00 ±0.15HCN 14.03 ... 4.90 ±0.38 8.00 ±0.61 5.90 ±0.45CO2 14.97 ... 4.31 ±0.25 2.77 ±0.16 5.06 ±0.30H2O 16 -15∗ 15.41 3602 1.49 ±0.22 1.80 ±0.27 1.76 ±0.26Ne III∗ 15.55 927 < 1.11 ... ...H2 S(1) 17.03 1015 1.50 ±0.24 2.00 ±0.33 1.62 ±0.27H2O 9 - 8∗ 23.86 1397 1.79 ±0.51 2.74 ±0.79 1.80 ±0.52
∗ Tentative detection.a Observed wavelength.
Emission features in the Herschel PACS and SPIRE spectra were determined in simi-
lar fashion. The Herschel PACS range scan and SPIRE spectra are less sensitive than the
Spitzer and PACS line spectra, and thus only a few candidate emission features are identi-
fied at levels > 3σ. Table 2.2 lists the candidate lines identified in all Herschel spectra and
their measured wavelengths, energies, fluxes, full widths at half maximum, and equivalent
widths.
Spitzer IRS molecular & atomic line inventory
The disk around V4046 Sgr shows evidence for many different atomic and molecular
species (Figure 2.1, 2.4 and Table 2.1). We detect strong emission from [Ne II], as well as
emission lines of H2 S(1), CO2 and HCN in the Spitzer spectrum. Emission lines of these
species are commonly seen in T Tauri star/disk systems (e.g. Salyk et al., 2008; Najita et al.,
2008; Pascucci & Sterzik, 2009; Pontoppidan et al., 2010; Salyk et al., 2011; Pascucci et al.,
2013). The Spitzer spectrum also shows H I 7-6 emission at 12.4 µm, which likely does not
originate within the disk but, rather, arises from the accretion shock regions at the (binary)
central stars and/or from their stellar coronae (Pascucci et al., 2007; Rigliaco et al., 2015).
Emission lines from H2O at 15.2 and 17.2 µm, which are often used as markers to

47
Table 2.2. Emission lines in all Herschel spectra of V4046 Sgr
Species Wavelengtha Eu Flux FWHM EW(µm) K (10−14 erg s−1 cm−2) (10−2µm) (10−3µm)
PACS SED[O I]3P1 →3P2 63.18 228 1.71 ±0.43 1.30 ±0.33 6.72±1.71o-H2O 81,8 - 70,7 63.31 1071 1.09 ±0.27 1.14 ±0.28 4.181 ±1.03OH 2Π3/2 J= 5
2− 3
2119.25 121 1.11 ±0.13 9.05 ±0.91 12.74 ±1.28
OH 2Π3/2 J= 52− 3
2119.43 121 1.10 ±0.12 10.92 ±1.20 12.65 ±1.40
CO J=17-16 153.28 846 1.38±0.25 13.23 ±2.36 24.05±4.29
PACS Line-scanOH 2Π3/2 J= 7
2− 5
2+ CO J=31-30 84.42 ... 1.03 ±0.05 3.30±0.15 6.49 ±0.29
OH 2Π3/2 J= 72− 5
284.60 291 1.69 ±0.05 3.29 ±0.09 11.00 ±0.30
CO J=30-29 87.18 2565 0.72 ±0.06 3.23 ±0.26 5.21 ±0.41CO J=18-17 144.80 945 0.52 ±0.22 8.78 ±0.38 8.02 ±0.34CO J=15-14 173.64 664 0.84 ±0.02 10.98 ±0.28 17.12 ±0.44o-H2O 21,2 - 10,1 + CH+ 179.53 114 0.23 ±0.03 6.72 ±0.99 5.89 ±0.87
SPIREC I 370.30 63 < 0.64 .... ....
aObserved wavelength.
establish that a disk is water-rich (e.g. Pontoppidan et al., 2010), are not evident in the
Spitzer spectrum of V4046 Sgr. The spectrum may display H2O features at 15.4 and 23.9
µm, as well as possible complexes of H2O features near 25 and 31 µm (see Figure 2.1).
The detailed, self-consistent modeling of H2O and OH emission required to confirm these
identifications will be pursued in followup work. V4046 Sgr also shows HCN emission at
14.03 µm, but lacks the C2H2 emission lines typically found in younger T Tauri systems
(Carr & Najita, 2008; Salyk et al., 2011). Pontoppidan et al. (2010) and Salyk et al. (2011)
find that H2O, OH and other molecular gas emission lines originating from warm gas in
the inner disk are weaker in most transitional disk systems, likely because these disks are
beginning to form an inner disk clearing either due to planet formation or disk photoevap-
oration. Therefore, the lack of strong H2O and OH emission lines, and the generally weak
levels of molecular emission in V4046 Sgr, is consistent with the fact that this system is a
transitional disk with an inner clearing (Rosenfeld et al., 2013).

48
Figure 2.4 H2O emission features tentatively detected in the Spitzer IRS spectrum of V4046 Sgrwith Gaussian fits overlaid
Herschel PACS+SPIRE molecular & atomic line inventory
Emission features in the Herschel PACS SED and SPIRE spectra and line IDs are presented
in Figures 2.3 and Table 2.2. The Herschel spectra were obtained with the goal of searching
for emission from [O I] at 63 µm and [C I] at 370 µm arising from UV photodissociation
of CO molecules in the outer disk (Mamon et al., 1988). We report the detection of [O I]
emission (Table 2.2, Figure 2.3), but did not detect [C I]. We also detect emission from an
OH 2Π3/2 doublet at 119.2 and 119.4 µm (Figure 2.3), which likely arises from UV pho-
todissociation of H2O in the outer disk. One high level CO ro-vibrational transition (J=17
→ 16) is tentatively detected and 3σ upper limits for all other ro-vibrational transitions of
CO between 65 µm and 600 µm range from 0.42 – 4.68 10−14 erg s−1 cm−2
The Herschel PACS line scan spectra cover multiple limited spectral regions also spanned
by PACS range spectroscopy, but achieved higher sensitivity and spectral resolution. These
observations reveal several emission features that were below the detection limit of the
PACS SED data (Figure 2.5 and Table 2.2). Specifically, we detect (or tentatively detect)
emission from four high-level CO ro-vibrational transitions (J= 31→ 30, 30→ 29, 18→
17, and 15 →14), as well as OH and CH+. The PACS line scan spectra do not cover the
spectral range in which emission features were detected in the PACS SED spectra, so we
cannot use these data to confirm the existence of the H2O and CO J=17→ 16 features.

49
Figure 2.5 Herschel PACS line scan spectroscopy data with emission features labeled.

50
2.4 Discussion
V4046 Sgr exhibits emission features that allow us to further understand the structure, con-
tent, and chemistry of the circumbinary disk. We can use these emission features to investi-
gate disk photoevaporation and photodissociation processes, and to compare the V4046Sgr
system with other similarly evolved systems such as TW Hya (age ∼8 Myr, D∼ 56 pc;
Ducourant et al., 2013, and references therein), and other T Tauri star-disk systems in
nearby associations. Below, we comment on notable features in the Spitzer and Herschel
spectra of V4046 Sgr and combine the Spitzer and Herschel spectra to obtain a full mid- to
far-IR SED (5-670 µm) so as to compare the SED with a dust disk model from Rosenfeld
et al. (2013).
2.4.1 H2
Although H2 is the most abundant species in circumstellar disks, the electric quadrupole
nature of its rotational transitions result in weak emission that is difficult to detect. How-
ever, pure rotational H2 emission has been detected in the mid-IR around some T Tauri and
Herbig Ae/Be stars (i.e. Lahuis et al., 2007; Bary et al., 2008; Bitner et al., 2008; Carmona
et al., 2008; Najita et al., 2010; Carr & Najita, 2011), and even in a few disks around young
brown dwarfs (Pascucci et al., 2013). This emission may be due to collisional excitation, X-
ray/UV irradiation of the disk surface, and/or accretion shocks onto the disk (Bitner et al.,
2008, and references therein).
We detect emission from pure rotational H2 0-0 S(1) (J=3→1) at 17.035 µm in the
Spitzer spectrum (Table 2.1). Since V4046 Sgr lies far from any molecular clouds (Kastner
et al., 2008), the H2 emission most likely arises from warm gas in the surface layers of the
circumbinary disk. The line flux of H2 is∼1.50×10⁻¹⁴ erg s−1 cm−2 (LH2 =1.04×1028 erg
s−1). This is comparable to the 17 µm H2 line strengths measured in T Tauri stars studied by
Bitner et al. (2008), as well as to the 17µm H2 line luminosity from the (similarly isolated)
TW Hya (LH2 =4.17×1027 erg s−1, assuming a distance of 53 pc; Najita et al., 2010).
Carmona et al. (2008) did not detect H2 emission towards V4046 Sgr using VISIR on
the VLT Melipal telescope. They report a three sigma upper limit for 17 µm H2 emission

51
of <1.3×10⁻¹⁴ erg s−1 cm2, which is roughly equivalent to our measured H2 17 µm flux.
The non-detection of H2 by Carmona et al. (2008) may be due to VISIR having a smaller
slit size, or the difficulty of removing atmospheric effects from ground-based spectra. It is
also possible that the H2 emission is variable as a result of ongoing accretion and variable
X-ray/UV luminosity (Bary et al., 2008).
Assuming that the H2 emission is optically thin, the H2 gas is in local thermal equilib-
rium, and the IRS slit covers the entire source (note that we have already corrected for the
source possibly extending beyond the coverage of the SH slit), we can estimate an upper
limit for the mass of the emitting H2 gas as a function temperature from
Mgas = f × 1.76× 10−204πd2λFulhcAulxu(T )
M, (2.1)
where Ful is the flux of the H2 emission line, λ is the central wavelength of the emission
line, d is the distance in parsecs, Aul is the Einstein coefficient of the J = u− l transition7,
and xu(T ) is the population at level u for a given excitation temperature T (Thi et al., 2001).
Since only the H2-ortho 17 µm emission line is detected in our spectrum, we multiply by a
conversion factor f = 1 + (ortho/para)−1 (Carmona et al., 2008), where the equilibrium
ortho/para ratio can be determined from equation (1) in Takahashi (2001).
Figure 2.6 shows the resulting mass of the emitting H2 gas for various excitation tem-
peratures, as well as the total gas+dust mass of the disk established by Rosenfeld et al.
(2013) (0.094 M). It is apparent that if the H2 gas were at temperatures .100 K, the gas
mass needed to produce the line flux we see in the Spitzer spectrum would exceed that of
the total gas+dust disk mass. Indeed, from the upper limit on the flux of the H2 S(0) emis-
sion feature at 28.2 µm (<1.9 ×10⁻¹⁴ erg s−1 cm−2), we estimate the lower limit for the
excitation temperature of the H2 emitting gas to be ∼100 K (see Thi et al., 2001, eqn. 3).
This suggests that much of the IR-emitting H2 gas resides in the surface layers of the disk,
where the temperature is warmer than the midplane at a given radius due to stellar X-ray
and/or UV irradiation.
7Aul=4.76×10⁻¹⁰ s−1 for the H2-ortho J = 3-1 transition (Wolniewicz et al., 1998)
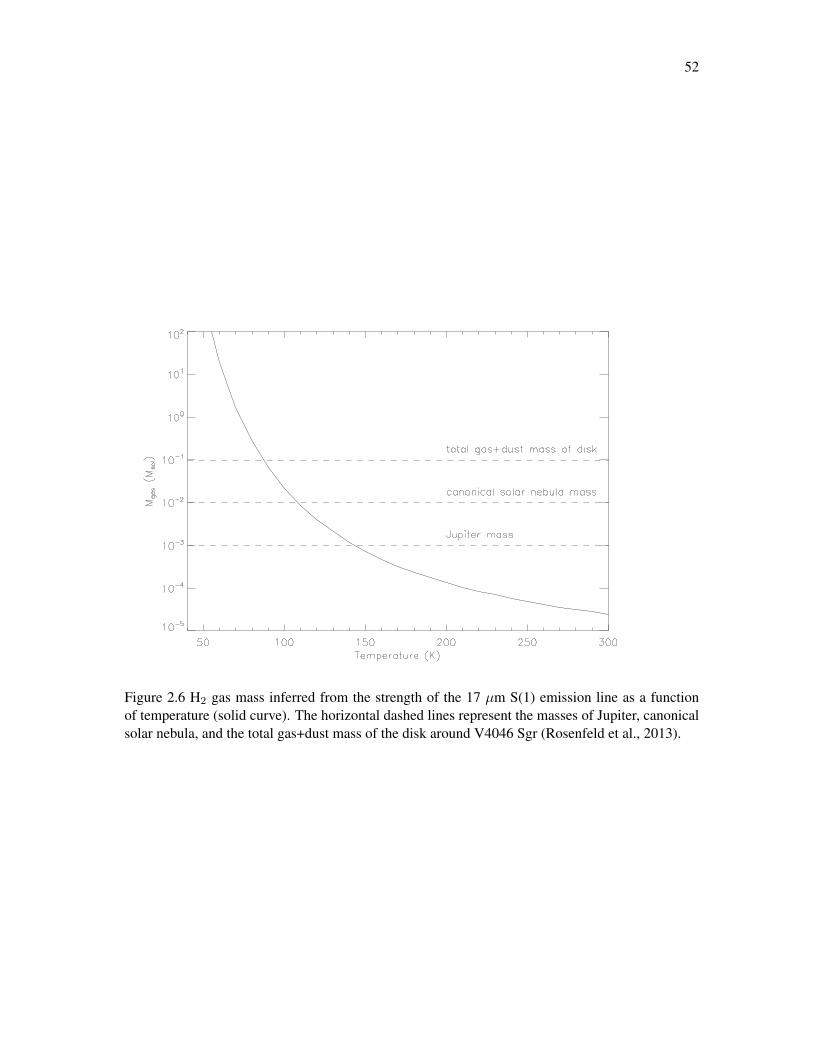
52
Figure 2.6 H2 gas mass inferred from the strength of the 17 µm S(1) emission line as a functionof temperature (solid curve). The horizontal dashed lines represent the masses of Jupiter, canonicalsolar nebula, and the total gas+dust mass of the disk around V4046 Sgr (Rosenfeld et al., 2013).
53
2.4.2 [Ne II] and [Ne III]
The brightest line in the Spitzer IRS spectrum of V4046 Sgr is that of [Ne II] at 12.8
µm. We measure a [Ne II] emission flux of 8.67 ± 0.13 ×10⁻¹⁴ erg s−1 cm−2. [Ne II]
emission is often prominent in T Tauri systems and likely traces hot (T∼5000 K) disk gas
that is being photoevaporated by EUV and X-ray radiation incident on the disk’s upper
atmosphere within a few tens of AU of the central star (Glassgold et al., 2004). Irradiated
disk models (Meijerink et al., 2008; Ercolano et al., 2008; Ercolano & Owen, 2010) predict
a correlation between the strength of the [Ne II] line and the X-ray luminosity. Recent
studies of circumstellar disks (e.g. Gudel et al., 2010; Sacco et al., 2012) have shown a weak
correlation between X-ray luminosity and the strength of [Ne II] emission, and blueshifts
of [Ne II] consistent with emission due to a photoevaporative wind or magnetically driven
outflow.
Sacco et al. (2012) obtained high resolution mid-IR spectra covering the [Ne II] (12.81 µm)
emission line towards V4046 Sgr (and 31 other YSOs) using the VISIR spectrograph on
the VLT. They detected V4046 Sgr and measured a [Ne II] line flux of 6.6 ± 0.2 × 10⁻¹⁴
erg s−1 cm−2. Sacco et al. (2012) also measured the flux of the [Ne II] 12.81 µm emission
from the Spitzer spectrum as 7.68 ± 0.22 x 10⁻¹⁴ erg s −1 cm−2, which is consistent with
our flux measurement after rescaling for slit loss. The difference between the Spitzer and
VLT [Ne II] flux measurements may be indicative of time variability of the emission, but
could also be due to the different slit sizes.
The VLT [Ne II] emission from V4046 Sgr is slightly blueshifted and likely arises from
R.5 AU, where a photoevaporative wind is escaping the inner gaseous disk (Sacco et al.,
2012). Rapson et al. (2015) show that the R∼30 AU gap in the disk (Rosenfeld et al.,
2013) is filled with (sub)-micron dust grains that may provide enough opacity to produce
the observed [Ne II] line. Calculation of the 12 µm opacity throughout the V4046 Sgr disk
based on dust column densities from Rosenfeld et al. (2013) suggests that there is sufficient
optical depth at R∼ 20-50 AU to absorb the red-shifted portion of the [Ne II] emission.
Thus, the [Ne II] emission likely originates in this region of the inner disk, as Sacco et al.
(2012) suggested.

54
Espaillat et al. (2007b) measure the [Ne II] emission from CS Cha, a ∼2 Myr old T
Tauri star that is similar to V4046 Sgr in that is surrounded by a transitional disk with
an inner gap out to R∼43 AU. V4046 Sgr has a [Ne II] luminosity of 5.5 × 1028 erg s−1
(assuming D=73 pc) which is roughly half that measured for CS Cha. If the strength of the
[Ne II] emission is due to X-ray and EUV photons impinging on the disk, then this lower
[Ne II] luminosity would be consistent with the fact that the X-ray luminosity of V4046 Sgr
is also lower than that for CS Cha (Feigelson et al., 1993; Donati et al., 2011). However,
both disks have a [Ne II] luminosity higher than what is typically observed for classical T
Tauri stars (Espaillat et al., 2007b; Pascucci et al., 2007, and references therein). Espaillat
et al. (2007b) attribute this to the high accretion rate of CS Cha (1.2×10⁻⁸ M yr−1), yet
V4046 Sgr has a much lower accretion rate (5×10⁻¹⁰ M yr−1; Donati et al., 2011) and
still shows a high [Ne II] luminosity. Therefore, mass accretion rate may not be a good
indication of the strength of the [Ne II] line in circumstellar disks. This comparison points
out the need for additional studies aimed at investigating potential correlations between [Ne
II] line luminosity and star/disk system parameters.
The 12.8 µm [Ne II] feature, combined with measurements of emission from [Ne III],
can be used as X-ray/EUV radiation field diagnostics. Emission from 15.6 µm [Ne III] is
rarely detected in T Tauri systems, and upper limits are usually an order of magnitude below
that of [Ne II] (e.g., Lahuis et al., 2007). We report only an upper limit for the 15.6 µm
[Ne III] line in Table 2.1, as this line is at best tentatively detected and a potential line is only
apparent in one nod. For V4046 Sgr, we find [Ne III]/[Ne II] . 0.13, which is consistent
with the ratio determined for TW Hya ([Ne III]/[Ne II] ∼ 0.045) (Najita et al., 2010), and
is comparable to other CTTS that lack jets (e.g. Lahuis et al., 2007). Modeling of X-ray
irradiation of protoplanetary disks (Ercolano et al., 2008) also predicts [Ne III]/[Ne II].0.1
for X-ray bright systems.
Pascucci et al. (2014) constrain the EUV irradiation of the V4046 Sgr disk by study-
ing radio data that traces free-free emission from ionized gas caused by EUV irradiation.
They find that the inferred EUV luminosity reaching the disk is much lower for older disks
(V4046 Sgr, TW Hya and MP Mus) than for younger, less evolved disks, and that the EUV

55
flux for V4046 Sgr is not sufficient to produce the [Ne II] luminosities measured by Sacco
et al. (2012) and confirmed in this work. Thus, the disk is likely being photoevaporated∼1
keV X-ray photons at a faster rate than if EUV photons were responsible for the photoe-
vaporation.
2.4.3 H2O and OH
Emission from H2O and OH has been detected in the Spitzer spectra around many young
stars (e.g., Salyk et al., 2008; Carr & Najita, 2008; Pontoppidan et al., 2010; Carr & Najita,
2011). In general, this emission is found to arise from regions of the disk with temperatures
T.1000 K, corresponding to a radius of a few AU, where some H2O is photodissociated
into OH by far-UV photons. V4046 Sgr shows tentative evidence for H2O emission in
the Spitzer spectrum and lacks emission at wavelengths that typically trace the presence of
H2O and OH in circumstellar disks (see section 3.2.1). In particular, the Spitzer spectrum
of TW Hya (Najita et al., 2010) shows no emission from H2O in the Spitzer SH spectrum,
but displays many OH emission lines.
Emission from the higher energy rotational states (Eupper &7000 K) of OH observed
in the TW Hya spectrum likely arises from warm (T∼1000 K) H2O gas that has been
photodissociated within the inner 1 AU of the disk . This suggests that, even though TW
Hya exhibits an inner hole (R∼4 AU) in its dusty disk (Hughes et al., 2007; Rosenfeld
et al., 2012b), there is gas present within this hole in the form of dissociated water vapor.
We cannot rule out the presence of OH emission in the V4046 Sgr IRS spectrum at the level
of that in the TW Hya IRS spectrum, because the V4046 Sgr spectrum is less sensitive
(due to shorter exposure times8). Thus, while the lack of H2O emission in the Spitzer
spectrum of V4046 Sgr may be due to FUV radiation photodissociating the H2O to form
OH, more sensitive measurements and modeling of emission features are needed to confirm
the presence of OH.
Emission from OH is clearly present in the Herschel spectra of V4046 Sgr, while o-
H2O 818 → 707 emission at 63.32 µm (Figure 2.3) is tentatively detected Howard et al.
8V4046 Sgr was observed with Spitzer for 30 and 14 seconds in the SH and LH mode, respectively, while TW Hyawas observed, only in SH mode, for 120 and 600 seconds.

56
(2013), Riviere-Marichalar et al. (2012b) and Keane et al. (2014) detect o-H2O 818 → 707
emission from certain T Tauri disks in the Taurus/Auriga and other nearby star forming
regions, especially from those that also display [O I] emission. Based on visual inspection
of the Herschel spectra in Thi et al. (2010), TW Hya may also show o-H2O emission at
63µm, though it is not noted in that paper. Emission from 63 µm o-H2O in T Tauri disks
had been thought to originate from the same regions at which the hot H2O gas emission
in Spitzer spectra is present (Salyk et al., 2008; Pontoppidan et al., 2009; Meijerink et al.,
2009), but recent modeling of o-H2O emitting sources (Riviere-Marichalar et al., 2012b)
has shown that the 63 µm emission originates at larger radii in the disk. Similarly detailed
modeling of the emission spectrum of V4046 Sgr is needed to confirm if this is the case for
V4046 Sgr; if so, it is a direct probe of cooler H2O in the disk.
Hogerheijde et al. (2011) detect o-H2O 110 → 101 and p-H2O 111 → 000 emission from
TW Hya at 538 and 269 µm, respectively, with Herschel-HIFI. They attribute this emission
to a large reservoir of water vapor at r > 50 AU from the central star. We do not detect
emission from these H2O transitions in our (relatively low sensitivity) SPIRE spectrum.
We also detect collisionally excited OH 2Π3/2 emission towards V4046 Sgr at 119.23
µm and 119.44 µm in the PACS range spectra, along with radiatively excited OH 2Π3/2
emission at 84.60 and 84.42 µm (blended with CO) in the PACS line spectra (Figure 2.3 and
2.5, respectively). Fedele et al. (2012, 2013) and Wampfler et al. (2010, 2013) detect H2O
and OH emission from protoplanetary disks around both low and high-mass young stellar
objects. Emission from both the collisionally excited 2Π3/2 level, as well as the far-infrared
radiatively excited OH 2Π1/2 level, is seen in most systems. Fedele et al. (2013) also detect
OH emission features towards protoplanetary disks around both low and high mass stars.
Since emission from OH 2Π1/2 transitions is not detected in the PACS range scan spectra of
V4046 Sgr, we conclude that collisionally excited OH molecules may dominate emission
around more evolved sources like V4046 Sgr, whereas far-infrared pumping and collisional
excitations are both important processes in younger, less evolved systems.

57
2.4.4 [O I]
Emission from [O I] is well detected at 63.18 µm in the Herschel/PACS spectrum of V4046
Sgr (Figure 2.3, Table 2.2). [O I] emission arises in protoplanetary disks when UV radia-
tion from the central T Tauri star photodissociates CO or OH molecules in the outer disk
(Mamon et al., 1988; Aresu et al., 2012). Disk gas mass estimates can be derived through
observations of 12CO and 13CO emission, so it is important to understand how the CO in a
disk has been affected by such a UV field. Emission from [O I] has been detected around
both T Tauri and Herbig Ae/Be stars (e.g Mathews et al., 2010; Riviere-Marichalar et al.,
2012a,b; Fedele et al., 2013; Howard et al., 2013), and is also well detected in the Herschel
spectrum of TW Hya (Thi et al., 2010). The [O I] emission at 63 µm from TW Hya is
slightly stronger than the emission we measure from V4046 Sgr, yet neither V4046 Sgr nor
TW Hya show detectable 145 µm [O I] emission or 158 µm [C II] emission (Thi et al.,
2010). Emission from 370.3 µm [C I] is also not detected in the V4046 Sgr, but a 3σ upper
limit is reported in Table 2.2. This may suggest that UV radiation from the central stars
in both systems is actively photodissociating CO and/or OH in the outer layers of the disk
(Acke et al., 2005), with the excess C and/or H then being bound up in the form of carbon
or hydrogen-bearing molecules.
Keane et al. (2014) used Herschel PACS to search for [O I] 63 µm emission from full
disks (i.e. systems with no evidence for a disk gap), transition disks, and outflow systems
in star forming regions. They detect [O I] emission from 21 transitional disks and find that
the strength of the [O I] lines is typically ∼1/2 that of full disk sources. Of the stars in the
Keane et al. (2014) sample, V4046 Sgr is most similar to the full disk systems DK Tau,
DQ Tau, DS Tau, DG Tau, and HK Tau in Taurus in terms of spectral type, multiplicity,
and accretion rate. Assuming a distance to Taurus of 137 pc (Torres et al., 2008), we find
that the luminosity of the [O I] line for V4046 Sgr is ∼1/4 that of these Taurus star/disk
systems, consistent with the notion that transitional disk systems tend to have lower [O I]
line strengths (Keane et al., 2014).

58
2.4.5 HCN
HCN serves as a tracer of carbon-rich disk regions, where there is an excess of carbon to
bond with free H and N atoms. Normally, most of the carbon is bound in either CO or
CO2 molecules, but in disks with a high H2O content, much of the oxygen is locked up
in H2O, leaving behind excess C (Agundez et al., 2008). Emission from mid-IR HCN is
commonly seen in T Tauri stars (Pontoppidan et al., 2009) and is potentially correlated with
accretion rate and X-ray luminosity (Teske et al., 2011). We detect emission from HCN at
∼14 µm in the Spitzer spectrum of V4046 Sgr (Figure 2.1). The integrated HCN line flux
is comparable to HCN emission from classical T Tauri stars in Taurus (3.2 mJy µm; Teske
et al., 2011). HCN has previously been detected around V4046 Sgr at submm wavelengths
with the IRAM 30m and APEX telescopes (Kastner et al., 2008, 2014a) and this submm
emission may also be correlated with UV/X-ray luminosity (Kastner et al., 2008).
2.4.6 CO
CO emission from the outer (R∼30 AU – 370 AU) disk of V4046 Sgr has previously been
detected in the submm with the SMA (Rodriguez et al., 2010) and IRAM (Kastner et al.,
2008), and was extensively modeled by Rosenfeld et al. (2013). The Herschel PACS data
extend these CO detections to higher J transitions that probe the warmer inner regions of
the disk (R ∼10-30 AU). The PACS line scan data (Figure 2.5) show emission from high-J
transitions of CO that are not apparent in the less sensitive range scan PACS data (Figure
2.2). Specifically, we detect emission from CO J= 31→30 (blended with OH), J=18→17,
and J=15→14, and tentatively detect emission from CO J=30→29. Modeling of these Her-
schel/PACS CO emission features, along with the other emission features mentioned above
and previous studies of CO emission, would help constrain the gas temperature distribution
throughout the V4046 Sgr disk.
59
2.5 Silicate Dust
2.5.1 Dust grain modeling
Silicate grain spectral emission features, including amorphous silicates, as well as crys-
talline grain species such as forsterite, enstatite, silica, pyroxene and olivine, have been
identified in the mid-IR spectra of many T Tauri stars (e.g. Cohen & Witteborn, 1985;
Honda et al., 2003; Sargent et al., 2006, 2009a). Analysis of such spectra yields dust grain
compositions and, in particular, the type and relative concentrations of silicates in these
disks. We modeled the silicate dust features in the Spitzer IRS spectrum of V4046 Sgr
using custom IDL programs developed by Sargent et al. (2009b). In this method, one fits
a two-temperature model that is the sum of optically thick emission from warm and cold
blackbodies (Tw and Tc, respectively), and optically thin emission from two dust popula-
tions corresponding to Tw and Tc, respectively. The model flux is given by
Fν(λ)mod = Bν(λ, Tc)[Ωc +
∑j
ac,jκj(λ)]+
Bν(λ, Tw)[Ωw +
∑j
aw,jκj(λ)],
(2.2)
where Bν(λ, T ) is the Planck function, Ωc (Ωw) is the solid angle of the blackbody at
temperature Tc (Tw), ac,j (aw,j) is the mass weight of silicate dust feature j at temperature Tc
(Tw), and κj(λ) is the opacity at wavelength λ for dust species j. While a multi-temperature
model would be more realistic, a two-temperature dust model that characterizes the inner
and outer disk regions generally well describes the thermal IR emission from T Tauri star
disks (Sargent et al., 2009a).
To determine the best fit model to the V4046 Sgr spectrum, we minimize χ2 between
the model and the 7.7 - 33 µm region of the spectrum. It is assumed, for simplicity, that all
data points are independent (i.e., the covariance between pixels is zero). Our Spitzer data is
excessively noisy longward of 33 µm, so we omit these data from the fit. The best fit model
(Table 2.3), which has 18 free parameters fitting 1490 individual data points, is shown in
Figure 2.7. This model spectrum assumes a central source of blackbody temperature 4200
K, and indicates that the temperature of dust detected by Spitzer lies in the range∼120-340
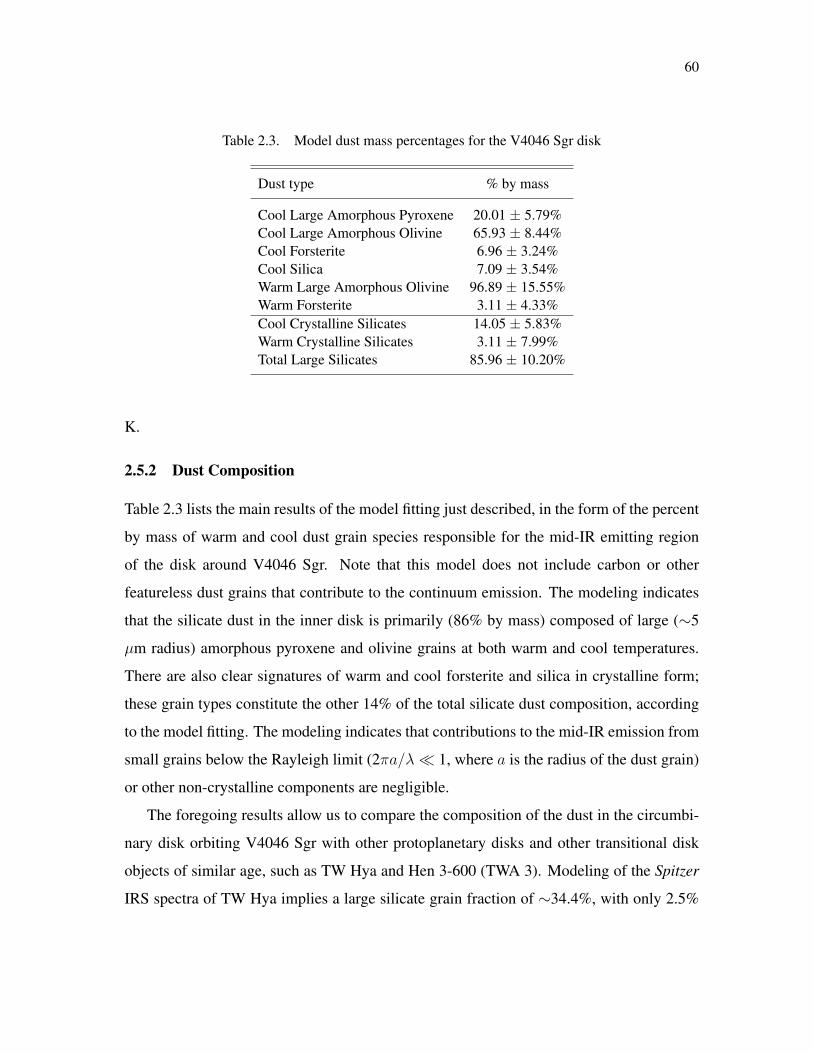
60
Table 2.3. Model dust mass percentages for the V4046 Sgr disk
Dust type % by mass
Cool Large Amorphous Pyroxene 20.01 ± 5.79%Cool Large Amorphous Olivine 65.93 ± 8.44%Cool Forsterite 6.96 ± 3.24%Cool Silica 7.09 ± 3.54%Warm Large Amorphous Olivine 96.89 ± 15.55%Warm Forsterite 3.11 ± 4.33%Cool Crystalline Silicates 14.05 ± 5.83%Warm Crystalline Silicates 3.11 ± 7.99%Total Large Silicates 85.96 ± 10.20%
K.
2.5.2 Dust Composition
Table 2.3 lists the main results of the model fitting just described, in the form of the percent
by mass of warm and cool dust grain species responsible for the mid-IR emitting region
of the disk around V4046 Sgr. Note that this model does not include carbon or other
featureless dust grains that contribute to the continuum emission. The modeling indicates
that the silicate dust in the inner disk is primarily (86% by mass) composed of large (∼5
µm radius) amorphous pyroxene and olivine grains at both warm and cool temperatures.
There are also clear signatures of warm and cool forsterite and silica in crystalline form;
these grain types constitute the other 14% of the total silicate dust composition, according
to the model fitting. The modeling indicates that contributions to the mid-IR emission from
small grains below the Rayleigh limit (2πa/λ 1, where a is the radius of the dust grain)
or other non-crystalline components are negligible.
The foregoing results allow us to compare the composition of the dust in the circumbi-
nary disk orbiting V4046 Sgr with other protoplanetary disks and other transitional disk
objects of similar age, such as TW Hya and Hen 3-600 (TWA 3). Modeling of the Spitzer
IRS spectra of TW Hya implies a large silicate grain fraction of ∼34.4%, with only 2.5%
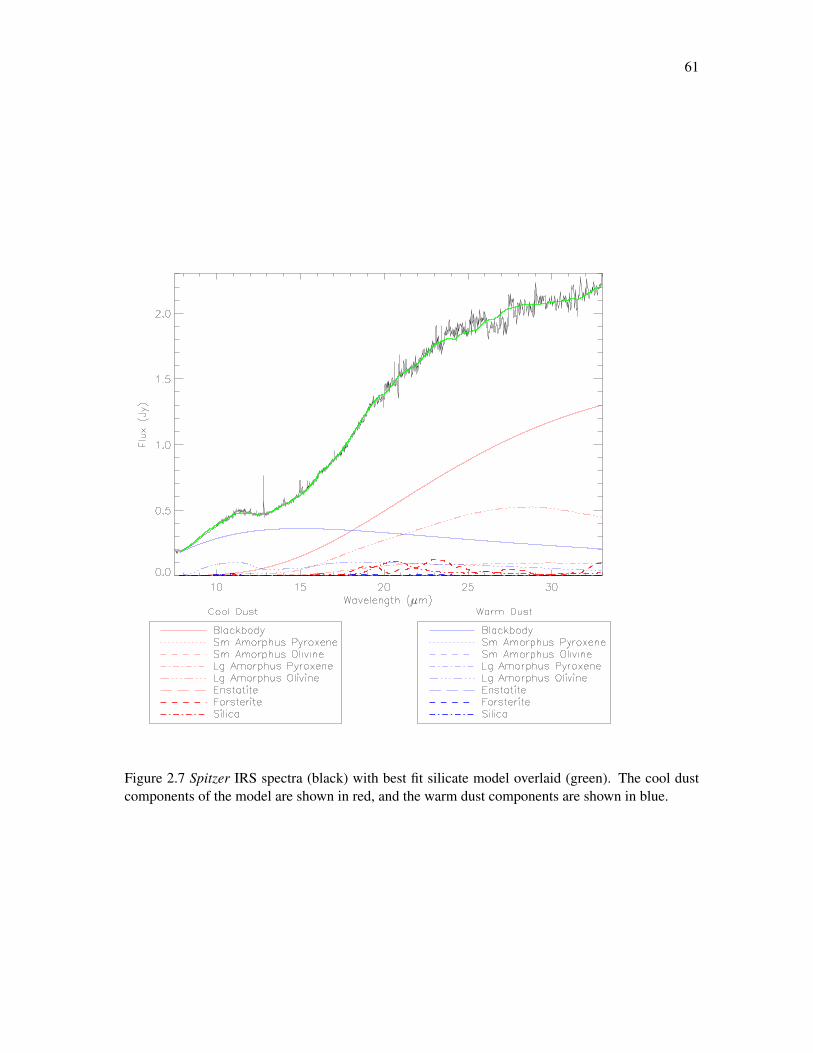
61
Figure 2.7 Spitzer IRS spectra (black) with best fit silicate model overlaid (green). The cool dustcomponents of the model are shown in red, and the warm dust components are shown in blue.

62
crystallinity, while modeling of Hen 3-600A results in a similar large silicate grain per-
centage of 31.9%, but with a high crystallinity of 36.2% (Honda et al., 2003; Sargent et al.,
2006). Studies of T Tauri stars in the Taurus/Auriga star forming region and the TW Hy-
drae association have shown that transitional disk systems have negligible crystallinity and
only modest large silicate grain fractions (<35%; Sargent et al., 2006), yet the disk around
V4046 Sgr has a comparatively high crystallinity fraction and is otherwise dominated by
large silicate grains.
Sargent et al. (2009a) use methods identical to those described above to model the
Spitzer spectrum of 64 protoplanetary disks in the Taurus/Auriga star forming region (age
∼1-2 Myr; Kenyon & Hartmann, 1995), which is considerably younger than V4046 Sgr.
They find median mass fractions for warm and cool crystalline silicate dust of 11% and
15%, respectively, whereas V4046 Sgr displays 3% and 14% crystallinity, respectively.
However, the transitional and pre-transitional sources in the Sargent et al. (2009a)sample
all have negligible crystallinity fractions. The fraction of large, cool dust grains inferred for
the V4046 Sgr disk is also very high– larger than 93% of the sources in Taurus/Auriga. This
suggests that grain growth has occured in the disk, which is consistent with the advanced
age of the system. Sargent et al. (2009a) also find that disks orbiting multiple star systems
tend to have larger warm large grain fractions than single star systems. This may be due
to dynamical interactions between the stars and the disk that trigger grain growth in the
inner disk and/or to photoevaporation of small grains. Since V4046 Sgr is a multiple star
system with a large mass fraction of cool large grains rather than warm large grains, it is
possible that a planetary companion in the inner disk is clearing away smaller particles and
enhancing the large grain population at larger (cooler) radii.
A variety of mechanisms have been suggested as to how crystalline silicates form in
protoplanetary disks (see, e.g., Sargent et al., 2006). One of the leading mechanisms in-
volves amorphous silicates being thermally annealed into crystalline silicates as a result
of heating induced by shock fronts within the disk. These shock fronts can result from
star-disk interactions, if the disk is massive enough, or from local gravitational instabilities
associated with planet formation. Rapson et al. (2015) (Chapter 4) present direct-imaging

63
evidence for dust segregation by size, as well as dust ring structure, in the inner∼40 AU of
the disk around V4046 Sgr, and suggest that planet formation has occurred or is ongoing in
the disk. This planet formation activity, if present, would help explain the combination of
moderate crystallinity and large dust grains. Grain growth and planet formation may have
occurred recently in the disk, thus creating a larger than typical crystallinity fraction for a
disk with an inner gap and advanced age. Crystalline silicates at or interior to these planet
formation zones would likely accrete onto either the central binary star or protoplanet(s).
Since the Spitzer spectra are tracing the inner few AU of the disk (see section 2.4.8) we
may be seeing the crystalline silicates in the innermost portion of the disk that have not yet
accreted onto the central stars.
Another possible scenario for the presence of crystalline silicates in the disk, and the
varying crystallinity fraction amongst young stars, is thermal annealing of surface grains
due to intense pre-MS stellar outbursts (Abraham et al., 2009). Such outbursts are typically
associated with episodes of dramatically enhanced pre-MS accretion rate, however, and
the (highly evolved, low-accretion-rate) V4046 Sgr system is unlikely to have experienced
such an episode. Furthermore, our modeling shows that the warm dust is currently at a
temperature of ∼350 K, far below the ∼700 K required to thermally anneal dust, so if
crystalline silicates formed via irradiation during an accretion-related outburst, they have
since cooled and migrated outward in the disk.
2.5.3 Amending the Rosenfeld et al. (2013) model
Modeling of the entire V4046 Sgr disk was conducted by Rosenfeld et al. (2013) based
on their SMA CO data, as well as on Spitzer IRS spectra and archival photometric data of
V4046 Sgr. Using a 3D radiative transfer code, they developed a three-component model
that includes an inner “gap” filled with µm-sized dust grains out to ∼29 AU, a ring of
cm/mm-sized dust grains from ∼29-45 AU, and an extended halo of CO and small grain
emission. Their resulting model well reproduces the mid- to far-IR photometry and 1.3 mm12CO and continuum interferometric observations of V4046 Sgr. The same model fits our
Herschel data remarkably well, due to their inclusion of µm-sized grains out to ∼ 30 AU.

64
Figure 2.8 Spitzer and Herschel spectra (black) with our silicate dust model (blue) from 7-33 µmand the Rosenfeld et al. (2013) model (red solid) from 33-600 µm overlaid. The Rosenfeld et al.(2013) model from 0.25-33 µm is shown as the red dotted line. Orange asterisks are photometricdata points from the literature (B & V from Høg et al. (2000), I from Messina et al. (2010), J,H & Kfrom Cutri et al. (2003), AKARI 65 & 90 µm data from Yamamura et al. (2010), WISE bands 1-4data from Cutri & et al. (2013), and 350,450, 800 & 1100 µm data from Jensen et al. (1996)).
However, the Rosenfeld et al. (2013) model did not reproduce the detailed SED structure
at Spitzer IRS wavelengths. The mismatch between the model and data in this wavelength
range was due to the presence of a complex (crystalline plus amorphous) silicate grain
mixture in the inner disk (see section 2.4.7) that is not accounted for by the three-component
model.
In Figure 2.8, we replace the shorter-wavelength (7.7-33 µm) portion of the Rosenfeld
et al. (2013) model with our silicate model. This revised model, which better reproduces the
Spitzer spectra, merges seamlessly with the Rosenfeld et al. (2013) model at ∼33 µm. Us-
ing the Rosenfeld et al. (2013) model, we can estimate the characteristic disk radii probed

65
Figure 2.9 Temperature at a given disk radius in the Rosenfeld et al. (2013) model for large grains(R >5 µm; black solid line) and small grains (R ∼5 µm; blue solid line). The horizontal dashedlines at 340 K and 116 K represent the two temperatures of the micron-sized silicate dust grains inour model.
by our silicate model, assuming that our newly calculated dust composition and resulting
dust opacities do not significantly alter the disk temperature in their models. Figure 2.9
shows disk temperature versus radius for both large (mm-sized) and small (micron-sized)
grains based on the Rosenfeld et al. (2013) model. Our silicate dust modeling shows dust
at 340 K and 116 K, which correspond to a radius of 0.3 AU and 1.3 AU, respectively,
for small (µm-sized) grains. We conclude that the Spitzer data likely probe the dust grain
populations of the inner disk within these approximate radii.

66
2.6 Conclusions
We have presented an analysis of Spitzer and Herschel spectra of the disk around V4046 Sgr
that elucidates the gas and dust constituents within the disk. We confirm the measurement
of strong [Ne II] at 12.8 µm previously reported by Sacco et al. (2012) and report an upper
limit for [Ne III] emission. The [Ne III]/[Ne II] ratio is consistent with other CTTS systems
that are X-ray bright and lack jets. We also detect emission from pure rotational H2 0-
0 S(1) (J=3→1) at 17 µm that likely originates in the surface layers of the disk where
the temperature is warmer than the midplane at a given radius due to stellar UV/X-ray
irradiation.
The X-ray/UV radiation coming from the central binary is likely photodissociating CO,
H2O, and OH, resulting in emission from [O I] and OH. We detect emission from [O I]
at 63 µm, but do not detect [C I] or [C II] in the mid- to far-infrared. Thus, the excess
C atoms may be forming HCN and other hydrocarbons throughout the disk, and/or the
[O I] is arising from photodissociated OH in the disk. The strength of the [O I] emission
is lower than that for star-disk systems of similar spectral type and accretion properties
surrounded by continuous disks, as was found by Keane et al. (2014) and Howard et al.
(2013). V4046 Sgr exhibits OH 2Π3/2 emission at 84.4, 84.6, and 119 µm, and possible
weak H2O emission features in the mid-IR. This suggests that H2O and collisionally excited
OH molecules reside in the the outer layers of the V4046 Sgr disk.
Modeling of the Spitzer spectra reveal that the mid-IR emitting region of the disk con-
sists primarily of large (∼ 5µm) silicate dust particles (86% by mass), with crystalline
forsterite and silica particles making up the other 14% of the mass. Overall, the pres-
ence of large grains suggests that grain growth may be occurring in the inner ∼30 AU
gap around V4046 Sgr and the abundance of cool dust suggests that dust may be settling
towards the midplane where temperatures are lower at a given radius. The moderate crys-
tallinity fraction is similar to that of less evolved protoplanetary disks in the Taurus/Auriga
star forming region (Sargent et al., 2009a), and may result from heating and thermal an-
nealing of micron-sized dust that is associated with planet formation activity in the inner
disk (Rapson et al., 2015). Combining our silicate dust model with the mid-IR to sub-mm

67
three-component model of Rosenfeld et al. (2013), we find that the dust emission seen in
the Spitzer spectrum likely originates from regions of the disk interior to 1.3 AU. These re-
sults together suggest that grain growth might, in part, explain the transitional appearance
of this disk.
Acknowledgements
We would like to thank Katrina Exter for assistance with processing the PACS and SPIRE
data, as well as Wing Fai Thi for his helpful discussions. This research work is based in
part on observations made with Herschel, a European Space Agency Cornerstone Mission
with significant participation by NASA; support was provided by NASA through an award
issued by JPL/Caltech. This work is based in part on observations made with the Spitzer
Space Telescope, which is operated by the Jet Propulsion Laboratory, California Institute
of Technology under a contract with NASA. Additional support is provided by National
Science Foundation grant AST-1108950 to RIT.

68
Chapter 3
A Spitzer and Herschel Spectral Analysis of theDisks Around the Young Stars MP Mus and TCha
3.1 Introduction
Within ∼100 parsecs, there are only a handful of pre-main sequence stars surrounded by
circumstellar disks that appear to be primordial in origin. These objects offer a great op-
portunity to study the later stages of stellar evolution and planet building processes in en-
vironments similar to the proto-solar nebula. Due to their close proximity, these disks
can easily be imaged photometrically or spectroscopically and therefore studied in great
detail. One of these nearby young stars, V4046 Sagittarius, has been extensively studied
both in the literature and in this dissertation (see Chapters 2 and 4). We now focus on
two other star+disk systems: T Chamaeleontis (T Cha) and MP Muscae (MP Mus). These
systems are similar to V4046 Sgr in that they are surrounded by, and actively accreting
from, gaseous and dusty circumstellar disks (Silverstone et al., 2006; Brown et al., 2007;
Pascucci et al., 2007; Hillenbrand et al., 2008; Sacco et al., 2014). However, T Cha and
MP Mus are both single star systems. Using a combination of Spitzer and Herschel near- to
far-infrared spectroscopy, we can study the gas and dust composition and structure of the
disk around both young stars, and compare our results to other star+disk systems to further
understand the processes of planet formation and disk evolution.
T Cha is a K0 IV star (Torres et al., 2006) within the ε Cha association, located ∼110
pc away (Torres et al., 2008; Murphy et al., 2013). Recent age estimates place T Cha
at ∼3-22 Myr (Murphy et al., 2013; Huelamo et al., 2015), yet a majority of the ε Cha
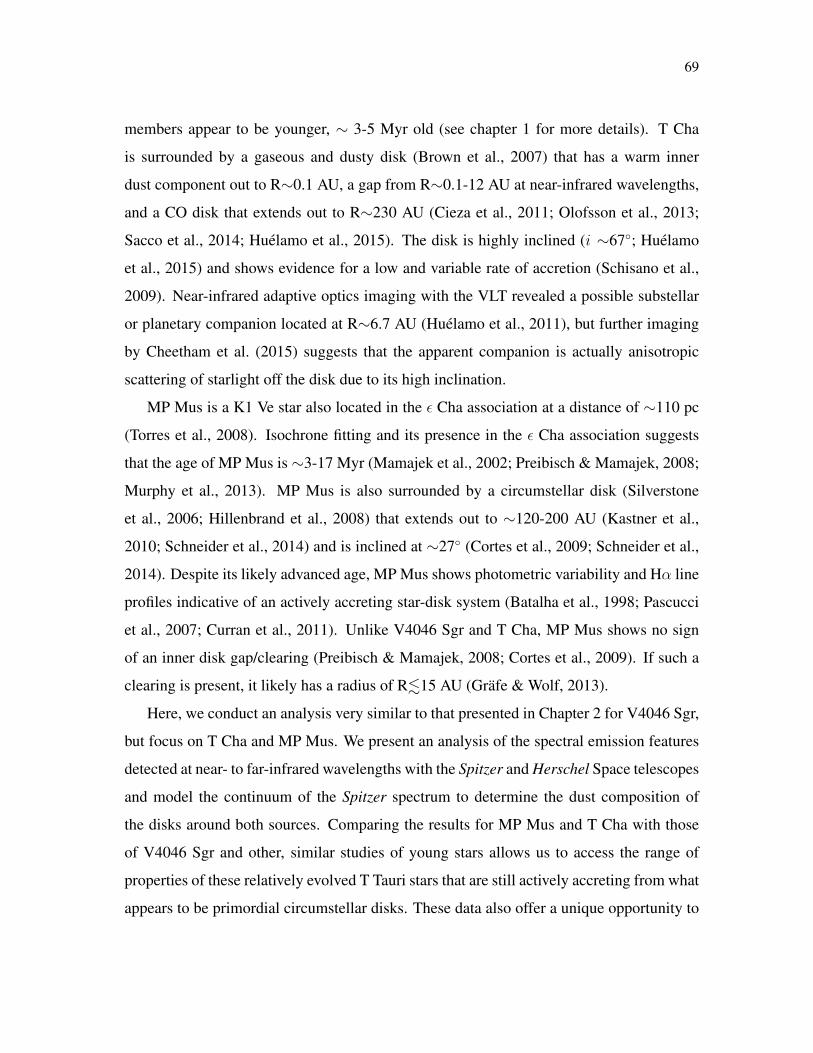
69
members appear to be younger, ∼ 3-5 Myr old (see chapter 1 for more details). T Cha
is surrounded by a gaseous and dusty disk (Brown et al., 2007) that has a warm inner
dust component out to R∼0.1 AU, a gap from R∼0.1-12 AU at near-infrared wavelengths,
and a CO disk that extends out to R∼230 AU (Cieza et al., 2011; Olofsson et al., 2013;
Sacco et al., 2014; Huelamo et al., 2015). The disk is highly inclined (i ∼67; Huelamo
et al., 2015) and shows evidence for a low and variable rate of accretion (Schisano et al.,
2009). Near-infrared adaptive optics imaging with the VLT revealed a possible substellar
or planetary companion located at R∼6.7 AU (Huelamo et al., 2011), but further imaging
by Cheetham et al. (2015) suggests that the apparent companion is actually anisotropic
scattering of starlight off the disk due to its high inclination.
MP Mus is a K1 Ve star also located in the ε Cha association at a distance of ∼110 pc
(Torres et al., 2008). Isochrone fitting and its presence in the ε Cha association suggests
that the age of MP Mus is ∼3-17 Myr (Mamajek et al., 2002; Preibisch & Mamajek, 2008;
Murphy et al., 2013). MP Mus is also surrounded by a circumstellar disk (Silverstone
et al., 2006; Hillenbrand et al., 2008) that extends out to ∼120-200 AU (Kastner et al.,
2010; Schneider et al., 2014) and is inclined at ∼27 (Cortes et al., 2009; Schneider et al.,
2014). Despite its likely advanced age, MP Mus shows photometric variability and Hα line
profiles indicative of an actively accreting star-disk system (Batalha et al., 1998; Pascucci
et al., 2007; Curran et al., 2011). Unlike V4046 Sgr and T Cha, MP Mus shows no sign
of an inner disk gap/clearing (Preibisch & Mamajek, 2008; Cortes et al., 2009). If such a
clearing is present, it likely has a radius of R.15 AU (Grafe & Wolf, 2013).
Here, we conduct an analysis very similar to that presented in Chapter 2 for V4046 Sgr,
but focus on T Cha and MP Mus. We present an analysis of the spectral emission features
detected at near- to far-infrared wavelengths with the Spitzer and Herschel Space telescopes
and model the continuum of the Spitzer spectrum to determine the dust composition of
the disks around both sources. Comparing the results for MP Mus and T Cha with those
of V4046 Sgr and other, similar studies of young stars allows us to access the range of
properties of these relatively evolved T Tauri stars that are still actively accreting from what
appears to be primordial circumstellar disks. These data also offer a unique opportunity to
70
observe sources with different disk inclinations to further understand the effects of viewing
geometry on apparent disk properties. The Spitzer and Herschel observations and data
reduction processes for T Cha and MP Mus are discussed in Section 3.2, and our methods
for detecting emission features and modeling the spectra are discussed in section 3.3. In
section 3.4 we present our results and compare our findings to those from other young stars,
and we draw conclusions in section 3.5.
3.2 Observations and Data Reduction
3.2.1 Spitzer IRS
Spitzer Space Telescope (Werner et al., 2004) data for MP Mus were obtained with the
InfraRed Spectrograph (IRS; Houck et al., 2004) in its low (R∼60-130) and high (R∼600)
resolution modes in August 2004 and April 2005, respectively (PI: R. Meyer1). Both data
sets, along with dedicated sky images for the high resolution spectra, were retrieved through
the Spitzer Heritage Archive. Short low (SL, 5-20µm), long low (LL, 20-37 µm), short
high (SH, 10-20 µm), and long high (LH, 20-37 µm) data were reduced individually using
SMART v8.2.5 (Higdon et al., 2004). The dedicated sky images were also reduced in
SMART and subtracted from the high resolution data. No sky subtraction was conducted
for the low resolution data. All images were manually inspected during processing and one
image from Channel 1 (SH) was removed from the data analysis because it contained a bad
column of data. Some images also contained bad pixels near 17.6 µm, so any resulting
feature in the spectrum at 17.6 µm was smoothed over. The two nods of each set of cleaned
spectra were averaged together, order edges were zapped, and the data were combined using
custom IDL programs. Examination of the original spectra showed a relatively smooth
continuum, with a slight flux mismatch (∼0.08 Jy at low resolution and ∼0.09 Jy at high
resolution) between the short and long spectra. MP Mus is unresolved by Spitzer, so this
flux mismatch is likely due to the source falling off the slit in the SH module. Therefore,
we scaled the SL and SH flux by 1.09 and 1.05, respectively, so that the continuum of the
1AORKEY for low resolution data: 5198336, AORKEY for high resolution data: 5451264

71
short and long modules matched. The resulting spectra are shown in Figure 3.1.
Figure 3.1 Top: Combined SL and LL Spitzer IRS data for MP Mus obtained in August 2004.Bottom: Combined SH and LH Spitzer IRS data for MP Mus obtained in April 2005. The SL andSH modules have been scaled by 1.09 and 1.05, respectively, to correct for a flux mismatch betweenthe modules.
Low resolution data (SL) and two sets of high resolution (SH and LH) Spitzer IRS data
for T Cha were retrieved through the Spitzer Heritage Archive. The SL data and one set of
SH and LH data were obtained in July 2004 (PI: N. Evans2) and the other set of SH and LH
data was obtained in May 2005 (PI: J. Houck3). All data were reduced individually using
SMART v8.2.5. No dedicated sky images were available for either of the high resolution
data sets, so no sky background subtraction or rogue pixel removal was conducted. All
images were manually inspected during processing and artifacts near 17.6 µm in the second
set of high resolution data were smoothed over. The two nods of each cleaned spectra were
2AORKEY: 56412163AORKEY: 12679424

72
averaged together, order edges were “zapped”, and the data were combined using custom
IDL programs.
Figure 3.2 Original reduction of the LH Spitzer IRS data for T Cha obtained in May 2005. The dataexhibit a stair-step or scalloped pattern due to high dark current near the blue end of the spectralimages. This results in a flux mismatch between the spectral orders.
The original reduction of the LH data obtained of T Cha in May 2005 showed a stair-
step pattern resulting in discontinuities between the orders in the LH spectrum (Figure 3.2).
This affect is called scalloping or tilting of the orders, and is a result of the dark current
in the images being time dependent. The dark current is anomalously high during image
acquisition, and disproportionally distributed towards the blue end of the spectrum. Figure
3.3 shows the basic calibrated data (BCD) products for nod 1 and nod 2 of this data set.
We can clearly see that the background levels near the bottom (blue end) of each image
are higher, resulting in excess flux at the blue end of each spectral order. To mitigate this

73
Figure 3.3 SH nod 1 (left) and nod 2 (right) Spitzer IRS data for T Cha obtained in May 2005.The spectral orders are the vertical white columns where wavelength increases from bottom to topand left to right. The background dark current (lighter pixels between the spectral orders) appearsbrighter near the blue end (bottom) of each image, causing the scalloping and artificially high fluxat the blue end of the spectral orders seen in Figure 3.2.
problem, we ran the SH BCD images through the IDL program dark settle 4 which
corrects the background levels in the raw images of the Spitzer spectra. The data were then
re-reduced in SMART using the method described above. The final reduced spectra for
both T Cha data sets are shown in Figure 3.4.
The LH spectra of T Cha from 2004 and 2005 show features that drop below the con-
tinuum level at 19.73, 23.75, 24.35 and 34.03 µm, and at 28.88 and 34.08 µm, respectively.
This is atypical of spectra from disks around young stars, as we expect features from op-
tically thin, relatively warm gas in the upper disk to be in emission at mid-infrared wave-
lengths. After inspection of the raw and cleaned 2-D spectral images, we conclude that
these features are most likely due to rogue pixels whose values are not corrected for due to
the lack of a dedicated sky background image. Therefore, we do not believe these features
are real and do not discuss them further.
3.2.2 Herschel PACS and SPIRE
Herschel Space Observatory (Pilbratt et al., 2010) spectral data is only available for MP
Mus. Photodetector Array Camera and Spectrometer (PACS; Poglitsch et al., 2010) range
4See Chapter 11.3 of the Spitzer Data Analysis Cookbook v. 4.0.1

74
Figure 3.4 Top: Combined SH and LH Spitzer IRS data for T Cha obtained in July 2004. Bot-tom: Combined SL, SH and LH Spitzer IRS data for T Cha obtained in May 2005. The excessdark current in the LH data has been corrected and the resulting spectrum no longer exhibits orderscalloping.
scan spectra and Spectral and Photometric Imaging Receiver (SPIRE; Griffin et al., 2010)
spectra of MP Mus were obtained in July 2012 and July 2011, respectively (PI: G. Sacco 5).
SPIRE data were obtained at medium resolution (R∼160), and PACS data were obtained
in SED mode (R∼940-5500). Together, these observations cover the 55-670 µm range.
Examination of the SPIRE level 2 data products from the archive showed a discontinuity
between the two orders (190-310 µm and 300-670 µm), identical to what was seen in the
original SPIRE spectra for V4046 Sgr. This suggests that the background was incorrectly
subtracted by the pipeline 6. To correct for this, we reduced both the PACS and SPIRE
data from level 0 in HIPE v.12 using interactive background normalization scripts, which
5PACS AORKEYs: 1342248541 and 1342248542 , SPIRE AORKEY: 13422247536See section 6.4 in the SPIRE data reduction Guide v2.1.

75
allow us to subtract the background more accurately than can be done via the standard
pipeline. The MultiObs scripts for PACS range scan data were used to reduce and flux
calibrate all four modules of the PACS spectra. Calibration trees 65 and 10.1 for PACS and
SPIRE, respectively, were used to correct for instrumentation effects and to flux calibrate
the spectra. The resulting images are cubes of 5x5 spaxels, where the point source should be
located only in the central spaxel. Telescope jitter and slight pointing errors can cause some
of the source flux to extend beyond the central spaxel. HIPE v.12 automatically corrects for
this by taking the flux ratio of the sum of the central 3x3 spaxels to the single center spaxel
and comparing it with the ratio of a perfectly pointed observation of a point source. The
continuum flux of the PACS and SPIRE data were, thus, automatically 3x3 corrected, and
regions where light leaks between spectral modules occur were manually removed. The
resulting Herschel PACS and SPIRE spectra of MP Mus are shown in Figure 3.5.
Figure 3.5 Herschel PACS (blue) and SPIRE (black) spectra of MP Mus.

76
3.3 Analysis
3.3.1 Silicate Dust Grain modeling
Spectral emission features from amorphous silicate dust, as well as crystalline forsterite,
enstatite, silica, pyroxene and olivine are often present in the mid-IR spectra of T Tauri stars
(e.g. Cohen & Witteborn, 1985; Honda et al., 2003; Sargent et al., 2006, 2009a). These
spectral features can be utilized to determine the dust grain composition and concentration
of crystalline silicates within the disks around these young stars. We modeled the silicate
dust features in the Spitzer IRS spectrum of MP Mus and T Cha using the methodology
described in Chapter 2 for V4046 Sgr. To summarize briefly, we use custom IDL programs
from Sargent et al. (2009b) to fit a two temperature model to the IRS spectra that is the sum
of optically thick emission from warm and cold blackbodies and optically thin emission
from two dust populations (see equation 2.1 in Chapter 2).
To determine the best fit model for MP Mus, we minimize the χ2 between the model
and the 7.7 - 37 µm region of the full low resolution spectrum. It is assumed, for simplicity,
that all data points are independent (i.e., the covariance between pixels is zero). The best
fit model and the corresponding model components are presented in Figure 3.6 and Table
3.1. This model spectrum assumes a central source of blackbody temperature 5100 K (MP
Mus has spectral type K1V; Torres et al., 2006), and indicates that the temperature of dust
detected by Spitzer lies in the range ∼128-360 K.
To determine the best fit model for T Cha, we minimize the χ2 between the model and
the 7.7 - 33 µm region of both high resolution spectra individually. Since the May 2005
data were corrected for excess dark current, it is likely that some error has been introduced
in the shape of the spectrum and thus errors in the dust composition determined by the
models. Overall, the shape of the two spectra look remarkably similar, and produce similar
dust model results (see discussion below). Our Spitzer data is excessively noisy longward
of 33 µm in both spectra, so we omit these data from the fit. Again, all data points are
assumed independent. The best fit model and the corresponding model components are
shown in Figures 3.7 and 3.8, and Table 3.1. These models assumes a central source of
blackbody temperature 5240 K (T Cha has spectral type K0V; Torres et al., 2006), and

77
Table 3.1. Model dust mass percentages for the MP Mus, T Cha and V4046 Sgr disks
MP Mus T Cha (July ’04) T Cha (May ’05) V4046 SgrDust type % by mass % by mass % by mass % by mass
Cool Small Amorphous Olivine 0 53.23 95.74 0Cool Large Amorphous Olivine 0 0 0 65.94Cool Small Amorphous Pyroxene 76.75 0 0 0Cool Large Amorphous Pyroxene 0 41.65 0 20.01Cool Enstatite 0 0 0 0Cool Forsterite 19.15 2.9 3.17 6.96Cool Silica 4.10 2.2 1.08 7.09Warm Small Amorphous Olivine 70.28 4.80 0 0Warm Large Amorphous Olivine 0 42.67 46.84 96.89Warm Small Amorphous Pyroxene 0 0 0 0Warm Large Amorphous Pyroxene 0 38.94 29.05 0Warm Enstatite 9.94 0 0 0Warm Forsterite 13.16 0 2.95 3.11Warm Silica 6.62 13.58 21.15 0
Cool Crystalline Silicates 23.25 5.11 4.26 14.05Warm Crystalline Silicates 29.72 13.58 24.11 3.11
Large Silicates 0 41.65 0 85.69Small Silicates 76.7 53.23 95.74 0Cool Temperature (K) 128 75 75 120Warm Temperature (K) 360 595 595 350
Note. — V4046 Sgr model data taken from Chapter 2.

78
Figure 3.6 Low resolution Spitzer IRS spectra (black) of MP Mus with best fit silicate model overlaid(green). The cool dust components of the model are shown in red, and the warm dust componentare shown in blue.
modeling of both spectra indicate that the temperature of dust detected by Spitzer lies in
the range ∼75-595 K.
3.3.2 Spectral line identification
Spectral line identification in both the Spitzer and Herschel spectra of MP Mus and T Cha
was performed both by eye and using custom IDL programs. The procedure to identify
emission or absorption features was the same as that for V4046 Sgr (See Chapter 2, Section
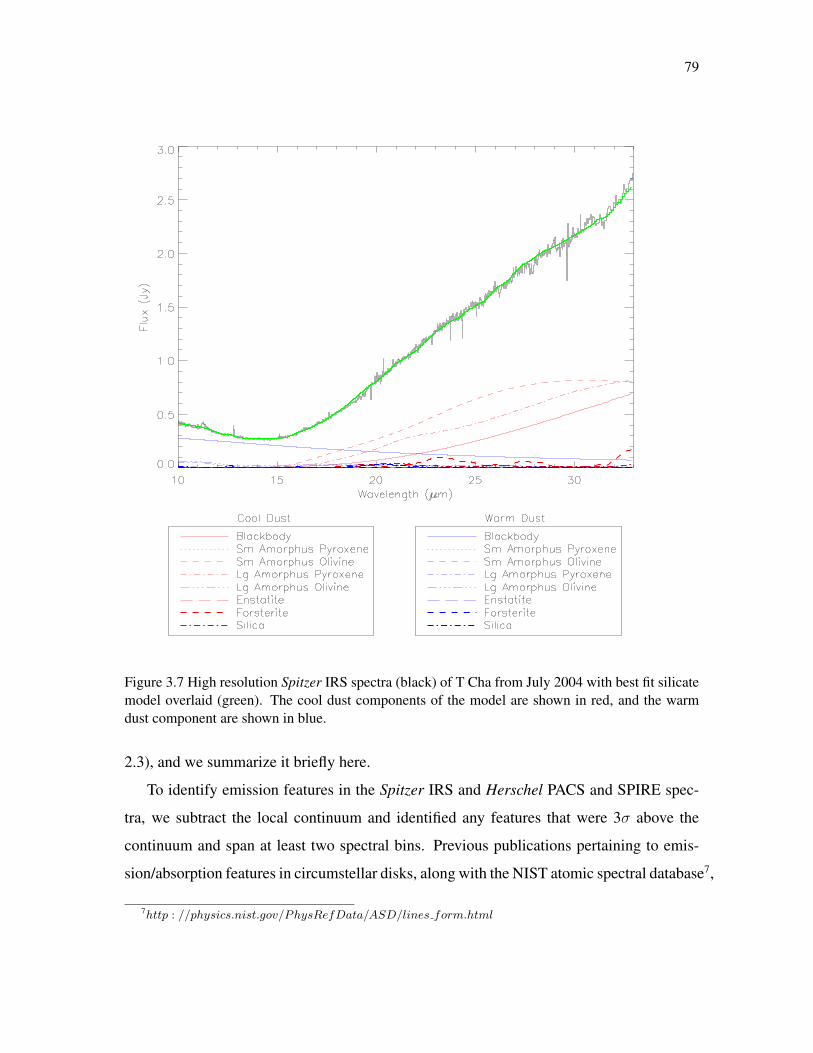
79
Figure 3.7 High resolution Spitzer IRS spectra (black) of T Cha from July 2004 with best fit silicatemodel overlaid (green). The cool dust components of the model are shown in red, and the warmdust component are shown in blue.
2.3), and we summarize it briefly here.
To identify emission features in the Spitzer IRS and Herschel PACS and SPIRE spec-
tra, we subtract the local continuum and identified any features that were 3σ above the
continuum and span at least two spectral bins. Previous publications pertaining to emis-
sion/absorption features in circumstellar disks, along with the NIST atomic spectral database7,
7http : //physics.nist.gov/PhysRefData/ASD/lines form.html

80
Figure 3.8 High resolution Spitzer IRS spectra (black) of T Cha from May 2005 with best fit silicatemodel overlaid (green). The cool dust components of the model are shown in red, and the warmdust component are shown in blue.
and Splatalogue database for astronomical spectroscopy8, were used to determine the species
and transition associated with each candidate emission feature. Tables 3.2 and 3.3 list
the candidate lines identified in the Spitzer and Herschel spectra for T Cha and MP Mus,
respectively, and their measured wavelengths, upper-level transition energies, fluxes, full
widths at half maximum, and equivalent widths. Figures 3.9 and 3.10 show the regions
8http : //splatalogue.net/
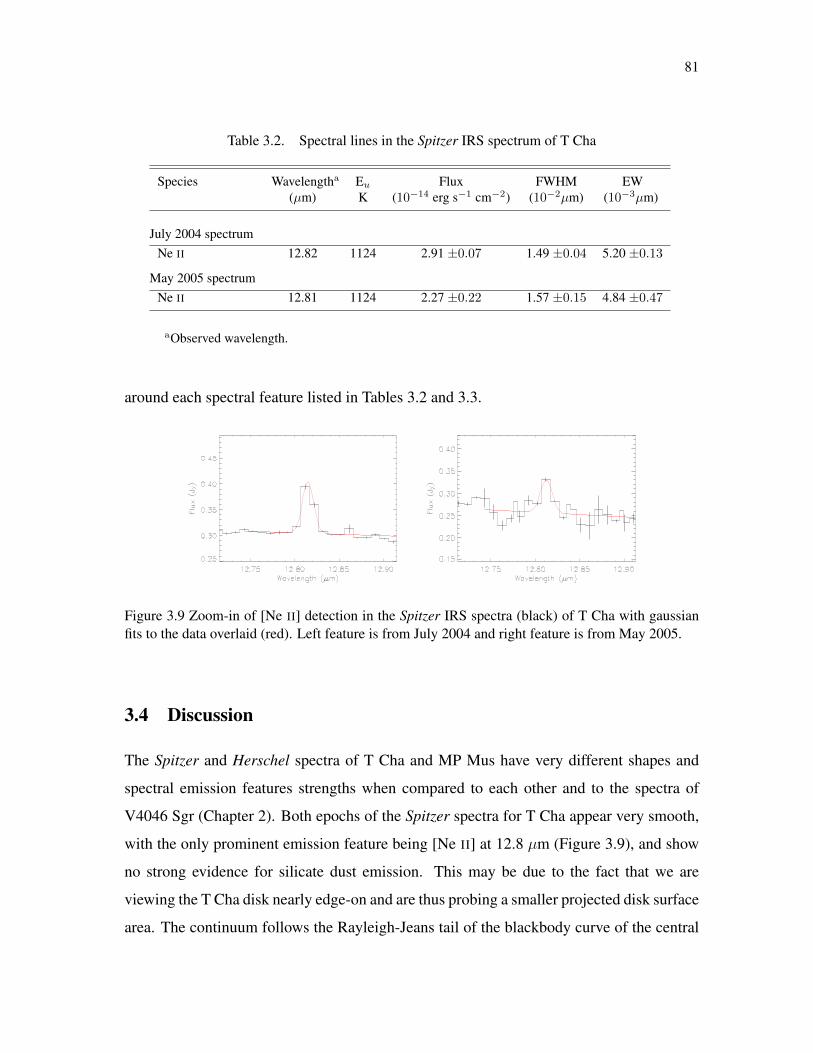
81
Table 3.2. Spectral lines in the Spitzer IRS spectrum of T Cha
Species Wavelengtha Eu Flux FWHM EW(µm) K (10−14 erg s−1 cm−2) (10−2µm) (10−3µm)
July 2004 spectrumNe II 12.82 1124 2.91 ±0.07 1.49 ±0.04 5.20 ±0.13
May 2005 spectrumNe II 12.81 1124 2.27 ±0.22 1.57 ±0.15 4.84 ±0.47
aObserved wavelength.
around each spectral feature listed in Tables 3.2 and 3.3.
Figure 3.9 Zoom-in of [Ne II] detection in the Spitzer IRS spectra (black) of T Cha with gaussianfits to the data overlaid (red). Left feature is from July 2004 and right feature is from May 2005.
3.4 Discussion
The Spitzer and Herschel spectra of T Cha and MP Mus have very different shapes and
spectral emission features strengths when compared to each other and to the spectra of
V4046 Sgr (Chapter 2). Both epochs of the Spitzer spectra for T Cha appear very smooth,
with the only prominent emission feature being [Ne II] at 12.8 µm (Figure 3.9), and show
no strong evidence for silicate dust emission. This may be due to the fact that we are
viewing the T Cha disk nearly edge-on and are thus probing a smaller projected disk surface
area. The continuum follows the Rayleigh-Jeans tail of the blackbody curve of the central
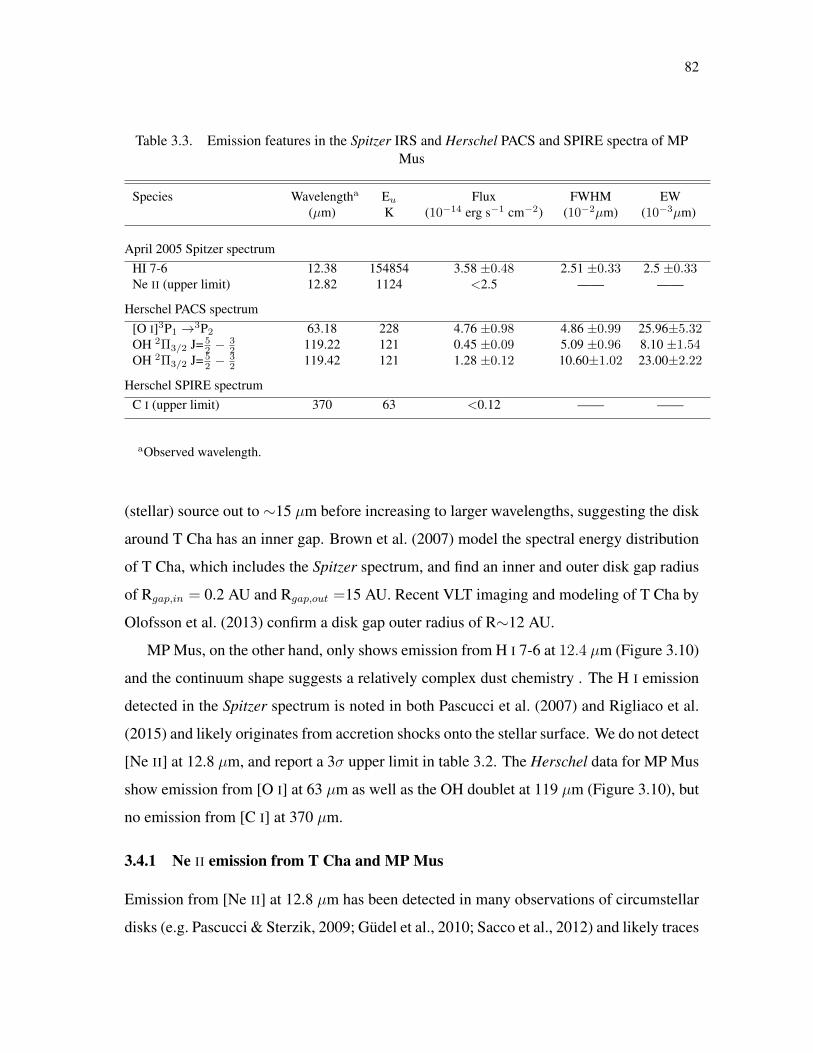
82
Table 3.3. Emission features in the Spitzer IRS and Herschel PACS and SPIRE spectra of MPMus
Species Wavelengtha Eu Flux FWHM EW(µm) K (10−14 erg s−1 cm−2) (10−2µm) (10−3µm)
April 2005 Spitzer spectrumHI 7-6 12.38 154854 3.58 ±0.48 2.51 ±0.33 2.5 ±0.33Ne II (upper limit) 12.82 1124 <2.5 —— ——
Herschel PACS spectrum[O I]3P1 →3P2 63.18 228 4.76 ±0.98 4.86 ±0.99 25.96±5.32OH 2Π3/2 J= 5
2 −32 119.22 121 0.45 ±0.09 5.09 ±0.96 8.10 ±1.54
OH 2Π3/2 J= 52 −
32 119.42 121 1.28 ±0.12 10.60±1.02 23.00±2.22
Herschel SPIRE spectrumC I (upper limit) 370 63 <0.12 —— ——
aObserved wavelength.
(stellar) source out to ∼15 µm before increasing to larger wavelengths, suggesting the disk
around T Cha has an inner gap. Brown et al. (2007) model the spectral energy distribution
of T Cha, which includes the Spitzer spectrum, and find an inner and outer disk gap radius
of Rgap,in = 0.2 AU and Rgap,out =15 AU. Recent VLT imaging and modeling of T Cha by
Olofsson et al. (2013) confirm a disk gap outer radius of R∼12 AU.
MP Mus, on the other hand, only shows emission from H I 7-6 at 12.4 µm (Figure 3.10)
and the continuum shape suggests a relatively complex dust chemistry . The H I emission
detected in the Spitzer spectrum is noted in both Pascucci et al. (2007) and Rigliaco et al.
(2015) and likely originates from accretion shocks onto the stellar surface. We do not detect
[Ne II] at 12.8 µm, and report a 3σ upper limit in table 3.2. The Herschel data for MP Mus
show emission from [O I] at 63 µm as well as the OH doublet at 119 µm (Figure 3.10), but
no emission from [C I] at 370 µm.
3.4.1 Ne II emission from T Cha and MP Mus
Emission from [Ne II] at 12.8 µm has been detected in many observations of circumstellar
disks (e.g. Pascucci & Sterzik, 2009; Gudel et al., 2010; Sacco et al., 2012) and likely traces

83
Figure 3.10 Zoom-in of H I (top left) Spitzer IRS detection (black) and the [O I] (top right) and OHdoublet (bottom) Herschel PACS spectra (black) of MP Mus with gaussian fits to the data overlaid(red).
hot (T∼5000) disk gas that is being photoevaporated by EUV and X-ray radiation incident
on the disk. This emission can come from a static disk atmosphere, a photoevaporative
wind (Alexander, 2008; Ercolano & Owen, 2010; Sacco et al., 2012), or a magnetically
driven outflow (Shang et al., 2010). Observations of [Ne II] emission from T Tauri stars
(e.g. Pascucci & Sterzik, 2009; Sacco et al., 2012) have shown that the [Ne II] emission is
generally blue shifted by ∼1-20 km/s, consistent with the emission coming from a photoe-
vaporative disk wind.
We detect [Ne II] emission from T Cha in both epochs of the Spitzer data, with a flux
of 2.91 ± 0.07 × 10⁻¹⁴ erg s−1 cm−2 in July 2004 and 2.27 ± 0.22 × 10⁻¹⁴ erg s−1 cm−2
in May of 2005. Sacco et al. (2012) also measure the flux of the [Ne II] line in the Spitzer
spectrum from the July 2004 dataset and report a flux of 3.2± 0.21× 10⁻¹⁴ erg s−1 cm−2,
marginally consistent with our value. [Ne II] emission from T Cha was also detected using
the VISIR spectrograph on the the VLT in February 2008 (Pascucci & Sterzik, 2009) and
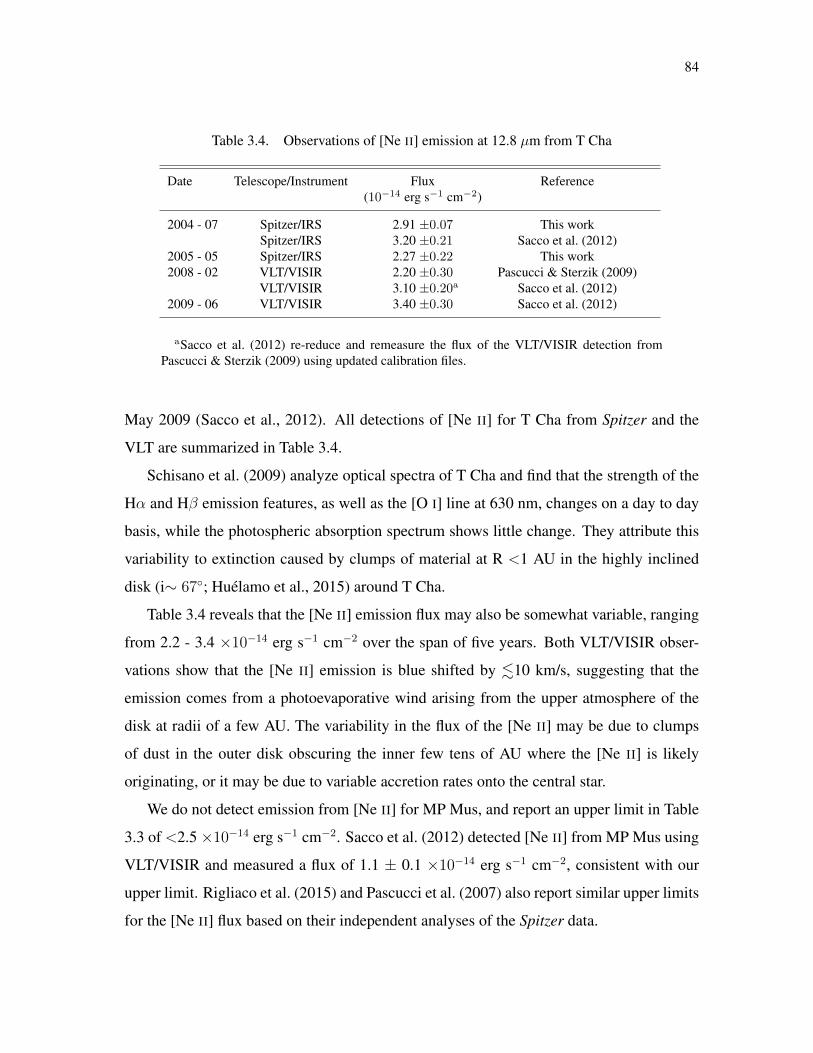
84
Table 3.4. Observations of [Ne II] emission at 12.8 µm from T Cha
Date Telescope/Instrument Flux Reference(10−14 erg s−1 cm−2)
2004 - 07 Spitzer/IRS 2.91 ±0.07 This workSpitzer/IRS 3.20 ±0.21 Sacco et al. (2012)
2005 - 05 Spitzer/IRS 2.27 ±0.22 This work2008 - 02 VLT/VISIR 2.20 ±0.30 Pascucci & Sterzik (2009)
VLT/VISIR 3.10 ±0.20a Sacco et al. (2012)2009 - 06 VLT/VISIR 3.40 ±0.30 Sacco et al. (2012)
aSacco et al. (2012) re-reduce and remeasure the flux of the VLT/VISIR detection fromPascucci & Sterzik (2009) using updated calibration files.
May 2009 (Sacco et al., 2012). All detections of [Ne II] for T Cha from Spitzer and the
VLT are summarized in Table 3.4.
Schisano et al. (2009) analyze optical spectra of T Cha and find that the strength of the
Hα and Hβ emission features, as well as the [O I] line at 630 nm, changes on a day to day
basis, while the photospheric absorption spectrum shows little change. They attribute this
variability to extinction caused by clumps of material at R <1 AU in the highly inclined
disk (i∼ 67; Huelamo et al., 2015) around T Cha.
Table 3.4 reveals that the [Ne II] emission flux may also be somewhat variable, ranging
from 2.2 - 3.4 ×10⁻¹⁴ erg s−1 cm−2 over the span of five years. Both VLT/VISIR obser-
vations show that the [Ne II] emission is blue shifted by .10 km/s, suggesting that the
emission comes from a photoevaporative wind arising from the upper atmosphere of the
disk at radii of a few AU. The variability in the flux of the [Ne II] may be due to clumps
of dust in the outer disk obscuring the inner few tens of AU where the [Ne II] is likely
originating, or it may be due to variable accretion rates onto the central star.
We do not detect emission from [Ne II] for MP Mus, and report an upper limit in Table
3.3 of <2.5 ×10⁻¹⁴ erg s−1 cm−2. Sacco et al. (2012) detected [Ne II] from MP Mus using
VLT/VISIR and measured a flux of 1.1 ± 0.1 ×10⁻¹⁴ erg s−1 cm−2, consistent with our
upper limit. Rigliaco et al. (2015) and Pascucci et al. (2007) also report similar upper limits
for the [Ne II] flux based on their independent analyses of the Spitzer data.

85
Table 3.5. [Ne II] and X-ray luminosity and mass accretion rate for T Cha, MP Mus and V4046Sgr
Source [Ne II] Luminosity X-ray Luminosity Mass Accretion Rate References(1028 erg s−1) (1029 erg s−1) 10−9 M yr−1
T Chaa 3.7 30.0 4.0 Schisano et al. (2009); Gudel (2010)MP Mus <3.6 14.6 1.0 Argiroffi et al. (2009); Curran et al. (2011)V4046 Sgr 5.5 12.0 0.5 Donati et al. (2011); Argiroffi et al. (2012)
a[Ne II] luminosity calculated from the average of the [Ne II] fluxes measured in this chapter.
Table 3.5 lists the luminosity of [Ne II] for T Cha, MP Mus, and V4046 Sgr (D=73 pc;
Torres et al., 2008), along with their X-ray luminosities and mass accretion rates. Compared
to T Cha and MP Mus, the luminosity of the [Ne II] emission feature from V4046 Sgr
is roughly 1.5 times greater. Irradiated disk models predict that there should be a direct
correlation between the luminosity of [Ne II] and X-ray luminosity and the corresponding
mass accretion rate (e.g., Meijerink et al., 2008; Ercolano & Owen, 2010). Gudel et al.
(2010) study 92 pre-main sequence stars and find positive correlation between [Ne II] and
X-ray luminosity. Sacco et al. (2012) study 32 pre-main sequence stars and find a rough
positive correlation in these quantities, but with a larger scatter. A rough positive correlation
between [Ne II] luminosity and mass accretion rate is only seen if sources with and without
protostellar jets are included in the same sample. Schisano et al. (2010) suggest that the [Ne
II] luminosity is strongly dependent on disk properties such as inclination, flaring and the
presence of jets, and must be accounted for when searching for correlations. There appears
to be no direct correlation between our observed line luminosities for MP Mus, T Cha and
V4046 Sgr and either X-ray luminosity or mass accretion rate. This could be due to the
fact that T Cha has a much higher inclination than V4046 Sgr and MP Mus, and that the
disks have very different radii, inner disk hole sizes, and dust compositions (see Chapter
1 and Section 3.4.3 below). In addition, T Cha evidently has a variable [Ne II] flux. Such
variability would complicate attempts to determine correlations between [Ne II] luminosity
and other system parameters.
86
3.4.2 Emission Features in Herschel Spectra of MP Mus
The Herschel PACS spectra for MP Mus show emission from [O I] at 63 µm and one
OH doublet at 119.25 and 119.43 µm (Table 3.3 and Figure 3.10). [O I] has been de-
tected around many T Tauri and Herbig Ae/Be stars (e.g., Mathews et al., 2010; Riviere-
Marichalar et al., 2012a,b; Fedele et al., 2013; Howard et al., 2013) and likely arises from
UV radiation photodissociating CO molecules in the disk. [O I] at 63µm has also been de-
tected around the nearby, well-studied young star TW Hya (Thi et al., 2010), T Cha (Keane
et al., 2014), and V4046 Sgr (Chapter 2). Table 3.6 summarizes the flux and luminosity of
the [O I] emission feature from each source, assuming a distance of 110pc for MP Mus and
T Cha (Murphy et al., 2013), 73 pc for V4046 Sgr (Torres et al., 2008), and 56 pc for TW
Hya (Wichmann et al., 1998). TW Hya, V4046 Sgr and MP Mus all show no detectable
emission from [O I] at 145µm, or [C I] at 370 µm. Only Herschel/PACS line scan data near
63 µm is available for T Cha, so it is unknown if emission from [O I] at 145µm or [C I] is
present.
The Gas Survey of Protoplanetary Systems (GASPS; Mathews et al., 2010) searched for
emission features in ∼250 T Tauri and Herbig Ae/Be stars with Herschel. They detected
[O I] at 63 µm around 43% of the T Tauri systems, and 100% of the Herbig Ae/Be stars
(Dent et al., 2013). All of the T Tauri stars with [O I] detections were . 4 Myr old, except
for ∼16 systems that are ∼ 5-20 Myr old, suggesting that more evolved systems are less
likely to show [O I] emission. Dent et al. (2013) also find that most systems that show
[O I] emission have a disk dust mass of &10−5 M. Based on the results of the Dent
et al. (2013) study, and the estimated ages of MP Mus, V4046 Sgr and TW Hya, these three
sources should not show strong emission from [O I]. However, previous studies have shown
(see Chapter 1) that the disk gas and dust masses for these three systems are unusually high
for star-disk systems in the 5-20 Myr age range. Thus, the [O I] emission we observe
from these sources is likely coming from UV photodissociated CO at radii larger than their
projected inner gaps, where large amounts of dust and gas are still present.
Keane et al. (2014) also utilize Herschel PACS to search for [O I] emission at 63 µm in

87
disks around young stars, specifically targeting transitional disks. They detect [O I] emis-
sion from 17 out of 21 transitional disks, and combine their results with a small subsample
of transitional disk, non-transitional disk, and outflow sources studied by Dent et al. (2013)
to search for correlations between the strength of the 63 µm [O I] emission and various
stellar properties. Keane et al. (2014) find that the luminosity of [O I] is correlated with
effective temperature and mass accretion rate for all sources combined. They find no cor-
relation between the luminosity of [O I] and X-ray luminosity, or gap size for transitional
disks. Figure 3.11 compares the luminosity of [O I] and these four properties for all sources
from Keane et al. (2014), plus the four transitional disks of interest here (MP Mus, T Cha,
V4046 Sgr, and TW Hya). We find that our four transitional disk sources coincide with the
trends (or lack thereof) found by Keane et al. (2014)
Figure 3.11 Luminosity of the [O I] emission at 63 µm compared to X-ray luminosity (top left),mass accretion rate (top right), effective temperature (bottom left), and disk gap size (bottom right)for transitional disk (blue), non-transitional disks (red) and outflow sources (black) from Keane et al.(2014). Data for MP Mus, T Cha, V4046 Sgr, and TW Hya are shown as green asterisks.

88
Table 3.6. Observations of [O I] emission at 63 µm from nearby young stars
Source Flux Luminosity Reference(10−14 erg s−1 cm−2) (1028 erg s−1)
MP Mus 4.76 ±0.98 6.87 This ChapterT Cha 5.45 ±0.29 7.86 Keane et al. (2014)V4046 Sgr 1.71 ±0.43 1.08 Chapter 2TW Hya 3.65 ±1.21 1.36 Thi et al. (2010)
OH and H2O emission has been detected in disks around many young stars (Wampfler
et al., 2010; Hogerheijde et al., 2011; Fedele et al., 2012; Riviere-Marichalar et al., 2012a,b;
Fedele et al., 2013; Howard et al., 2013; Wampfler et al., 2013), including V4046 Sgr
(Chapter 2). The only clear detection we find for these species in the MP Mus Her-
schel/PACS spectra is that from the collisionally exited OH 2Π3/2 doublet at 119.25 and
119.43 µm (Table 3.3 and Figure 3.10). The presence of collisionally excited OH and lack
of radiatively excited OH support the notion that OH emission from older disks, like V4046
Sgr and MP Mus, is likely dominated by collisional excitation (see Chapter 2).
3.4.3 Dust
T Cha Modeling Results
Table 3.1 and Figure 3.12 show the dust modeling results for the T Cha spectra from July
2004 and May 2005. From Table 3.1, we see that the best fit models result in the exact same
cool and warm dust temperatures, but the dust composition differs slightly between the two.
We find that the May 2005 spectra suggest a larger amount of cool small amorphous olivine,
and no large amorphous pyroxene, whereas the July 2004 spectra showed an approximate
even split between the two. We also find that the amount of warm crystalline silicates is
∼10% higher for the May 2005 spectra.
To see if there are any distinct differences between the shapes of the spectra, and thus,
explain the differences in the model results, we plot the two dust models for the T Cha
spectra in Figure 3.12. In general, the shapes of the spectra are very similar, with slight
differences between 20-25 µm and past 30 µm. To account for the shape and higher flux of

89
Figure 3.12 Dust model fits to the Spitzer IRS spectra of T Cha from July 2004 (black) and May2005 (blue).
the spectra in these regions for the July 2004 spectra, the models suggest a combination of
cool small amorphous olivine and cool large amorphous pyroxene, whereas the shape and
flux of the May 2005 spectra in these regions can be modeled with only small amorphous
olivine grains. The May 2005 spectra also exhibits a slightly larger bump upwards at ∼16
µm which accounts for the higher percent by mass of warm silicate grains and the higher
warm crystallinity fraction.
As mentioned in Section 3.3.1, the May 2005 data have been corrected for excess dark

90
current beyond ∼20 µm, and this correction may have induced the slight differences in
spectral shape and resulting dust composition via modeling. It is also possible that the
composition of the dust changed in the year between data acquisition and the May 2005
spectra are exhibiting real features. Since the dust modeling of the July 2004 spectra has
lower associated error due to not having to correct for excess dark current, we will discuss
only this spectrum in the comparisons below.
Comparison of Dust components
Figure 3.13 Comparison of the shapes of the MP Mus (blue), V4046 Sgr (red) low resolution andJuly 2004 T Cha (black) high resolution Spitzer spectra.
Figure 3.13 compares the Spitzer low resolution spectra of MP Mus and V4046 Sgr and
the high resolution spectra of T Cha from July 2004. Figure 3.13. We immediately see that
the continuum shape of these three spectra are very different, and thus the resulting model
dust components are likely to be unique for each source.
91
Dust modeling of the Spitzer spectra of MP Mus and T Cha reveal that the two disks
have very different dust compositions (see Table 3.1). The MP Mus disk contains only
small (∼ µm-sized) dust grains (77% by mass), which are amorphous pyroxene or olivine
grains at temperatures of ∼130 and 360 K. The crystalline silicate dust grain fraction is
also quite large; 23% for cool crystalline grains and 30% for warm crystalline grains. The
T Cha disk, on the other hand, is composed of an almost equal mixture of large and small
pyroxene and olivine grains at temperatures of 75 and 595 K, and has a cool and warm
crystallinity mass fraction of 5 and 14%, respectively. Both of these results contest sharply
with V4046 Sgr, whose disk is composed of only large silicate grains (86% by mass) at
temperatures of ∼120 and 350 K, and has a cool and warm crystallinity mass fraction of
14 and 3%, respectively.
According to our models, the dust disk around MP Mus is dominated by small grains,
whereas the T Cha dust disk is more evenly distributed between small and large grains, and
V4046 Sgr is dominated by large dust grains. This suggests that grain growth is efficient in
both the V4046 Sgr and T Cha disks, and is less efficient in the MP Mus disk. Interestingly,
the size of the dust grains in these disks may be related to the size of the inner disk hole, and
thus the evolutionary state of the disk. Specifically, V4046 Sgr has the largest inner hole at
submm wavelengths (R∼29 AU; Rosenfeld et al., 2013) and the highest percentage of large
dust grains, whereas MP Mus likely has the smallest inner hole (R<15 AU; Grafe & Wolf,
2013) and no large dust grains. However, the T Cha spectra are not background subtracted,
and therefore may be contaminated with small cold dust signatures from the surrounding
interstellar medium. Thus, the small dust grain percentage should be considered as an
upper limit.
T Cha is known to have an inner gap out to a radius of R∼12 AU, with a thin disk of
material very close to the central star (R.0.11; Olofsson et al., 2013). Our Spitzer models
reveal that most of the emitting dust is cold (75 K), but a tiny fraction (0.02%) is warm (595
K). This warm dust is likely located within the inner R.0.11 AU ring of material around
the central star.

92
Crystallinity fraction for T Cha and MP Mus
Studying the fraction of crystalline silicates in circumstellar disks is important for under-
standing both planet formation and evolution in disks, as well as the origin of our own
solar system. Many studies of comets have been conducted (e.g., Wooden, 2008; Kelley &
Wooden, 2009; Hanner & Zolensky, 2010) which link the silicate dust in cometary material
to that in protoplanetary disks. These studies have begun to shed light on the chemistry of
the proto-solar nebula and how small dust grains grew into the planets we see today.
Studies of T Tauri stars in the Taurus/Auriga and TW Hydrae associations (Sargent
et al., 2006, 2009a) have found that transitional disk systems tend to have a modest large
silicate grain fraction (.35%) and low (few-percent) crystallinity fractions, while less
evolved protoplanetary disks have a median mass fraction for warm and cool crystalline
silicate dust of 11% and 15%, respectively. T Cha seems to fit in with other evolved tran-
sition disk systems, having a ∼42% large silicate grain fraction and 14 and 5% warm and
cool crystallinity fraction. On the other hand, MP Mus has much larger mass fractions of
crystalline silicates and no evidence for large silicate dust grains. There are examples of
known transitional disks that exhibit large crystallinity fractions (Espaillat et al., 2007a;
Kim et al., 2009), so the fact that MP Mus has large crystallinity fractions does not rule out
the possibility of it having an inner disk gap.
A variety of possible mechanisms for the formation of crystalline silicates in disks
have been proposed, with the two main possible methods being thermal annealing and gas
condensation (see Henning, 2010, and references therein for a review). At sufficiently high
temperatures, amorphous silicate dust can be thermally annealed into crystalline silicates.
Dust near the central stars in circumstellar disks can heat up to these high temperatures
and quickly rearrange their molecular structure into a crystalline lattice. Jager et al. (2003)
and Gail (1998) have shown that the presence of H2O and OH can lower the activation
energy and thus the temperature needed to thermally anneal silicate dust grains, making
this a favorable process in circumstellar disks. It is also possible for silicate dust grains
to vaporize and condense back down into crystalline form. Both of these processes are
most efficient at high temperatures near the central star, so silicate dust is likely formed in

93
the inner disk and transported outward via turbulent motions and radial mixing (e.g. Gail,
2004; Boss, 2004).
The abundance of cool grains and lack of emission features, aside from [Ne II], suggest
that the Spitzer spectrum of T Cha may be probing the gas and dust near the R∼12 AU
outer wall of the disk gap. It is also possible that, due to the high inclination of the disk,
the Spitzer spectra are less sensitive to the surface layers of the outer disk, and are hence
dominated by dust in the warm mid-plane of the inner disk. Modeling of the similarly
inclined T Tauri star V410 Anon 13 (i ∼ 72; Furlan et al., 2005), for example, has shown
that decreasing the disk inclination by∼10 can increase the amount of crystalline silicates
detected in the Spitzer spectrum by up to 20%. Thus, the viewing geometry of the disk
around T Cha is likely having a strong effect on our dust modeling results and the fraction
of crystalline silicates in the disk around T Cha may be higher than what we have inferred.
However, the current results are as expected for most transitional disks.
Modeling of dust in the MP Mus disk reveals a high crystallinity fraction (23 - 30%),
most of which is in the form of crystalline forsterite, and only small silicate dust grains.
Sargent et al. (2009a) studied 65 T Tauri stars in the Taurus/Auriga star forming region and
found many trends related to disk dust crystallinity and dust grain size. They found that the
presence of large dust grains is correlated with a higher crystallinity fraction, suggesting
that disks with these properties are more evolved. They also found that the amount of cool
forsterite correlated with flatter submm SEDs and thus efficient grain growth to mm-sized
dust. MP Mus appears to defy both of these trends. The Spitzer spectrum of MP Mus
shows high crystallinity and large amount of cool crystalline forsterite, but no evidence for
significant dust grain growth. Minimal data exist at submm wavelengths for MP Mus due
to its low declination (69 S), so a long wavelength SED is not available, but the infrared
data do not reveal a significant inner hole in the disk and, thus, there is no evidence as of
yet of disk evolution and grain growth up to mm-sized particles.
A possible scenario for the high forsterite content and crystallinity in a system as old as
is thermal annealing of dust grains from stellar outbursts. Abraham et al. (2009) imaged the

94
young, low mass, eruptive star EX Lupi with Spizer/IRS before and after it went into out-
burst in 2005 and 2008, respectively. Comparing the spectra, they found that pre-outburst
EX Lupi showed features from only amorphous dust grains, whereas post-outburst the
spectrum showed new strong signatures of warm crystalline forsterite. MP Mus is a known
accreting (Pascucci et al., 2007; Curran et al., 2011) and variable star (Batalha et al., 1998),
and HST imaging by Schneider et al. (2014) recently showed spatially localized disk sur-
face brightness fluctuations suggesting time variable illumination of the disk on the order
of months. It is possible that the stellar variability and disk illumination changes are due to
accretion hotspots on the central star that trigger an outburst which shock heat dust grains
on the surface of the MP Mus disk. As was the case for EX Lupi, these outbursts could
result in large amounts of thermally annealed crystalline forsterite in the MP Mus disk.
However, modeling by Abraham et al. (2009) showed that the crystalline forsterite grains
in EX Lupi were at temperatures hot enough for thermal annealing to occur (T&700 K),
whereas MP Mus shows only low temperature (T∼128 K) grains.
It’s possible that stellar outbursts occurred sometime in the past, creating the crystalline
forsterite which has subsequently cooled over time. Yet, this creation of crystalline silicates
due to stellar outbursts only increases the crystallinity for short periods of time and is
inconsistent with MP Mus having a large crystallinity fraction of mostly cool dust grains.
3.5 Conclusions
The Spitzer and Herschel spectra of T Cha and MP Mus offer a wealth of information
about the chemistry and structure of the protoplanetary disks surrounding these stars. We
found that both sources lacked emission features at mid-infrared wavelengths as compared
to TW Hya and V4046 Sgr. T Cha only shows emission from [Ne II] at 12.8 µm at both
observation epochs, tracing a photoevaporative wind from the central star. Combining
detections of [Ne II] from Spitzer and the VLT over a 5 year time-span, we find evidence
that the emission line luminosity varies only slightly, perhaps due to variable accretion or
dust clumps in the disk passing into the line of sight. MP Mus shows emission from H I
7-6, likely from accretion shocks onto the central star, and no strong emission from [Ne II].

95
The Herschel spectrum of MP Mus revealed emission from [O I] at 63 µm as well as
collisionally excited OH 2Π3/2 at 119 µm. MP Mus therefore joins the ranks of T Cha, TW
Hya and V4046 Sgr, all of which display emission from [O I] that likely originates from
UV photodissociation of CO in the gas reservoirs of these disks.
The disks around T Cha, MP Mus and V4046 Sgr display a wide variety of dust com-
positions. T Cha has a low crystallinity fraction and a combination of large and small dust
grains, similar to other previously observed evolved disks. The low crystallinity may be
due to the lack of crystalline grains in the inner R∼12 AU gap, or our view of the crys-
talline dust may be inhibited by T Cha’s high inclination. MP Mus has a high crystallinity
fraction, but small, cool dust grains dominate in its disk. These results appear to contradict
each other, as high crystallinity is is usually a sign of an evolving disk, which we expect to
contain a significant fraction of large grains.
Spitzer and Herschel data of T Cha and MP Mus add to our dataset of unique, nearby,
young circumstellar disks that are particularly massive for their age. More data is needed at
infrared to submm wavelengths to further study these disks. High resolution, near-infrared
imaging from instruments such as the Gemini Planet Imager on Gemini South or SPHERE
on the VLT is needed to directly observe the inner regions of these disks to look for evidence
of disk evolution and planet formation, such as grain size segregation. Observations, espe-
cially of MP Mus, with ALMA will allow us to further study the chemistry and structure
of the outer disk. By combining all these datasets, we will have more complete pictures of
these systems that we can use to better understand planet formation in circumstellar disks,
as well as the early history of our own solar system.
Acknowledgements
This research work is based in part on observations made with Herschel, a European Space
Agency Cornerstone Mission with significant participation by NASA. This work is based
in part on observations made with the Spitzer Space Telescope, which is operated by the
Jet Propulsion Laboratory, California Institute of Technology under a contract with NASA.

96
Chapter 4
Near-infrared Scattered Light Imaging of V4046Sgr with the Gemini Planet Imager
Portions of this chapter are published in Rapson et al. (2015).

Abstract
We report the presence of scattered light from dust grains located in the giant planet for-
mation region of the circumbinary disk orbiting the ∼20-Myr-old close (∼0.045 AU sep-
aration) binary system V4046 Sgr AB based on observations with the new Gemini Planet
Imager (GPI) instrument. These GPI images probe to within ∼7 AU of the central binary
with linear spatial resolution of ∼3 AU, and are thereby capable of revealing dust disk
structure within a region corresponding to the giant planets in our solar system. The GPI
imaging reveals a relatively narrow (FWHM ∼10 AU) ring of polarized near-infrared flux
whose brightness peaks at ∼14 AU. This ∼14 AU radius ring is surrounded by a fainter
outer halo of scattered light extending to ∼45 AU, which coincides with previously de-
tected mm-wave thermal dust emission. The presence of small grains that efficiently scatter
starlight well inside the mm-wavelength disk cavity supports current models of planet for-
mation that suggest planet-disk interactions can generate pressure traps that impose strong
radial variations in the particle size distribution throughout the disk.

98
4.1 Introduction
According to the core accretion model of gas giant planet formation, such planets are
formed in circumstellar disks via agglomeration of dust particles into a planetary core, fol-
lowed by accretion of disk dust and gas (e.g. Kley & Nelson, 2012; Helled et al., 2014, and
references therein). Disk material co-orbiting with a sufficiently massive planet is trans-
ported outward via deposition of angular momentum onto the disk, thus opening a large
gap (e.g., Bryden et al., 1999; Dong et al., 2014). Density waves from planet-disk interac-
tions generate pressure maxima in the disk that manifest themselves as ring-like or spiral
disk structures characterized by sharp radial gradients in both surface density and particle
size (Pinilla et al., 2012). Such dust ring structures have been observed around nearby,
young (age <10 Myr), low-mass stars in optical and near-infrared scattered light images
and sub-mm thermal emission (Hughes et al., 2007; Andrews et al., 2009; Isella et al., 2010;
Andrews et al., 2011; Garufi et al., 2013). These same systems show depletions of cm- and
mm-sized dust grains within the central regions of their disks. Such central disk “holes”
have been interpreted as evidence of formation of giant planets with orbital semimajor axes
of . 30 AU, i.e., well interior to the sub-mm bright rings (Pinilla et al., 2012; Zhu et al.,
2012; Garufi et al., 2013; Owen, 2014; Zhu et al., 2014).
Thanks to its proximity (D∼73 pc; Torres et al., 2008) and advanced age (∼23 Myr;
Mamajek & Bell, 2014), the circumbinary disk orbiting the close (2.4 day period) binary
system V4046 Sgr AB represents an excellent subject for the study of such late-stage
planet-building processes. The V4046 Sgr AB system consists of two nearly equal mass
components (0.9 and 0.85 M; Rosenfeld et al., 2012a) with spectral types K5Ve and K7Ve
(Stempels & Gahm, 2004) separated by only∼9 R (0.045 AU). Since the recognition that
V4046 Sgr AB possesses a large circumbinary dust mass (Jensen & Mathieu, 1997) and is
orbited by (and actively accreting from) a gaseous disk (Stempels & Gahm, 2004; Gunther
et al., 2006; Kastner et al., 2008), this system has been extensively studied from X-ray
to sub-mm wavelengths (Rodriguez et al., 2010; Donati et al., 2011; Oberg et al., 2011;
Argiroffi et al., 2012; Rosenfeld et al., 2012a, 2013; Kastner et al., 2014a). Radio inter-
ferometric imaging of the V4046 Sgr disk in CO emission reveals that the circumbinary

99
molecular disk is inclined at 33.5 (Rodriguez et al., 2010; Rosenfeld et al., 2012a) and
extends to ∼350 AU (Rodriguez et al., 2010), with an estimated total gas+dust mass of
∼0.1 M (Rosenfeld et al., 2013). Such a large and massive disk is unexpected, given
that the V4046 Sgr system is a factor ∼10 older than the vast majority of known, actively
accreting stars with circumstellar disks (e.g., Ingleby et al., 2014). The V4046 Sgr disk
also displays more compact, distinctly ring-like mm continuum emission, suggesting a de-
pletion of mm-sized dust interior to ∼29 AU due to dust particle growth and particle size
segregation associated with recent or ongoing planet formation (Rosenfeld et al., 2013).
Polarimetric near-infrared imaging of light scattered off dust particles is useful for deter-
mining the radial and azimuthal distribution of micron-sized dust within the planet forming
regions of circumstellar disks (e.g. Hashimoto et al., 2011; Avenhaus et al., 2014a). These
observations serve as a powerful complement to mm-wave interferometric imaging in es-
tablishing radial gradients in dust particle size (e.g. Dong et al., 2012). Here, we present
coronagraphic/polarimetric images of the circumbinary disk around V4046 Sgr obtained
with the Gemini Planet Imager (GPI; Macintosh et al., 2008, 2014) on Gemini South.
These images probe closer to the central star(s) than previously achieved for a gas-rich,
protoplanetary disk (R∼7 AU) with unprecedented linear spatial resolution of ∼3 AU, and
are thereby capable of revealing the dust disk structure within a region corresponding to
the giant planets in our solar system.
4.2 GPI Integral Field Polarimetry Data reduction
GPI is a brand new and instrument on Gemini South, and thus the data reduction pipeline
and techniques are a work in progress. Here, we discuss the process in which integral
field polarimetry science data and calibration files are reduced in v1.2.1 of the GPI pipeline
(see Perrin et al., 2014, 2015, for a more detailed discussion of the pipeline). Calibration
and science frames obtained for V4046 Sgr (see section 4.3) are used as examples. The
pipeline contains various “primitives” that can be combined into one large “recipe” to create
calibration files and/or reduce science frames. The pipeline comes pre-packaged with the
basic recipes needed for reduction of polarimetric data, but allows the user to alter the
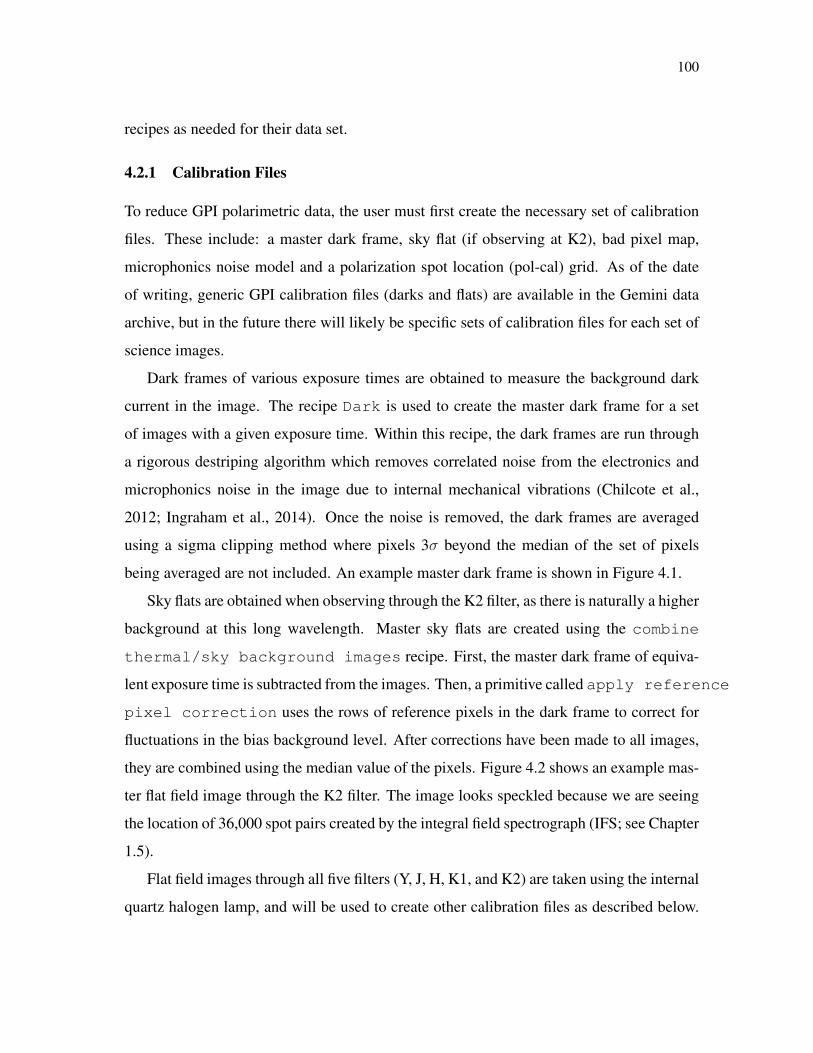
100
recipes as needed for their data set.
4.2.1 Calibration Files
To reduce GPI polarimetric data, the user must first create the necessary set of calibration
files. These include: a master dark frame, sky flat (if observing at K2), bad pixel map,
microphonics noise model and a polarization spot location (pol-cal) grid. As of the date
of writing, generic GPI calibration files (darks and flats) are available in the Gemini data
archive, but in the future there will likely be specific sets of calibration files for each set of
science images.
Dark frames of various exposure times are obtained to measure the background dark
current in the image. The recipe Dark is used to create the master dark frame for a set
of images with a given exposure time. Within this recipe, the dark frames are run through
a rigorous destriping algorithm which removes correlated noise from the electronics and
microphonics noise in the image due to internal mechanical vibrations (Chilcote et al.,
2012; Ingraham et al., 2014). Once the noise is removed, the dark frames are averaged
using a sigma clipping method where pixels 3σ beyond the median of the set of pixels
being averaged are not included. An example master dark frame is shown in Figure 4.1.
Sky flats are obtained when observing through the K2 filter, as there is naturally a higher
background at this long wavelength. Master sky flats are created using the combine
thermal/sky background images recipe. First, the master dark frame of equiva-
lent exposure time is subtracted from the images. Then, a primitive called apply reference
pixel correction uses the rows of reference pixels in the dark frame to correct for
fluctuations in the bias background level. After corrections have been made to all images,
they are combined using the median value of the pixels. Figure 4.2 shows an example mas-
ter flat field image through the K2 filter. The image looks speckled because we are seeing
the location of 36,000 spot pairs created by the integral field spectrograph (IFS; see Chapter
1.5).
Flat field images through all five filters (Y, J, H, K1, and K2) are taken using the internal
quartz halogen lamp, and will be used to create other calibration files as described below.

101
Figure 4.1 Example master dark frame with an exposure time of 60 s. Some vertical striping is stillvisible even after the images have been processed with the destriping primitive.
As of the date of writing, the GPI pipeline does not allow for accurate division of flat field
images when reducing polarized data, so we do not discuss creating master flat field frames
at other wavelengths here.
A bad pixel map is created by first constructing and combining a hot and cold bad
pixel map. A hot pixel map is created from dark images using the recipe generate hot
bad pixel map from darks. Dark images of exposure time &60 s are read into the
pipeline, destriped, and individually checked for bad pixels. A good pixel is defined as
registering > 1 e−/second with a greater that 5σ confidence above the estimated read noise
in the frames. The number of e−/second criteria can be changed by the user, and any pixel
that does not meet the set criteria is marked as a bad pixel.
A cold bad pixel map is constructed from calibration flat frames taken through all filters
(Y-K2) in spectroscopic mode using the recipe generate cold bad pixel map
from darks. These flat frames are reference pixel corrected (as described above for
sky flats), and master darks of equivalent exposure time are subtracted. Since the flats are

102
Figure 4.2 Example master sky flat taken through the K2 filter. The small dot pattern across theimage represents the 36,000 spot pairs created by the IFS.
taken in spectroscopic mode, and each filter only covers a portion of the spectrum, the only
way to get an image where all pixels are illuminated is to combine all flat field images from
all filters. This combined image is then checked for non-responsive or anomalously low
pixel values, and those pixels are marked as bad.
The recipe combine bad pixel maps is used to combine the hot and cold pixel
maps into one master bad pixel map. An example bad pixel map is shown in Figure 4.3.
Future versions of the pipeline expect to have recipes to create nonlinear bad pixel maps as
well, but these are currently not included in the master bad pixel map.
Internal microphonics noise exists in all images and comes from internal vibrations of
the IFS cyrocooler (Figure 4.4). This noise can be modeled and removed from the images
during processing. The primitive create microphonics noise model analyzes
dark frames by computing the absolute value of the Fourier coefficients around the three
known microphonics peaks in the images. The computed Fourier transforms are then added
together to create a model of the noise which will be used to remove the noise in science

103
Figure 4.3 Example bad pixel map created from individual hot and cold pixel maps. White pixelsin the image are marked as bad pixels. During data reduction, the corresponding bad pixels in thescience frame are replaced with the average value of the eight surrounding pixels.
images.
The final calibration frame that needs to be created is the pol-cal grid. This grid maps
the location of the pairs of orthogonal polarization spots in the science image (see Chapter
1.5) so that they can be extracted during processing of a science frame to form an image.
To create this grid, the recipe calibrate polarization spot locations takes
flat field images in a given filter and subtracts the master dark of corresponding exposure
time, interpolates over bad pixels using the bad pixel map, and combines the images via
averaging. To find the location of spot pairs, the primitive measure polarization
spot calibration scans the image for regions of elevated flux, and pairs the nearest
peaks together. This should result in a smooth grid of paired spots (Figure 4.5). If orthogo-
nal states are not properly paired up, or the measured location of peak flux and the apparent
location of peak flux in the pairs do not match, then the image that results from the science
frame data reduction will not be accurate.

104
Figure 4.4 Example of a dark image with the location of the highest amount of microphonics noisecircled in yellow
4.2.2 Science Frames
Once all of the above calibration files are created, the user can reduce the science frames.
Figure 4.6 shows a schematic of the data reduction process for GPI polarimetric science
data (Perrin et al., 2015).
First, the user loads in all science frames for a given filter into the pipeline. This in-
cludes images taken at different waveplate angles, as they will be combined in the end to
produce the Stokes I, Q and U images. The recipe basic polarization sequence
(from raw data) is used to reduce the raw data and the pipeline will automatically
select the appropriate calibration frames to use in each step of the data reduction. This
recipe reduces the data in the following order:
1. The primitive load polarimetry spot calibration loads the pol-cal cal-
ibration file into memory so that the pipeline can extract the data from the spot pairs
on the raw images in a later step.

105
Figure 4.5 Left: Raw science image with the pol-cal grid overlaid. Note that the grid appears smoothacross the entire image. Right: Zoomed-in portion of the image to show that the grid is connectingpairs of orthogonal spots. A few bright white (hot) pixels and black (cold) pixels are still visible inthe image, possibly due to cosmic rays or bad pixels not marked as such in the bad pixel map.
2. Subtract Dark Background uses the master dark calibration files of the same
exposure time as the science images to subtract the dark current from the raw images.
If no master dark file exists with the same exposure time as the science image, then
the pipeline will linearly scale the closest matching dark frame so that the exposure
times would be equivalent.
3. The next step involves correcting for flexure, or shifting/bending of the detector. De-
tector flexure can be cause by changes in temperature during the night of observations,
as well as by gravity since the detector is at different orientations as the telescopes
rotates and moves across the sky. Flexure causes the spot pairs produced by the IFS
to land in slightly different places on the detector than the pol-cal grid measured
using the flat field images (usually less than 1 pixel difference). This needs to be
corrected otherwise the resulting images will have lost a great deal of flux from im-
proper extraction of the flux from the spot pairs. The primitive flexure 2D x
correlation with pol-cal uses the known PSF of the detector and the pol-
cal calibration file to generate a model detector image which it then cross-correlates
with the science image to find the location of the spot pairs on the science image. The

106
Figure 4.6 Schematic of the data reduction process for GPI polarimetric data. Figure reproducedfrom Perrin et al. (2015).
primitive shifts the pol-cal grid until it finds the best possible match to the science
image, and uses this shift to extract the data later in the recipe.
4. Next, the image is destriped via destripe science image to remove corre-
lated background noise and photonics noise in the science images.
5. The master bad pixel map is then used to locate the position of bad pixels in the
science image. The pipeline interpolates over each bad pixel by replacing it with the
average of the surrounding 8 pixel values.
6. At this point, the two dimensional science images have been cleaned as best as possi-
ble using the pre-made calibration files. Now, cleaned images are combined together
into a polarization datacube, wherein the orthogonal polarization states are extracted
from the science images, based on the flexure-corrected pol-cal grid, using a simple
107
5x5 pixel box to extract the flux at each point. The result, created with the primitive
assemble polarization cube, is a pair of images for each science image,
representing the orthogonal polarization states. One more check for bad pixels in the
new data cubes is conducted, and any remaining hot or cold pixels are interpolated
over using an average of the surrounding 8 pixels.
7. Now that we have sets of actual images of the occulted star, the pipeline determines
the location of the occulted star via the primitive measure star position
for polarimetry. To do this, the primitive measures the location of the four
satellite spots on the image (Figure 4.7), which are replicas of the occulted star formed
from a grid that is imprinted on the pupil plane mask (Wang et al., 2014). In polar-
ization mode, the satellite spots are elongated, and a Radon transform is used to
determine the location of the central star(s) behind the coronagraph (see Pueyo et al.,
2015, for details on this technique). This technique allows for the determination of
the star’s location with an accuracy of ∼0.2 pixels, or ∼3 milliarcseconds, as long as
the star is sufficiently bright to create these satellite spots. For dim sources, the user
can enter an initial guess for the location of the star in the image which assists the
primitive in locating the satellite spots, and thus the star’s location. This was the case
for our observations of V4046 Sgr at K2 (see section 4.3 below).
8. Once the star’s location has been calculated, the images are run through the clean
polarization pairs via double differencing primitive. Since GPI
swapped the polarization signal between two different channels, resulting in orthog-
onally polarized images, a double differencing technique can be used to remove bias
between the two channels (see Perrin et al., 2015, appendix B.2).
9. Using rotate north up, the cleaned orthogonal images are all rotated about the
determined location of the star so that north is up and east is left. The images are also
registered and stacked such that the central star is located on the central pixel of the
newly stacked image.
10. The final primitive necessary to reduce the science frames is combine polarization

108
sequence. This primitive uses a least squares method (see Perrin et al., 2015, ap-
pendix B.1) to combine the images taken at four different waveplate angles and pro-
duce a Stokes data cube with slices I, Q, U and V. Stokes I is just the total intensity
image of the occulted source, Stokes Q and U are polarized intensity rotated by 45,
and Stokes V is circular polarization of the occulted source. GPI is only weakly
sensitive to circular polarization, so the resulting Stokes V image contains mostly
noise and is not a useful data product. From this Stokes cube, the polarized inten-
sity (P = (Q2 + U2)1/2), and polarization fraction (p=P/I) can be calculated. Note
that the Stokes I image is contaminated by the PSF so the true polarization fraction
of the image is difficult to obtain. Angular differential imaging techniques such as
LOCI (Lafreniere et al., 2007) or KLIP (Soummer et al., 2012) can be used to re-
construct and subtract the PSF from the Stokes I image. However, these methods
require substantial field rotation when acquiring the science images, and often result
in large errors in the resulting source flux and self-subtraction for face-on disks. Ide-
ally, a total intensity image should be obtained by other means and used to calculate
polarization fraction across the image.
11. If desired, the primitive convert stokes to radial can be used to calculate
the radial and tangential Stokes parameters Qr and Ur (Schmid et al., 2006):
Qr = +Q cos2φ+ U sin2φ (4.1)
Ur = −Q sin2φ+ U cos2φ (4.2)
where φ, the angle between the star at (x0, y0) and the location of interest on the
detector, is given by:
φ = arctanx− x0y − y0
(4.3)
Assuming that all the polarized flux is in the tangential component (which is expected
for circumstellar material), this removes the positive bias induced by calculating total
polarized intensity via the sum of the squares of the Stokes Q and U images.

109
Figure 4.7 False-color orthogonally polarized J-band image of V4046 Sgr showing the location ofthe four satellite spots (green circles) used to determine the location of the occulted star system.
In summary, this recipe takes the raw science images and produces cubes of polarized
images corresponding to the standard Stokes parameters, and, optionally, the radial and tan-
gential Stokes parameters. Note that flat fielding was not conducted for polarized images,
but is expected to be part of the standard polarization reduction recipe in future versions.
Figure 4.8 shows an example raw image taken with GPI in coronagraphic/polarization
mode of V4046 Sgr, the pair of orthogonal polarization images produced in step 6, and
the resulting Stokes I,Q,U image cube after reducing the data using the process described
above.
4.3 Observations and Data Reduction for V4046 Sgr
Early Science coronagraphic/polarimetric images of V4046 Sgr were obtained with Gem-
ini/GPI through J (1.24 µm) and K2 (2.27 µm) band filters and 0.184 and 0.306′′ diameter
coronagraphic spots on April 23 and 24, 2014, respectively. Four sets of J (K2) band im-
ages were obtained at waveplate position angles of 0, 22, 45 and 68 with exposure times

110
Figure 4.8 Example images of V4046 Sgr taken in coronagraphic/polarimetric mode at J-band withGPI showing the three main steps in the data reduction process. a) Raw image of V4046 Sgr ata waveplate angle of 0. b) Pair of orthogonally polarized images that result after step 6 of thedata reduction process. c) Stokes I (left), Q (middle), and U (right) images of V4046 Sgr resultingafter step 10 in the data reduction process. The stokes Q and U images show a clover-leaf patternindicative of a strongly polarized source (e.g. Kastner & Weintraub, 1996)
of 30 s (60 s) through airmasses ranging from 1.24-1.97 (1.00-1.01) and DIMM seeing
∼0.65” (∼0.60”). Exposures of 60 s were initially attempted in the J band, but saturated
the detector. This saturation may have been due to a slight mispointing, causing starlight to
leak out the west side of the coronagraph and saturate the detector. Although GPI’s extreme
adaptive optics delivers very low total wavefront error, vibrations from the cryocoolers and
a small fixed focus offset between the coronagraph focal plane mask and the science focal

111
plane degraded the angular resolution of Early Science data to∼ 0.05” (∼ 3 AU) at J band.
At the time of observation, V4046 Sgr (mI= 9.11 mag) was the faintest target successfully
observed with GPI and hence served as a test of the useful domain of the GPI instrument
in coronagraphic/polarimetric mode.
Images in each filter were reduced and combined using the GPI pipeline v1.2.1 (Maire
et al., 2010; Perrin et al., 2014), following methods similar to those outlined in Perrin et al.
(2015). These basic reduction steps include image background subtraction, removal of
correlated noise due to detector readout electronics and microphonics, and interpolation
over bad pixels. Calibration spot grids, which define the location of each polarization spot
pair produced by the lenslet array, were used to extract the data from each raw image and
produce a pair of orthogonally polarized images. Satellite spots on each J-band image were
used to determine the location of the (unresolved) binary star behind the coronagraph. The
binary was insufficiently bright in the K2 images for accurate determination of its location
behind the occulting spot via this technique, so its location was assumed to be at the center
of the apparent coronagraph spot in each image. To avoid positive bias in the polarized
intensity image, the radial and tangential Stokes parameters Qr and Ur (Schmid et al.,
2006) were computed via the pipeline; we assume that all polarized flux is in the tangential
component. Procedures for subtraction of the total intensity PSF for extended objects in
GPI’s polarization mode are still under development. We therefore focus our analysis on
the Ur images.
4.4 Results
Figure 4.9 shows the total intensity, Ur , and scaled Ur images of the disk around V4046
Sgr at J and K2. The orientation of the polarization (pseudo-)vectors are elliptically sym-
metric around the occulted central binary and the polarization fraction is much greater than
the instrumental polarization of ∼0.4% (Wiktorowicz et al., 2014). These results are as
expected for scattering of starlight off circumstellar dust. The Ur and scaled Ur images in
Figure 1 show a relatively narrow, bright central ring that peaks in brightness at ∼14 AU
and is surrounded by a fainter, outer halo detected at ≥2σ out to ∼45 AU. The scaled Ur

112
images, which account for dilution of incident starlight (e.g. Garufi et al., 2014) highlight
this ring/halo structure. The structure is detected at both J and K2, but is most clearly seen
in the former because this shorter near-infrared wavelength probes dust that — in addi-
tion to being illuminated by a brighter incident stellar radiation field — likely has a larger
scattering efficiency. The inner ring also shows radial dark features at J, which could be
shadowing from dust within or interior to the bright ring.
Figure 4.9 Left : Total intensity J (top) and K2 (bottom) images with polarization degree (p=P/I)(pseudo-)vectors overlaid in green for pixels where the total polarized intensity is greater than 40counts. Middle : J (top) and K2 (bottom) polarized intensity (Ur) images. Right: Ur scaled by r2,where r is the distance in pixels from the central binary, corrected for projection effects. All imagesare shown on a linear scale. The coronagraph is represented by the black filled circles and imagesare oriented with north up and east to the left. A small artifact from slight telescope mispointingduring acquisition of the J-band image sequence can be seen to the west of the coronagraph in theUr images.
The ring structures seen in the Ur images cannot be attributed to the point spread func-
tion of the occulted central star system, given that similarly bright stars imaged by GPI
in coronagraphic/polarimetric mode show no such features (e.g. Perrin et al., 2015). Fur-
thermore, the inclination, position angle, and north/south brightness contrast of the disk

113
dust ring system are consistent with the outer (∼29-350 AU) disk orientation and inclina-
tion as inferred from interferometry of mm-wave CO emission. Given that circumstellar
dust grains in disks orbiting young stars preferentially scatter starlight in the forward direc-
tion (e.g. Perrin et al., 2015), we conclude that the north side of the disk is tipped toward
Earth, consistent with the disk orientation inferred from Submillimeter Array (SMA) 12CO
observations of V4046 Sgr (Rosenfeld et al., 2012a).
To better characterize the double ring structure that is evident in the polarized intensity
images, we constructed radial brightness profiles from the J band image in the East-West
and South-North directions, after rotating to account for the disk equatorial plane position
angle of 76 (Fig. 4.10). Both radial profiles show a distinct inner ring that peaks in
brightness at ∼14 AU, surrounded by a ”shoulder” and a fainter halo extending out to ∼45
AU. The inner ring, which has a FWHM of∼10 AU (as measured using the eastern-directed
radial profile in Fig. 4.10), blends smoothly with the outer halo in the North, but a distinct
break is evident at ∼20 AU in the East, West and South.
In Figure 4.11 we present surface brightness profiles at J and K2 created by averag-
ing concentric elliptical annuli at 0.014” intervals (the angular size of one pixel) with
minor:major axis ratios of 0.84 (approximating a circular disk with inclination of 33.5)
oriented at a position angle of 76 (Rosenfeld et al., 2012a). Both the J and K2 surface
brightness profiles display a roughly power-law dependence on radius (i.e., surface bright-
ness ∝ r−n) between ∼14 AU and ∼45 AU, which is the apparent outer limit of scattered
light detected in the radial profiles. In both bands, there is a clear break in the power-law
index at ∼28 AU, wherein n ≈ 2.0 in the range ∼14 - 28 AU and n ≈ 5.5 at larger radii.
The former result is consistent with simple geometrical dilution of starlight.
We also construct radially-averaged azimuthal profile plots of the Ur images for rings
with radii extending from 11-18 AU (inner ring) and 18-30 AU (outer ring) by averaging
the flux of the nearest five pixels at every point in the two regions. The results are shown
in Figure 4.12 . The azimuthal profile for the inner ring establishes that the northern region
of the disk (i.e., position angles -14 to 166o) is brighter by a factor of ∼2-4 at both J and
K2 than the corresponding region to the south. The outer ring shows a similar, though
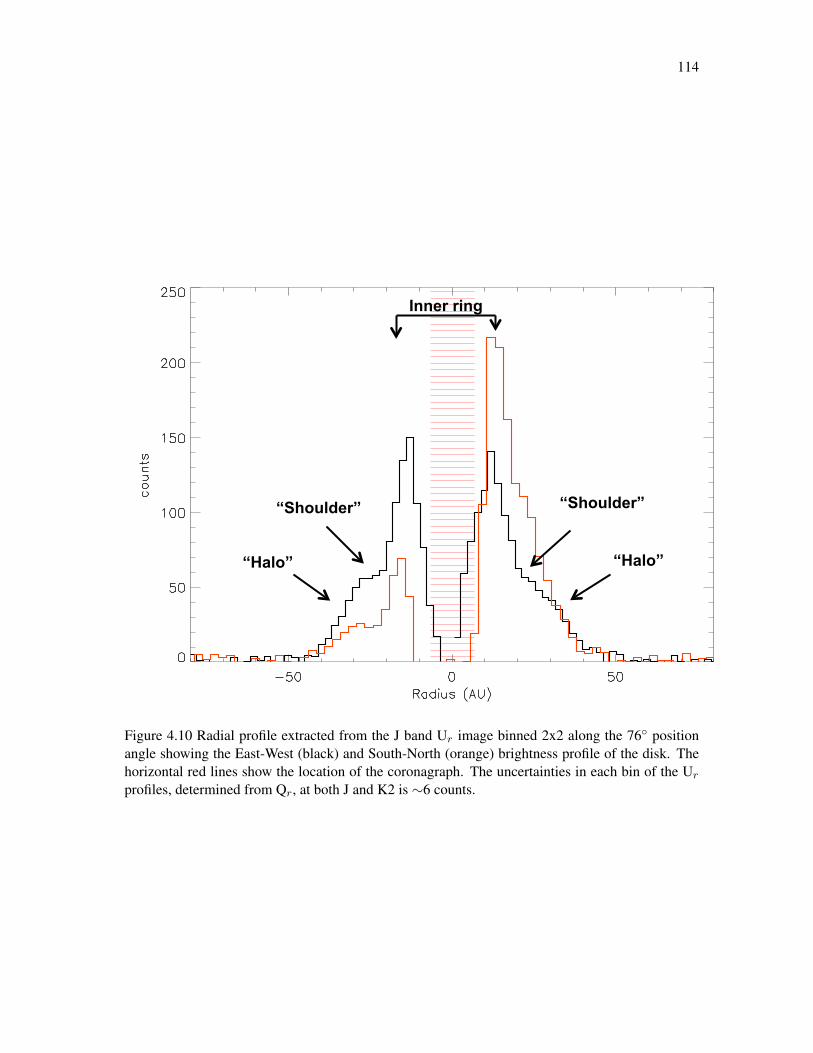
114
Inner ring
“Shoulder” “Shoulder”
“Halo” “Halo”
Figure 4.10 Radial profile extracted from the J band Ur image binned 2x2 along the 76 positionangle showing the East-West (black) and South-North (orange) brightness profile of the disk. Thehorizontal red lines show the location of the coronagraph. The uncertainties in each bin of the Ur
profiles, determined from Qr, at both J and K2 is ∼6 counts.

115
Figure 4.11 Left: J (blue) and K2 (red) surface brightness (SB) curves. The error bars are smallerthan the symbol size. The black dashed line represents r−2 fit from ∼14 - 28 AU and black solidline represents r−5.5 fit from ∼28 - 45 AU. Right: Background subtracted surface brightness curvesmultiplied by r2 with the surface density of small (µm-sized; black dashed) and large (mm-sized;black solid) dust grains from the Rosenfeld et al. (2013) model overlaid. The surface density of boththe small and large dust grains has been scaled up by 104.
somewhat more muted, intensity contrast. The azimuthal surface brightness distributions
do not vary smoothly across the brighter, northern side of the disk, especially in the inner
disk. The drops in brightness at azimuthal angles of -155, 0, 50, 105, and 180o correspond
to the radial dark lanes visible in Figure 4.9, and are seen in both the inner and outer disk,
especially at J-band. This further suggests that material from R . 14 AU may be shadowing
the inner and outer disk.
4.5 Discussion
4.5.1 Comparison of GPI and SMA imaging of V4046 Sgr
Rosenfeld et al. (2013) modeled 1.3 mm CO and continuum interferometric imaging data
for V4046 Sgr in terms of a ring of large (mm-sized) dust grains following a Gaussian ring
surface density profile with a mean radius of 37 AU and FWHM of 16 AU, surrounded
by an extended (∼350 AU radius) halo of molecular gas and small grains. In this model,
the region interior to ∼29 AU is depleted of large grains, but contains smaller (µm-sized)
dust. This model also well reproduces mid- to far-infrared spectrophotometry of V4046
Sgr (Rapson et al. 2014, submitted). Figure 4.13 compares the GPI total linear polarized

116
Figure 4.12 Azimuthal profile plots of the inner (11-18 AU; blue) and outer (18-30 AU; red) ringat J (left) and K2 (right) where the flux of the nearest five pixels at every point has been averagedtogether. The azimuthal profile is measured clockwise, where 0o is the eastern most point along theequatorial plane position angle of 76o.
intensity with the SMA 1.3mm continuum emission map (Rosenfeld et al., 2013). The
fainter, outer scattered light halo in the GPI polarized intensity images, which extends to
∼45 AU, appears to merge into the peaks in SMA-detected flux. Figure 4.11 (right) shows
the surface brightness profiles at J and K2 with the surface density of small (µm-sized) and
large (mm-sized) dust grains from the Rosenfeld et al. (2013) model overlaid. We clearly
see that the dust in our GPI images fills the gap interior to∼29 AU, and extends into the ring
of mm-sized dust that peaks at 37 AU. The Rosenfeld et al. (2013) model also predicts the
existence of µm-sized grains interior to∼7 AU, a region that lies behind the coronagraph in
the GPI images. Evidently, the inner dust ring imaged by GPI has no counterpart in either
the small- or large-grain model components modeled by Rosenfeld et al. (2013).
4.5.2 Evidence for radial dust segregation by size
The foregoing comparison between GPI and SMA imaging demonstrates that the inner∼45
AU of the disk has undergone significant dust particle growth and particle size segregation.
Such particle growth and migration processes are expected to accompany an epoch of gi-
ant planet formation. Specifically, theories of giant planet formation in dusty disks with
embedded, nascent planets predict the generation of radially localized pressure maxima as

117
Figure 4.13 Three color composite image comparing SMA 1.3mm continuum emission (blue withyellow contours overlaid; Rosenfeld et al., 2013) and GPI J (green) and K2 (red) total linear polar-ized intensity. The SMA data has a beam size of 0.74” × 0.38” and has been registered such thatthe peaks of the mm-wave continuum emission lie equidistant from the coronagraph center.
a consequence of planet-disk dynamical interactions (Rice et al., 2006; Zhu et al., 2012).
These pressure gradients trap larger (mm- to cm-sized) particles outside the planet-forming
regions of the disk, whereas smaller (micron-sized) grains freely pass through the pressure
traps, resulting in strong dust particle size gradients.
Interferometric imaging of dusty protoplanetary disks often reveal central disk clearings
whose inner radii are significantly larger than the orbits of the Jovian planets in our solar
system (e.g. Andrews et al., 2011). This dichotomy in disk size scales has left open the
potential connection between inner disk clearings and giant planet building. Modeling by
Pinilla et al. (2012) shows that pressure bumps in the disk due to gaps opened by orbiting
planets trap mm-sized dust grains into a ring that may be located at radii greater than twice
118
a planet’s orbital radius, depending on the mass of the planet. Smaller (. µm-sized) dust
particles drift inward and create a ring between the planet-induced gap and the mm dust
ring.
Such an interpretation has been applied to mm-wave and near-IR imaging of the disk
orbiting the intermediate-mass star SAO 206462 (Garufi et al., 2013). The surface bright-
ness profile from near-infrared scattered light off the disk around SAO 206462 shows a
similar power law dependence on scales about twice that determined here for V4046 Sgr,
despite the fact that the SAO 206462 disk exhibits spiral structure, rather than rings, and
the scattered light lies exterior to the sub-mm hole. Thus, the dust ring structure and radial
profiles seen in both V4046 Sgr and SAO 206462 suggest that dust segregation and planet
formation may be occurring within these disks.
4.5.3 Implications for planet formation in the disk around V4046 Sgr
It is possible that the depletion in scattered light at R. 14 AU in our GPI images may be
due to giant planet formation. This cavity cannot be due purely to dynamical effects from
the binary system, as the tight (∼9 R) binary can only truncate the disk out to ∼0.135
AU. Although this cavity could conceivably be filled by a geometrically thin disk surface
that happens to lie roughly parallel to the paths of incoming photons from the central stars
(e.g. Takami et al., 2014), we regard such an (ad hoc) inner disk geometry as less likely
than that of an opening carved out by a giant planet. It is also possible, but unlikely, that
photoevaporation has caused this depletion of dust within ∼14 AU, since models predict
that micron-sized dust is rapidly destroyed by X-ray/UV radiation (Gorti et al., 2009; Owen
et al., 2012), and the GPI images demonstrate that a significant mass of micron-sized dust
is still present at disk radii between 14 to 45 AU after ∼20 Myr of disk evolution.
Ruge et al. (2014) model the effects of giant planets in massive, dusty disks on the ap-
pearance of gaps in scattered light images. They find that the formation of a giant planet
results in a deficit of 1.3 mm emission at the location of the forming planet for disks more
massive than 2.67×10⁻³ M. Gaps in near-infrared scattered light are also evident for
lower mass disks, but for massive disks (M &2.67×10⁻³ M) the disk remains optically

119
thick and thus a gap may not be apparent in scattered light at near-infrared wavelengths.
While the V4046 Sgr disk is massive overall (M∼0.1M), modeling of the disk dust distri-
bution (Rosenfeld et al., 2013), and the evidence for dust segregation by size, suggests most
of the dust mass resides beyond the ∼29 AU sub-mm “edge”, thereby allowing for gaps
formed by giant planets to be visible in scattered light images at near-infrared wavelengths.
These models suggest that planets may be forming interior to ∼14 AU and possibly near
the R∼20 AU break between the rings seen in scattered light (Figs. 4.10, 4.11). Consider-
ing the depletion of sub-mm emission interior to ∼29 AU (Rosenfeld et al., 2013), a giant
planet at ∼20 AU would also be consistent with modeling predicting that sub-mm rings
form at &1.5 times the planets orbital radius (Paardekooper & Mellema, 2004; Rice et al.,
2006).
Simulations of planet formation in circumstellar disks by Dong et al. (2014) further
support the idea that planet formation is occurring in the V4046 Sgr disk. These models
show that Jupiter-mass planets can clear large visible gaps in µm and mm wavelengths at
the locations of forming planets. Planets interior to a sub-mm cavity can form multiple dust
rings and gaps depending on the planet’s size and location, just as we observe in our GPI
images of V4046 Sgr (compare our Figs. 4.9 and 4.11 with their Figs. 2,5 and 7). Overall,
our GPI imaging of the V4046 Sgr disk hence provides vivid evidence in support of so-
called “dust filtration” models describing the structure of protoplanetary disks following
giant planet formation.
4.6 Conclusions
GPI coronagraphic/polarimetric imaging of the V4046 Sgr AB circumbinary disk, com-
bined with mm imaging, demonstrates dust segregation by size into rings, which may be
caused by multiple young giant planets orbiting the V4046 Sgr AB binary system at orbital
semimajor axes similar to those of the giant planets in our solar system. Polarized intensity
images yield evidence that the disk is well populated by relatively small (micron-sized or
smaller) grains within its central, ∼29 AU large-grain cavity and, furthermore, that there
exists an interior .14 AU-radius region that is devoid even of small grains. Comparison

120
with models of protoplanet-disk interactions (Pinilla et al., 2012; Dong et al., 2014; Ruge
et al., 2014) suggests that gas giant planets may be present, and actively carving gaps, at
R.14 AU and at R∼20 AU in the V4046 Sgr disk.
Further imaging with Gemini/GPI or similar instrumentation at higher signal to noise,
as well as high resolution imaging with ALMA, is necessary to better discern the structure
of the rings evident around V4046 Sgr. Modeling is also needed to determine the grain
properties and dust mass within the disk, along with the location of possible forming plan-
ets. Further investigations aimed at directly and indirectly detecting potential young giant
planets orbiting V4046 Sgr AB will also provide essential constraints on simulations aimed
at understanding the conditions in which giant planets might form in circumbinary orbits
— a theoretical question that is presently of intense interest, given the Kepler Mission’s
detection of circumbinary planets (Pierens & Nelson, 2013).
Acknowledgements
This work is based on observations obtained at the Gemini Observatory, which is operated
by the Association of Universities for Research in Astronomy, Inc., under a cooperative
agreement with the NSF on behalf of the Gemini partnership: the National Science Foun-
dation (United States), the National Research Council (Canada), CONICYT (Chile), the
Australian Research Council (Australia), Ministerio da Ciencia, Tecnologia e Inovacao
(Brazil) and Ministerio de Ciencia, Tecnologıa e Innovacion Productiva (Argentina). Sup-
port is provided by the National Science Foundation grant AST-1108950 to RIT.

121
Chapter 5
Conclusions & Future work
5.1 Summary
The nearby young star-disk systems V4046 Sgr, MP Mus and T Cha are very unique sys-
tems that have been studied in great detail at all wavelengths of the electromagnetic spec-
trum. The work presented in this dissertation adds to this wealth of data, and specifically
focuses on probing the planet forming regions of these disks (i.e. the inner tens of AU
where the gas giant planets are located in our own solar system).
Using Spitzer and Herschel spectra, we studied the gas and dust composition of the
planet forming region of the disks around all three sources. For V4046 Sgr, we found strong
emission from [Ne II] at 12.8 µm, [O I] at 63 µm, HCN at 14 µm and traces of OH which
all suggest that high energy (EUV or X-ray) radiation is impinging on the disk, exciting
atoms and photodissociating molecules such as CO and H2O. This high energy radiation
likely comes from accretion hot spots on the central binary system. Emission from CO
and possible detections of H2O were also found in the Spitzer and Herschel spectra, but
more modeling needs to be conducted to fully understand the water content of the disk and
distribution of hydrogen gas as traced by the CO. Rare H2 emission at 17 µm was also
found in the V4046 Sgr spectrum, and likely traces warm gas in the surface layers of the
disk.
Dust modeling of the Spitzer spectrum reveals that the V4046 Sgr disk is dominated
by large (∼5 µm) silicate dust grains, suggesting that dust coagulation and protoplanet
formation are actively occurring inside the ∼29 AU submm gap in the disk (Rosenfeld
et al., 2013). The percent by mass of crystalline silicate grains is similar to that of other
transitional disks, and may be due to the presence of micron-sized or smaller dust grains

122
in the inner disk (see Chapter 2) being heated and thermally annealed by active planet
formation in the disk gap. Thus, the presence of large dust grains and the moderately high
crystallinity in this evolved transition disk both support the idea that planet formation is
occurring in the inner disk.
Further evidence for planet formation in the disk around V4046 Sgr is revealed by data
from the Gemini Planet Imager. Near-infrared coronagraphic+polarimetric images of light
scattered off dust grains in the disk show that dust is being segregated by size and µm-sized
(or smaller) dust exists interior to the gap seen at submm wavelengths. These data also
reveal a double ring structure with a clear deficit of scattered light at R∼20 AU and R.14,
suggesting one or more planets is actively carving out gaps in the disk at radii similar to
that of the giant planets in our solar system.
Spitzer and Herschel spectroscopic studies were also conducted for T Cha and MP
Mus. T Cha shows potentially variable [Ne II] emission over a 5-year time span, whereas
MP Mus shows no strong emission from [Ne II] at 12.8 µm. This may be due to variable
accretion rates for both systems, or the fact that the T Cha disk is highly inclined and thus
the observable emitting surface area is lower. MP Mus and T Cha both show emission from
[O I] at 63 µm, indicating that UV photons are photodissociating CO in the disk. Overall,
the T Cha and MP Mus Spitzer and Herschel spectra show far fewer emission features than
the spectra of V4046 Sgr and other young stars in nearby star forming regions.
The dust composition determined via modeling of the Spitzer spectrum for T Cha shows
that the crystallinity fractions are low (.15%) and that the disk has a mixture of large and
small grains. This is similar to what is observed for many other transition disk systems,
but may be highly influenced by the fact that we are viewing T Cha almost edge on. The
MP Mus Spitzer spectrum shows strong silicate dust features from only small dust grains,
and higher crystallinity fractions of 23-30% by mass. These two findings contradict each
other, as high crystallinity is often associated with evolved disks and grain growth, yet
modeling suggests that no small dust grains are present in the disk. A possible explanation
for this is that the system is indeed young and less evolved, and stellar outbursts from
accretion shocks occur periodically and thermally anneal small dust grains into crystalline
123
structures. Yet, this is inconsistent with the fact that the crystalline dust is at a temperature
below that required to thermally anneal dust grains.
Overall, V4046 Sgr, T Cha and MP Mus exhibit unique disk structures and disk dust
content and distribution. These observational data, combined with other multiwavelength
data, will put strong constraints on planet formation processes in disks and how planet-
disk interactions affect the evolution of circumstellar disks. They also reveal the chemical
composition of protoplanetary disks and how accretion processes and high energy radiation
affect disk evolution. Combining results from many young stellar systems allows us to
constrain theories and models of planet formation and disk dissipation, in general, and
ultimately further understand how our own solar system came to be.
5.2 Future Work
5.2.1 High Resolution Near-infrared Imaging
The Gemini Planet Imager data presented in Chapter 4 provided the first direct imaging
of dust in the inner R∼30 AU of the disk around V4046 Sgr. Despite the fact that we
obtained successful results, the data were fairly low signal to noise and the coronagraph
was misaligned in the J-band images, causing an artifact to be present in the images. We
were able to discern the basic structure of the disk, but were not able to fully analyze the
azimuthal disk structure, especially at K2. Thus, we applied for, and were granted, time to
re-observe V4046 Sgr with Gemini/GPI during cycle 15A.
We will obtain multiple polarimetric image sets of V4046 Sgr with exposure times
of 60 s each through J and K1 filters, paying special attention to the alignment of the
coronagraph at J-band. Due to rotation of the object as it travels across the sky, we are
not able to take exposures longer than 60 s as the image will get blurred. By stacking the
images, we will obtain higher signal to noise data, which will allow us to further study the
intensity and the full extent of the disk in near-infrared scattered light. Obtaining images in
K1 rather than K2 again has two benefits: 1) the instrument throughput is much higher at K1
compared to K2, so the data will naturally be less noisy, and 2) having data in three different
wavebands will allow us to study the dust grain properties and size distribution throughout

124
the disk. Along with these polarimetric data, we will also obtain direct coronagraphic
images of V4046 Sgr at J and K1. These direct images may reveal the planet(s) that we
predict are orbiting at R.14 and R∼18 AU, if the planets are bright enough. Since the
V4046 Sgr early science data were obtained in April 2014, the data reduction algorithms
for Gemini/GPI have improved greatly and continue to do so. The data analysis is now a
quicker process which yields improved results, so it will be very interesting to compare the
original GPI data with the new set of data and see if they yield different results.
We were also granted time to conduct the same imaging and analysis with GPI for
TW Hya. These data, combined with recent imaging of the TW Hya disk by the SEEDS
team with Subaru/HiCIAO (Akiyama et al., 2015) and upcoming HST/STIS imaging (P.I. J.
Debes), will allow for a thorough analysis of the structure of the TW Hya disk down to R∼4
AU from the host star. Imaging of MP Mus and T Cha with Gemini/GPI or other similar
instrumentation (e.g. HiCIAO on Subaru or SPHERE on the VLT) would also likely yield
very interesting results. Having scattered light imaging of these star+disk systems that
are all inclined at different angles will allow us to study both the disk structure, and the
scattering properties of the grains.
5.2.2 Modeling of Nearby Young Stars
A large amount of spectroscopic and photometric data exists for V4046 Sgr and many
other nearby young stars. Using these data as input, we can begin to model these disks
to further understand their structure and composition. Modeling of the V4046 Sgr disk
could be conducted with a radiative transfer code such as ProDiMo (Woitke et al., 2009).
ProDiMo has been used to successfully model the disk structure and composition of many
other young stars (e.g. Thi et al., 2010). The data presented here for V4046 Sgr, along with
previous multiwavelength studies, can be used as inputs and constraints for this modeling.
Modeling of planet-disk interactions could also be conducted using MHD codes such
as FARGO3D (Masset, 2000). By placing planets in the V4046 Sgr disk and evolving
over time, we can study how the planet disrupts and carves out gaps in the disk. These
results can be compared to our Gemini/GPI data to understand the exact location and size of

125
planets forming in the V4046 Sgr disk. Overall, modeling of V4046 Sgr and other nearby
young stars will help us understand how circumstellar disks evolve and how planet-disk
interactions affect this evolution.
5.2.3 High Resolution Submm/radio Imaging and Spectroscopy
Nearby young stars are excellent targets for submm/radio imaging and spectroscopy. Tele-
scope arrays such as the SMA and ALMA can resolve these disks and focus on studying
the cold gas and dust in the outer portions of the disk. Many imaging studies have been
conducted that focus on molecules such as CN, C2H and OH, that trace photodissociation,
CO which traces gas mass and the extent of the disk, and molecules such as H2CO and
N2H+ that can trace freeze out and snow lines in the disk (e.g. Qi et al., 2004; Kastner
et al., 2010; Oberg et al., 2011; Andrews et al., 2011; Qi et al., 2013). Unbiased spectral
line surveys (e.g. Kastner et al., 2014a; Punzi et al., 2015) conducted with single dish radio
telescopes also reveal the molecular constituents of the disk. Further radio/submm imag-
ing with ALMA and other radio dishes will reveal more about the chemical composition
and structure of the disks around V4046 Sgr, MP Mus and T Cha, especially at large radii.
These studies may also reveal gaps and other structure in the disk formed as a result of
planet formation and evolution.
5.2.4 Spectral Type Determination With Near-Infrared Spectra
Spectral types of stars, in general, are often determined from the shape of, and absorption
features in, their optical spectrum. It is more difficult to determine the spectral type of
young stars because they are still contracting down onto the main sequence and, thus,
exhibit photospheric emission out into the near-infrared. This near-infrared emission can
be beneficial, as the infrared spectrum of young stars is often easier to obtain, especially
for sources that are embedded in their natal clouds and thus are highly extincted at optical
wavelengths. Therefore, some authors (e.g. Vacca & Sandell, 2011; McClure et al., 2013)
have used infrared spectra from young stars to determine their spectral type, instead of
126
optical. Yet, Gullbring et al. (1998) showed that spectral types of suspected K and M-
type young stars appear 3-5 subclasses later when the spectral type is determined from
near-infrared spectra as compared to optical spectra. This fact has not been taken into
account in all studies, as is evident in the paper by Vacca & Sandell (2011) where they
use near-infrared spectra to claim that the spectral type of TW Hya is later than previously
assumed and thus the system is much younger than the typically adopted ∼8 Myr. Kastner
et al. (2014b) show the same spectral type discrepancy for V4046 Sgr, but the masses
of the stars are (independently) well known since it is a binary system, and agree better
with the optical spectral type than with the near-infrared spectral type. This idea can be
explored further using simultaneous near-infrared and optical spectral data that exists for
nearby young stars in Taurus (Kevin Kobe, private communication). The reason for this
difference in spectral types is not clear, and may be linked to stellar age or activity (i.e.
changes in surface gravity and/or stars spots). By spectral typing a large number of stars
via optical and infrared spectroscopy, a conversion system could be developed such that
only infrared spectra are needed to determine the true spectral type of young stars. Having
accurate spectral types for young stars is imperative for age estimates, disk and stellar mass
calculations and modeling purposes.
5.2.5 TMT and James Webb
The Thirty Meter Telescope (TMT) and the James Webb Space Telescope (JWST) are
currently under construction and will provide excellent opportunities to obtain new data on
these nearby circumstellar disks in the near future. The TMT will be the largest ground
based UV-to-IR telescope ever constructed, and will allow us to obtain high resolution
imaging and spectroscopy of nearby disks and potentially directly images planets forming
in these disks. JWST is the next generation infrared space telescope planned to launch in
2018. James Webb will allow us to image the disks at mid- to far-infrared wavelengths,
a regime that is not possible to study from the ground. Both of these telescopes and their
accompanying instrumentation will lead the way in star and planet formation and evolution
studies throughout the 21st century.

127
Bibliography
Abraham, P., Juhasz, A., Dullemond, C. P., et al. 2009, Nature, 459, 224
Acke, B., van den Ancker, M. E., & Dullemond, C. P. 2005, A&A, 436, 209
Agundez, M., Cernicharo, J., & Goicoechea, J. R. 2008, A&A, 483, 831
Aikawa, Y., van Zadelhoff, G. J., van Dishoeck, E. F., & Herbst, E. 2002, A&A, 386, 622
Akiyama, E., Muto, T., Kusakabe, N., et al. 2015, ApJ, 802, L17
Alexander, R., Pascucci, I., Andrews, S., Armitage, P., & Cieza, L. 2014, Protostars and
Planets VI, 475
Alexander, R. D. 2008, MNRAS, 391, L64
Alexander, R. D., & Armitage, P. J. 2007, MNRAS, 375, 500
Alexander, R. D., Clarke, C. J., & Pringle, J. E. 2006, MNRAS, 369, 216
ALMA Partnership, T., Brogan, C. L., Perez, L. M., et al. 2015, ArXiv e-prints,
arXiv:1503.02649
Andre, P., Ward-Thompson, D., & Barsony, M. 1993, ApJ, 406, 122
Andrews, S. M., Wilner, D. J., Espaillat, C., et al. 2011, ApJ, 732, 42
Andrews, S. M., Wilner, D. J., Hughes, A. M., Qi, C., & Dullemond, C. P. 2009, ApJ, 700,
1502
Anthonioz, F., Menard, F., Pinte, C., et al. 2015, A&A, 574, A41
Aresu, G., Meijerink, R., Kamp, I., et al. 2012, A&A, 547, A69

128
Argiroffi, C., Maggio, A., Peres, G., et al. 2009, A&A, 507, 939
Argiroffi, C., Maggio, A., Montmerle, T., et al. 2012, ApJ, 752, 100
Arquilla, R., & Goldsmith, P. F. 1986, ApJ, 303, 356
Avenhaus, H., Quanz, S. P., Meyer, M. R., et al. 2014, ApJ, 790, 56
Bary, J. S., Weintraub, D. A., Shukla, S. J., Leisenring, J. M., & Kastner, J. H. 2008, ApJ,
678, 1088
Batalha, C. C., Quast, G. R., Torres, C. A. O., et al. 1998, A&AS, 128, 561
Beckwith, S. V. W., & Sargent, A. I. 1993, ApJ, 402, 280
Beckwith, S. V. W., Sargent, A. I., Chini, R. S., & Guesten, R. 1990, AJ, 99, 924
Beletic, J. W., Blank, R., Gulbransen, D., et al. 2008, in Society of Photo-Optical In-
strumentation Engineers (SPIE) Conference Series, Vol. 7021, Society of Photo-Optical
Instrumentation Engineers (SPIE) Conference Series
Bergin, E., Calvet, N., D’Alessio, P., & Herczeg, G. J. 2003, ApJ, 591, L159
Bergin, E. A., & Tafalla, M. 2007, ARA&A, 45, 339
Bernstein, G. M., Trilling, D. E., Allen, R. L., et al. 2004, AJ, 128, 1364
Bethell, T., & Bergin, E. 2009, Science, 326, 1675
Binks, A. S., & Jeffries, R. D. 2014, MNRAS, 438, L11
Birnstiel, T., Ormel, C. W., & Dullemond, C. P. 2011, A&A, 525, A11
Bitner, M. A., Richter, M. J., Lacy, J. H., et al. 2007, ApJ, 661, L69
—. 2008, ApJ, 688, 1326
Blum, J., & Wurm, G. 2000, Icarus, 143, 138
Bohlin, R. C., Savage, B. D., & Drake, J. F. 1978, ApJ, 224, 132

129
Borucki, W. J., Koch, D., Basri, G., et al. 2010, Science, 327, 977
Boss, A. P. 2004, ApJ, 616, 1265
Bouwman, J., Henning, T., Hillenbrand, L. A., et al. 2008, ApJ, 683, 479
Brauer, F., Dullemond, C. P., & Henning, T. 2008, A&A, 480, 859
Bromley, B. C., & Kenyon, S. J. 2011, ApJ, 731, 101
—. 2015, ApJ, 806, 98
Brown, J. M., Blake, G. A., Dullemond, C. P., et al. 2007, ApJ, 664, L107
Bruderer, S., van Dishoeck, E. F., Doty, S. D., & Herczeg, G. J. 2012, A&A, 541, A91
Bryden, G., Chen, X., Lin, D. N. C., Nelson, R. P., & Papaloizou, J. C. B. 1999, ApJ, 514,
344
Calvet, N., D’Alessio, P., Hartmann, L., et al. 2002, ApJ, 568, 1008
Calvet, N., Patino, A., Magris, G. C., & D’Alessio, P. 1991, ApJ, 380, 617
Carmona, A., van den Ancker, M. E., Henning, T., et al. 2008, A&A, 478, 795
Carr, J. S., & Najita, J. R. 2008, Science, 319, 1504
—. 2011, ApJ, 733, 102
Caselli, P., Benson, P. J., Myers, P. C., & Tafalla, M. 2002, ApJ, 572, 238
Cheetham, A., Huelamo, N., Lacour, S., de Gregorio-Monsalvo, I., & Tuthill, P. 2015,
MNRAS, 450, L1
Chiang, E., & Murray-Clay, R. 2007, Nature Physics, 3, 604
Chiang, E., & Youdin, A. N. 2010, Annual Review of Earth and Planetary Sciences, 38,
493

130
Chilcote, J. K., Larkin, J. E., Maire, J., et al. 2012, in Society of Photo-Optical Instrumen-
tation Engineers (SPIE) Conference Series, Vol. 8446, Society of Photo-Optical Instru-
mentation Engineers (SPIE) Conference Series
Cieza, L., Padgett, D. L., Stapelfeldt, K. R., et al. 2007, ApJ, 667, 308
Cieza, L. A., Olofsson, J., Harvey, P. M., et al. 2011, ApJ, 741, L25
Cieza, L. A., Lacour, S., Schreiber, M. R., et al. 2013, ApJ, 762, L12
Cleeves, L. I., Bergin, E. A., Bethell, T. J., et al. 2011, ApJ, 743, L2
Cohen, M., & Witteborn, F. C. 1985, ApJ, 294, 345
Cortes, S. R., Meyer, M. R., Carpenter, J. M., et al. 2009, in American Institute of Physics
Conference Series, Vol. 1158, American Institute of Physics Conference Series, ed.
T. Usuda, M. Tamura, & M. Ishii, 119–120
Crida, A., Morbidelli, A., & Masset, F. 2006, Icarus, 181, 587
Curran, R. L., Argiroffi, C., Sacco, G. G., et al. 2011, A&A, 526, A104
Cutri, R. M., & et al. 2013, VizieR Online Data Catalog, 2328, 0
Cutri, R. M., Skrutskie, M. F., van Dyk, S., et al. 2003, 2MASS All Sky Catalog of point
sources.
D’Alessio, P. 2009, in Revista Mexicana de Astronomia y Astrofisica Conference Series,
Vol. 35, Revista Mexicana de Astronomia y Astrofisica Conference Series, 33–38
D’Angelo, G., & Lubow, S. H. 2008, ApJ, 685, 560
de Graauw, T., Helmich, F. P., Phillips, T. G., et al. 2010, A&A, 518, L6
Dent, W. R. F., Thi, W. F., Kamp, I., et al. 2013, PASP, 125, 477
Dodson-Robinson, S. E., & Salyk, C. 2011, ApJ, 738, 131
Donati, J.-F., & Landstreet, J. D. 2009, ARA&A, 47, 333
131
Donati, J.-F., Gregory, S. G., Montmerle, T., et al. 2011, MNRAS, 417, 1747
Dong, R., Zhu, Z., & Whitney, B. 2014, ArXiv e-prints, arXiv:1411.6063
Dong, R., Rafikov, R., Zhu, Z., et al. 2012, ApJ, 750, 161
Ducourant, C., Teixeira, R., Chauvin, G., et al. 2013, in IAU Symposium, Vol. 289, IAU
Symposium, ed. R. de Grijs, 386–389
Dullemond, C. P., & Dominik, C. 2005, A&A, 434, 971
Dullemond, C. P., Hollenbach, D., Kamp, I., & D’Alessio, P. 2007, Protostars and Planets
V, 555
Dullemond, C. P., & Monnier, J. D. 2010, ARA&A, 48, 205
Ercolano, B., Drake, J. J., Raymond, J. C., & Clarke, C. C. 2008, ApJ, 688, 398
Ercolano, B., & Owen, J. E. 2010, MNRAS, 406, 1553
Espaillat, C., Calvet, N., D’Alessio, P., et al. 2007a, ApJ, 670, L135
—. 2007b, ApJ, 664, L111
Espaillat, C., Muzerolle, J., Najita, J., et al. 2014, Protostars and Planets VI, 497
Evans, II, N. J., Dunham, M. M., Jørgensen, J. K., et al. 2009, ApJS, 181, 321
Fazio, G. G., Hora, J. L., Allen, L. E., et al. 2004, ApJS, 154, 10
Fedele, D., Bruderer, S., van Dishoeck, E. F., et al. 2012, A&A, 544, L9
—. 2013, A&A, 559, A77
Feigelson, E. D., Casanova, S., Montmerle, T., & Guibert, J. 1993, ApJ, 416, 623
Feigelson, E. D., & Montmerle, T. 1999, ARA&A, 37, 363
Furlan, E., Calvet, N., D’Alessio, P., et al. 2005, ApJ, 621, L129
Gail, H.-P. 1998, A&A, 332, 1099

132
—. 2004, A&A, 413, 571
Gammie, C. F., & Ostriker, E. C. 1996, ApJ, 466, 814
Garufi, A., Quanz, S. P., Schmid, H. M., et al. 2014, A&A, 568, A40
Garufi, A., Quanz, S. P., Avenhaus, H., et al. 2013, A&A, 560, A105
Glassgold, A. E., Najita, J., & Igea, J. 2004, ApJ, 615, 972
Goldreich, P., & Ward, W. R. 1973, ApJ, 183, 1051
Goldsmith, P. F., Bergin, E. A., & Lis, D. C. 1997, ApJ, 491, 615
Goodman, A. A., Benson, P. J., Fuller, G. A., & Myers, P. C. 1993, ApJ, 406, 528
Gorti, U., Dullemond, C. P., & Hollenbach, D. 2009, ApJ, 705, 1237
Grafe, C., & Wolf, S. 2013, A&A, 552, A88
Greene, T. P., Wilking, B. A., Andre, P., Young, E. T., & Lada, C. J. 1994, ApJ, 434, 614
Greenzweig, Y., & Lissauer, J. J. 1990, Icarus, 87, 40
Gregorio-Hetem, J., Lepine, J. R. D., Quast, G. R., Torres, C. A. O., & de La Reza, R.
1992, AJ, 103, 549
Griffin, M. J., Abergel, A., Abreu, A., et al. 2010, A&A, 518, L3
Gudel, M. 2010, in IAU Symposium, Vol. 264, IAU Symposium, ed. A. G. Kosovichev,
A. H. Andrei, & J.-P. Rozelot, 375–384
Gudel, M., Lahuis, F., Briggs, K. R., et al. 2010, A&A, 519, A113
Gullbring, E., Hartmann, L., Briceno, C., Calvet, N., & Muzerolle, J. 1998, in Astronomical
Society of the Pacific Conference Series, Vol. 154, Cool Stars, Stellar Systems, and the
Sun, ed. R. A. Donahue & J. A. Bookbinder, 1709
Gunther, H. M., Liefke, C., Schmitt, J. H. M. M., Robrade, J., & Ness, J.-U. 2006, A&A,
459, L29

133
Gutermuth, R. A., Myers, P. C., Megeath, S. T., et al. 2008, ApJ, 674, 336
Hanner, M. S., & Zolensky, M. E. 2010, in Lecture Notes in Physics, Berlin Springer
Verlag, Vol. 815, Lecture Notes in Physics, Berlin Springer Verlag, ed. T. Henning, 203–
232
Hartmann, L., D’Alessio, P., Calvet, N., & Muzerolle, J. 2006, ApJ, 648, 484
Hashimoto, J., Tamura, M., Muto, T., et al. 2011, ApJ Letters, 729, L17
Helled, R., Bodenheimer, P., Podolak, M., et al. 2014, Protostars and Planets VI, 643
Henning, T. 2010, ARA&A, 48, 21
Henning, T., Semenov, D., Guilloteau, S., et al. 2010, ApJ, 714, 1511
Higdon, S. J. U., Devost, D., Higdon, J. L., et al. 2004, PASP, 116, 975
Hillenbrand, L. A., Carpenter, J. M., Kim, J. S., et al. 2008, ApJ, 677, 630
Høg, E., Fabricius, C., Makarov, V. V., et al. 2000, A&A, 355, L27
Hogerheijde, M. R., Bergin, E. A., Brinch, C., et al. 2011, Science, 334, 338
Honda, M., Kataza, H., Okamoto, Y. K., et al. 2003, ApJ, 585, L59
Houck, J. R., Roellig, T. L., Van Cleve, J., et al. 2004, in Society of Photo-Optical In-
strumentation Engineers (SPIE) Conference Series, Vol. 5487, Optical, Infrared, and
Millimeter Space Telescopes, ed. J. C. Mather, 62–76
Howard, C. D., Sandell, G., & Vacca, W. 2012, in From Atoms to Pebbles: Herschel’s view
of Star and Planet Formation
Howard, C. D., Sandell, G., Vacca, W. D., et al. 2013, ApJ, 776, 21
Huelamo, N., de Gregorio-Monsalvo, I., Macias, E., et al. 2015, A&A, 575, L5
Huelamo, N., Lacour, S., Tuthill, P., et al. 2011, A&A, 528, L7

134
Hughes, A. M., Wilner, D. J., Calvet, N., et al. 2007, ApJ, 664, 536
Ingleby, L., Calvet, N., Hernandez, J., et al. 2014, ApJ, 790, 47
Ingraham, P., Perrin, M. D., Sadakuni, N., et al. 2014, in Society of Photo-Optical In-
strumentation Engineers (SPIE) Conference Series, Vol. 9147, Society of Photo-Optical
Instrumentation Engineers (SPIE) Conference Series, 7
Ireland, M. J., & Kraus, A. L. 2008, ApJ, 678, L59
Isella, A., Carpenter, J. M., & Sargent, A. I. 2010, ApJ, 714, 1746
Jager, C., Dorschner, J., Mutschke, H., Posch, T., & Henning, T. 2003, A&A, 408, 193
Jeans, J. H. 1902, Royal Society of London Philosophical Transactions Series A, 199, 1
Jensen, E. L. N., & Mathieu, R. D. 1997, AJ, 114, 301
Jensen, E. L. N., Mathieu, R. D., & Fuller, G. A. 1996, ApJ, 458, 312
Johansen, A., & Youdin, A. 2007, ApJ, 662, 627
Kastner, J. H., Hily-Blant, P., Rodriguez, D. R., Punzi, K., & Forveille, T. 2014a, ApJ, 793,
55
Kastner, J. H., Hily-Blant, P., Sacco, G. G., Forveille, T., & Zuckerman, B. 2010, ApJ, 723,
L248
Kastner, J. H., Rapson, V., Sargent, B., Smith, C. T., & Rayner, J. 2014b, ArXiv e-prints,
arXiv:1409.7135
Kastner, J. H., Thompson, E. A., Montez, R., et al. 2012, ApJ, 747, L23
Kastner, J. H., & Weintraub, D. A. 1996, in Astronomical Society of the Pacific Conference
Series, Vol. 97, Polarimetry of the Interstellar Medium, ed. W. G. Roberge & D. C. B.
Whittet, 212
Kastner, J. H., Zuckerman, B., Hily-Blant, P., & Forveille, T. 2008, A&A, 492, 469

135
Kastner, J. H., Sacco, G. G., Montez, R., et al. 2011, ApJ, 740, L17
Keane, J. T., Pascucci, I., Espaillat, C., et al. 2014, ApJ, 787, 153
Kelley, M. S., & Wooden, D. H. 2009, Planet. Space Sci., 57, 1133
Kenyon, S. J., & Hartmann, L. 1995, ApJS, 101, 117
Kim, K. H., Watson, D. M., Manoj, P., et al. 2009, ApJ, 700, 1017
—. 2013, ApJ, 769, 149
Kley, W., & Nelson, R. P. 2012, ARA&A, 50, 211
Kraus, A. L., Ireland, M. J., Martinache, F., & Hillenbrand, L. A. 2011, ApJ, 731, 8
Kraus, S., Ireland, M. J., Sitko, M. L., et al. 2013, ApJ, 768, 80
Lada, C. J. 1987, in IAU Symposium, Vol. 115, Star Forming Regions, ed. M. Peimbert &
J. Jugaku, 1–17
Lafreniere, D., Marois, C., Doyon, R., Nadeau, D., & Artigau, E. 2007, ApJ, 660, 770
Lahuis, F., van Dishoeck, E. F., Blake, G. A., et al. 2007, ApJ, 665, 492
Larkin, J. E., Chilcote, J. K., Aliado, T., et al. 2014, in Society of Photo-Optical Instrumen-
tation Engineers (SPIE) Conference Series, Vol. 9147, Society of Photo-Optical Instru-
mentation Engineers (SPIE) Conference Series, 1
Liu, H., Zhou, J.-L., & Wang, S. 2011, ApJ, 732, 66
Macintosh, B., Graham, J. R., Ingraham, P., et al. 2014, Proceedings of the National
Academy of Science, 111, 12661
Macintosh, B. A., Graham, J. R., Palmer, D. W., et al. 2008, in Society of Photo-Optical In-
strumentation Engineers (SPIE) Conference Series, Vol. 7015, Society of Photo-Optical
Instrumentation Engineers (SPIE) Conference Series

136
Mahoney, W. A., Garcia, L. J., Hunt, Jr., J., et al. 2010, in Society of Photo-Optical In-
strumentation Engineers (SPIE) Conference Series, Vol. 7737, Society of Photo-Optical
Instrumentation Engineers (SPIE) Conference Series, 1
Maire, J., Perrin, M. D., Doyon, R., et al. 2010, in Society of Photo-Optical Instrumentation
Engineers (SPIE) Conference Series, Vol. 7735, Society of Photo-Optical Instrumenta-
tion Engineers (SPIE) Conference Series
Malbet, F., & Bertout, C. 1991, ApJ, 383, 814
Mamajek, E. E., & Bell, C. P. M. 2014, MNRAS, 445, 2169
Mamajek, E. E., Meyer, M. R., & Liebert, J. 2002, AJ, 124, 1670
Mamon, G. A., Glassgold, A. E., & Huggins, P. J. 1988, ApJ, 328, 797
Masset, F. 2000, A&AS, 141, 165
Mathews, G. S., Dent, W. R. F., Williams, J. P., et al. 2010, A&A, 518, L127
McClure, M. K., Calvet, N., Espaillat, C., et al. 2013, ApJ, 769, 73
Meeus, G., Salyk, C., Bruderer, S., et al. 2013, A&A, 559, A84
Meijerink, R., Glassgold, A. E., & Najita, J. R. 2008, ApJ, 676, 518
Meijerink, R., Pontoppidan, K. M., Blake, G. A., Poelman, D. R., & Dullemond, C. P.
2009, ApJ, 704, 1471
Messina, S., Desidera, S., Turatto, M., Lanzafame, A. C., & Guinan, E. F. 2010, A&A,
520, A15
Meyer, M. R., Hillenbrand, L. A., Backman, D., et al. 2006, PASP, 118, 1690
Monin, J.-L., Clarke, C. J., Prato, L., & McCabe, C. 2007, Protostars and Planets V, 395
Morbidelli, A., Bottke, W. F., Nesvorny, D., & Levison, H. F. 2009, Icarus, 204, 558
Murphy, S. J., Lawson, W. A., & Bessell, M. S. 2013, MNRAS, 435, 1325

137
Murray, N., Quataert, E., & Thompson, T. A. 2010, ApJ, 709, 191
Najita, J., Carr, J. S., & Mathieu, R. D. 2003, ApJ, 589, 931
Najita, J. R., Carr, J. S., Strom, S. E., et al. 2010, ApJ, 712, 274
Najita, J. R., Crockett, N., & Carr, J. S. 2008, ApJ, 687, 1168
Najita, J. R., Edwards, S., Basri, G., & Carr, J. 2000, Protostars and Planets IV, 457
Nakano, T., & Nakamura, T. 1978, PASJ, 30, 671
Oberg, K. I., Qi, C., Fogel, J. K. J., et al. 2011, ApJ, 734, 98
Olofsson, J., Benisty, M., Le Bouquin, J.-B., et al. 2013, A&A, 552, A4
Ott, S. 2010, in Astronomical Society of the Pacific Conference Series, Vol. 434, Astro-
nomical Data Analysis Software and Systems XIX, ed. Y. Mizumoto, K.-I. Morita, &
M. Ohishi, 139
Owen, J. E. 2014, ApJ, 789, 59
Owen, J. E., Clarke, C. J., & Ercolano, B. 2012, MNRAS, 422, 1880
Owen, J. E., Ercolano, B., Clarke, C. J., & Alexander, R. D. 2010, MNRAS, 401, 1415
Paardekooper, S.-J., & Mellema, G. 2004, A&A, 425, L9
Padgett, D. L., Cieza, L., Stapelfeldt, K. R., et al. 2006, ApJ, 645, 1283
Pascucci, I., Apai, D., Luhman, K., et al. 2009, ApJ, 696, 143
Pascucci, I., Herczeg, G., Carr, J. S., & Bruderer, S. 2013, ApJ, 779, 178
Pascucci, I., Ricci, L., Gorti, U., et al. 2014, ApJ, 795, 1
Pascucci, I., & Sterzik, M. 2009, ApJ, 702, 724
Pascucci, I., Hollenbach, D., Najita, J., et al. 2007, ApJ, 663, 383
Peck, A. B., & Beasley, A. J. 2008, Journal of Physics Conference Series, 131, 012049

138
Perrin, M. D., Maire, J., Ingraham, P., et al. 2014, in Society of Photo-Optical Instrumen-
tation Engineers (SPIE) Conference Series, Vol. 9147, Society of Photo-Optical Instru-
mentation Engineers (SPIE) Conference Series, 3
Perrin, M. D., Duchene, G., Millar-Blanchaer, M., et al. 2015, ApJ, 799, 182
Pierens, A., & Nelson, R. P. 2013, A&A,, 556, A134
Pilbratt, G. L., Riedinger, J. R., Passvogel, T., et al. 2010, A&A, 518, L1
Pinilla, P., Benisty, M., & Birnstiel, T. 2012, A&A,, 545, A81
Poglitsch, A., Waelkens, C., Geis, N., et al. 2010, A&A, 518, L2
Pontoppidan, K. M., Blake, G. A., & Smette, A. 2011, ApJ, 733, 84
Pontoppidan, K. M., Meijerink, R., Dullemond, C. P., & Blake, G. A. 2009, ApJ, 704, 1482
Pontoppidan, K. M., Salyk, C., Bergin, E. A., et al. 2014, Protostars and Planets VI, 363
Pontoppidan, K. M., Salyk, C., Blake, G. A., et al. 2010, ApJ, 720, 887
Poyneer, L. A., & Dillon, D. 2008, in Society of Photo-Optical Instrumentation Engineers
(SPIE) Conference Series, Vol. 6888, Society of Photo-Optical Instrumentation Engi-
neers (SPIE) Conference Series
Poyneer, L. A., De Rosa, R. J., Macintosh, B., et al. 2014, in Society of Photo-Optical In-
strumentation Engineers (SPIE) Conference Series, Vol. 9148, Society of Photo-Optical
Instrumentation Engineers (SPIE) Conference Series, 0
Preibisch, T., & Mamajek, E. 2008, The Nearest OB Association: Scorpius-Centaurus (Sco
OB2), 235
Pueyo, L., Soummer, R., Hoffmann, J., et al. 2015, ApJ, 803, 31
Punzi, K. M., Hily-Blant, P., Kastner, J. H., Sacco, G. G., & Forveille, T. 2015, ArXiv
e-prints, arXiv:1504.00061
139
Qi, C., Ho, P. T. P., Wilner, D. J., et al. 2004, ApJ, 616, L11
Qi, C., Oberg, K. I., Wilner, D. J., et al. 2013, Science, 341, 630
Quast, G. R., Torres, C. A. O., de La Reza, R., da Silva, L., & Mayor, M. 2000, in IAU
Symposium, Vol. 200, IAU Symposium, 28P
Rapson, V. A., Kastner, J. H., Andrews, S. M., et al. 2015, ApJ, 803, L10
Rapson, V. A., Pipher, J. L., Gutermuth, R. A., et al. 2014, ApJ, 794, 124
Rettig, T. W., Haywood, J., Simon, T., Brittain, S. D., & Gibb, E. 2004, ApJ, 616, L163
Rice, W. K. M., Armitage, P. J., Wood, K., & Lodato, G. 2006, MNRAS, 373, 1619
Rieke, G. H., Young, E. T., Engelbracht, C. W., et al. 2004, ApJS, 154, 25
Rigliaco, E., Pascucci, I., Duchene, G., et al. 2015, ApJ, 801, 31
Riviere-Marichalar, P., Menard, F., Thi, W. F., et al. 2012a, A&A, 538, L3
Riviere-Marichalar, P., Barrado, D., Augereau, J.-C., et al. 2012b, A&A, 546, L8
Riviere-Marichalar, P., Pinte, C., Barrado, D., et al. 2013, A&A, 555, A67
Rodmann, J., Henning, T., Chandler, C. J., Mundy, L. G., & Wilner, D. J. 2006, A&A, 446,
211
Rodriguez, D. R., Kastner, J. H., Wilner, D., & Qi, C. 2010, ApJ, 720, 1684
Rosenfeld, K. A., Andrews, S. M., Wilner, D. J., Kastner, J. H., & McClure, M. K. 2013,
ApJ, 775, 136
Rosenfeld, K. A., Andrews, S. M., Wilner, D. J., & Stempels, H. C. 2012a, ApJ, 759, 119
Rosenfeld, K. A., Qi, C., Andrews, S. M., et al. 2012b, ApJ, 757, 129
Ruge, J. P., Wolf, S., Uribe, A. L., & Klahr, H. H. 2014, A&A, 572, L2
Sacco, G. G., Kastner, J. H., Forveille, T., et al. 2014, A&A, 561, A42

140
Sacco, G. G., Flaccomio, E., Pascucci, I., et al. 2012, ApJ, 747, 142
Safronov, V. S., & Zvjagina, E. V. 1969, Icarus, 10, 109
Salyk, C. 2011, in IAU Symposium, Vol. 280, IAU Symposium, ed. J. Cernicharo &
R. Bachiller, 127–137
Salyk, C., Blake, G. A., Boogert, A. C. A., & Brown, J. M. 2007, ApJ, 655, L105
Salyk, C., Pontoppidan, K. M., Blake, G. A., et al. 2008, ApJ, 676, L49
Salyk, C., Pontoppidan, K. M., Blake, G. A., Najita, J. R., & Carr, J. S. 2011, ApJ, 731,
130
Sargent, B., Forrest, W. J., D’Alessio, P., et al. 2006, ApJ, 645, 395
Sargent, B. A., Forrest, W. J., Tayrien, C., et al. 2009a, ApJS, 182, 477
—. 2009b, ApJ, 690, 1193
Schisano, E., Covino, E., Alcala, J. M., et al. 2009, A&A, 501, 1013
Schisano, E., Ercolano, B., & Gudel, M. 2010, MNRAS, 401, 1636
Schmid, H. M., Joos, F., & Tschan, D. 2006, A&A, 452, 657
Schneider, G., Grady, C. A., Hines, D. C., et al. 2014, AJ, 148, 59
Semenov, D. 2010, ArXiv e-prints 1011.4770, arXiv:1011.4770
Shang, H., Glassgold, A. E., Lin, W.-C., & Liu, C.-F. J. 2010, ApJ, 714, 1733
Silverstone, M. D., Meyer, M. R., Mamajek, E. E., et al. 2006, ApJ, 639, 1138
Soummer, R., Pueyo, L., & Larkin, J. 2012, ApJ, 755, L28
Soummer, R., Sivaramakrishnan, A., Pueyo, L., Macintosh, B., & Oppenheimer, B. R.
2011, ApJ, 729, 144
Stempels, H. C., & Gahm, G. F. 2004, A&A, 421, 1159
141
Supulver, K. D., Bridges, F. G., Tiscareno, S., Lievore, J., & Lin, D. N. C. 1997, Icarus,
129, 539
Takahashi, J. 2001, ApJ, 561, 254
Takami, M., Hasegawa, Y., Muto, T., et al. 2014, ApJ, 795, 71
Tamura, M. 2009, in American Institute of Physics Conference Series, Vol. 1158, American
Institute of Physics Conference Series, ed. T. Usuda, M. Tamura, & M. Ishii, 11–16
Tanaka, H., Takeuchi, T., & Ward, W. R. 2002, ApJ, 565, 1257
Terebey, S., Shu, F. H., & Cassen, P. 1984, ApJ, 286, 529
Teske, J. K., Najita, J. R., Carr, J. S., et al. 2011, ApJ, 734, 27
Thi, W. F., van Dishoeck, E. F., Blake, G. A., et al. 2001, ApJ, 561, 1074
Thi, W.-F., Mathews, G., Menard, F., et al. 2010, A&A, 518, L125
Torres, C. A. O., Quast, G. R., da Silva, L., et al. 2006, A&A, 460, 695
Torres, C. A. O., Quast, G. R., Melo, C. H. F., & Sterzik, M. F. 2008, Young Nearby Loose
Associations, 757
Vacca, W. D., & Sandell, G. 2011, ApJ, 732, 8
Vorobyov, E. I. 2009, ApJ, 692, 1609
Wahhaj, Z., Cieza, L., Koerner, D. W., et al. 2010, ApJ, 724, 835
Wampfler, S. F., Herczeg, G. J., Bruderer, S., et al. 2010, A&A, 521, L36
Wampfler, S. F., Bruderer, S., Karska, A., et al. 2013, A&A, 552, A56
Wang, J. J., Rajan, A., Graham, J. R., et al. 2014, in Society of Photo-Optical Instrumen-
tation Engineers (SPIE) Conference Series, Vol. 9147, Society of Photo-Optical Instru-
mentation Engineers (SPIE) Conference Series, 55

142
Watson, D. M., Leisenring, J. M., Furlan, E., et al. 2009, ApJS, 180, 84
Weidenschilling, S. J. 2010, in Lunar and Planetary Science Conference, Vol. 41, Lunar
and Planetary Science Conference, 1453
Weidling, R., Guttler, C., & Blum, J. 2012, Icarus, 218, 688
Weinberger, A. J., Becklin, E. E., Schneider, G., et al. 1999, ApJ, 525, L53
Werner, M. W., Roellig, T. L., Low, F. J., et al. 2004, ApJS, 154, 1
Wichmann, R., Bastian, U., Krautter, J., Jankovics, I., & Rucinski, S. M. 1998, MNRAS,
301, L39
Wiktorowicz, S. J., Millar-Blanchaer, M., Perrin, M. D., et al. 2014, in Society of Photo-
Optical Instrumentation Engineers (SPIE) Conference Series, Vol. 9147, Society of
Photo-Optical Instrumentation Engineers (SPIE) Conference Series, 83
Williams, J. P., & Best, W. M. J. 2014, ApJ, 788, 59
Williams, J. P., & Cieza, L. A. 2011, ARA&A, 49, 67
Woitke, P., Kamp, I., & Thi, W.-F. 2009, A&A, 501, 383
Wolniewicz, L., Simbotin, I., & Dalgarno, A. 1998, ApJS, 115, 293
Wooden, D. H. 2008, Space Science Review, 138, 75
Yamamura, I., Makiuti, S., Ikeda, N., et al. 2010, VizieR Online Data Catalog, 2298, 0
Youdin, A. N., & Kenyon, S. J. 2013, From Disks to Planets, 1
Zhu, Z., Nelson, R. P., Dong, R., Espaillat, C., & Hartmann, L. 2012, ApJ, 755, 6
Zhu, Z., Stone, J. M., Rafikov, R. R., & Bai, X.-n. 2014, ApJ, 785, 122
Zsom, A., Ormel, C. W., Guttler, C., Blum, J., & Dullemond, C. P. 2010, A&A, 513, A57
Zuckerman, B., Forveille, T., & Kastner, J. H. 1995, Nature, 373, 494
Zuckerman, B., Song, I., Bessell, M. S., & Webb, R. A. 2001, ApJ, 562, L87


