Infrared Imaging Systems for wall protection in the W7-X ...
23
Infrared Imaging Systems for wall protection in the W7-X stellarator (invited) a) Marcin Jakubowski, 1, 2 Peter Drewelow, 1 Joris Fellinger, 1 Aleix Puig Sitjes, 1 Glen Wurden, 3 Adnan Ali, 1 Christoph Biedermann, 1 Barbara Cannas, 4 Didier Chauvin, 1 Marc Gamradt, 1 Henry Greve, 1 Yu Gao, 5 Dag Hathiramani, 1 Ralf K¨ onig, 1 Axel Lorenz, 1 Victor Moncada, 6 Holger Niemann, 1 Tran Thanh Ngo, 7 Fabio Pisano, 4 Thomas Sunn Pedersen, 1 and W7-X team b) 1) Max-Planck-Institut f¨ ur Plasmaphysik, 17491 Greifswald, Germany 2) University of Szczecin, Institute of Physics, 70-451 Szczecin, Poland 3) Los Alamos National Laboratory, NM 87545 Los Alamos, USA 4) University of Cagliari, 09124 Cagliari, Italy 5) Forschungszentrum J¨ ulich GmbH, IEK-4, 52428 J¨ ulich, Germany 6) Thermadiag, 13590 Meyreul, France 7) CEA Cadarache, 13108 Cadarache, France (Dated: 23 November 2018) 1
Transcript of Infrared Imaging Systems for wall protection in the W7-X ...

Infrared Imaging Systems for wall protection in the W7-X stellarator (invited)a)
Marcin Jakubowski,1, 2 Peter Drewelow,1 Joris Fellinger,1 Aleix Puig Sitjes,1 Glen
Wurden,3 Adnan Ali,1 Christoph Biedermann,1 Barbara Cannas,4 Didier Chauvin,1 Marc
Gamradt,1 Henry Greve,1 Yu Gao,5 Dag Hathiramani,1 Ralf Konig,1 Axel Lorenz,1
Victor Moncada,6 Holger Niemann,1 Tran Thanh Ngo,7 Fabio Pisano,4 Thomas Sunn
Pedersen,1 and W7-X teamb)
1)Max-Planck-Institut fur Plasmaphysik, 17491 Greifswald,
Germany
2)University of Szczecin, Institute of Physics, 70-451 Szczecin,
Poland
3)Los Alamos National Laboratory, NM 87545 Los Alamos,
USA
4)University of Cagliari, 09124 Cagliari, Italy
5)Forschungszentrum Julich GmbH, IEK-4, 52428 Julich,
Germany
6)Thermadiag, 13590 Meyreul, France
7)CEA Cadarache, 13108 Cadarache, France
(Dated: 23 November 2018)
1

Wendelstein 7-X aims at quasi-steady state operation with up to 10 MW of heat-
ing power for 30 minutes. Power exhaust will be handled predominantly via 10
actively water cooled CFC based divertor units designed to withstand power loads
of 10 MW/m2 locally in steady state. If local loads exceed this value, a risk of local
delamination of the CFC and failure of entire divertor modules arises. Infrared en-
doscopes to monitor all main plasma facing components are being prepared and near
real time software tools are under development to identify areas of excessive temper-
ature rise, to distinguish them from non-critical events, and to trigger alarms. Tests
with different cameras were made in the recent campaign. Long pulse operation en-
forces additional diagnostics design constraints: e.g. the optics need to be thermally
decoupled from the endoscope housing. In the upcoming experimental campaign a
graphite scraper element (SE), in front of the island divertor throat will be tested
as a possible means to protect the divertor pumping gap edges during the transient
discharge evolution.
a)Paper published as part of the Proceedings of the 22nd Topical Conference on High-Temperature Plasma
Diagnostics, San Diego, California, April, 2018b)All members of W7-X team are listed in R. Wolf, et al.,1
2

I. WENDELSTEIN 7-X
As fusion experiments progress towards steady state operation, plasma facing components
are undergoing a significant change in their design. Namely there is a need for transition
from inertially cooled pulsed systems to steady state designs with significant power handling
capacity. The power loads must stay below the engineering limits set by material constraints
(e.g. due to erosion or melting of the plasma facing component)2. Wendelstein 7-X, an
advanced superconducting stellarator in Greifswald, Germany aims to tackle the issues of
steady state plasma wall interactions at ITER relevant power loads. The main heating
system at W7-X is Electron Cyclotron Resonance Heating (ECRH), which uses microwave
power of up to 8 MW in continuous wave operation at a frequency of 140 GHz3. This allows
for discharges of up to 30 minutes duration, which requires a rather sophisticated power
handling concept. As W7-X operates in a non-axisymmetric configuration with a helix-like
magnetic axis and five identical magnetic field periods an open divertor structure has been
chosen, which benefits from the inherent divertor property of the magnetic configuration.
The so called island divertor utilizes natural magnetic island chains forming at the plasma
boundary (in most cases at edge iota ι- = 1) that are intersected by divertor target plates.
This concept was for the first time successfully tested in W7-AS4. The system will allow an
effective particle and energy exhaust for a wide range of plasma and magnetic parameters.
Very important for the fusion experiment operating in quasi steady state is the durability
of the plasma facing components (PFC). At W7-X rather different loads on the PFC are
expected, e.g. the central wall protection system and the ports are expected to get ca. 100
kW/m2, while the divertor should be able to cope with 10 MW/m2 for 30 minutes and even
higher transient loads. Various design and technological solutions have been developed at
W7-X to meet these high load requirements in the complicated 3D-shaped geometry of the
plasma vessel5.
High-power steady-state operation of W7-X is approached in three steps (see Table I) in
order to allow for careful tests of its components and key diagnostics.
• In the first operational phase (OP1.1) most of the graphite armor components and the
island divertor were not installed. To protect metal parts, in particular at that time
the unprotected divertor frame structure and to guarantee reasonable performance, a
so-called limiter configuration was used6. Five graphite limiters, matching the five-fold
3

FIG. 1. One out of 10 W7-X divertors. Each one consists of horizontal target modules(TM1-4h,
TM5-6h and TM7-9h), vertical target modules (TM1-3v) and divertor baffles. Depending on the
magnetic configuration different parts of the divertor are receiving power loads from plasma edge.
Target modules TM1-4h, TM1-3v form a so-called standard divertor region and TM7-9h a so-called
high iota divertor. Both names refer to magnetic configurations, which put loads on those parts of
the W7-X divertor. In the present campaign (OP1.2) the divertor is inertially cooled. From 2020
(OP2)it will be water-cooled. The observation with IR cameras is performed mostly through ca.
2 m long port tubes (labeled AEF and AEA)
symmetry of the plasma, were installed in symmetry planes at the inboard side. The
magnetic vacuum configuration has been chosen such that it has a smooth scrape-
off layer, with no stochastic region and no large magnetic islands. Thus, the limiters
efficiently intercepted > 99% of the convective plasma heat load in the SOL. It allowed
for testing of many components of W7-X (including edge diagnostics7,8).
• In the ongoing campaign (OP1.2) the machine is fully armored with carbon plasma
facing components including ten inertially cooled divertor units (see Fig. 1). During
4

OP1.2 a heating power of up to 8 MW is used with discharge duration given by limits
allowed to test the divertor performance. This required an upgrade of many diagnostics
in order to cope with longer pulse duration and higher input power9. The divertor
shape is identical to the water-cooled divertor prepared for the next campaign.
(a)
(b)
FIG. 2. (a) Sketch presenting the structure of one of the high heat flux target elements and (b)
the actual image of a target element.
• From 2020 (OP2) the divertors at Wendelstein 7-X (see Fig. 1) will be composed of
high heat load target tiles, which can sustain up to 10 MW/m2 and a lower heat load
baffle structure designed for up to 0.5 MW/m2 of continuous power loads5,10. Figure
2 presents a sketch of the internal structure of divertor target plates. The high heat
load targets consist of up to 500 mm long and 50 mm wide individual target elements
(Fig. 2(b)) which are covered with an on average 6 mm thick CFC top layer (marked as
5

gray in Fig. 2(a)) structured as 25x50 mm individual blocks. They are connected via
an AMC-copper interlayer (yellow and dark orange) to an underlying CuCrZr cooling
block (orange), which contains 4 cooling water channels. To maintain the functionality
of the target plates the interlayer may not exceed temperatures of 475 ◦C11. If local
temperatures exceed this value, the resulting stress can lead to delamination of the
CFC-Cu layer and eventually failure of these components. Because of this limitation,
a close control of the target tile temperatures is of utmost importance.
II. INFRARED DIAGNOSTICS
The possible disadvantage of an island divertor is its sensitivity to external error fields
and inaccuracies in installation of plasma-facing components. In steady state operation,
assumptions that power loads follow the symmetry of the device cannot be made without
testing it first. Monitoring of the temperature of individual components through the use of
thermocouples is impossible due to the presence of the cooling water channels. Instead, the
divertor surface temperature will be measured through infrared light observation. Ten high-
resolution infrared systems are installed to monitor the whole divertor surface consisting of 5
upper and 5 lower divertors (each equipped with a horizontal and vertical target). Based on
the temperature evolution, the heat flux from the plasma is derived using a two-dimensional
thermal model (THEODOR12). The staged approach to high performance discharges allows
us to develop the infrared diagnostics in several steps.
A. Limiter observation
Several cameras have been installed before OP1.1 to observe the limiters and the in-
ner wall throughout the campaign, among them infrared cameras to measure temperature
distribution on the limiter surfaces. Three types of IR cameras have been used. Nine NIR
cameras (SONY XC-EI50CE with a filter ¿ 0.8- µm) and one LWIR camera (DIAS Pyroview
measuring at 10-14 µm), viewing the limiter in module 5). The nine systems with NIR and
the system with LWIR camera were placed following W7-X symmetry in all AEF ports. The
data from NIR cameras suffered from plasma emission near the limiter surface. As they had
low dynamic range (8 bit) they offered a rather limited temperature range and were set to
6

campaign
(years)
main
PFC
Emax
[MJ]
tmax
[s]
Tmax
[◦C]
OP1.1
(2015-6)
limiter 4 6 800
OP1.2
(2017-8)
inertially
cooled
divertor
80 20 1600
OP2
(2020- )
water
cooled
divertor
18000 1800 1200
TABLE I. Stages of W7-X operation. The columns contain following information (from left):
campaign, main plasma facing component, maximum allowed plasma energy input, maximum
duration of a discharge, maximum surface temperature of the main plasma facing component
detect temperatures above 500 ◦C.
In Fig. 3 the temperature distribution on the limiter in module 5 measured with the
LWIR camera is shown. Additionally, a high-resolution MWIR camera (a 3–5 µm band
infrared (FLIR SC8303HD) camera (125 Hz full-frame rate, 1344×768 pixels) and a 400-
800nm AVT Prosilica GX-1050C (100 Hz full-frame rate, 1024×1024 pixels) color visible
camera co-located on the same line of sight. Both cameras delivered high spatial (ca. 1 mm)
and temporal (100-400 Hz) images of the limiter13.
B. Immersion tubes
In OP1.1. and OP1.2 the main system, which allows observation of either limiter or
divertor surface, was a so called immersion tube with a design shown in Fig. 4. It is inserted
into 9 out of 10 AEF-port flanges (see figure 1(b)) and it contains three cameras near the
inner vacuum vessel surface.
Two visible cameras (blue) each with narrow band pass filter (Hα, Hγ or carbon lines)
and one infrared (LWIR) micro-bolometric camera (red) monitor the divertor surface tem-
7

FIG. 3. View on one of the inboard limiters via LWIR camera mounted in immersion tube
FIG. 4. Overview of immersion tube with visible cameras (blue) and infrared camera (red) behind
vacuum windows (light blue and orange) in a plasma facing front plate (yellow) covered by a
rotating shutter (pink)
8

perature and edge light emission in a wide angle view. In OP1.2 all NIR cameras (used
for limiter observation in OP1.1) were replaced by the LWIR cameras (IRcam Caleo 768k
L, 1024×768 pixels, pitch 17 µm). These cameras have been built specifically to survive
in high magnetic field ≤ 3 T by separating sensor from acquisition electronics. A fish eye
lens provides wide angle view of the whole divertor surface (FOV ≈ 116◦). The spectral
response of the camera has been limited by a shortpass filter to 8-10 µm. This allows the
measurement of temperatures from 30◦C up to 5000◦C. Each pixel of the sensor is a resis-
tive microbolometer that measures a temperature rise due to impinging radiation. Although
cooled by a pressurized air flow inside the camera housing, the sensors are sensitive to tem-
perature drifts during plasma operation. The shutter in front of the camera has been used
to acquire a homogeneous reference image at ambient temperature in order to correct the
temperature drifts. The shutter is operated via pressurized air (3 bar).
In addition to the LWIR camera each immersion tube contained an absolutely calibrated
visible imaging cameras, which provide information about carbon generation and concen-
tration or the hydrogen recycling conditions. For protection against surface coatings a
pneumatically driven shutter (pink in Fig. 4) can be closed in front of the windows. Pres-
surized air-cooling (green) is necessary for cooling internal heating by the cameras and the
radiative heat load during plasma operation.
In Fig. 5 an example of the temperature distribution on the divertor surface is shown.
The thermal image is overlaid with a CAD model of the vessel. In order to match the CAD
vessel model with the image, the CAD model projection had to be deformed to match the
fish eye optical distortion of the camera14. The achievable resolution in the low iota target
area is ca. 4 mm on horizontal target (TM1-4h) and 6 mm on vertical targets (TM1-3v). In
the high iota area (TM7-9h) 5 mm can be resolved at the closer part of high iota and 9 mm
at the far end of high iota target plates.
The main diagnostic to assure safe high heat flux divertor operation of Wendelstein
7-X starting in OP2 will be a set of 10 endoscopes monitoring the divertor and baffles
surface and the plasma radiation near their surface. As each of the W7-X divertor modules
consists of target elements with dimensions of 25 mm x 50 mm (see Fig. 2b) the minimum
required optical resolution of the system, which allows measuring surface temperatures of
individual target elements, is of the order of 5 mm. Due to several constraints on the
thermographic system (e.g. to reduce neutron loads) the cameras need to be placed 2
9

FIG. 5. An infrared view of a divertor in module 2 made by a microbolometric infrared camera
inside the immersion tube. Image is overlaid with a CAD model of the vessel. Colors indicate
carbon surface temperature.
m away from the observed surfaces and therefore use a set of optics to collect the light
from the divertor surface. The advantage of InSb cameras over the LWIR micro-bolometer
cameras is lower diffraction limit at a wavelength of 4 µm rather than 10 µm and higher
pixel number on the presently available sensors. Therefore a decision has been made to
develop the optics for the InSb cameras operating at ca. 4 µm. The endoscope cannot use
entrance windows on the plasma side as during operation they would change significantly
the endoscope transmission due to deposits coming from plasmas. This would make proper
thermographic measurements virtually impossible. The design of the optical system is based
on Cassegrain optics15 following the results of JET endoscopes16.
The OP2 endoscope development was started by commissioning a prototype for tests
in OP1.2a17. Its functional sketch is presented in Fig. 7. The light coming from a divertor
enters the endoscope via a pinhole and it is transmitted via a complex system of mirrors and
10
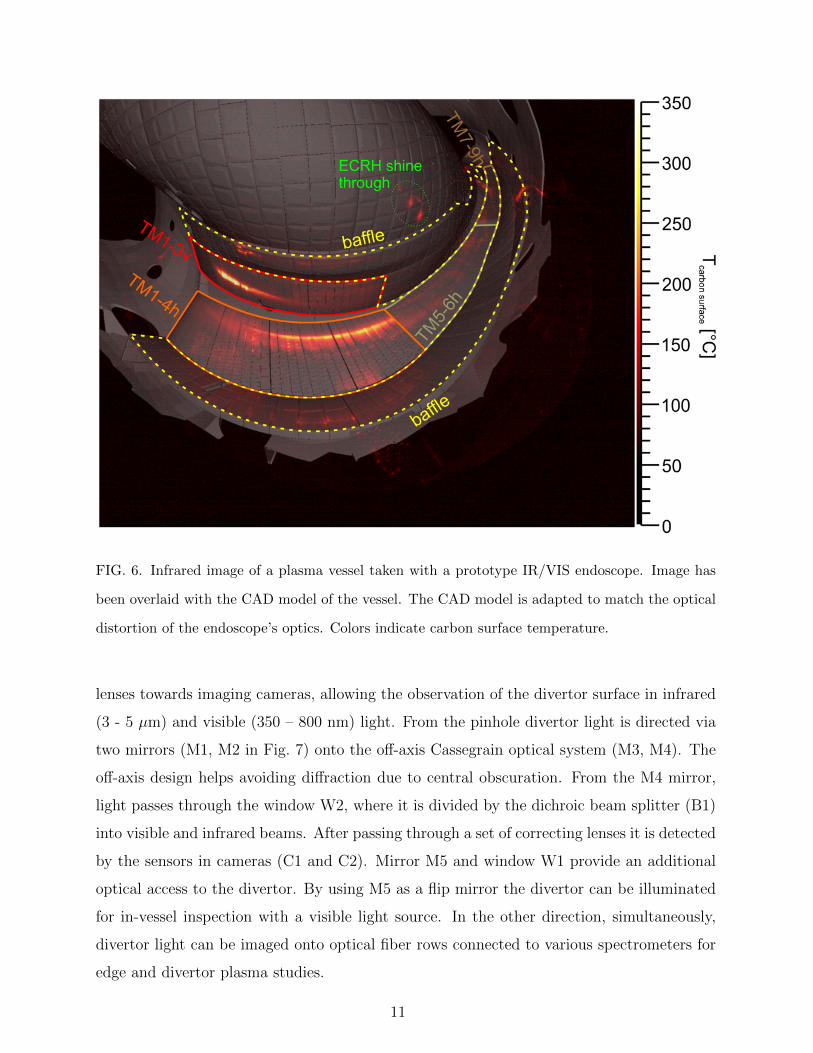
FIG. 6. Infrared image of a plasma vessel taken with a prototype IR/VIS endoscope. Image has
been overlaid with the CAD model of the vessel. The CAD model is adapted to match the optical
distortion of the endoscope’s optics. Colors indicate carbon surface temperature.
lenses towards imaging cameras, allowing the observation of the divertor surface in infrared
(3 - 5 µm) and visible (350 – 800 nm) light. From the pinhole divertor light is directed via
two mirrors (M1, M2 in Fig. 7) onto the off-axis Cassegrain optical system (M3, M4). The
off-axis design helps avoiding diffraction due to central obscuration. From the M4 mirror,
light passes through the window W2, where it is divided by the dichroic beam splitter (B1)
into visible and infrared beams. After passing through a set of correcting lenses it is detected
by the sensors in cameras (C1 and C2). Mirror M5 and window W1 provide an additional
optical access to the divertor. By using M5 as a flip mirror the divertor can be illuminated
for in-vessel inspection with a visible light source. In the other direction, simultaneously,
divertor light can be imaged onto optical fiber rows connected to various spectrometers for
edge and divertor plasma studies.
11

FIG. 7. (top) Functional sketch of the prototype IR/VIS endoscope used in OP1.2. (b) Actual
CAD model snapshot of the prototype endoscope. M1-M2: aluminium front mirrors, M3-M4: off-
axis Casegrain mirrors (Zerodur with IR/VIS coating), B1 - dichroic beam splitter, C1: infrared
camera, C2- visible camera, M5,W1 - mirror and quartz window guiding divertor light towards
spectroscopic diagnostic.
The theoretical optical performance of the prototype endoscope (used in OP1.2) is pre-
sented in Fig. 8. For the optical design, the divertor area is simplified into three flat rect-
angular areas corresponding to target areas TM1-3v, TM1-4h and TM7-9h. The optical
performance requirement is specified at the corners of these areas as a minimum contrast
of 15% MTF (modular transfer function) for a line pair of 3 (TM1-3v) or 4 mm thickness
under consideration of the inclination of the respective area relative to the incident angle.
The performance of the system is close to sufficient for the standard divertor and would
allow us to resolve in most cases power loads on each of the target elements. However, the
high iota part (7-9h) with MTF of 15% being reached at line pair width of 10-20 mm is far
from sufficient. Nevertheless, a prototype endoscope provides useful information and good
quality of infrared data for the standard divertor part (TM1-3v, TM1-4h) in OP1.2.
Choosing a pinhole instead of a window means that a constant influx of plasma impurities
will enter into the endoscope, which will result in a slow degradation of the optical system
transmission due to deposition of a:C-H layers (especially on the surface of the first mirror
M1). The use of a pinhole is complicated further by having to water cool the plasma facing
12

FIG. 8. Optical performance of prototype endoscope for different parts of the divertor. Bars denote
line pair width [mm] on object side at which MTF is at least 15% (yellow in sagital direction, red
in tangential direction). Red dashed line indicates a optical resolution to observe each of the blocks
forming target elements (see FIG. 2). Graphs present the data for different parts of the image.
From left: target area TM1-3v, target area TM1-4h, target area TM7-9h and corner points of field
of view (see Fig. 1b).
front of the immersion tube in order to keep temperatures on endoscope front head and the
cold aperture below 150◦C. Nevertheless, the choice of a pinhole over a front window seems
to be justified, as loss of reflectivity of a mirror is usually lower than loss in transmission of
a window given the same coating. Additionally several mitigation measures are applied in
order to minimize this issue. An important element is a shutter, which closes the pinhole
directly after the discharges to reduce carbon deposition on the mirrors18 and is closed during
plasma vessel conditioning, i.e. glow discharge cleaning and boronisation. Inside the shutter
a ceramic heater (made of Si3N4) is installed for regular transmission monitoring. Also, as
most of the incoming impurities will be deposited on the first mirror (M1), it is equipped
with a heater mounted on the mirror back side. According to Maruyama et al.19 heating M1
up to 400◦C will allow removal of most of the deposited amorphous hydrocarbon (a:C-H)
layers. Heater tests and an evaluation of its effectiveness to remove surface layers will be
performed after the end of this campaign.
One of the issues to be considered when designing a steady state diagnostic operating
at W7-X (OP2) is absorption of ECRH stray radiation. In X2 mode ECRH power3, this
radiation is well absorbed by the plasma for densities below the cut-off density of 1.25 · 1020
m−3. However, for higher densities, the non-absorbed power fraction can be on the order of
20% or higher, which gives ca. 8W of the ECRH stray radiation entering through a pinhole
13

FIG. 9. Optical performance of a new on-axis Cassegrain endoscope designed for OP2. Bars denote
line pair width [mm] on object side at which MTF is at least 15% Graphs present the data for
different parts of the image. From left: target area TM1-3v, target area TM1-4h, target area
TM7-9h and corner points of field of view (see Fig. 1b).
with diameter of 10 mm. As the absorption coefficients of stainless steel is only on the
order of a few percent, the rest of the stray radiation will form an equilibrium inside the
endoscope, as it will undergo a very large number of reflections from the surface until it is
finally absorbed. Therefore, any element with an absorption coefficient higher than stainless
steel will receive a significant fraction of the power that enters the endoscope. It can lead
to significant thermal loads on strongly absorbing components (e.g. ceramic) during a 30
minutes long discharge. To minimize that problem a water-cooled element, so-called “cold
aperture”, coated with Al2O3/TiO2 (with absorption coefficient of 70% for ECRH stray
radiation) is installed inside the endoscope (see Fig. 7).
A typical image of the W7-X vessel taken with the prototype endoscope is shown in
Fig. 6. The thermal image taken by the infrared camera is overlaid with the CAD model
of the vessel. Two strike lines are positioned on the standard divertor in the areas TM1-4h
and TM1-3v. The intensity indicates surface temperature. The image is corrected taking
into account optical deformations (see Sec. III B). The resolution in the TM1-4h target area
is ca. 5 mm, which would be sufficient for a protection of high heat flux divertor. However
in the high iota area (TM7-9h) the optical resolution on the divertor surface is ca. 10-20
mm, which is below the requirements. Therefore, the prototype design had to be optimized
before starting to build the required mini series of ten endoscope systems.
The optical performance requirement for the revised design has been checked and sharp-
14

FIG. 10. Snapshot of CAD design of the new endoscope installed in the AEF port of W7-X.
ened such that each target element (25x55 mm) should be resolved with at least three pixels
in each direction and that the temperature reading of the middle pixel is not biased by the
hot leading edges. After evaluation of 3 alternatives, a system similar to the existing design
was selected. Each system consists of a water cooled vacuum plug-in collecting the plasma
light via a pinhole and two front mirrors (M1 curved, M2 flat) and guiding the light to
the rear end via an axial symmetric telescope mirror system (M3 and M4 both Q-aspheric
shaped) and a sapphire vacuum window. At the air side, a beam splitter splits the plasma
light into an IR (3-5 µm) and visible (300-800 nm) light channel and each channel passes
through a series of lenses and fold mirrors before being captured on a IR and VIS cameras,
respectively.
Key differences between the existing (OP1.2) and new (OP2) design are the use of a larger
pinhole, an axial symmetric telescope instead of an off axis telescope with an additional
aperture, and a cooled IR camera with a focal ratio of f/1.2 instead of f/2. As a result,
the predicted line pair width at 15% MTF is a factor 2-3 finer at TM1-3v and TM1-4h
and a factor 4-5 finer at TM7-9h than for the prototype design, compare Fig. 8 and Fig. 9.
In addition, in the revised mechanical design, the optical components are thermally and
mechanically isolated from the water cooled head to prevent imposed deformations that
otherwise would harm the optical performance.
15
C. Scraper element observation
Another object for infrared monitoring has been added with the installation of a divertor
extension in two modules, so called scraper elements (SE)20. In OP1.2b, a separate imaging
system21, will be used with a view towards the upper divertor and its scraper element in
Module 5. This diagnostic combines infrared images (up to 900 Hz framing rate with 200x200
sub-windowing, capable of measuring temperatures to 1500 ◦C), interference filtered visible
images with 1.5 mm spatial resolution, and a spectrometer averaging over the imaging
spatial region, with 0.5 nm resolution from 200-1100 nm. A circular field of view across
1000 mm, includes most of the 700x400 mm graphite scraper element. It is made possible
by viewing through a shuttered 4-mm diameter pinhole, via two in-vacuum aluminum 90◦
off-axis parabolic mirrors. The light is then relayed out through an uncoated sapphire
vacuum window (137 mm diameter), where it is split into visible and IR paths using a 150
mm diameter silicon beam-splitter, and passed to the cameras. The metal optics in the
AEK51 port provide a nearly aberration free image.
III. SOFTWARE DEVELOPMENT
A. Data acquisition
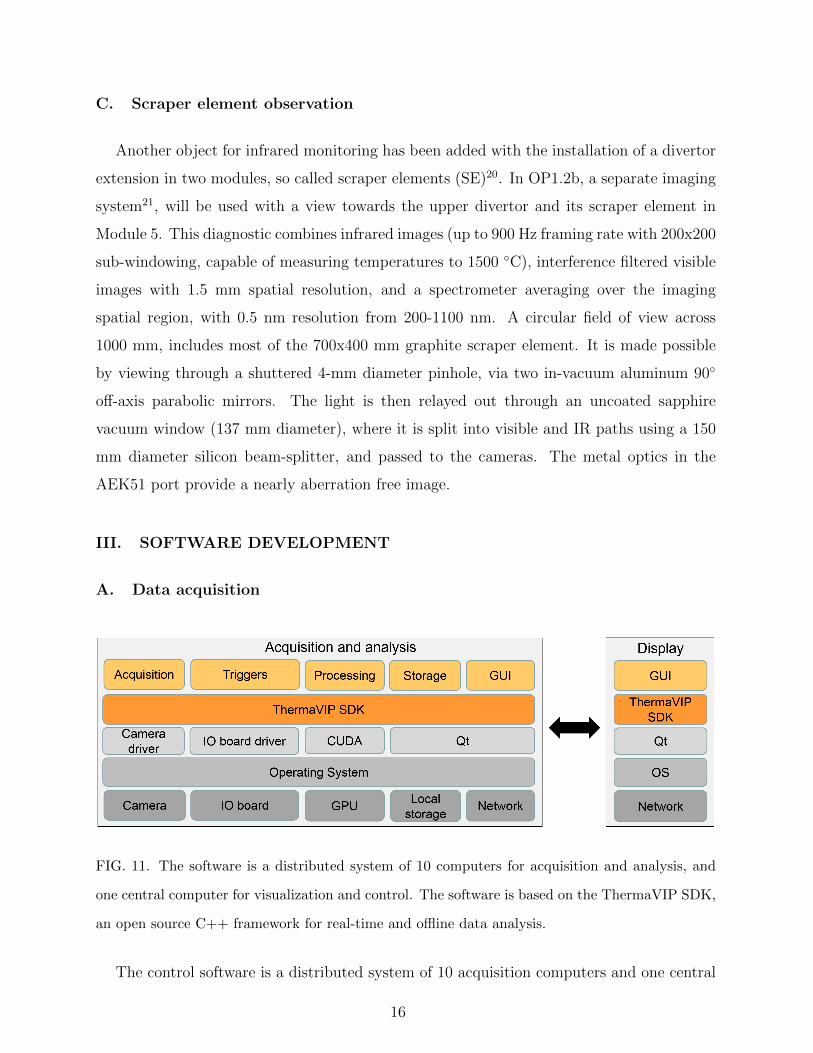
FIG. 11. The software is a distributed system of 10 computers for acquisition and analysis, and
one central computer for visualization and control. The software is based on the ThermaVIP SDK,
an open source C++ framework for real-time and offline data analysis.
The control software is a distributed system of 10 acquisition computers and one central
16

server computer in the control room. It consists of a set of plugins that extend the func-
tionalities of ThermaVIP22, an open source C++ framework for real-time and offline data
analysis developed at CEA/ThermaDIAG. This framework is based at the same time on the
CUDA library for GPU computation and the Qt library for operating system portability
(see Fig. 11). The acquisition computers acquire the video streams from the thermographic
cameras and they send them in real-time to the control room for visualization and control
of the system.
B. Lens distortion correction
Finding a good camera model and correcting the lens distortion for IR imaging quality is
really important, especially for cameras with wide angle lenses, characterized by large image
distortions. The mathematical model most commonly used for camera calibration is the pin-
hole camera model, in which the camera aperture is described approximately as a point23.
This model describes the relationship between each 3D point and its image projection in the
image plane, by considering the position and orientation of the camera (extrinsic parame-
ters), the position of the principal points and focal lengths in pixels (intrinsic parameters),
and the lens distortion coefficients.
A quite accurate estimation of the intrinsic parameters and lens distortion coefficients of
the model of the immersion tubes has been obtained14 with multiple views of a chessboard-
like object, by using the algorithm in24. The algorithm consists of a closed-form solution,
followed by a nonlinear refinement based on the maximum likelihood criterion.
The model has been then completed by adding the extrinsic parameters, i.e. position and
orientation of the camera. These parameters have been initialized by the nominal position
and orientation of the immersion tubes, and refined with a nonlinear least-square criterion
based on some control points and a simplified CAD model of the PFCs.The undistorted im-
ages are presented in Fig. 5 and Fig. 6, which have been achieved by adapting the projection
of the vessel CAD model to the optically distorted (fish eye distortion) image14.
17
C. Real-time protection
During the high heat flux operation of Wendelstein 7-X from OP2 onwards, the real-time
protection of the plasma facing components will be mandatory during plasma operation
to avoid degradation of critical plasma facing components. The endoscopes will be used
to detect overheated areas on the divertor surface (with temperature above 1000◦C), and
failures in thermal connection of the CFC elements of the divertor to the cooling structure
and symmetry and structure of the power loads in the 3D environment of Wendelstein 7-X.
As the discharge will be up to 30 minutes long, an excessive amount of data (up to 2.4
TB/day) is expected to be submitted to the image processing routines. Therefore, all the
data storage, real-time analysis and a major fraction of the post-processing needs to be
fully automatized. The data processing is performed with the software packages discussed
in Sec. III A, which rely on intelligent vision system concepts. The strategy of analyzing
the infrared images of W7-X divertor is composed of two main tasks: hot spot detection
and thermal event recognition25,26. Hot spots on the carbon plasma facing components may
appear for a number of reasons:
• Overheating due to excessive power loads. As mentioned above, the target elements
can withstand heat fluxes up to a certain level. For instance, baffle structures can
cope with steady state heat flux density of up to 0.5 MW/m2. It may happen that
due to a change of plasma configuration or bootstrap currents additional power loads
reach baffle elements.
• Delaminated carbon tiles will lose their thermal connection to cooling structures of
the divertor and therefore will not be able to efficiently remove the power stored in
their bulk material. This will result in an elevated CFC temperature.
• Due to carbon erosion and re-deposition thin surface layers are formed on the plasma
facing components during plasma operation27. Typically they have very a poor thermal
connection to the bulk material and therefore heat up very fast and reach much higher
temperatures than a virgin surface of the PFCs28.
• Localized fast particle losses from the neutral beam heating system (NBI) can also
produce the hot spots29, the duration of the beam injection is up to 10 s. First
injections will be performed during second part of the OP1.2 campaign.
18

FIG. 12. (a) Surface temperature curves for tiles of different status. Data were gained by FEM
calculations. Heating was switched off at toff =10 s. The different transient behaviors for target
tiles with a surface layer, delamination, or intact are visible. (b) Result of tests in experimental
facility GLADIS. Reproduced from [Rodatos, et al., Rev. Sci. Instr., 87 2016 023506] with the
permission of AIP Publishing.
• Dust particles formed inside the vessel tend to be redeposited during the discharge.
As they are poorly thermally connected, they can become very bright.
The video streams are analyzed online by means of computer vision techniques to de-
tect thermal events like hot-spots, strike-lines and other dangerous events. As discussed
in Sec. III C hot-spots are classified between power overloads and surface layers to avoid
false alarms. A scene model provides a pixel-wise information of the target elements, their
material, emissivity and maximum allowed temperature. In future, a risk analysis will be
performed on each detected thermal event taking into account the target information, the
hot-spot size and temporal evolution. If the temperature reaches a certain threshold an
19
alarm is generated to the interlock system which connects with the central Safety System
of the device. All the detected thermal events and alarms are shown in the control room in
the form of a thermal map and they are stored in a SQL database for further offline analysis.
An intelligent real time protection system, which is based on the imaging of the PFCs
with the infrared cameras must be able to classify the events based on their origin. At
the moment the algorithms are being developed to aid such classification22,25,26. One of
the methods is to apply transient power fluxes and to observe the time evolution of the
surface temperature (see Fig. 12). Due to vastly different thermal conductivity and thermal
capacity, a delaminated tile will show a measurably different temporal behavior of surface
temperature than a healthy tile, or one with surface layers. The results of Fig. 12(a) have
been modeled with the finite element method code ANSYS25. Results from four studied
cases are presented, where time traces are shown for a load scenario where 10 MW/m2 have
been applied for 10 seconds. The reference case is shown in green, an intact tile, where after
about 5 s, a thermal equilibrium at T≈ 700◦ C is reached. The intact tiles show the smallest
amplitude of temperature change due to incoming power flux. If a target element has a
corner delamination of the graphite from the underlying cooling structure with a surface
area of 58 mm2 the difference from the intact tile is rather small. However, with increasing
delamination area, the time to reach thermal equilibrium is longer and it is established at
much higher surface temperatures. Also the cooling of the target element after switching
off the heat loads needs more time. The fourth case is a tile with a surface layers made
from a:C-H co-deposits with thickness on the order of a few µm. Here, in contrast, a very
fast thermal response to the applied power loads is observed. The reason are low thermal
capacity of the co-deposited layer and poor thermal connection to underlying bulk material.
These different thermal reactions of the virgin tiles, the delaminated tiles and those with
co-deposits will be used at W7-X to classify the observed areas with elevated temperatures
by introducing a so-called τ criterion25:
τ =T (t)
∂tT (t)(1)
This algorithm together with algorithms to detect hot spots, their clustering and surface
layer detection were adapted to work in near real-time at W7-X. The experiments per-
formed in the GLADIS facility on pre-series, water-cooled tiles were able to detect CFC/Cu
20

delaminations26. In the present campaign surface layers and hot spots can be detected in
real-time. The next step will be to hardwire a connection to the W7-X fast interlock system
in order to trigger alarms. This will be tested in the following months and it is planned
to be operating at the beginning of OP2. More sophisticated tools like real-time strike line
tracking and control with help of deep learning methods will be developed in the course of
OP2.
In order to accommodate changes in the emissivity of a divertor graphite surface a compari-
son with measurements of the divertor calorimetry will be performed. In thermal equilibrium
(indicated by the calorimetry) all target elements should have the same surface temperature.
A difference in IR measurements indicates different emissivity.
IV. SUMMARY
Wendelstein 7-X is equipped with a number of infrared diagnostics in order to protect
plasma facing components in three dimensional environment of a stellarator experiment.
Several challenges have been tackled while developing the diagnostic. First and foremost to
design optics allowing high resolution IR observation with a wide angle field of view. The
endoscopes have to operate in quasi steady state (up to 30 minutes), i.e. be resistant to
ECRH stray and plasma thermal radiation. Additionally, it is required to process in near
real time as well offline large amount of data. One of the highlights of the W7-X infrared
protection system is the application of novel techniques for image and data processing.
ACKNOWLEDGMENTS
This work has been carried out within the framework of the EUROfusion Consortium and
has received funding from the Euratom research and training programme 2014-2018 under
grant agreement No 633053. The views and opinions expressed herein do not necessarily
reflect those of the European Commission.
21

REFERENCES
REFERENCES
1WOLF, R., ALI, A., ALONSO, A., et al., Nuclear Fusion 57 (2017).
2FEDERICI, G., SKINNER, C., BROOKS, J., et al., Nuclear Fusion 41 (2001) 1967.
3ERCKMANN, V., BRAUNE, H., LAQUA, H. P., et al., The 10 MW ECRH and CD
System for W7-X, in AIP Conference Proceedings, volume 691, pp. 213–223, AIP, 2003.
4GRIGULL, P., MCCORMICK, K., RENNER, H., et al., Fusion Engineering and Design
66-68 (2003) 49.
5BOSCARY, J., STADLER, R., PEACOCK, A., et al., Fusion Engineering and Design 86
(2011) 572.
6Sunn Pedersen, T., ANDREEVA, T., BOSCH, H.-S., et al., Nuclear Fusion 55 (2015)
126001.
7KONIG, R., BIEL, W., BIEDERMANN, C., et al., Review of Scientific Instruments 85
(2014) 11D818.
8KRYCHOWIAK, M., ADNAN, A., ALONSO, A., et al., Review of Scientific Instruments
87 (2016) 11D304.
9HATHIRAMANI, D., ALI, A., ANDA, G., et al., Fusion Engineering and Design (2018).
10GREUNER, H., BOSWIRTH, B., BOSCARY, J., et al., Fusion Engineering and Design
84 (2009) 848.
11GREUNER, H., BOESWIRTH, B., BOSCARY, J., and MCNEELY, P., Journal of Nuclear
Materials 367-370 (2007) 1444.
12SIEGLIN, B., FAITSCH, M., HERRMANN, A., et al., Review of Scientific Instruments
86 (2015) 113502.
13WURDEN, G., BIEDERMANN, C., EFFENBERG, F., et al., Nuclear Fusion 57 (2017)
056036.
14PISANO, F., CANNAS, B., JAKUBOWSKI, M., NIEMANN, H., and Puig Sitjes, A., to
be published .
15CANTARINI, J., HILDEBRANDT, D., KONIG, R., et al., Review of Scientific Instru-
ments 79 (2008) 10F513.
22

16BALBOA, I., ARNOUX, G., EICH, T., et al., Review of Scientific Instruments 83 (2012)
10D530.
17CHAUVIN, D., JAKUBOWSKI, M., JENZSCH, H., GAMRADT, M., and LORENZ, A.,
Design and manufacturing progress of IRVIS endoscopes prototypes for W7-X divertor
temperature monitoring Preprint of Paper to be submitted for publication in, in Proceed-
ings of 29th Symposium on Fusion Technology (SOFT 2016), 2016.
18VON KEUDELL, A., HOPF, C., SCHWARZ-SELINGER, T., and JACOB, W., Nuclear
Fusion 39 (1999) 1451.
19MARUYAMA, K., JACOB, W., and ROTH, J., Journal of Nuclear Materials 264 (1999)
56.
20HOLBE, H., Sunn Pedersen, T., GEIGER, J., et al., Nuclear Fusion 56 (2016) 026015.
21WURDEN, G. A., FELLINGER, J., BIEDERMANN, C., et al., Review of Scientific
Instruments (2018).
22Puig Sitjes, A., JAKUBOWSKI, M., ALI, A., et al., Fusion Science and Technology (2017)
1.
23FORSYTH, D. and PONCE, J., Computer vision : a modern approach, Pearson, 2012.
24ZHANG, Z., IEEE Transactions on Pattern Analysis and Machine Intelligence 22 (2000)
1330.
25RODATOS, A., GREUNER, H., JAKUBOWSKI, M. W., et al., Review of Scientific
Instruments 87 (2016) 023506.
26ALI, A., JAKUBOWSKI, M., GREUNER, H., et al., Physica Scripta T170 (2017) 014074.
27LIKONEN, J., COAD, J., VAINONEN-AHLGREN, E., et al., Journal of Nuclear Materials
363-365 (2007) 190.
28HILDEBRANDT, D., GADELMEIER, F., GRIGULL, P., et al., Thermographic obser-
vation of the divertor target plates in the stellarators W7-AS and W7-X, in Journal of
Nuclear Materials, volume 313-316, pp. 738–742, 2003.
29WERNER, A., WELLER, A., DARROW, D. S., and TEAM, T. W.-A., Review of Scien-
tific Instruments 72 (2001) 780.
23