Infovis and data george, laura, tjerk. .
23
infovis and data george, laura, tjerk
-
date post
21-Dec-2015 -
Category
Documents
-
view
213 -
download
0
Transcript of Infovis and data george, laura, tjerk. .

infovis and datageorge, laura, tjerk

http://www.isrc.umbc.edu/HCIHandbook/figures/28-10.jpg

data - what is it?
data is simple facts, lacking any context.
within infovis, the strategy is totransform data into a relation or set of relations that are more structured and easier to map to visual forms

Data are observational measurements that have been recorded in some way, whereas information is data that is generalized, ordered and contextualized in ways that give them meaning. Information thus is selective toward data, separating the important from the relatively unimportant. [Mennis et al., 2000]
data - what is it?

data - what is it?
in order for data to be infovis-ready, it needs to be:
readable - supporting discourse about the subject
data-driven
information-driven, are there visible variations
infovis concerns the gestalt of data

from raw data to data tables
via data transformations
human interaction
creates data tables

data tables
dimensionality is the referral to the numberof input variables, the number of outputvariables, both together or even the number of spatial dimensions in the data
2d and 3d dimensionality creates understandable data tables.
data tables can be multidimensional visualizations


data tables
data tables can consist of cases and variablesvariables describe relations between casesmathematically, a relation is a set of tuplesa tuple is a sequence (also known as an "ordered list") of objects, each of a specified type

data tables
three types of variables are mentioned
nominal - without natural order
ordinal - obeys a lessthan relation
quantitative - calculatable
within these categories, different types of transformation can be processed.

data tables
The data scale of a parameter is given by the statistic attributes of the values.
- nominal: Unordered set (only = or != relations) example: film titles. - ordinal: Ordered set (=, !=, <, and > relations) example: film ratings. - discrete: Numeric range (Integer, arithmetic possible) example:film year. - continuous: Numeric range (Real/float numbers,
arithmetic possible) example: film length. - binary: true or false (Boolean arithmetic) example: film available.
data tables
metadata - descriptive information about data
important for choosing visualisations
metadata often informs about data tables and their structure
a good structure creates better insights in data

data tables
metadata is ”data about data” which allows computers to process information more effectively. [Dmoz, 2004]
two meanings- catalogue (find &get it) - context data (understand it)
and three applications - find data. that is the functionality of catalogue-systems.- get data. meta-data is needed in interchange and real transportation of data.- understand data. metadata help to interpret and understand the numbers, words and other things denoted as data

data tables
QuickTime™ and aGIF decompressor
are needed to see this picture.
data tables
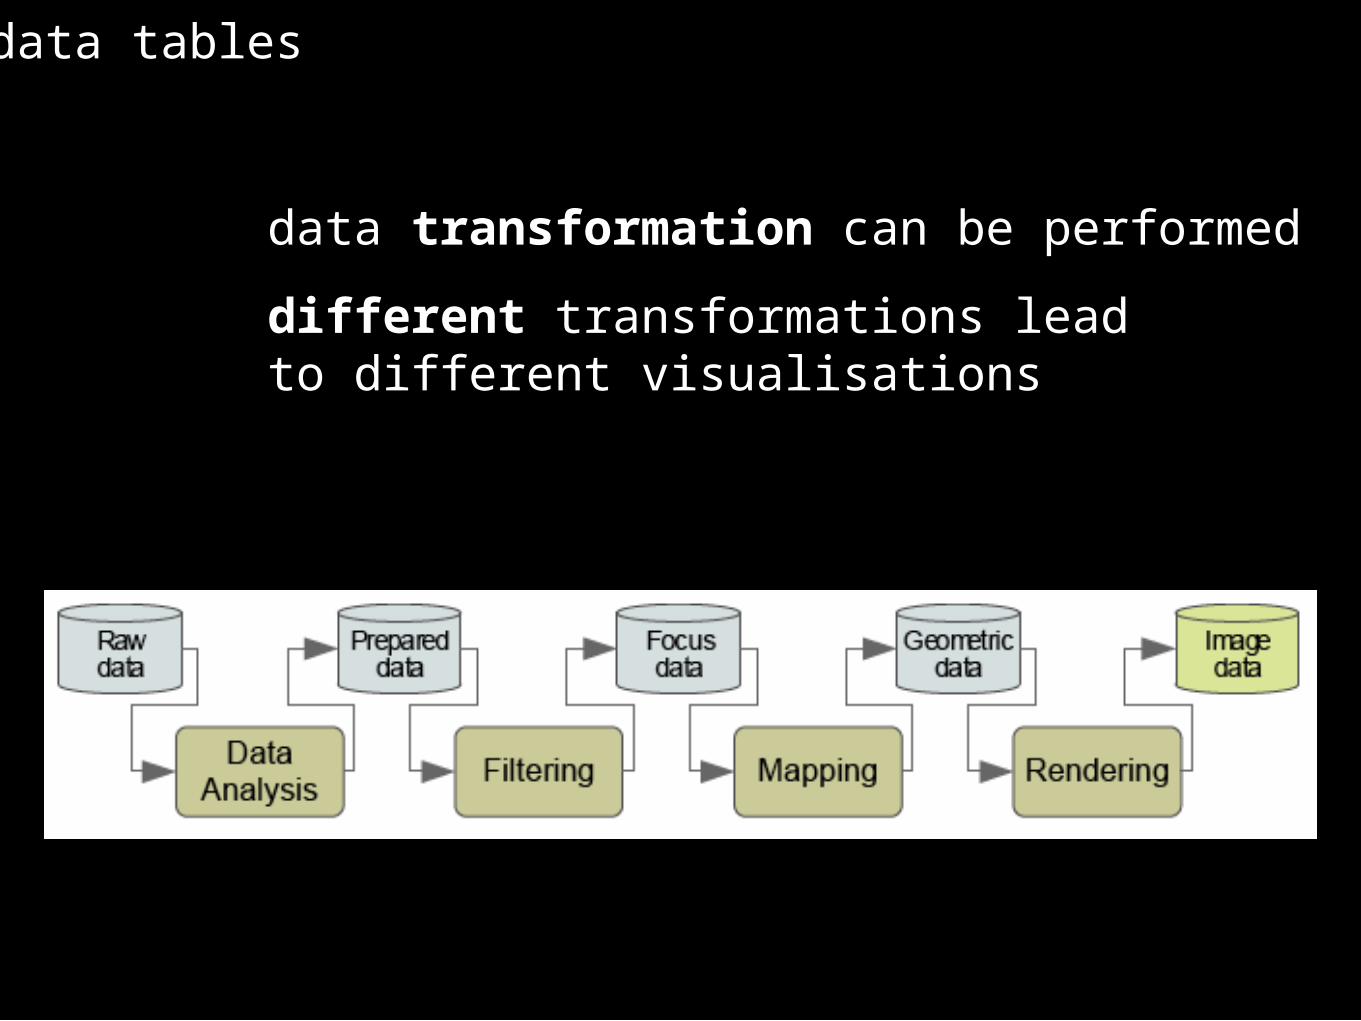
data transformation can be performed
different transformations leadto different visualisations

values: derived valuesstructure: derived structurevalues: derived structurestructure: derived values
data transformations

an example

visual structures and mappings
goals of visualization are: - making invisible correlations visible- treat graphic aspects of display as the critical element- providing interfaces for asking questions of the data

choices in visualisation

visual structures and mappings
problems with visualisation
- technical constraints [screen]- human work patterns- chartjunk [Tufte]
‘Chartjunk consists of decorative elements that provide no data and cause confusion’

chartjunk example

perception and interpretation
- must connect with the user via sensory and arbitrary conventions - does it allow modifications? - does it allow zooming [physical or semantic]?

“There is a trade-off between amount of information, simplicity, and accuracy. It is often hard to judge what users will find intuitive and how [a visualization] will support a particular task” [Tweedie et al]