INFORMS Presentation
16
-
Upload
mark-ehlen -
Category
Technology
-
view
402 -
download
0
Transcript of INFORMS Presentation

2
National Infrastructure Simulation and Analysis Center (NISAC): Economics
3
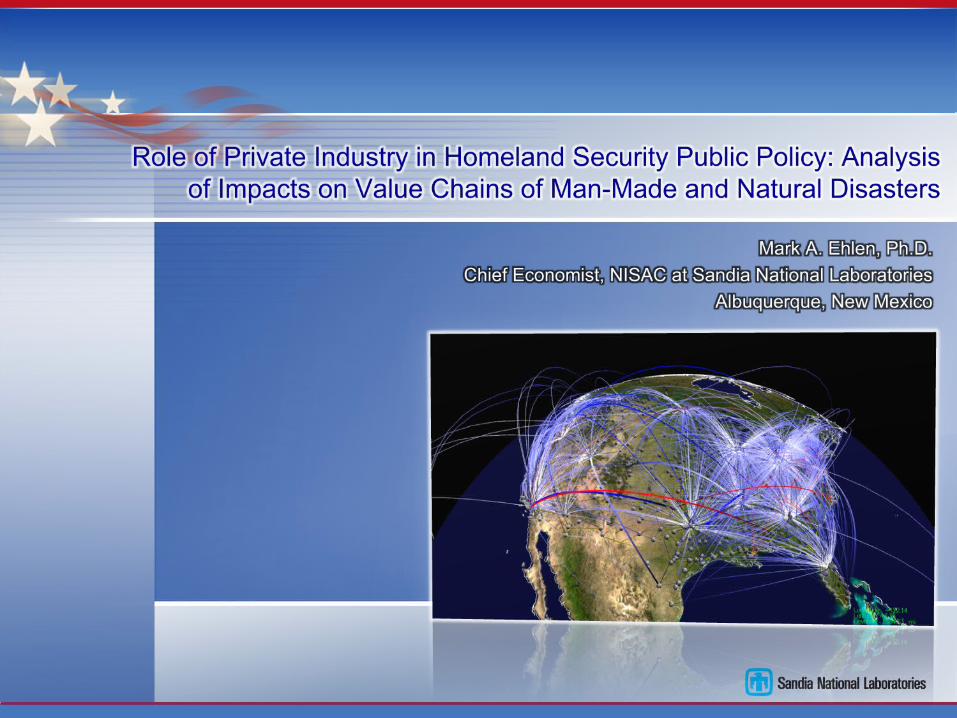
How economics fits into the broader NISAC analyses

4
Homeland security is moving from critical infrastructure protection (CIP) to critical infrastructure resilience (CIR)
4
The National Infrastructure Protection Plan and Sector-Specific Reports call for increased infrastructure resilience.
Resilience, however, is generally not well defined by DHS and ultimately is un-actionable in a systems engineering or operations research sense
Our working definition:“Given the occurrence of a particular, disruptive event (or set of events), the resilience of a system to that event (or events) is that system’s ability to efficiently reduce both the magnitude and duration of the deviation from desired system performance levels.”
While CIP tends to be focused on assets, CIR needs to be focused on systems

5
The economic criticality of commodities and assets within the Chemical Sector Critical Infrastructure is driving federal regulations
5
Motivation: Terrorist acts targeted at chemical facilities could have cascading impacts and potentially significant economic consequences on a national scale
Goal: develop a defensible methodology for evaluating a chemical facility’s economic criticality:
Identify chemical facilities with high degrees of economic criticality, by measuring system-wide impacts resulting from the disabling of these facilities
Our definition of economic criticality: “For a given disruption scenario that includes specific disruption duration, the economic criticality of a facility (or group of facilities) is the level of severity that the disabling or destruction of that facility (or group) has on the entire economy of the United States; as the severity of consequences increases, so does a facility’s (group’s) economic criticality.”

6
Increased resilience and decreased criticality require value chain modeling at the appropriate level of resolution
Value chains are the the right resolution at which to evaluate industry resilience and criticality
• Macroeconomic models are too general, and often useless to private industry
• Microeconomic (individual firm or household) models estimates are too particular, too proprietary
• Mesoeconomic, value chain models capture the middle layer between individual firms and the national sector.
DHS modeling mandate:• National in scope• Asset-based in fidelity• Dynamic in simulation
6
Macro/NationMacro/Nation
Micro/FirmsMicro/Firms
Meso/MarketsMeso/
Markets

7
What mesoeconomic value chains look like: sales and shipments

8
What mesoeconomic value chains look like: buyer behavior

9
Essential value chain modeling units
Firms: • Synthetic representations of “real world” firm
operations (internal, markets, transportation) capture essential internal dynamics, constraints, and “velocities” of production and shipments.
Supply chains:• Logistics networks (state and control) capture
traditional OR tasks such as minimizing time/cost/distance for internal operations of large companies
Value chains:• Collections of firms and supply chains,
constrained by modes of transportation (rail, road, water, pipeline), regional locations, “velocities” of production and shipments, and traditional market and supply chain effects (e.g., bullwhips)
10
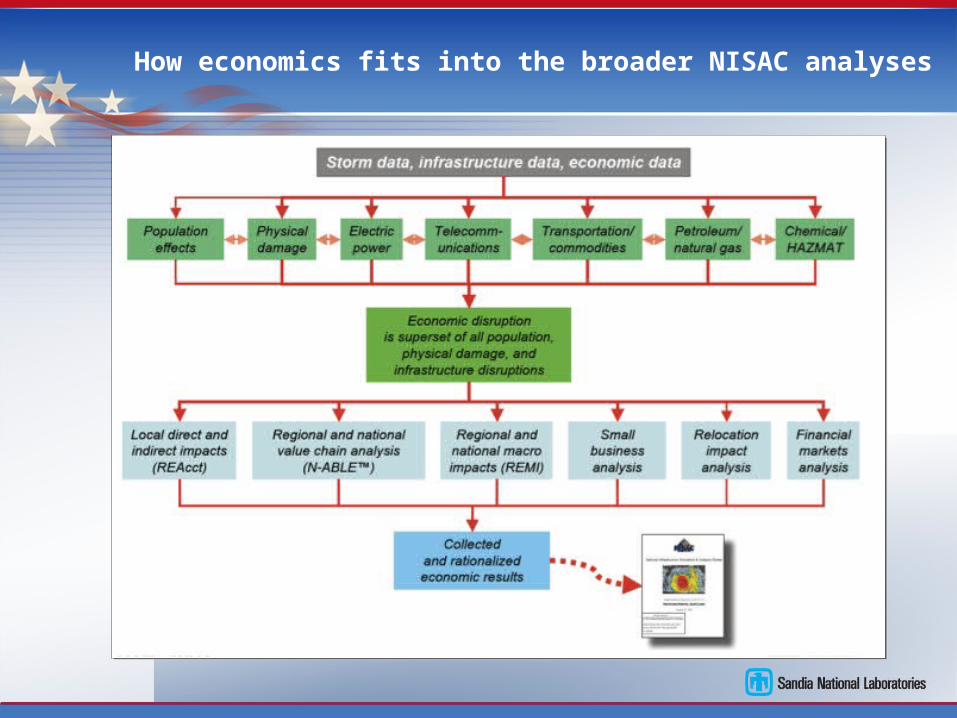
Value chain analysis: impacts of a pandemic on the manufactured food value chain: regional markets
11
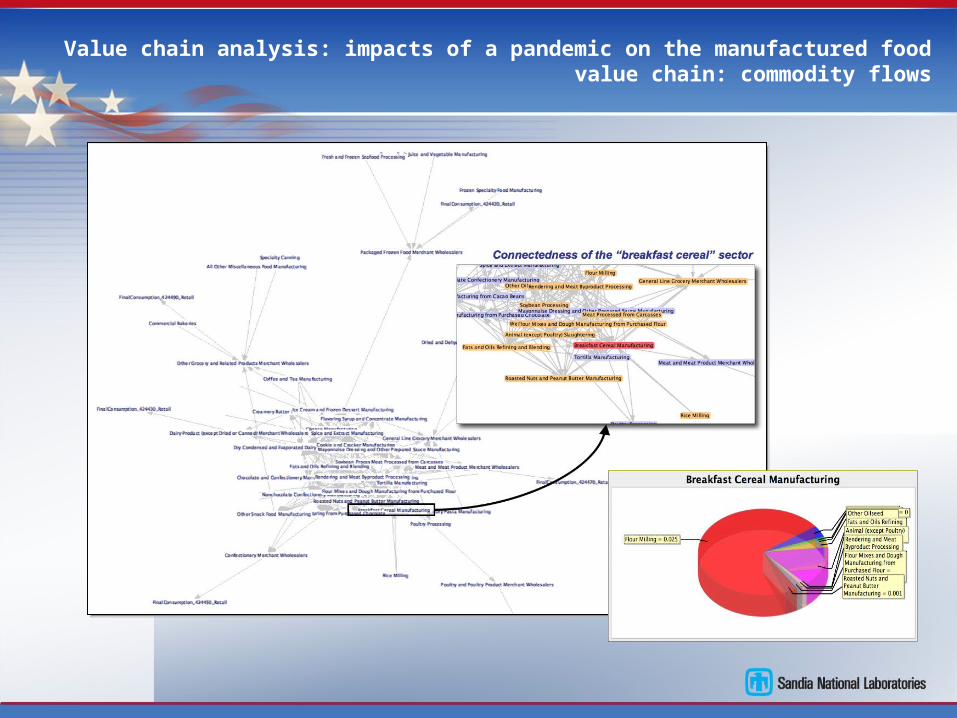
Value chain analysis: impacts of a pandemic on the manufactured food value chain: commodity flows

12
Value chain analysis: impacts of a pandemic on the manufactured food value chain: results
Impacts• Loss of transportation resources (e.g., drivers) and
potential cross-state inspections will slow and reduce shipments.
• Infected communities will hoard food, creating “runs” on supermarkets and national “bull whips”
• Metropolitan areas could see food shortages
Policy implications• Pre-emptive overproduction and stockpiling of food
at regional warehouses will help national “ride out” a national pandemic.
• Cooperation between manufactured food companies, transportation companies, and regional response agencies is essential.
• Cooperative understanding, between private industry and government, of potential impacts is critical
13
Value chain analysis: what are the impacts of stopping chlorine shipments during elevated threat levels?
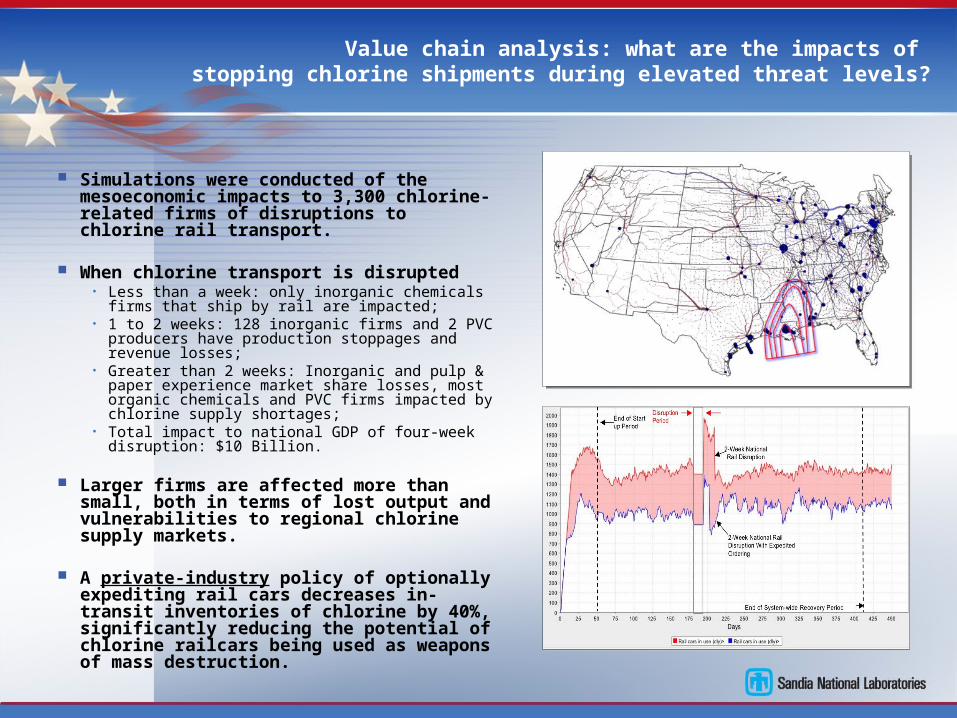
Simulations were conducted of the mesoeconomic impacts to 3,300 chlorine-related firms of disruptions to chlorine rail transport.
When chlorine transport is disrupted• Less than a week: only inorganic chemicals firms that
ship by rail are impacted;• 1 to 2 weeks: 128 inorganic firms and 2 PVC
producers have production stoppages and revenue losses;
• Greater than 2 weeks: Inorganic and pulp & paper experience market share losses, most organic chemicals and PVC firms impacted by chlorine supply shortages;
• Total impact to national GDP of four-week disruption: $10 Billion.
Larger firms are affected more than small, both in terms of lost output and vulnerabilities to regional chlorine supply markets.
A private-industry policy of optionally expediting rail cars decreases in-transit inventories of chlorine by 40%, significantly reducing the potential of chlorine railcars being used as weapons of mass destruction.

14
Value chain example: milk & milk products: Hurricane Katrina
Structure of value chain
Large number of regionally dispersed bulk producers (milk) who ship to concentrated intermediate producers (cheese, butter, dry milk, frozen milk products), who then ship to regionally dispersed customers (primarily in metro areas).
Impacts of hurricane
During disruption, bulk and intermediate markets are largely unaffected; during recovery, however, there are multiple albeit mild aftershocks to demand and shipments.
Insignificant loss of GDP. Minor shortages occur in the south metro areas (FL,
TX, CA), due to concentration of intermediate producers in the north (Great Lakes region).
• Recovery takes 9 weeks, due to relative tightness in the bulk milk market that propagates to the intermediate markets.
a Red = truck shipments
Milk & milk products transportation a

15
Supply chain example: Goodyear Tire & Rubber Company
Structure of value chain• As compared with chlorine and milk, relatively
small number of bulk and intermediate producers.
Impacts of hurricane
• Loss of 90% of carbon black supply and 20% of rubber supply to domestic tire operations.
• Output across value chain only reduces by 60%, due to reallocation of on-site inventories and shipments that help GYT&R “ride out” most of the disruption.
• In transit inventories triple, as these shipments must travel a lot farther (a “small numbers” problem).
• Recovery period is only one week.
GYT&R transportationa
aBlue = rail shipments; red = truck shipments

16
Summary
Homeland security value chain modeling is not about modeling the industry but rather modeling its important functional characteristics, particularly during extreme events
• Its not about “what you do,” but “how you typically do it”• Example: members of the Chlorine Institute• Example: Goodyear Tire & Rubber Company
This level of consequence, resilience, and policy analysis requires collaboration with private industry
• Prototypical, functional behaviors• Validation of system-wide value chain impacts• Development of “win-win” private-industry policies that meet national
homeland security objectives