Informing the Transmission Discussion
21
Informing the Transmission Discussion A Look at Renewables Integration and Resilience Issues for Power Transmission in Selected Regions of the United States January 2020
Transcript of Informing the Transmission Discussion
Informing the Transmission DiscussionA Look at Renewables Integration and Resilience Issues for Power Transmission in Selected Regions of the United States
January2020
Regional DiscussionNEW YORK ISO
Copyright © 2020 by ScottMadden, Inc. All rights reserved.
ContentsNew York ISO Discussion
§ Overview
§ Transmission Topography and Investment
§ Resilience Issues
§ Renewables Integration
§ Implications for Transmission
§ Sources
71
Copyright © 2020 by ScottMadden, Inc. All rights reserved. 72
OverviewNew York ISO Discussion
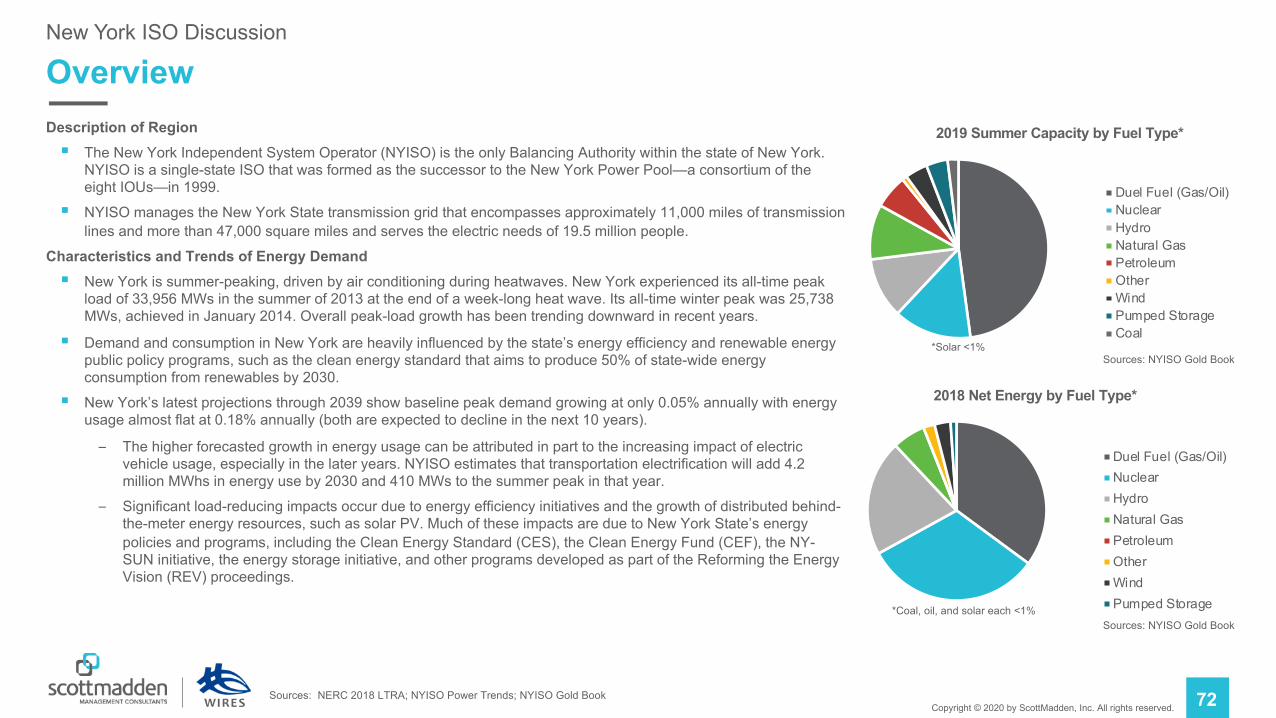
Description of Region§ The New York Independent System Operator (NYISO) is the only Balancing Authority within the state of New York.
NYISO is a single-state ISO that was formed as the successor to the New York Power Pool—a consortium of the eight IOUs—in 1999.
§ NYISO manages the New York State transmission grid that encompasses approximately 11,000 miles of transmission lines and more than 47,000 square miles and serves the electric needs of 19.5 million people.
Characteristics and Trends of Energy Demand§ New York is summer-peaking, driven by air conditioning during heatwaves. New York experienced its all-time peak
load of 33,956 MWs in the summer of 2013 at the end of a week-long heat wave. Its all-time winter peak was 25,738 MWs, achieved in January 2014. Overall peak-load growth has been trending downward in recent years.
§ Demand and consumption in New York are heavily influenced by the state’s energy efficiency and renewable energy public policy programs, such as the clean energy standard that aims to produce 50% of state-wide energy consumption from renewables by 2030.
§ New York’s latest projections through 2039 show baseline peak demand growing at only 0.05% annually with energy usage almost flat at 0.18% annually (both are expected to decline in the next 10 years).
– The higher forecasted growth in energy usage can be attributed in part to the increasing impact of electric vehicle usage, especially in the later years. NYISO estimates that transportation electrification will add 4.2 million MWhs in energy use by 2030 and 410 MWs to the summer peak in that year.
– Significant load-reducing impacts occur due to energy efficiency initiatives and the growth of distributed behind-the-meter energy resources, such as solar PV. Much of these impacts are due to New York State’s energy policies and programs, including the Clean Energy Standard (CES), the Clean Energy Fund (CEF), the NY-SUN initiative, the energy storage initiative, and other programs developed as part of the Reforming the Energy Vision (REV) proceedings.
2019 Summer Capacity by Fuel Type*
Duel Fuel (Gas/Oil)NuclearHydroNatural GasPetroleumOtherWindPumped StorageCoal
2018 Net Energy by Fuel Type*
Duel Fuel (Gas/Oil)NuclearHydroNatural GasPetroleumOtherWindPumped Storage
Sources: NYISO Gold Book
Sources: NYISO Gold Book*Coal, oil, and solar each <1%
*Solar <1%
Sources: NERC 2018 LTRA; NYISO Power Trends; NYISO Gold Book
Copyright © 2020 by ScottMadden, Inc. All rights reserved.
Source: NYISO
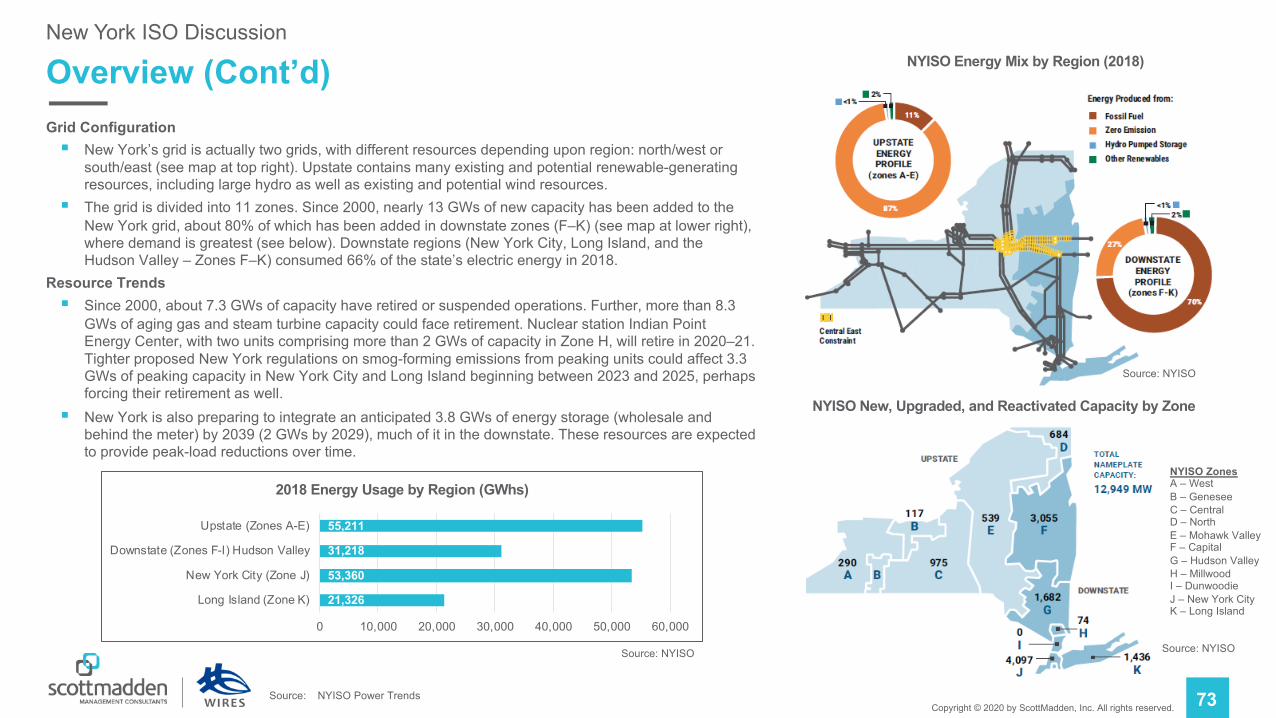
NYISO New, Upgraded, and Reactivated Capacity by Zone
NYISO ZonesA – West B – Genesee C – Central D – North E – Mohawk ValleyF – Capital G – Hudson ValleyH – Millwood I – Dunwoodie J – New York CityK – Long Island
73
Overview (Cont’d)New York ISO Discussion
Source: NYISO
NYISO Energy Mix by Region (2018)
Source: NYISO
21,326
53,360
31,218
55,211
0 10,000 20,000 30,000 40,000 50,000 60,000
Long Island (Zone K)
New York City (Zone J)
Downstate (Zones F-I) Hudson Valley
Upstate (Zones A-E)
2018 Energy Usage by Region (GWhs)
Source: NYISO Power Trends
Grid Configuration§ New York’s grid is actually two grids, with different resources depending upon region: north/west or
south/east (see map at top right). Upstate contains many existing and potential renewable-generating resources, including large hydro as well as existing and potential wind resources.
§ The grid is divided into 11 zones. Since 2000, nearly 13 GWs of new capacity has been added to the New York grid, about 80% of which has been added in downstate zones (F–K) (see map at lower right), where demand is greatest (see below). Downstate regions (New York City, Long Island, and the Hudson Valley – Zones F–K) consumed 66% of the state’s electric energy in 2018.
Resource Trends§ Since 2000, about 7.3 GWs of capacity have retired or suspended operations. Further, more than 8.3
GWs of aging gas and steam turbine capacity could face retirement. Nuclear station Indian Point Energy Center, with two units comprising more than 2 GWs of capacity in Zone H, will retire in 2020–21. Tighter proposed New York regulations on smog-forming emissions from peaking units could affect 3.3 GWs of peaking capacity in New York City and Long Island beginning between 2023 and 2025, perhaps forcing their retirement as well.
§ New York is also preparing to integrate an anticipated 3.8 GWs of energy storage (wholesale and behind the meter) by 2039 (2 GWs by 2029), much of it in the downstate. These resources are expected to provide peak-load reductions over time.
Copyright © 2020 by ScottMadden, Inc. All rights reserved. 74
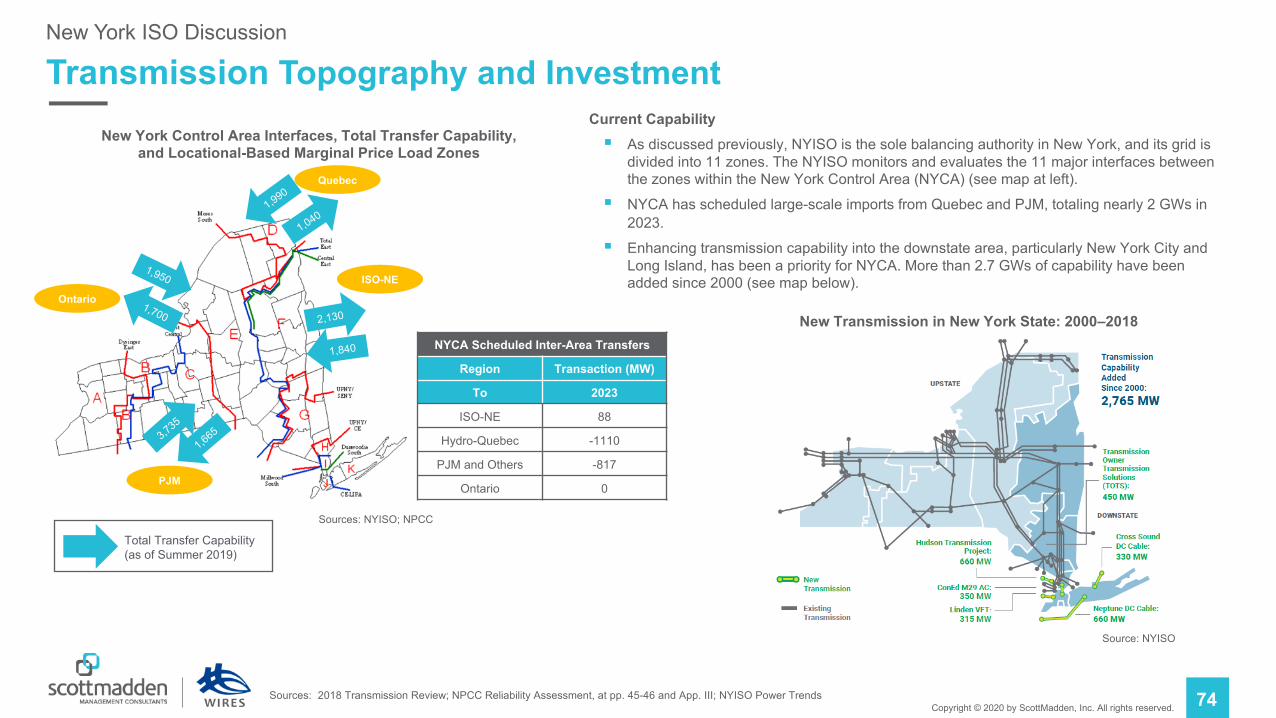
Transmission Topography and InvestmentCurrent Capability§ As discussed previously, NYISO is the sole balancing authority in New York, and its grid is
divided into 11 zones. The NYISO monitors and evaluates the 11 major interfaces between the zones within the New York Control Area (NYCA) (see map at left).
§ NYCA has scheduled large-scale imports from Quebec and PJM, totaling nearly 2 GWs in 2023.
§ Enhancing transmission capability into the downstate area, particularly New York City and Long Island, has been a priority for NYCA. More than 2.7 GWs of capability have been added since 2000 (see map below).
New York ISO Discussion
1,950
PJM
Ontario
ISO-NE
1,700
3,735
1,665
1,840
2,130
Quebec
Sources: NYISO; NPCC
New York Control Area Interfaces, Total Transfer Capability, and Locational-Based Marginal Price Load Zones
Source: NYISO
New Transmission in New York State: 2000–2018NYCA Scheduled Inter-Area Transfers
Region Transaction (MW)
To 2023
ISO-NE 88
Hydro-Quebec -1110
PJM and Others -817
Ontario 0
Total Transfer Capability (as of Summer 2019)
Sources: 2018 Transmission Review; NPCC Reliability Assessment, at pp. 45-46 and App. III; NYISO Power Trends
1,990
1,040
Copyright © 2020 by ScottMadden, Inc. All rights reserved. 75
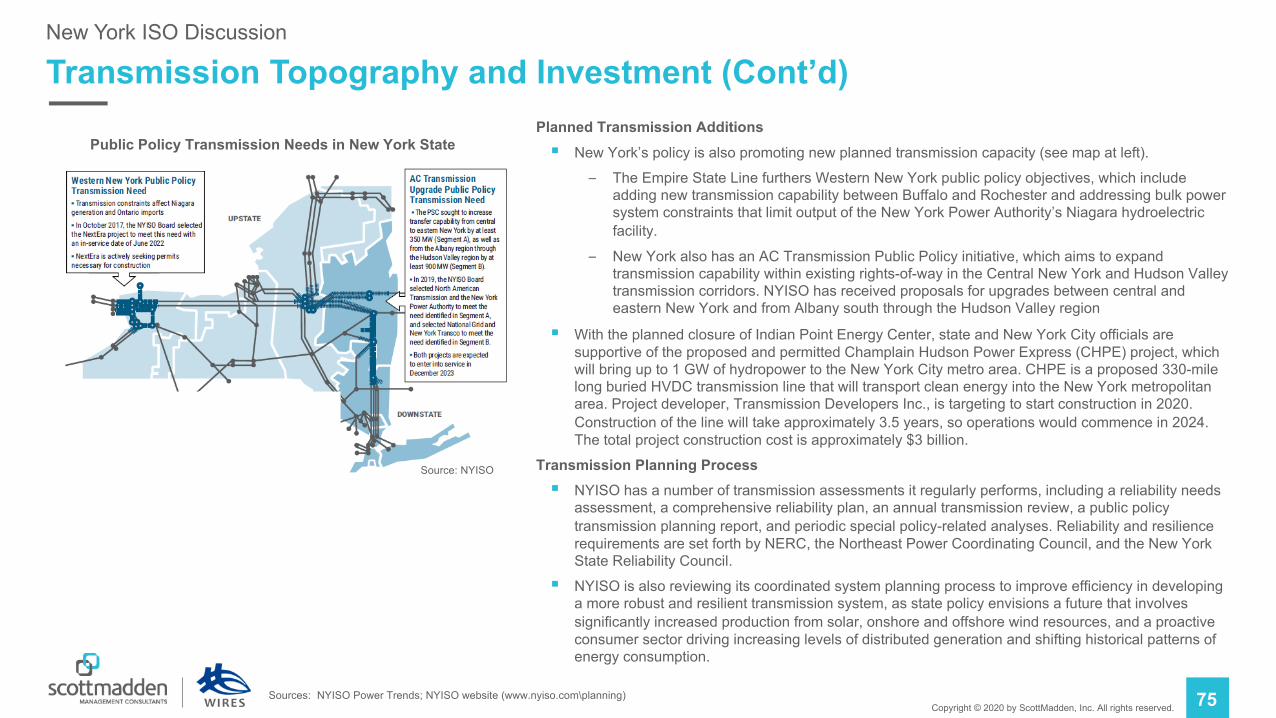
Transmission Topography and Investment (Cont’d)Planned Transmission Additions§ New York’s policy is also promoting new planned transmission capacity (see map at left).
– The Empire State Line furthers Western New York public policy objectives, which include adding new transmission capability between Buffalo and Rochester and addressing bulk power system constraints that limit output of the New York Power Authority’s Niagara hydroelectric facility.
– New York also has an AC Transmission Public Policy initiative, which aims to expand transmission capability within existing rights-of-way in the Central New York and Hudson Valley transmission corridors. NYISO has received proposals for upgrades between central and eastern New York and from Albany south through the Hudson Valley region
§ With the planned closure of Indian Point Energy Center, state and New York City officials are supportive of the proposed and permitted Champlain Hudson Power Express (CHPE) project, which will bring up to 1 GW of hydropower to the New York City metro area. CHPE is a proposed 330-mile long buried HVDC transmission line that will transport clean energy into the New York metropolitan area. Project developer, Transmission Developers Inc., is targeting to start construction in 2020. Construction of the line will take approximately 3.5 years, so operations would commence in 2024. The total project construction cost is approximately $3 billion.
Transmission Planning Process§ NYISO has a number of transmission assessments it regularly performs, including a reliability needs
assessment, a comprehensive reliability plan, an annual transmission review, a public policy transmission planning report, and periodic special policy-related analyses. Reliability and resilience requirements are set forth by NERC, the Northeast Power Coordinating Council, and the New York State Reliability Council.
§ NYISO is also reviewing its coordinated system planning process to improve efficiency in developing a more robust and resilient transmission system, as state policy envisions a future that involves significantly increased production from solar, onshore and offshore wind resources, and a proactive consumer sector driving increasing levels of distributed generation and shifting historical patterns of energy consumption.
New York ISO Discussion
Source: NYISO
Public Policy Transmission Needs in New York State
Sources: NYISO Power Trends; NYISO website (www.nyiso.com\planning)
Copyright © 2020 by ScottMadden, Inc. All rights reserved. 76
Resilience IssuesNew York ISO Discussion
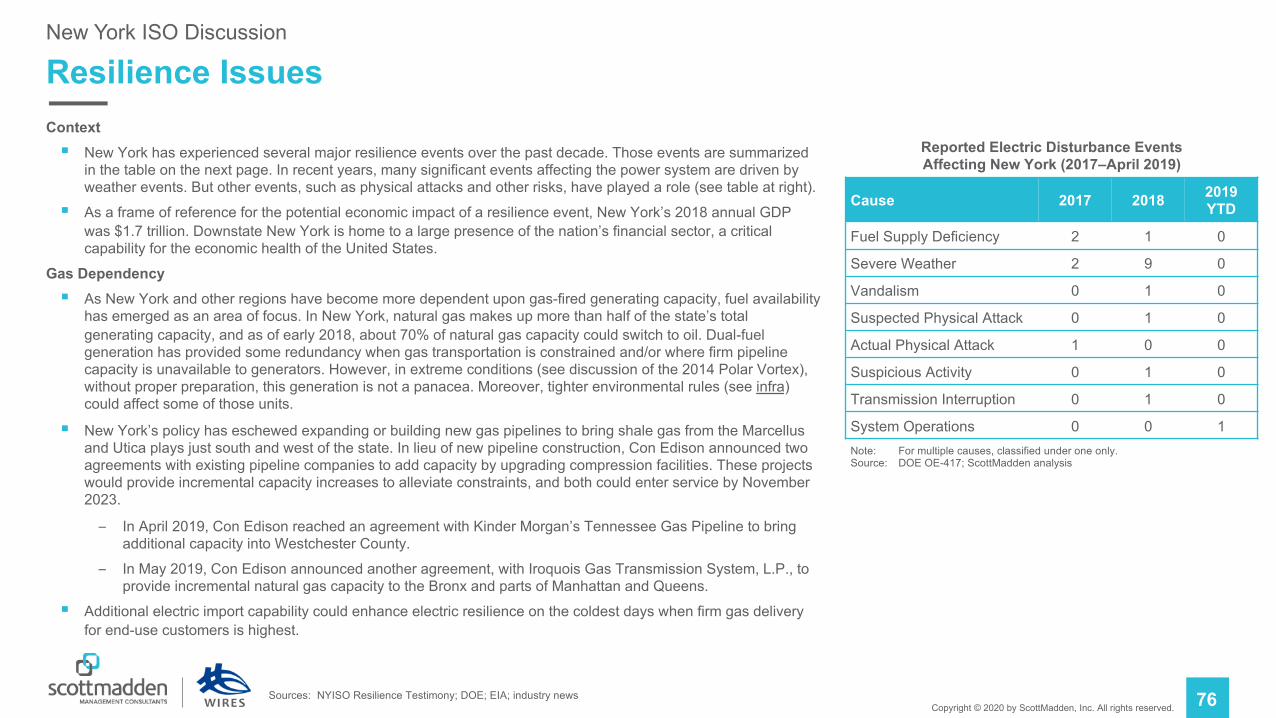
Context§ New York has experienced several major resilience events over the past decade. Those events are summarized
in the table on the next page. In recent years, many significant events affecting the power system are driven by weather events. But other events, such as physical attacks and other risks, have played a role (see table at right).
§ As a frame of reference for the potential economic impact of a resilience event, New York’s 2018 annual GDP was $1.7 trillion. Downstate New York is home to a large presence of the nation’s financial sector, a critical capability for the economic health of the United States.
Gas Dependency§ As New York and other regions have become more dependent upon gas-fired generating capacity, fuel availability
has emerged as an area of focus. In New York, natural gas makes up more than half of the state’s total generating capacity, and as of early 2018, about 70% of natural gas capacity could switch to oil. Dual-fuel generation has provided some redundancy when gas transportation is constrained and/or where firm pipeline capacity is unavailable to generators. However, in extreme conditions (see discussion of the 2014 Polar Vortex), without proper preparation, this generation is not a panacea. Moreover, tighter environmental rules (see infra) could affect some of those units.
§ New York’s policy has eschewed expanding or building new gas pipelines to bring shale gas from the Marcellus and Utica plays just south and west of the state. In lieu of new pipeline construction, Con Edison announced two agreements with existing pipeline companies to add capacity by upgrading compression facilities. These projects would provide incremental capacity increases to alleviate constraints, and both could enter service by November 2023.
– In April 2019, Con Edison reached an agreement with Kinder Morgan’s Tennessee Gas Pipeline to bring additional capacity into Westchester County.
– In May 2019, Con Edison announced another agreement, with Iroquois Gas Transmission System, L.P., to provide incremental natural gas capacity to the Bronx and parts of Manhattan and Queens.
§ Additional electric import capability could enhance electric resilience on the coldest days when firm gas delivery for end-use customers is highest.
Reported Electric Disturbance Events Affecting New York (2017–April 2019)
Cause 2017 2018 2019 YTD
Fuel Supply Deficiency 2 1 0
Severe Weather 2 9 0
Vandalism 0 1 0
Suspected Physical Attack 0 1 0
Actual Physical Attack 1 0 0
Suspicious Activity 0 1 0
Transmission Interruption 0 1 0
System Operations 0 0 1Note: For multiple causes, classified under one only.Source: DOE OE-417; ScottMadden analysis
Sources: NYISO Resilience Testimony; DOE; EIA; industry news
Copyright © 2020 by ScottMadden, Inc. All rights reserved. 77
Resilience Issues (Cont’d)New York ISO Discussion
Fuel and Energy Security Study§ Commissioned in late 2018, NYISO engaged Analysis Group to conduct a study of the “winter resilience of the system,” with special consideration given to fuel availability as
reliance on gas-fired (including dual-fuel) resources is increasing. Specifically, the study focused on “event-driven system vulnerabilities under harsh winter conditions.”
§ The study examines a number of scenarios, accounting for different assumptions about the following system factors: (i) generation retirements and additions; (ii) availability of natural gas; (iii) initial oil inventories and the ability to refuel; (iv) power transfers in and out of the region (system configuration); and (v) physical disruptions. The scenarios included long-duration (2+ weeks) events. The study resembles a similar scenario-based fuel security study performed by PJM in late 2018.
§ Key observations were as follows:
– Well-equipped to manage fuel risks: New York is well-equipped to manage energy/fuel security risks and has taken steps to monitor, evaluate, and address potential risks associated with the availability of fuel and responsiveness of supply resources. These steps include market rules and operating procedures. Reliability challenges are comprised of low-probability combinations of system conditions and physical disruptions.
– But gas availability is of concern: The loss of gas-fired generation capacity presents significant concerns. Reduced gas scenarios run into trouble quickly when combined with other system conditions (reduced imports, potential “peaker rule” retirement) and fuel interruptions.
– Dual-fuel is vital: Significant loss of load events appear where there is reduced operation of oil-fired generating assets, particularly in downstate regions (especially Long Island). Thus, dual-fuel capability (oil backup to gas) is “vital” for reliability. A lack of refill capability has large impacts.
– Transmission is valuable, including access to offshore wind: As stated by Analysis Group, “Maintaining power imports during cold weather conditions and meeting the state’s renewable resource goals can provide valuable reliability support and this may be particularly true with respect to offshore wind.” With development of offshore wind resources and the potential for its injection into Zones J (New York City) and K (Long Island), those resources can improve capability from other resource types. In particular, offshore wind production can supplant some oil-fired generation and slow the rate of decline of oil inventory (see graph on next page).
– Additional study needed: Additional study of the effects of the requirements of the recently enacted Climate Leadership and Community Protection Act (or CLCPA), including the pace and magnitude of change, is needed to fully assess winter operational risks.
Source: Analysis Group, “NYISO Fuel and Energy Security Initiative Study Results and Observations,” presentation to NYISO ICAPWG/MIWG (Sept. 24, 2019)
Copyright © 2020 by ScottMadden, Inc. All rights reserved. 78
Resilience Issues (Cont’d)New York ISO Discussion
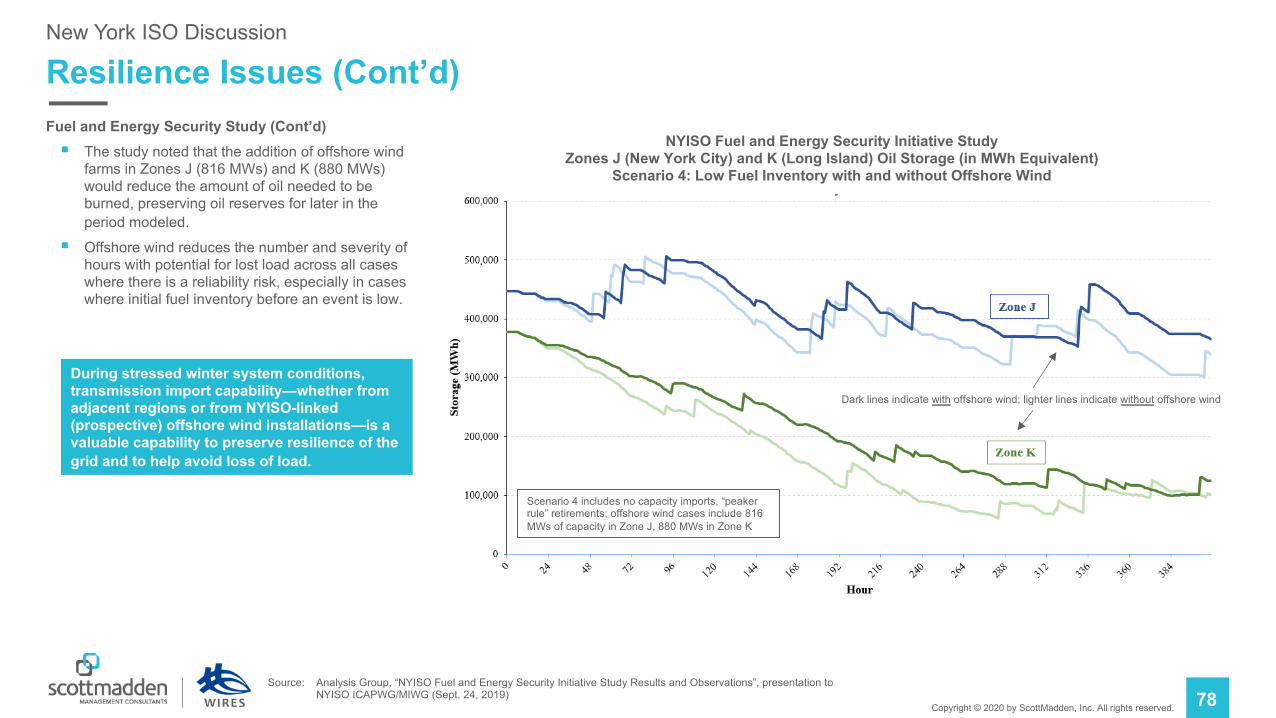
NYISO Fuel and Energy Security Initiative StudyZones J (New York City) and K (Long Island) Oil Storage (in MWh Equivalent)
Scenario 4: Low Fuel Inventory with and without Offshore Wind
Scenario 4 includes no capacity imports, “peaker rule” retirements; offshore wind cases include 816 MWs of capacity in Zone J, 880 MWs in Zone K
Dark lines indicate with offshore wind; lighter lines indicate without offshore wind
Fuel and Energy Security Study (Cont’d)§ The study noted that the addition of offshore wind
farms in Zones J (816 MWs) and K (880 MWs) would reduce the amount of oil needed to be burned, preserving oil reserves for later in the period modeled.
§ Offshore wind reduces the number and severity of hours with potential for lost load across all cases where there is a reliability risk, especially in cases where initial fuel inventory before an event is low.
During stressed winter system conditions, transmission import capability—whether from adjacent regions or from NYISO-linked (prospective) offshore wind installations—is a valuable capability to preserve resilience of the grid and to help avoid loss of load.
Source: Analysis Group, “NYISO Fuel and Energy Security Initiative Study Results and Observations”, presentation to NYISO ICAPWG/MIWG (Sept. 24, 2019)
Copyright © 2020 by ScottMadden, Inc. All rights reserved. 79
Resilience Issues (Cont’d)New York ISO Discussion
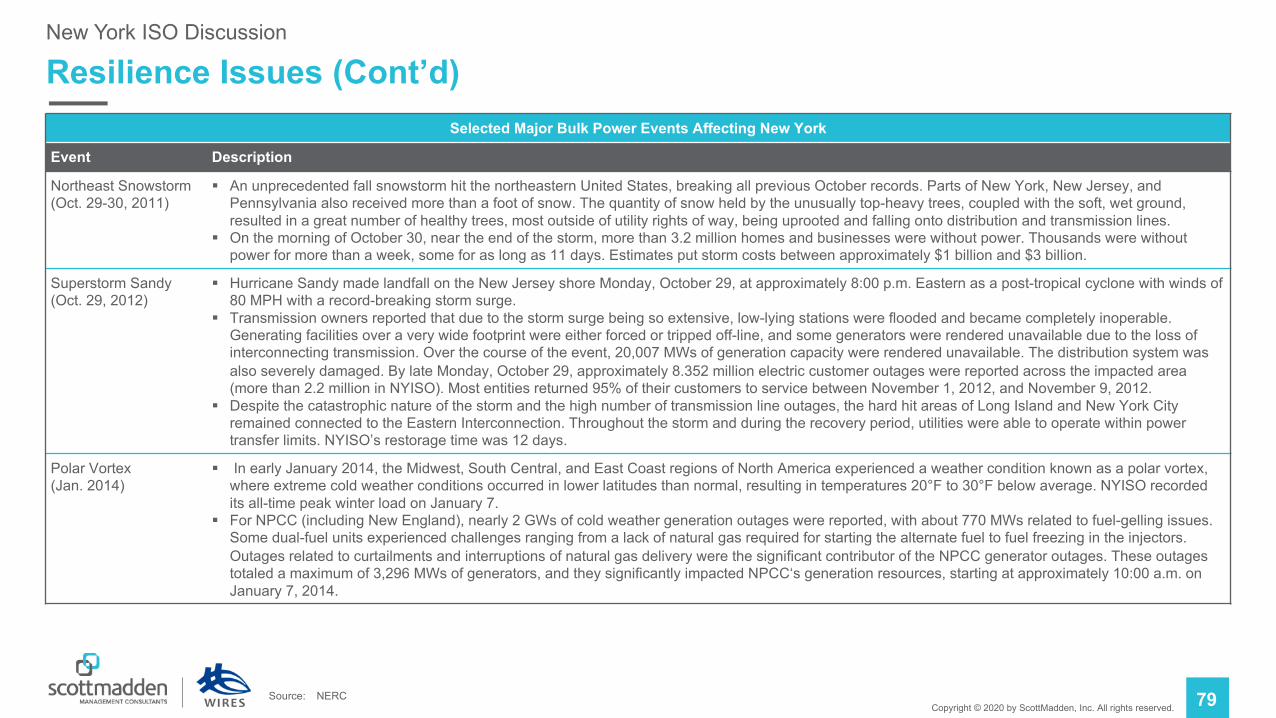
Selected Major Bulk Power Events Affecting New York
Event Description
Northeast Snowstorm (Oct. 29-30, 2011)
§ An unprecedented fall snowstorm hit the northeastern United States, breaking all previous October records. Parts of New York, New Jersey, and Pennsylvania also received more than a foot of snow. The quantity of snow held by the unusually top-heavy trees, coupled with the soft, wet ground, resulted in a great number of healthy trees, most outside of utility rights of way, being uprooted and falling onto distribution and transmission lines.
§ On the morning of October 30, near the end of the storm, more than 3.2 million homes and businesses were without power. Thousands were without power for more than a week, some for as long as 11 days. Estimates put storm costs between approximately $1 billion and $3 billion.
Superstorm Sandy (Oct. 29, 2012)
§ Hurricane Sandy made landfall on the New Jersey shore Monday, October 29, at approximately 8:00 p.m. Eastern as a post-tropical cyclone with winds of 80 MPH with a record-breaking storm surge.
§ Transmission owners reported that due to the storm surge being so extensive, low-lying stations were flooded and became completely inoperable. Generating facilities over a very wide footprint were either forced or tripped off-line, and some generators were rendered unavailable due to the loss of interconnecting transmission. Over the course of the event, 20,007 MWs of generation capacity were rendered unavailable. The distribution system was also severely damaged. By late Monday, October 29, approximately 8.352 million electric customer outages were reported across the impacted area (more than 2.2 million in NYISO). Most entities returned 95% of their customers to service between November 1, 2012, and November 9, 2012.
§ Despite the catastrophic nature of the storm and the high number of transmission line outages, the hard hit areas of Long Island and New York City remained connected to the Eastern Interconnection. Throughout the storm and during the recovery period, utilities were able to operate within power transfer limits. NYISO’s restorage time was 12 days.
Polar Vortex (Jan. 2014)
§ In early January 2014, the Midwest, South Central, and East Coast regions of North America experienced a weather condition known as a polar vortex, where extreme cold weather conditions occurred in lower latitudes than normal, resulting in temperatures 20°F to 30°F below average. NYISO recorded its all-time peak winter load on January 7.
§ For NPCC (including New England), nearly 2 GWs of cold weather generation outages were reported, with about 770 MWs related to fuel-gelling issues. Some dual-fuel units experienced challenges ranging from a lack of natural gas required for starting the alternate fuel to fuel freezing in the injectors. Outages related to curtailments and interruptions of natural gas delivery were the significant contributor of the NPCC generator outages. These outages totaled a maximum of 3,296 MWs of generators, and they significantly impacted NPCC‘s generation resources, starting at approximately 10:00 a.m. on January 7, 2014.
Source: NERC
Copyright © 2020 by ScottMadden, Inc. All rights reserved. 80
Resilience Issues (Cont’d)New York ISO Discussion
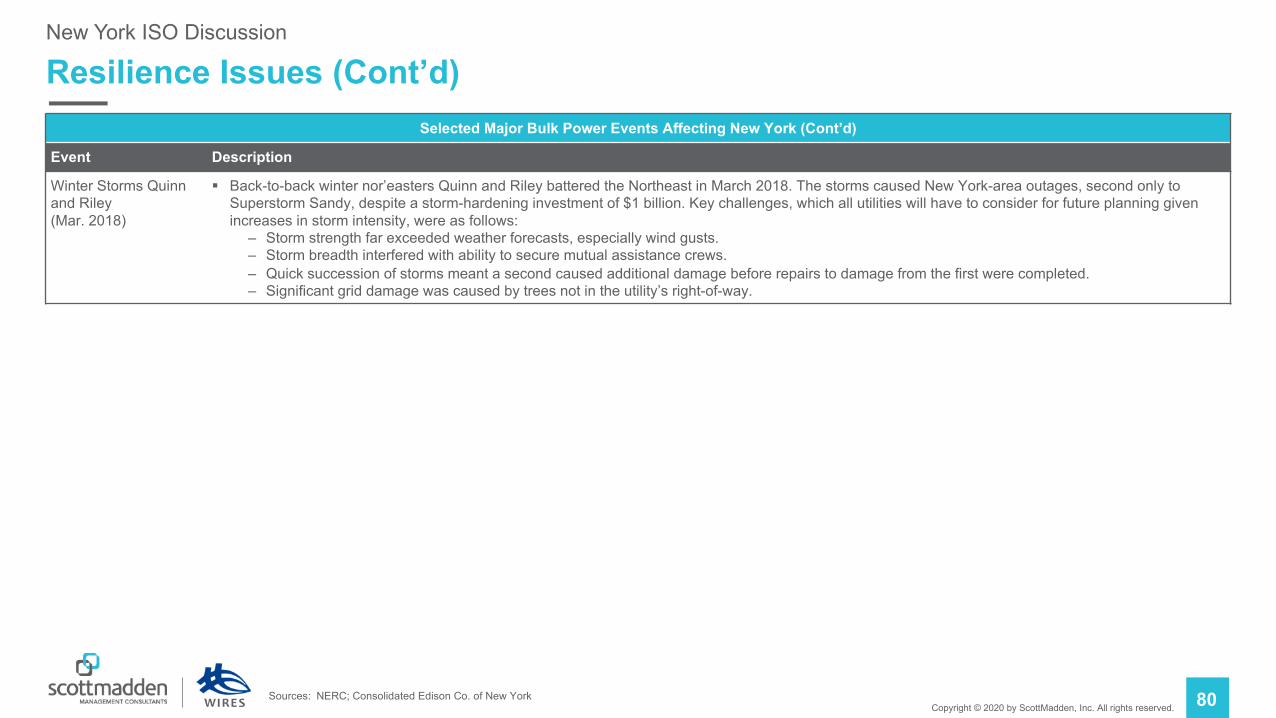
Selected Major Bulk Power Events Affecting New York (Cont’d)
Event Description
Winter Storms Quinn and Riley(Mar. 2018)
§ Back-to-back winter nor’easters Quinn and Riley battered the Northeast in March 2018. The storms caused New York-area outages, second only to Superstorm Sandy, despite a storm-hardening investment of $1 billion. Key challenges, which all utilities will have to consider for future planning given increases in storm intensity, were as follows:
– Storm strength far exceeded weather forecasts, especially wind gusts.– Storm breadth interfered with ability to secure mutual assistance crews.– Quick succession of storms meant a second caused additional damage before repairs to damage from the first were completed.– Significant grid damage was caused by trees not in the utility’s right-of-way.
Sources: NERC; Consolidated Edison Co. of New York
Copyright © 2020 by ScottMadden, Inc. All rights reserved. 81
Renewables IntegrationDemand-Side Considerations
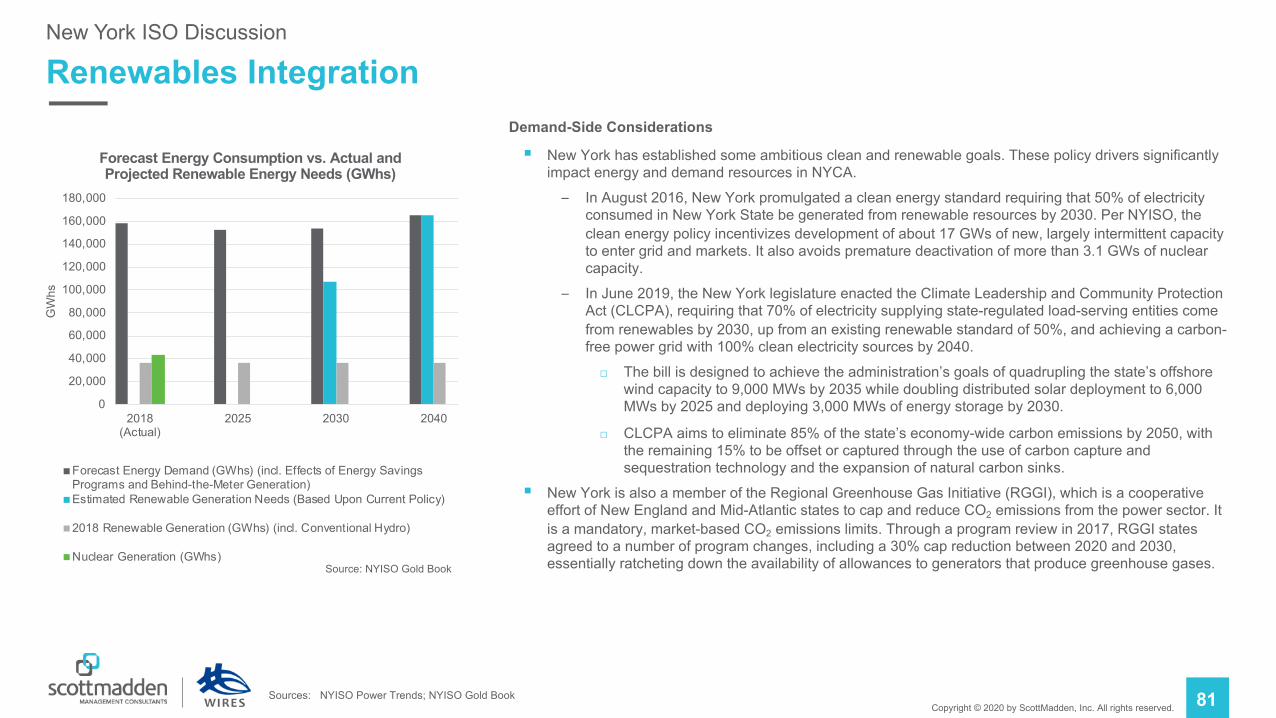
§ New York has established some ambitious clean and renewable goals. These policy drivers significantly impact energy and demand resources in NYCA.
– In August 2016, New York promulgated a clean energy standard requiring that 50% of electricity consumed in New York State be generated from renewable resources by 2030. Per NYISO, the clean energy policy incentivizes development of about 17 GWs of new, largely intermittent capacity to enter grid and markets. It also avoids premature deactivation of more than 3.1 GWs of nuclear capacity.
– In June 2019, the New York legislature enacted the Climate Leadership and Community Protection Act (CLCPA), requiring that 70% of electricity supplying state-regulated load-serving entities come from renewables by 2030, up from an existing renewable standard of 50%, and achieving a carbon-free power grid with 100% clean electricity sources by 2040.
□ The bill is designed to achieve the administration’s goals of quadrupling the state’s offshore wind capacity to 9,000 MWs by 2035 while doubling distributed solar deployment to 6,000 MWs by 2025 and deploying 3,000 MWs of energy storage by 2030.
□ CLCPA aims to eliminate 85% of the state’s economy-wide carbon emissions by 2050, with the remaining 15% to be offset or captured through the use of carbon capture and sequestration technology and the expansion of natural carbon sinks.
§ New York is also a member of the Regional Greenhouse Gas Initiative (RGGI), which is a cooperative effort of New England and Mid-Atlantic states to cap and reduce CO2 emissions from the power sector. It is a mandatory, market-based CO2 emissions limits. Through a program review in 2017, RGGI states agreed to a number of program changes, including a 30% cap reduction between 2020 and 2030, essentially ratcheting down the availability of allowances to generators that produce greenhouse gases.
New York ISO Discussion
0
20,000
40,000
60,000
80,000
100,000
120,000
140,000
160,000
180,000
2018(Actual)
2025 2030 2040
GW
hs
Forecast Energy Consumption vs. Actual and Projected Renewable Energy Needs (GWhs)
Forecast Energy Demand (GWhs) (incl. Effects of Energy SavingsPrograms and Behind-the-Meter Generation)Estimated Renewable Generation Needs (Based Upon Current Policy)
2018 Renewable Generation (GWhs) (incl. Conventional Hydro)
Nuclear Generation (GWhs)
Sources: NYISO Power Trends; NYISO Gold Book
Source: NYISO Gold Book
Copyright © 2020 by ScottMadden, Inc. All rights reserved. 82
Renewables Integration (Cont’d)New York ISO Discussion
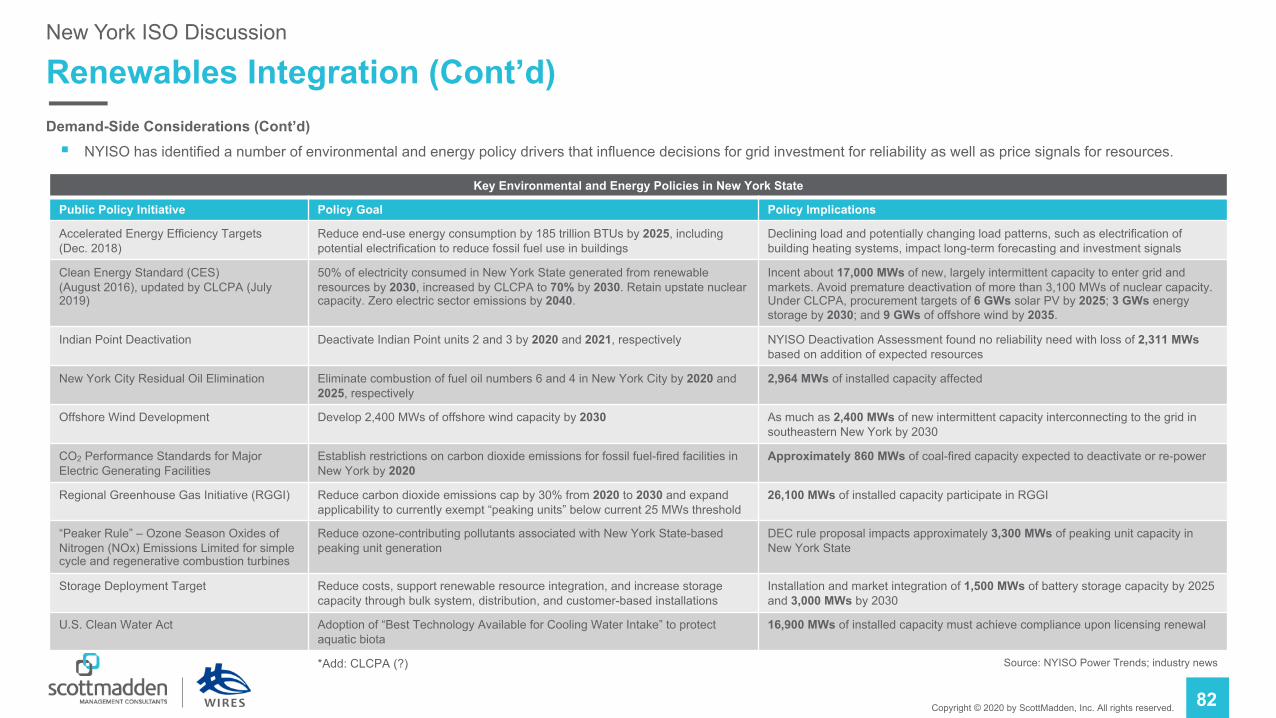
Demand-Side Considerations (Cont’d)§ NYISO has identified a number of environmental and energy policy drivers that influence decisions for grid investment for reliability as well as price signals for resources.
Key Environmental and Energy Policies in New York State
Public Policy Initiative Policy Goal Policy Implications
Accelerated Energy Efficiency Targets (Dec. 2018)
Reduce end-use energy consumption by 185 trillion BTUs by 2025, including potential electrification to reduce fossil fuel use in buildings
Declining load and potentially changing load patterns, such as electrification of building heating systems, impact long-term forecasting and investment signals
Clean Energy Standard (CES) (August 2016), updated by CLCPA (July 2019)
50% of electricity consumed in New York State generated from renewable resources by 2030, increased by CLCPA to 70% by 2030. Retain upstate nuclear capacity. Zero electric sector emissions by 2040.
Incent about 17,000 MWs of new, largely intermittent capacity to enter grid and markets. Avoid premature deactivation of more than 3,100 MWs of nuclear capacity. Under CLCPA, procurement targets of 6 GWs solar PV by 2025; 3 GWs energy storage by 2030; and 9 GWs of offshore wind by 2035.
Indian Point Deactivation Deactivate Indian Point units 2 and 3 by 2020 and 2021, respectively NYISO Deactivation Assessment found no reliability need with loss of 2,311 MWsbased on addition of expected resources
New York City Residual Oil Elimination Eliminate combustion of fuel oil numbers 6 and 4 in New York City by 2020 and 2025, respectively
2,964 MWs of installed capacity affected
Offshore Wind Development Develop 2,400 MWs of offshore wind capacity by 2030 As much as 2,400 MWs of new intermittent capacity interconnecting to the grid in southeastern New York by 2030
CO2 Performance Standards for Major Electric Generating Facilities
Establish restrictions on carbon dioxide emissions for fossil fuel-fired facilities in New York by 2020
Approximately 860 MWs of coal-fired capacity expected to deactivate or re-power
Regional Greenhouse Gas Initiative (RGGI) Reduce carbon dioxide emissions cap by 30% from 2020 to 2030 and expand applicability to currently exempt “peaking units” below current 25 MWs threshold
26,100 MWs of installed capacity participate in RGGI
“Peaker Rule” – Ozone Season Oxides of Nitrogen (NOx) Emissions Limited for simple cycle and regenerative combustion turbines
Reduce ozone-contributing pollutants associated with New York State-based peaking unit generation
DEC rule proposal impacts approximately 3,300 MWs of peaking unit capacity in New York State
Storage Deployment Target Reduce costs, support renewable resource integration, and increase storage capacity through bulk system, distribution, and customer-based installations
Installation and market integration of 1,500 MWs of battery storage capacity by 2025 and 3,000 MWs by 2030
U.S. Clean Water Act Adoption of “Best Technology Available for Cooling Water Intake” to protect aquatic biota
16,900 MWs of installed capacity must achieve compliance upon licensing renewal
*Add: CLCPA (?) Source: NYISO Power Trends; industry news
Copyright © 2020 by ScottMadden, Inc. All rights reserved. 83
Renewables Integration (Cont’d)New York ISO Discussion
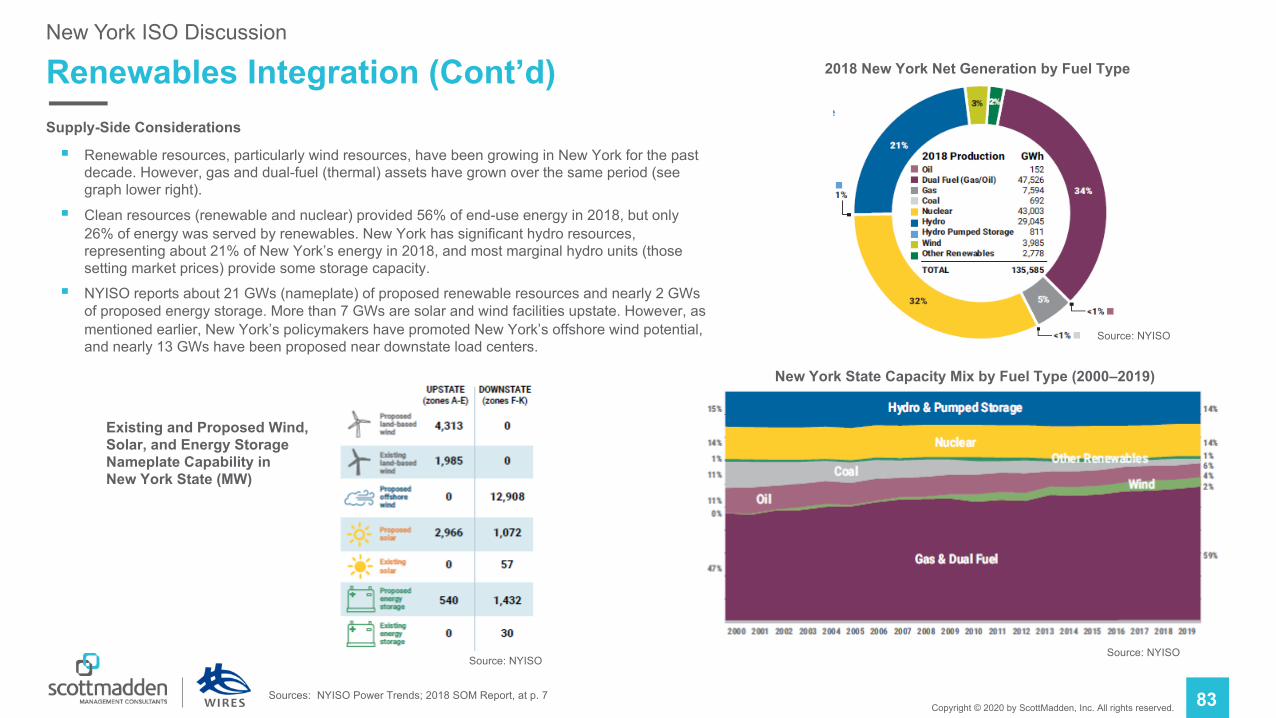
Supply-Side Considerations
§ Renewable resources, particularly wind resources, have been growing in New York for the past decade. However, gas and dual-fuel (thermal) assets have grown over the same period (see graph lower right).
§ Clean resources (renewable and nuclear) provided 56% of end-use energy in 2018, but only 26% of energy was served by renewables. New York has significant hydro resources, representing about 21% of New York’s energy in 2018, and most marginal hydro units (those setting market prices) provide some storage capacity.
§ NYISO reports about 21 GWs (nameplate) of proposed renewable resources and nearly 2 GWs of proposed energy storage. More than 7 GWs are solar and wind facilities upstate. However, as mentioned earlier, New York’s policymakers have promoted New York’s offshore wind potential, and nearly 13 GWs have been proposed near downstate load centers.
New York State Capacity Mix by Fuel Type (2000–2019)
Existing and Proposed Wind, Solar, and Energy StorageNameplate Capability inNew York State (MW)
Source: NYISOSource: NYISO
2018 New York Net Generation by Fuel Type
Source: NYISO
Sources: NYISO Power Trends; 2018 SOM Report, at p. 7
Copyright © 2020 by ScottMadden, Inc. All rights reserved. 84
Renewables Integration (Cont’d)New York ISO Discussion
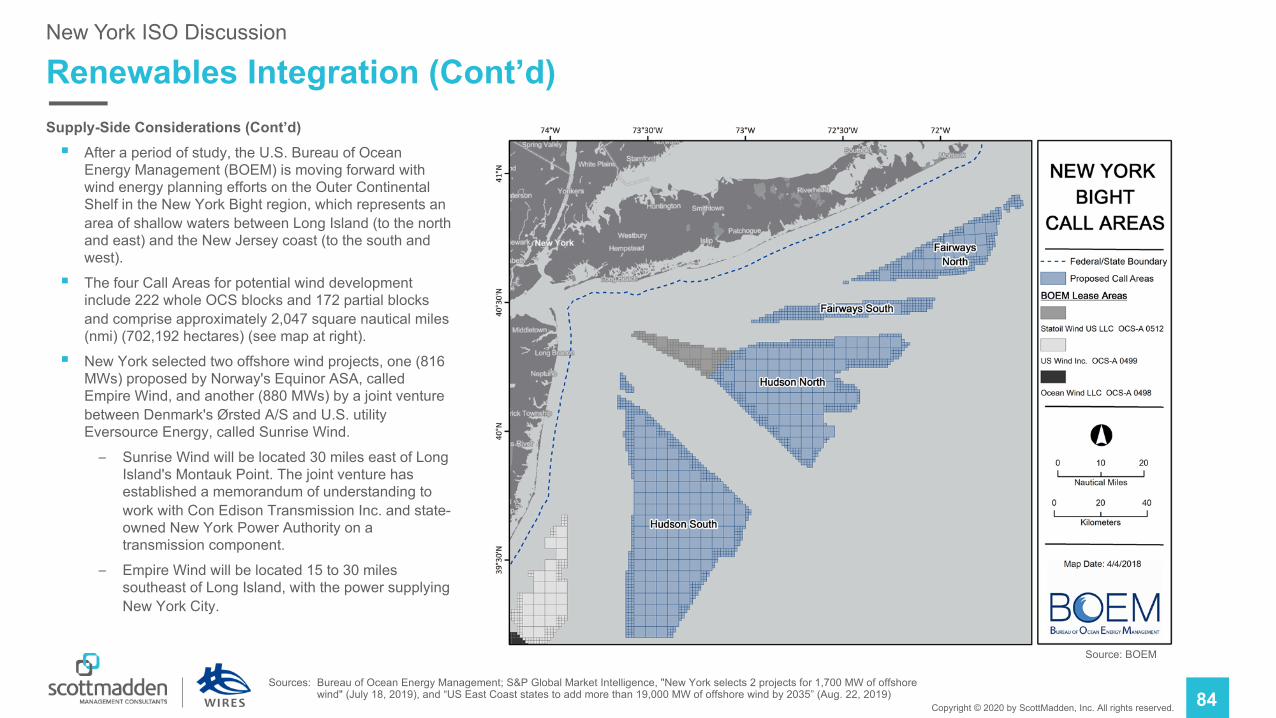
Supply-Side Considerations (Cont’d)§ After a period of study, the U.S. Bureau of Ocean
Energy Management (BOEM) is moving forward with wind energy planning efforts on the Outer Continental Shelf in the New York Bight region, which represents an area of shallow waters between Long Island (to the north and east) and the New Jersey coast (to the south and west).
§ The four Call Areas for potential wind development include 222 whole OCS blocks and 172 partial blocks and comprise approximately 2,047 square nautical miles (nmi) (702,192 hectares) (see map at right).
§ New York selected two offshore wind projects, one (816 MWs) proposed by Norway's Equinor ASA, called Empire Wind, and another (880 MWs) by a joint venture between Denmark's Ørsted A/S and U.S. utility Eversource Energy, called Sunrise Wind.
– Sunrise Wind will be located 30 miles east of Long Island's Montauk Point. The joint venture has established a memorandum of understanding to work with Con Edison Transmission Inc. and state-owned New York Power Authority on a transmission component.
– Empire Wind will be located 15 to 30 miles southeast of Long Island, with the power supplying New York City.
Source: BOEM
Sources: Bureau of Ocean Energy Management; S&P Global Market Intelligence, "New York selects 2 projects for 1,700 MW of offshore wind" (July 18, 2019), and “US East Coast states to add more than 19,000 MW of offshore wind by 2035” (Aug. 22, 2019)
Copyright © 2020 by ScottMadden, Inc. All rights reserved. 85
Renewables Integration (Cont’d)New York ISO Discussion
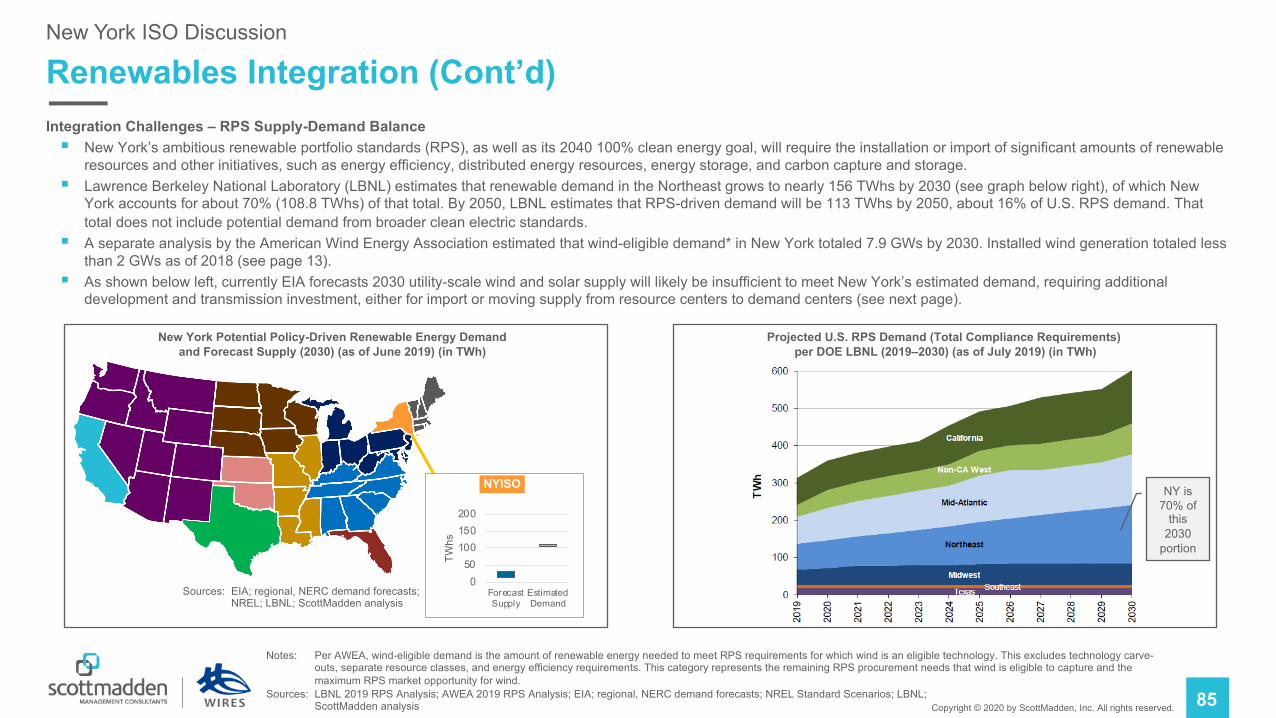
Integration Challenges – RPS Supply-Demand Balance§ New York’s ambitious renewable portfolio standards (RPS), as well as its 2040 100% clean energy goal, will require the installation or import of significant amounts of renewable
resources and other initiatives, such as energy efficiency, distributed energy resources, energy storage, and carbon capture and storage.§ Lawrence Berkeley National Laboratory (LBNL) estimates that renewable demand in the Northeast grows to nearly 156 TWhs by 2030 (see graph below right), of which New
York accounts for about 70% (108.8 TWhs) of that total. By 2050, LBNL estimates that RPS-driven demand will be 113 TWhs by 2050, about 16% of U.S. RPS demand. That total does not include potential demand from broader clean electric standards.
§ A separate analysis by the American Wind Energy Association estimated that wind-eligible demand* in New York totaled 7.9 GWs by 2030. Installed wind generation totaled less than 2 GWs as of 2018 (see page 13).
§ As shown below left, currently EIA forecasts 2030 utility-scale wind and solar supply will likely be insufficient to meet New York’s estimated demand, requiring additional development and transmission investment, either for import or moving supply from resource centers to demand centers (see next page).
Sources: EIA; regional, NERC demand forecasts; NREL; LBNL; ScottMadden analysis
Notes: Per AWEA, wind-eligible demand is the amount of renewable energy needed to meet RPS requirements for which wind is an eligible technology. This excludes technology carve-outs, separate resource classes, and energy efficiency requirements. This category represents the remaining RPS procurement needs that wind is eligible to capture and the maximum RPS market opportunity for wind.
Sources: LBNL 2019 RPS Analysis; AWEA 2019 RPS Analysis; EIA; regional, NERC demand forecasts; NREL Standard Scenarios; LBNL; ScottMadden analysis
New York Potential Policy-Driven Renewable Energy Demandand Forecast Supply (2030) (as of June 2019) (in TWh)
Projected U.S. RPS Demand (Total Compliance Requirements) per DOE LBNL (2019–2030) (as of July 2019) (in TWh)
NY is 70% of
this 2030
portion
050
100150200
ForecastSupply
EstimatedDemand
TWhs
NYISO
Copyright © 2020 by ScottMadden, Inc. All rights reserved. 86
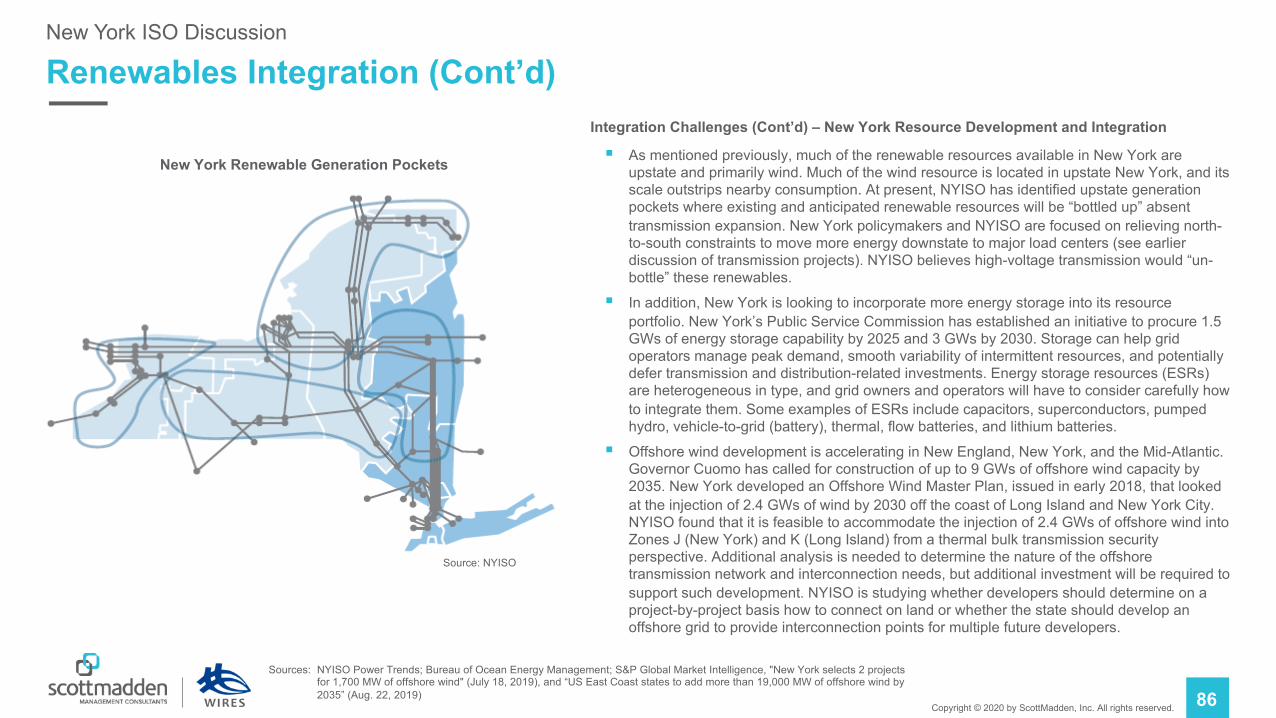
Renewables Integration (Cont’d)Integration Challenges (Cont’d) – New York Resource Development and Integration
§ As mentioned previously, much of the renewable resources available in New York are upstate and primarily wind. Much of the wind resource is located in upstate New York, and its scale outstrips nearby consumption. At present, NYISO has identified upstate generation pockets where existing and anticipated renewable resources will be “bottled up” absent transmission expansion. New York policymakers and NYISO are focused on relieving north-to-south constraints to move more energy downstate to major load centers (see earlier discussion of transmission projects). NYISO believes high-voltage transmission would “un-bottle” these renewables.
§ In addition, New York is looking to incorporate more energy storage into its resource portfolio. New York’s Public Service Commission has established an initiative to procure 1.5 GWs of energy storage capability by 2025 and 3 GWs by 2030. Storage can help grid operators manage peak demand, smooth variability of intermittent resources, and potentially defer transmission and distribution-related investments. Energy storage resources (ESRs) are heterogeneous in type, and grid owners and operators will have to consider carefully how to integrate them. Some examples of ESRs include capacitors, superconductors, pumped hydro, vehicle-to-grid (battery), thermal, flow batteries, and lithium batteries.
§ Offshore wind development is accelerating in New England, New York, and the Mid-Atlantic. Governor Cuomo has called for construction of up to 9 GWs of offshore wind capacity by 2035. New York developed an Offshore Wind Master Plan, issued in early 2018, that looked at the injection of 2.4 GWs of wind by 2030 off the coast of Long Island and New York City. NYISO found that it is feasible to accommodate the injection of 2.4 GWs of offshore wind into Zones J (New York) and K (Long Island) from a thermal bulk transmission security perspective. Additional analysis is needed to determine the nature of the offshore transmission network and interconnection needs, but additional investment will be required to support such development. NYISO is studying whether developers should determine on a project-by-project basis how to connect on land or whether the state should develop an offshore grid to provide interconnection points for multiple future developers.
New York ISO Discussion
New York Renewable Generation Pockets
Source: NYISO
Sources: NYISO Power Trends; Bureau of Ocean Energy Management; S&P Global Market Intelligence, "New York selects 2 projects for 1,700 MW of offshore wind" (July 18, 2019), and “US East Coast states to add more than 19,000 MW of offshore wind by 2035” (Aug. 22, 2019)
Copyright © 2020 by ScottMadden, Inc. All rights reserved. 87
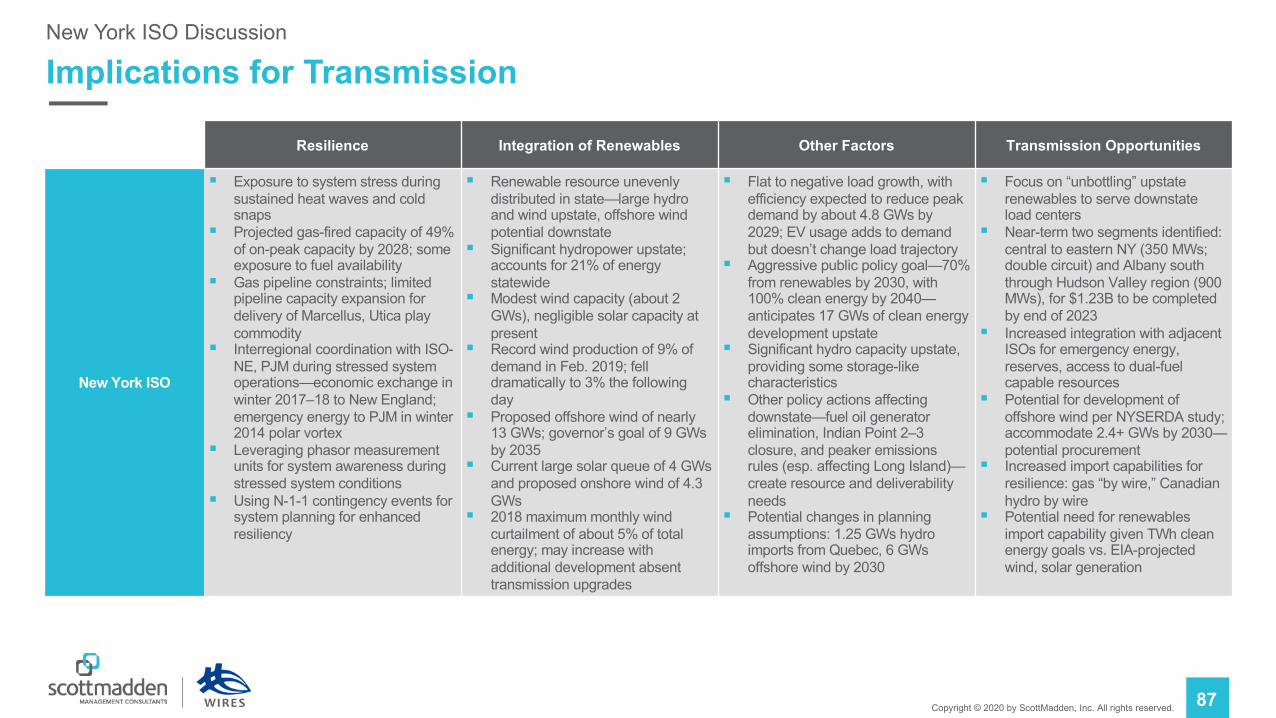
Implications for TransmissionNew York ISO Discussion
Resilience Integration of Renewables Other Factors Transmission Opportunities
New York ISO
§ Exposure to system stress during sustained heat waves and cold snaps
§ Projected gas-fired capacity of 49% of on-peak capacity by 2028; some exposure to fuel availability
§ Gas pipeline constraints; limited pipeline capacity expansion for delivery of Marcellus, Utica play commodity
§ Interregional coordination with ISO-NE, PJM during stressed system operations—economic exchange in winter 2017–18 to New England; emergency energy to PJM in winter 2014 polar vortex
§ Leveraging phasor measurement units for system awareness during stressed system conditions
§ Using N-1-1 contingency events for system planning for enhanced resiliency
§ Renewable resource unevenly distributed in state—large hydro and wind upstate, offshore wind potential downstate
§ Significant hydropower upstate; accounts for 21% of energy statewide
§ Modest wind capacity (about 2 GWs), negligible solar capacity at present
§ Record wind production of 9% of demand in Feb. 2019; fell dramatically to 3% the following day
§ Proposed offshore wind of nearly 13 GWs; governor’s goal of 9 GWs by 2035
§ Current large solar queue of 4 GWs and proposed onshore wind of 4.3 GWs
§ 2018 maximum monthly wind curtailment of about 5% of total energy; may increase with additional development absent transmission upgrades
§ Flat to negative load growth, with efficiency expected to reduce peak demand by about 4.8 GWs by 2029; EV usage adds to demand but doesn’t change load trajectory
§ Aggressive public policy goal—70% from renewables by 2030, with 100% clean energy by 2040—anticipates 17 GWs of clean energy development upstate
§ Significant hydro capacity upstate, providing some storage-like characteristics
§ Other policy actions affecting downstate—fuel oil generator elimination, Indian Point 2–3 closure, and peaker emissions rules (esp. affecting Long Island)—create resource and deliverability needs
§ Potential changes in planning assumptions: 1.25 GWs hydro imports from Quebec, 6 GWs offshore wind by 2030
§ Focus on “unbottling” upstate renewables to serve downstate load centers
§ Near-term two segments identified: central to eastern NY (350 MWs; double circuit) and Albany south through Hudson Valley region (900 MWs), for $1.23B to be completed by end of 2023
§ Increased integration with adjacent ISOs for emergency energy, reserves, access to dual-fuel capable resources
§ Potential for development of offshore wind per NYSERDA study; accommodate 2.4+ GWs by 2030—potential procurement
§ Increased import capabilities for resilience: gas “by wire,” Canadian hydro by wire
§ Potential need for renewables import capability given TWh clean energy goals vs. EIA-projected wind, solar generation
Copyright © 2020 by ScottMadden, Inc. All rights reserved. 88
SourcesNew York ISO Discussion
§ American Wind Energy Association, 2019 State RPS Market Assessment (Mar. 13, 2019) (AWEA 2019 RPS Analysis)
§ Analysis Group, “NYISO Fuel and Energy Security Initiative Study Results and Observations”, presentation to NYISO ICAPWG/MIWG (Sept. 24, 2019)
§ Champlain Hudson Power Express Project Development Portal, at http://www.chpexpress.com/ (accessed June 25, 2019)
§ Consolidated Edison Co. of New York, Report on Preparation and System Restoration Performance: Winter Storms Riley and Quinn (Mar. 2018)
§ U.S. Dept. of Energy, Electric Disturbance Events (OE-417), data available at https://www.oe.netl.doe.gov/oe417.aspx (accessed June 25, 2019)
§ Energy Information Administration (EIA), Annual Energy Outlook 2019 (Feb. 2019)
§ EIA, Electric Power Monthly (June 25, 2019), with data for Apr. 2019, at https://www.eia.gov/electricity/monthly/
§ EIA, “Con Edison limits natural gas service due to pipeline constraints into New York City area,” Today in Energy (May 22, 2019), available at https://www.eia.gov/todayinenergy/detail.php?id=39572
§ EIA, “Natural gas-burning power plant operations vary during periods of cold weather,” Today in Energy (Jan. 14, 2019), available at https://www.eia.gov/todayinenergy/detail.php?id=37992
§ EIA, “January’s cold weather affects electricity generation mix in Northeast, Mid-Atlantic,” Today in Energy (Jan. 23, 2018), available at https://www.eia.gov/todayinenergy/detail.php?id=34632
§ EIA, “Natural gas has displaced coal in the Northeast’s generation mix over the past 10 years,” Today in Energy (May 11, 2017), available at https://www.eia.gov/todayinenergy/detail.php?id=31172
§ Lawrence Berkeley National Laboratory, U.S. Renewables Portfolio Standards: 2019 Annual Status Update (July 2019) (LBNL 2019 RPS Analysis)
§ National Renewable Energy Laboratory, NREL Standard Scenarios (as of July 8, 2019), available at https://openei.org/apps/reeds/#
§ NERC, 2018 Long-Term Reliability Assessment (Dec. 2018) (NERC 2018 LTRA)
§ NERC, October 2011 Northeast Snowstorm Event, available at https://www.nerc.com/pa/rrm/ea/Pages/October-2011-Northeast-Snow-Storm-Event.aspx
§ NERC, Hurricane Sandy Event Analysis Report (Jan. 2014), available at https://www.nerc.com/pa/rrm/ea/Pages/October-2012-Hurrican-Sandy-Event-Analysis-Report.aspx
§ NERC, Polar Vortex Review (Sept. 2014), available at https://www.nerc.com/pa/rrm/Pages/January-2014-Polar-Vortex-Review.aspx
Copyright © 2020 by ScottMadden, Inc. All rights reserved. 89
Sources (Cont’d)New York ISO Discussion
§ New York Energy State Energy Research & Development Agency, New York State Offshore Wind Master Plan (Jan. 2018), available at https://www.nyserda.ny.gov/All-Programs/Programs/Offshore-Wind/Offshore-Wind-in-New-York-State-Overview/NYS-Offshore-Wind-Master-Plan
§ Northeast Power Coordinating Council, Reliability Assessment for Summer 2019: Final Report (Apr. 17, 2019) (NPCC Reliability Assessment)
§ NYISO, Power Trends 2019 (May 2019) (NYISO Power Trends)
§ NYISO, 2018 Intermediate Area Transmission Review of the New York State Bulk Power Transmission System (Study Year 2023) (May 29, 2019) (2018 Transmission Review)
§ NYISO, 2019 Load and Capacity Data Gold Book (Apr. 2019) (NYISO Gold Book)
§ Potomac Economics, State of the Market Report for the New York ISO Markets (May 2019) (2018 SOM Report)
§ Response of the New York Independent System Operator, Inc., FERC Docket No. AD18-7-000, Grid Resilience in Regional Transmission Organizations and Independent System Operators (Mar. 9, 2018) (NYISO Resilience Testimony)
§ Regional Greenhouse Gas Initiative, available at https://www.rggi.org/ (accessed June 25, 2019)
§ U.S. Bureau of Ocean Energy Management, New York Activities, at https://www.boem.gov/New-York/ (accessed June 25, 2019) (BOEM)
§ U.S. Dept. of Commerce, Bureau of Economic Analysis
§ Regional, state, NERC demand growth forecasts
§ S&P Global Market Intelligence