
Information Visualization Part 1 - Bryn Mawr · Information Visualization ... • Nathan Yau,...
41
Information Visualization Part 1 Dianna Xu Deepak Kumar
Transcript of Information Visualization Part 1 - Bryn Mawr · Information Visualization ... • Nathan Yau,...
Information Visualization Part 1
Dianna XuDeepak Kumar

BIG DATA
• Data intensive computingcapturecurationstoragesearchsharinganalysisvisualization
11/20/2012 2

Data Science
11/20/2012 3

Data Science
11/20/2012 4
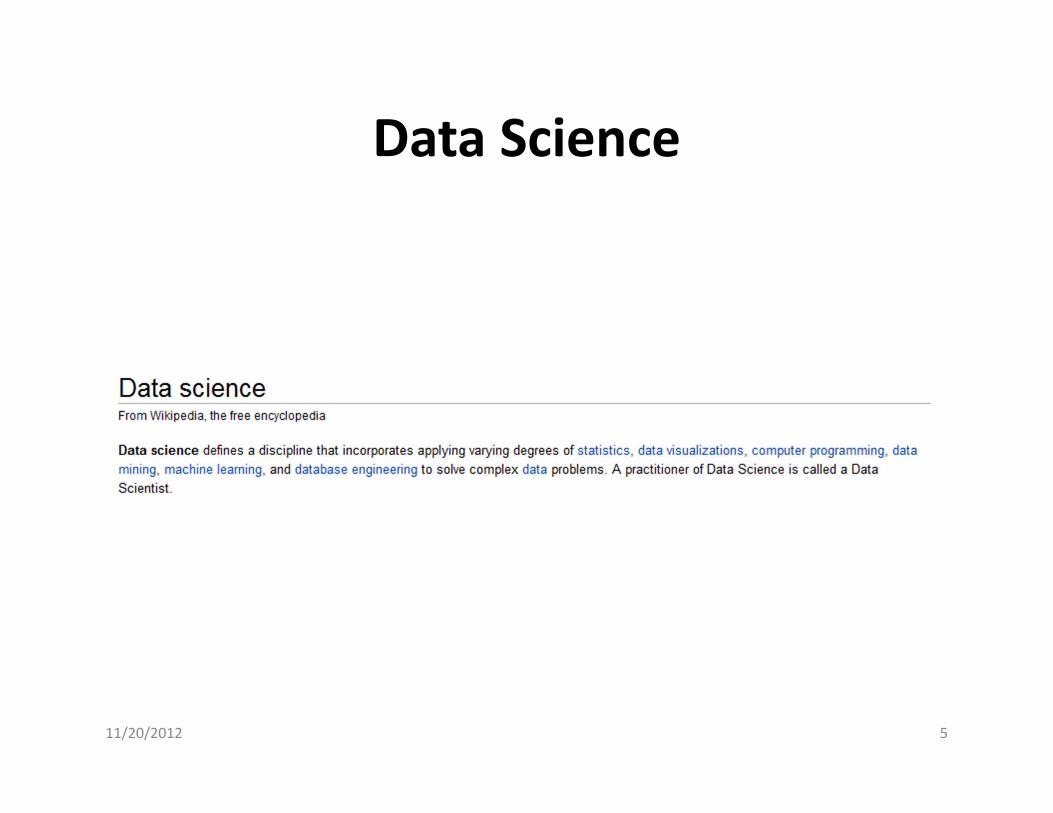
Data Science
11/20/2012 5
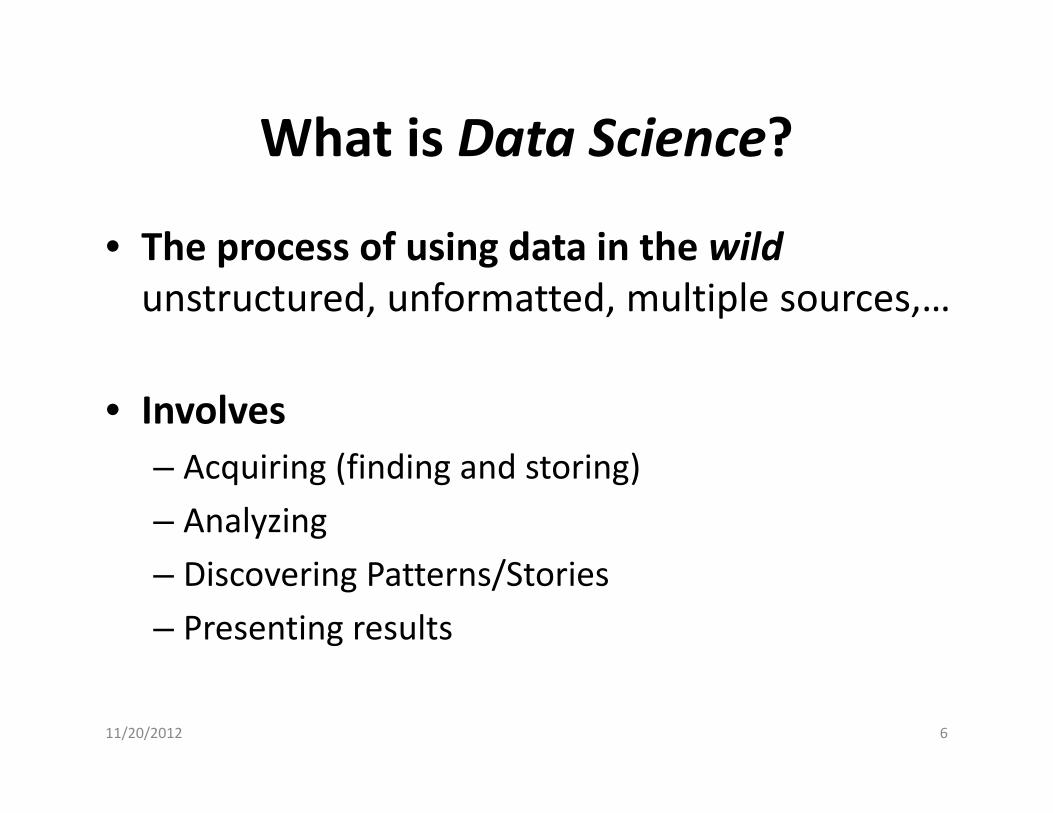
What is Data Science?
• The process of using data in the wildunstructured, unformatted, multiple sources,…
• Involves– Acquiring (finding and storing)– Analyzing – Discovering Patterns/Stories– Presenting results
11/20/2012 6
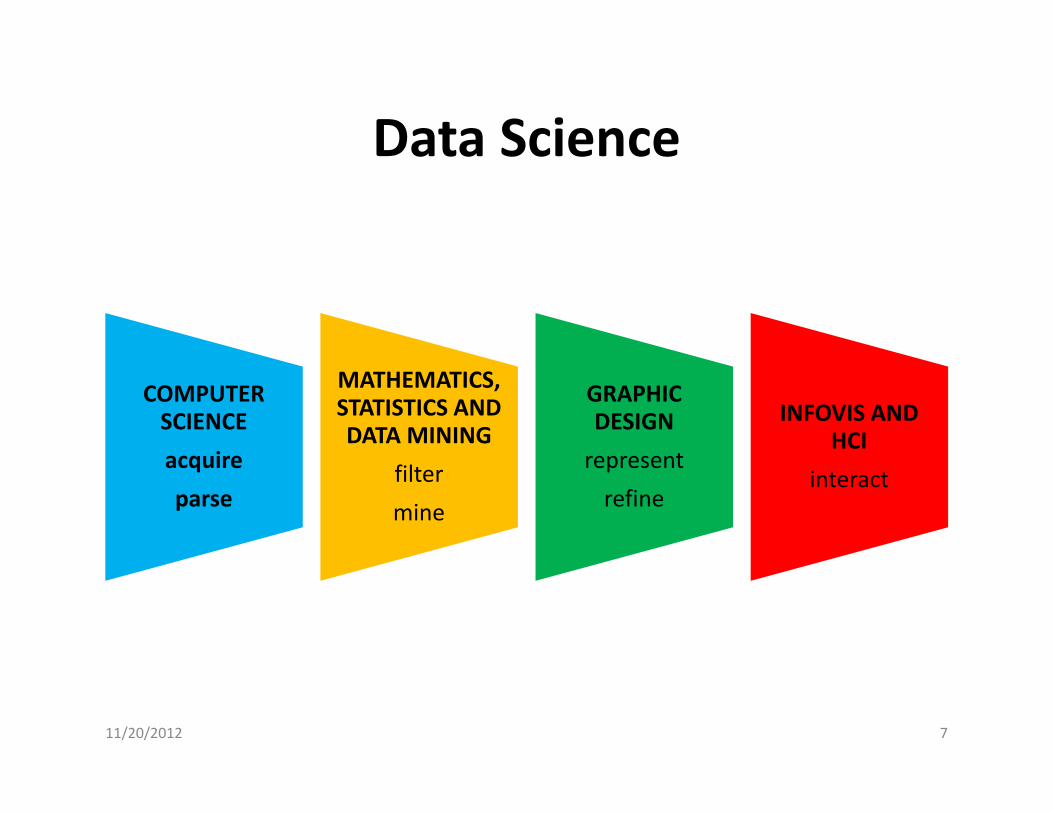
Data Science
COMPUTER SCIENCEacquireparse
MATHEMATICS, STATISTICS AND DATA MINING
filtermine
GRAPHIC DESIGNrepresentrefine
INFOVIS AND HCI
interact
11/20/2012 7
Visualizing Data
11/20/2012 8
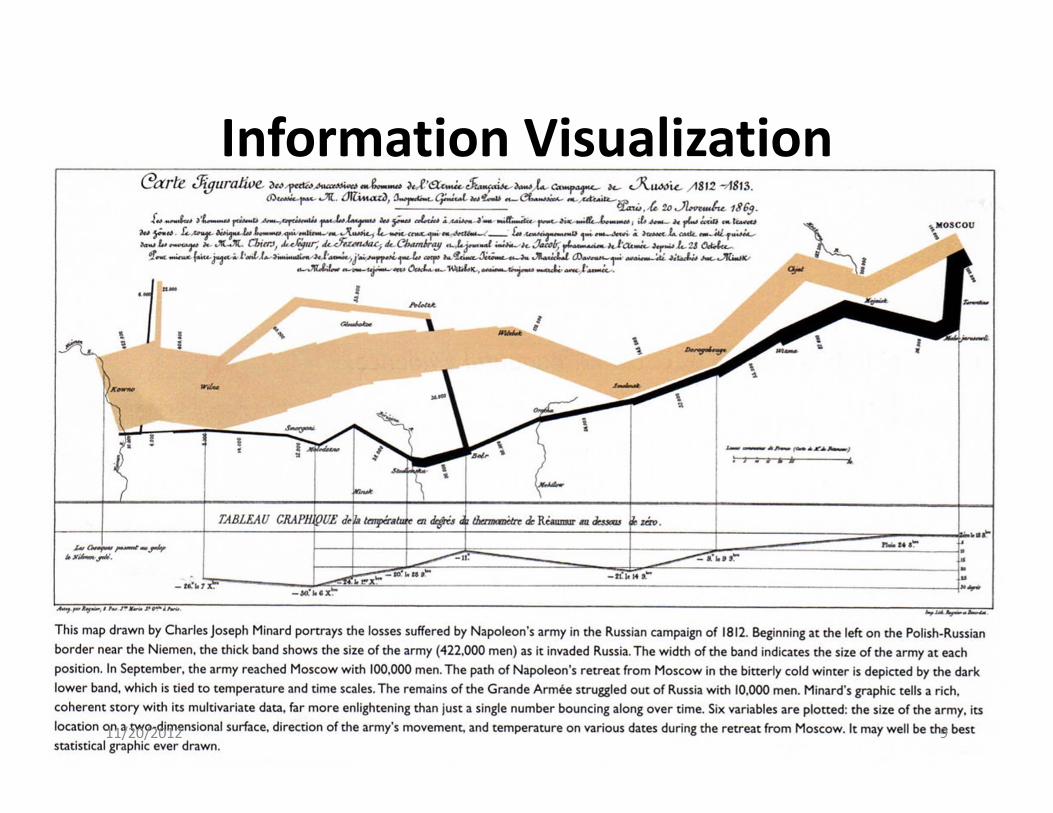
Information Visualization
11/20/2012 9
Big Data
• The amount of available data is quickly outpacing our ability to understand and use it in meaning full ways.
• The eventual solution to big data is likely really good black boxes.
• Black boxes only give answers if you know right questions to ask.
11/20/2012 10
Visualization and Explorative Data Analysis
• Visualization allows one to view things in global context.
• Increase the likelihood of spotting unexpected trends and perspectives.
• Allows new questions to be asked.• The life cycle of explorative data analysis with visualization is likely an iterative process
11/20/2012 11
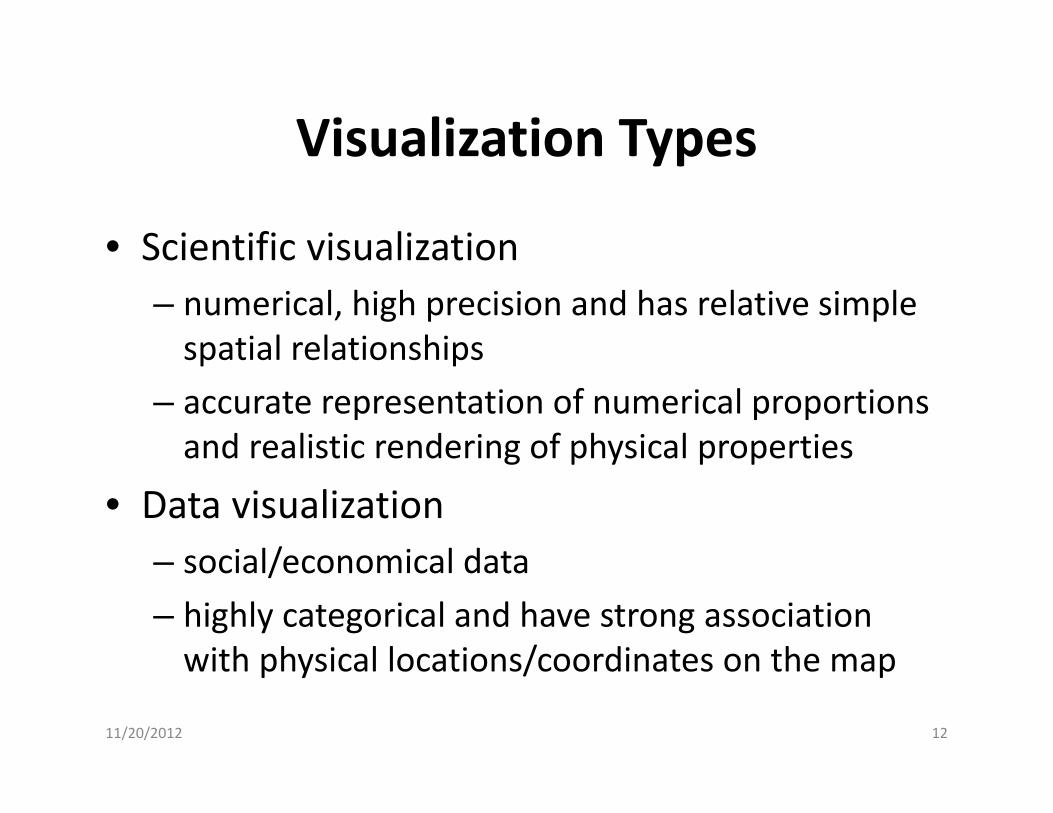
Visualization Types
• Scientific visualization– numerical, high precision and has relative simple spatial relationships
– accurate representation of numerical proportions and realistic rendering of physical properties
• Data visualization– social/economical data– highly categorical and have strong association with physical locations/coordinates on the map
11/20/2012 12
Information Visualization
• Arbitrary or complex relationships with no clearly prescribed spatial representation choices
• Abstract representation techniques• Communication is an important goal• infoviz versus data journalism
11/20/2012 13

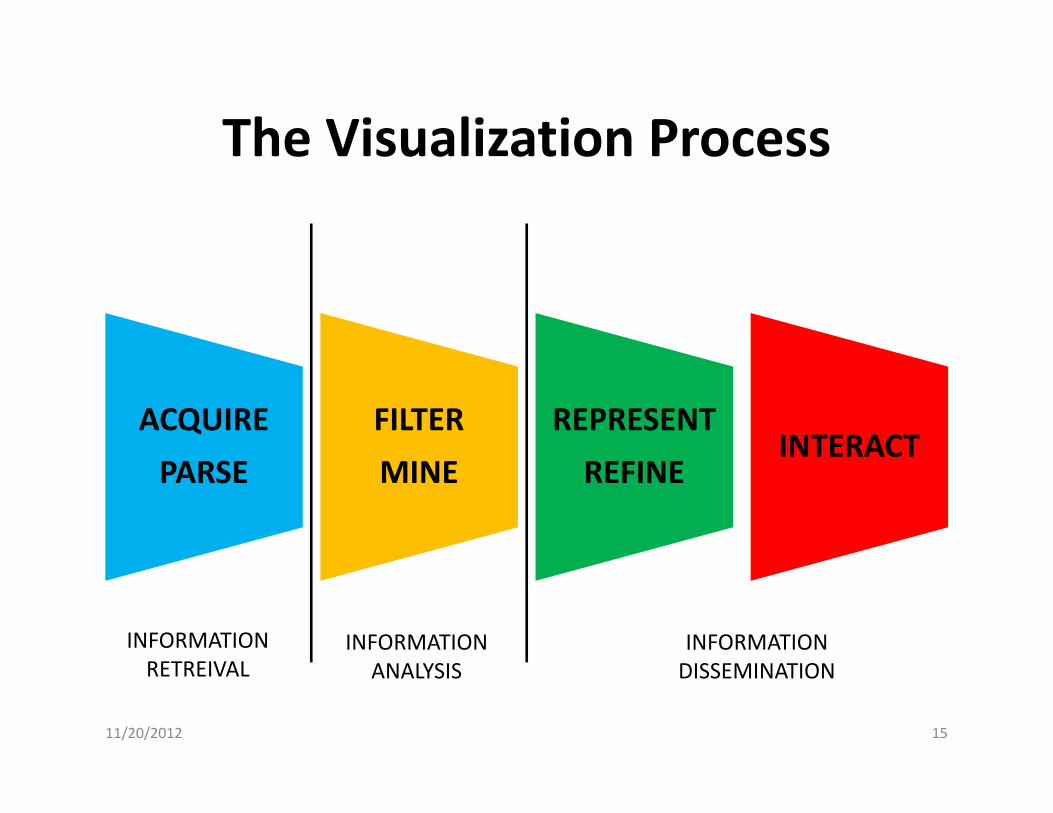
The Visualization Process
ACQUIREPARSE
FILTERMINE
REPRESENTREFINE
INTERACT
11/20/2012 14
The Visualization Process
ACQUIREPARSE
FILTERMINE
REPRESENTREFINE
INTERACT
11/20/2012 15
INFORMATIONRETREIVAL
INFORMATIONANALYSIS
INFORMATIONDISSEMINATION
Example: Mapping Numbers
• How to represent numbers with visual primitives so that relative values of numbers can be quickly deduced from visual cues
• A simple data set– 255 integers valued 0‐99– collected on twitter as random numbers
11/20/2012 16

Mapping Numbers
11/20/2012 17

Mapping Numbers
11/20/2012 18

Information Dimensions
• A fundamental challenge of visualization design is to add more information dimensions without introducing clutter
• Display is 2D
• Going 3D is not a solution
11/20/2012 19

1. Time Series
11/20/2012 20
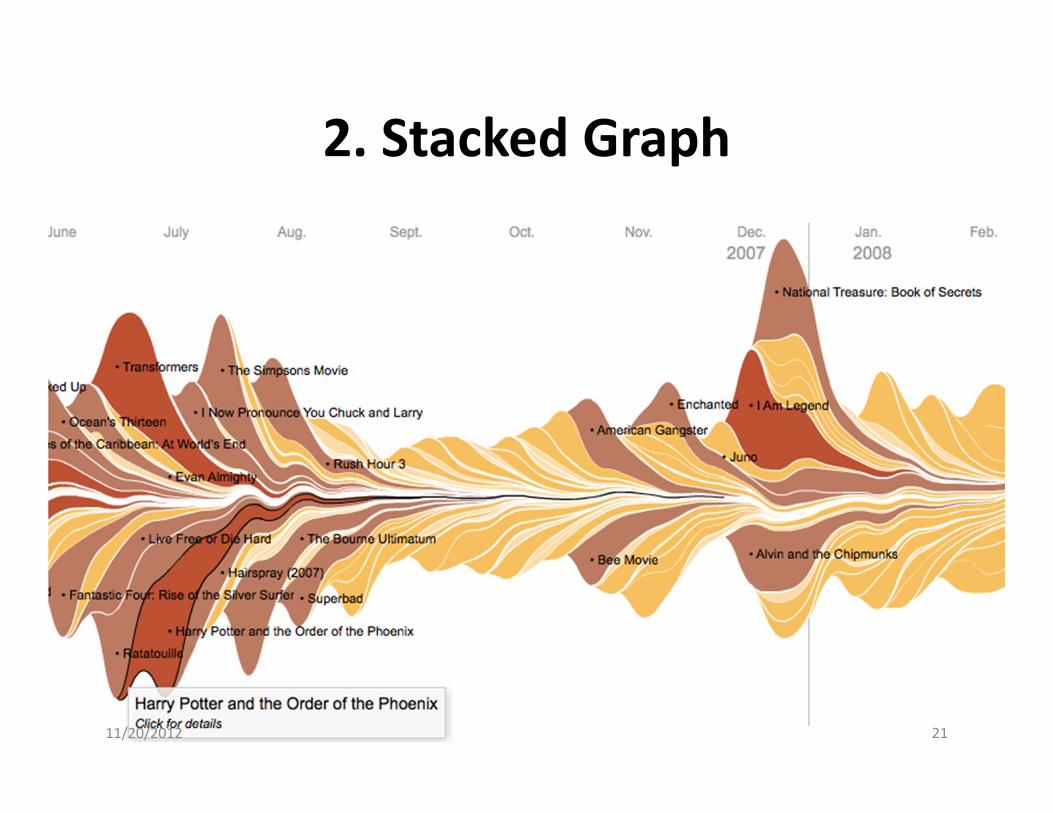
2. Stacked Graph
11/20/2012 21
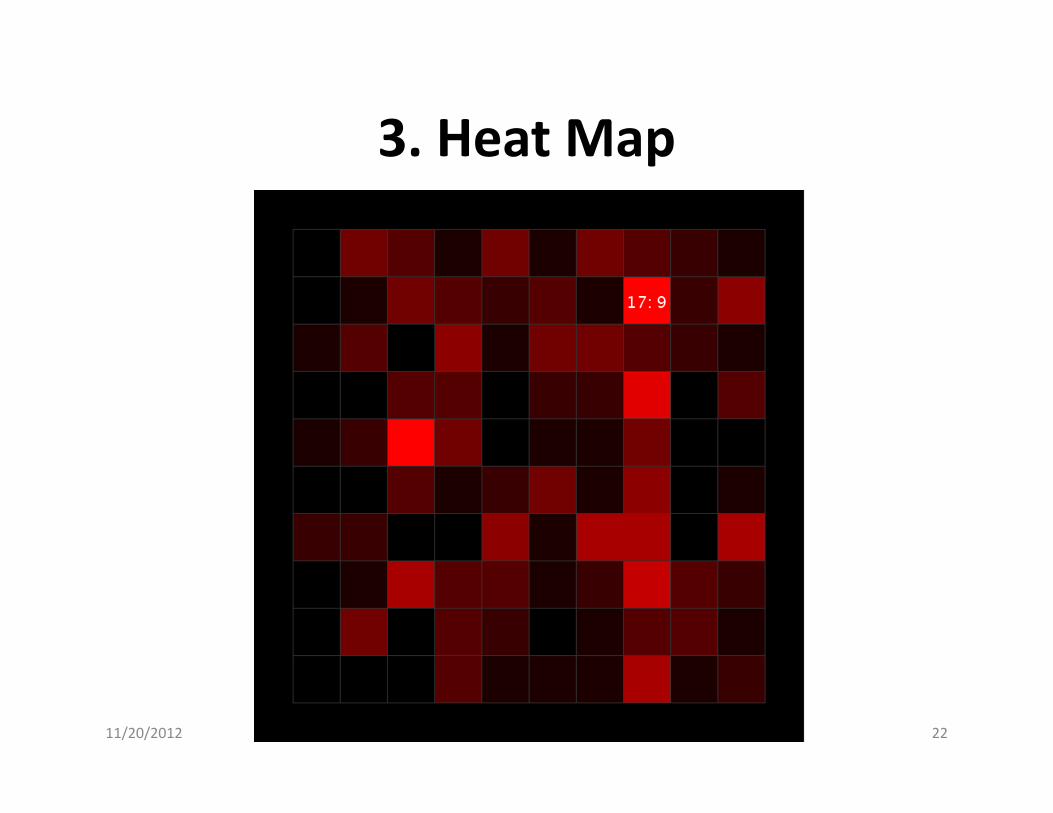
3. Heat Map
11/20/2012 22

11/20/2012 23

Looking Deeper…
11/20/2012 24
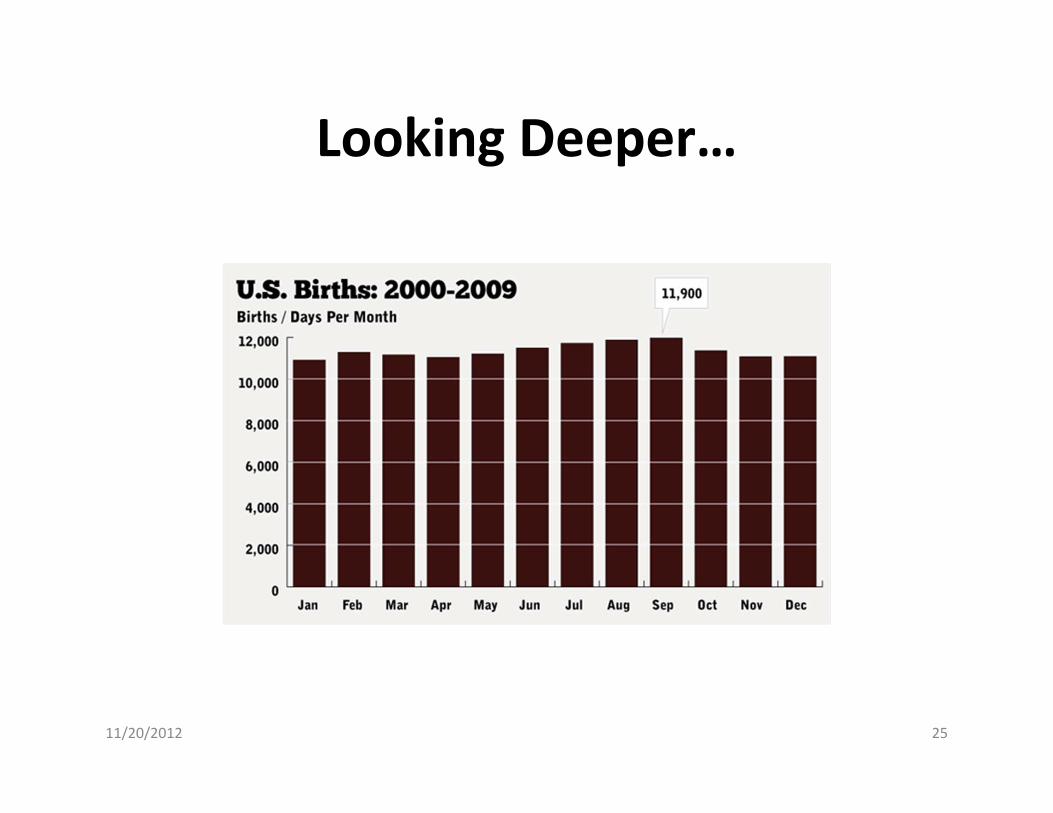
Looking Deeper…
11/20/2012 25
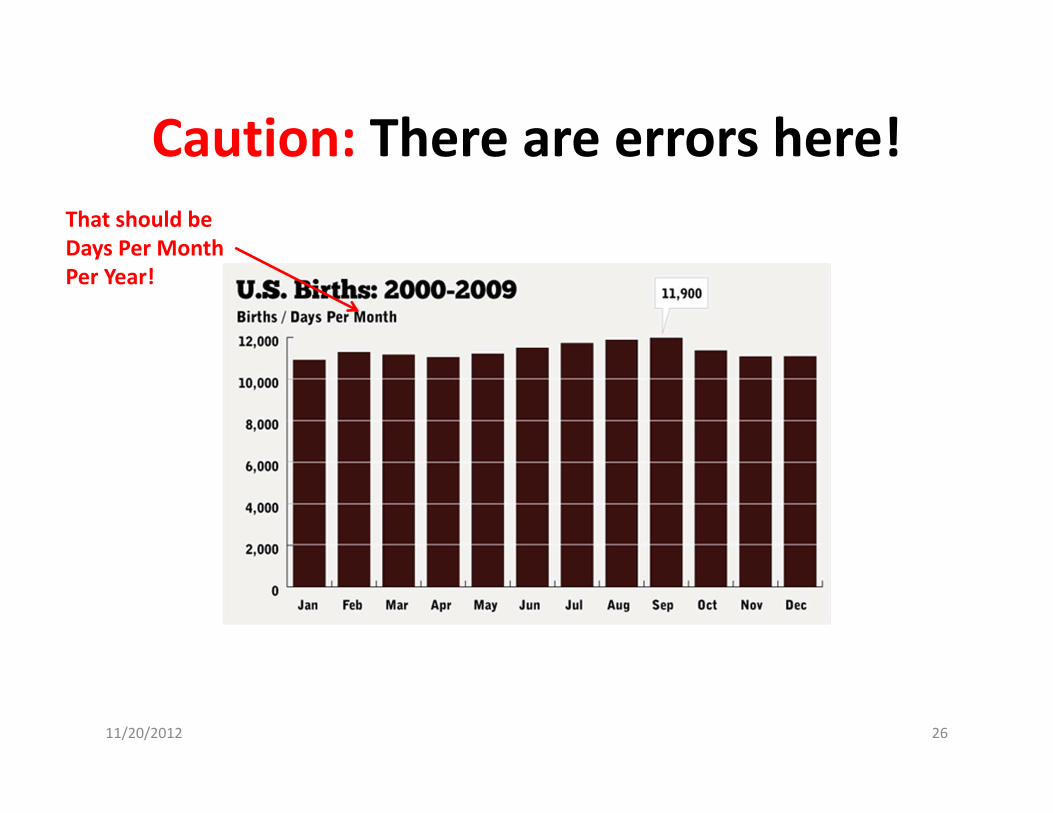
Caution: There are errors here!That should beDays Per MonthPer Year!
11/20/2012 26

4. Proportional Symbols
11/20/2012 27

5. Word Clouds
11/20/2012 28

World Clouds
11/20/2012 29
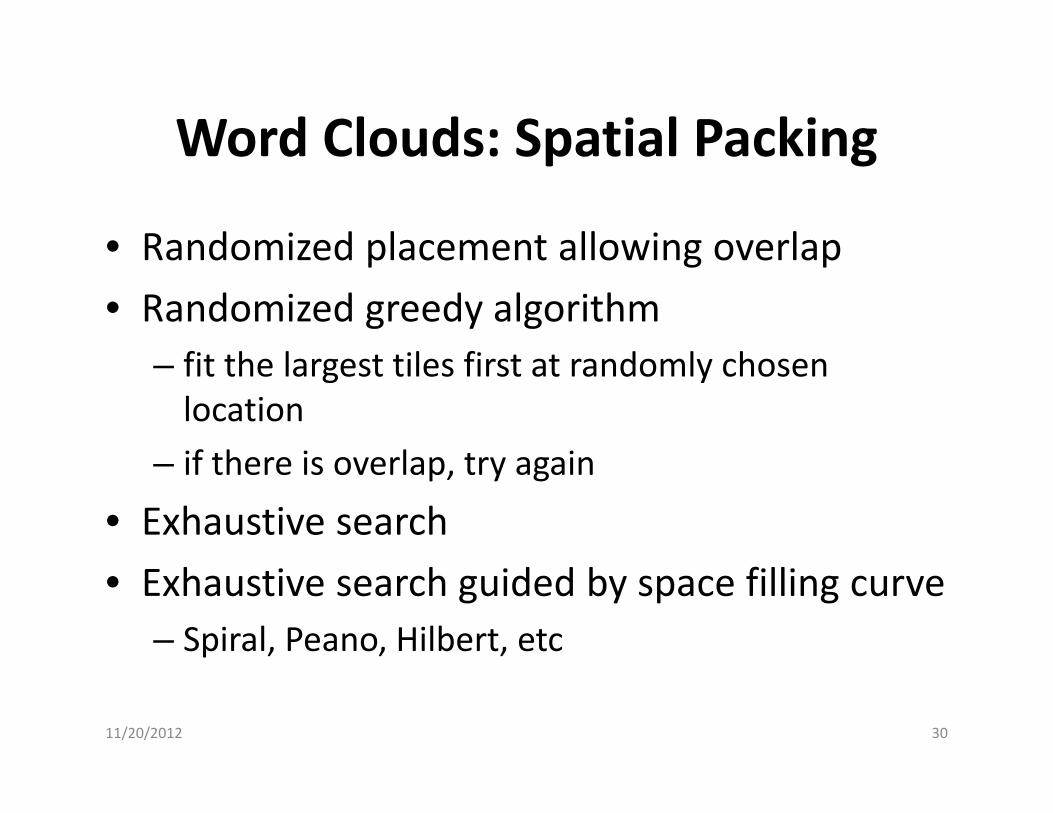
Word Clouds: Spatial Packing
• Randomized placement allowing overlap• Randomized greedy algorithm
– fit the largest tiles first at randomly chosen location
– if there is overlap, try again
• Exhaustive search• Exhaustive search guided by space filling curve
– Spiral, Peano, Hilbert, etc
11/20/2012 30

Word Clouds: Spiral Packing
11/20/2012 31
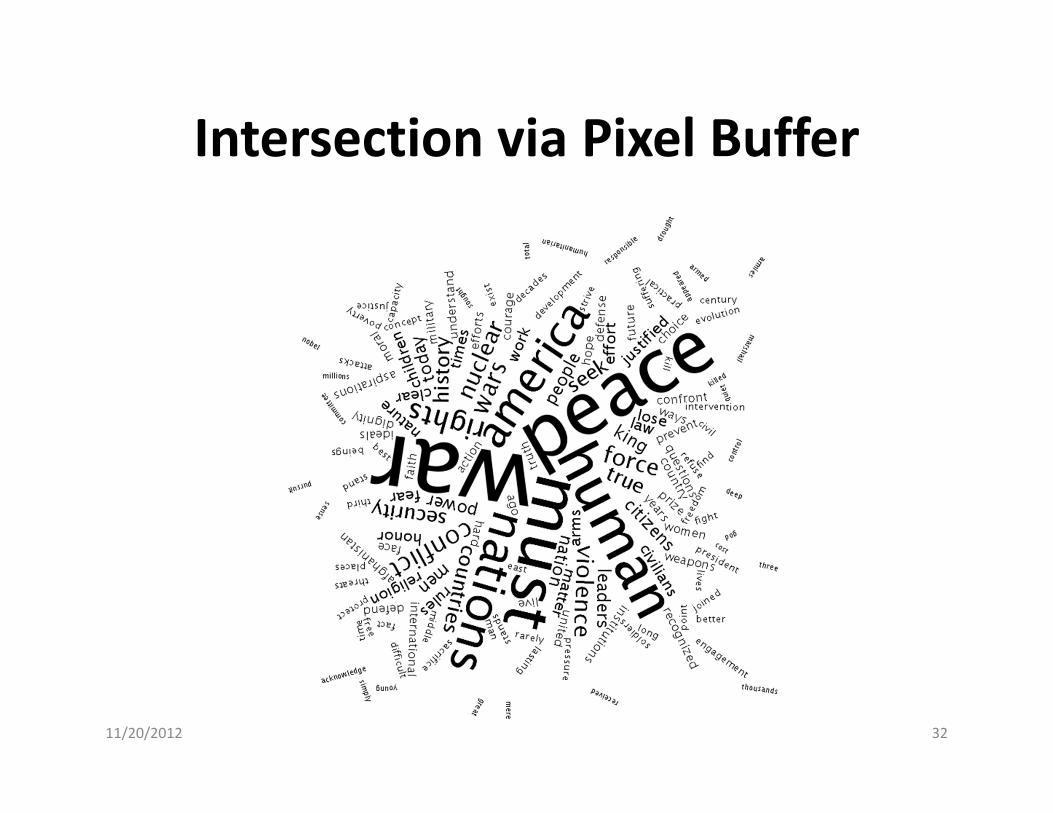
Intersection via Pixel Buffer
11/20/2012 32
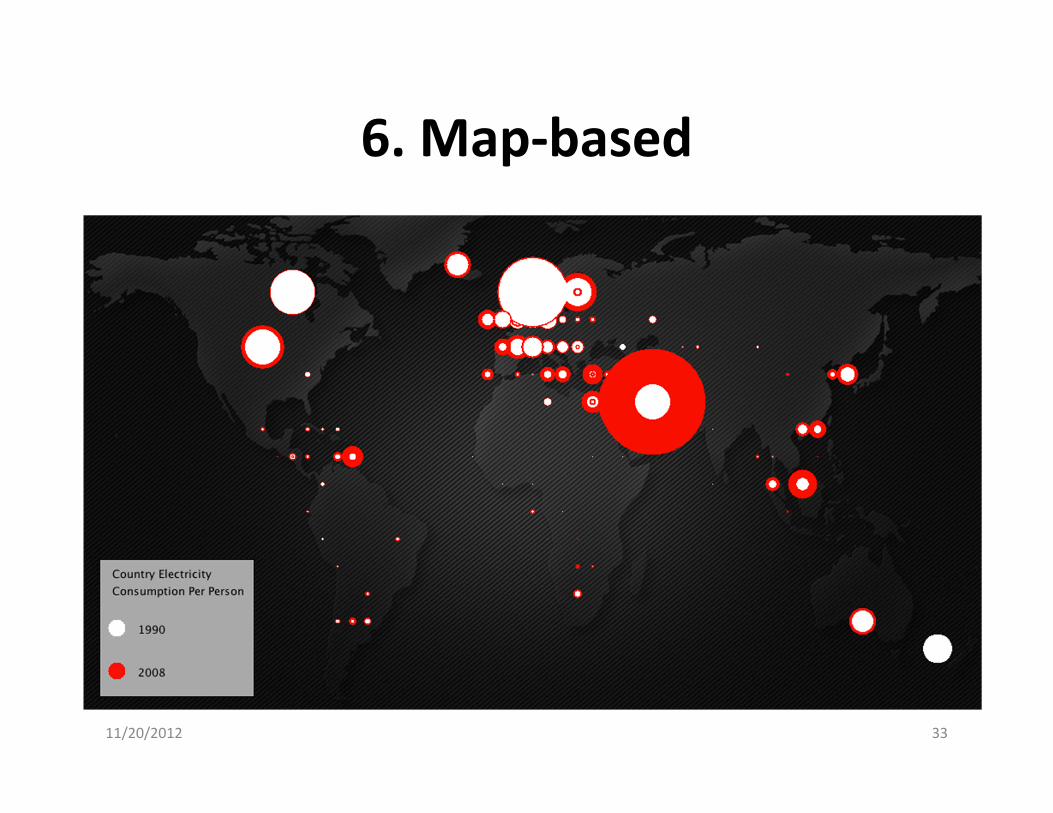
6. Map‐based
11/20/2012 33

Coordinate Conversions
• Translate physical coordinates to drawing coordinates
• Geographical coordinates• Modern world map employing a Universal Transverse Mercator (UTM) projection
• What if your data comes with names of countries or states?
11/20/2012 34

7. Choropleth Maps
11/20/2012 35

Choropleth Maps
• Thematic maps require that you color an entire area (state) with a particular color
• Need polygonal outlines of a state• A US political map of SVG format contains coordinates as an XML file
• Combine with Google Maps API to create interactive map overlay
11/20/2012 36
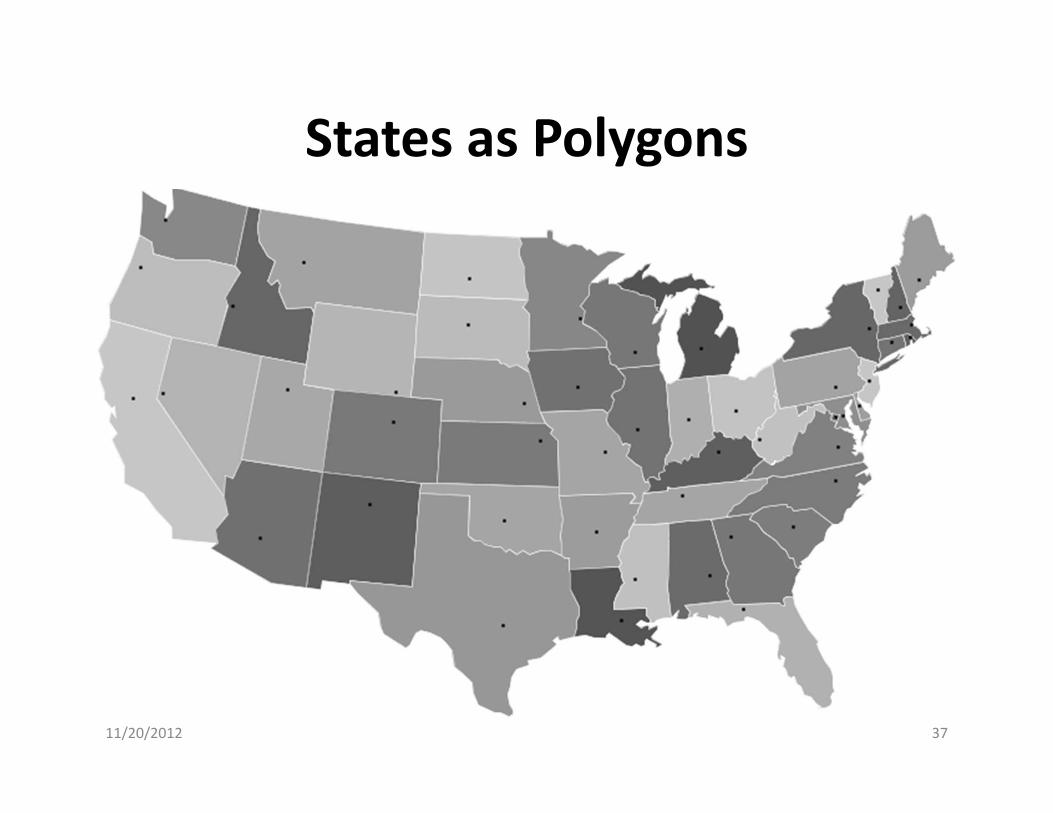
States as Polygons
11/20/2012 37
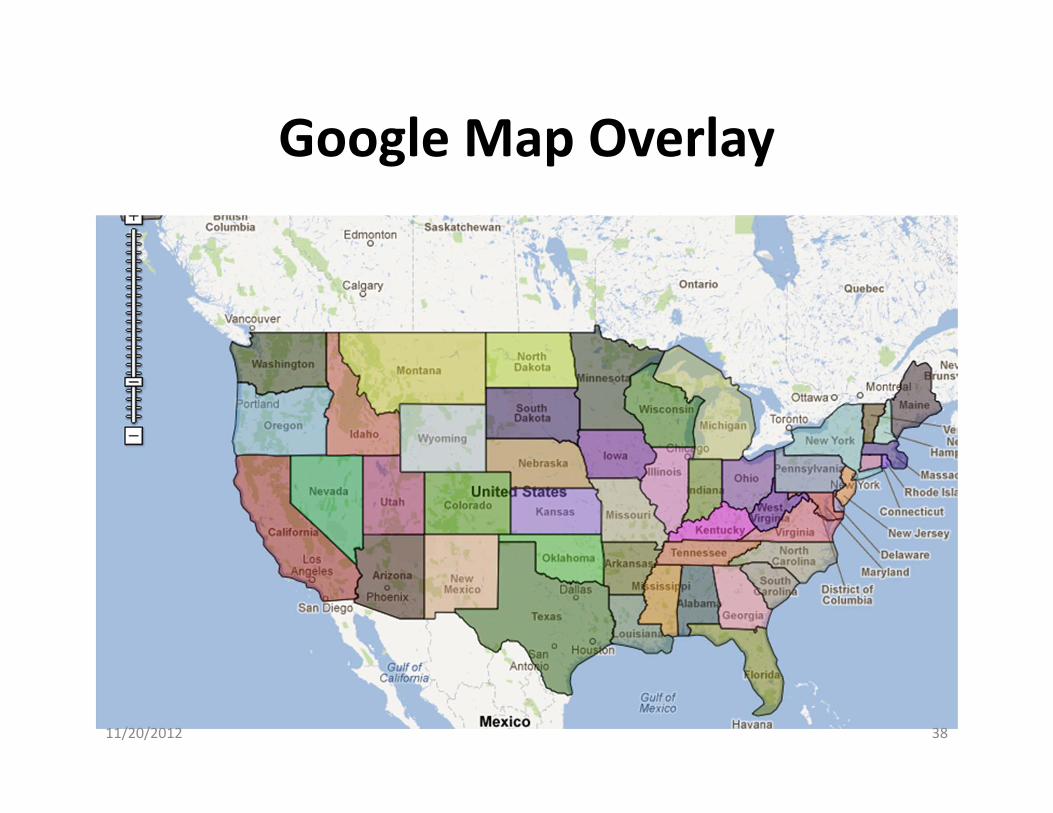
Google Map Overlay
11/20/2012 38

Foursquares Check‐ins
11/20/2012 39
11/20/2012 40
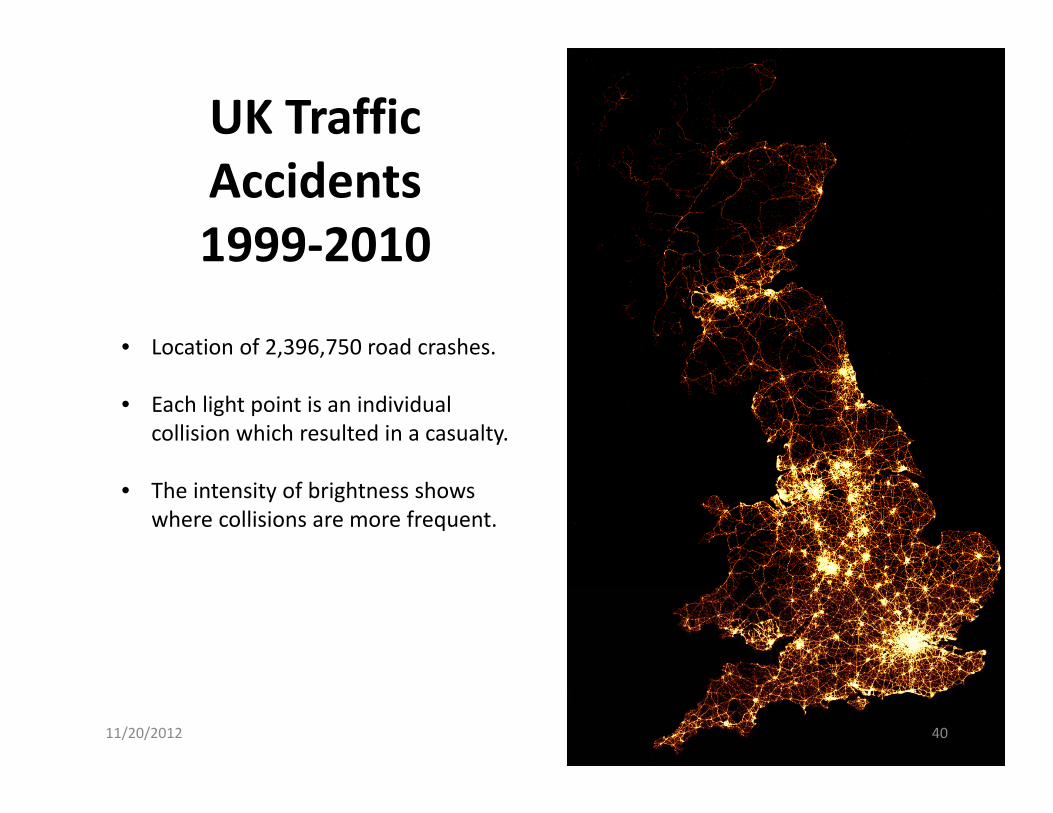
UK Traffic Accidents1999‐2010
• Location of 2,396,750 road crashes.
• Each light point is an individual collision which resulted in a casualty.
• The intensity of brightness shows where collisions are more frequent.
References• Thorp, Jer: Your Random Numbers – Getting Started with Processing and Data Visualization• By Jer | April 11, 2010. http://blog.blprnt.com/blog/blprnt/your‐random‐numbers‐getting‐started‐with‐processing‐and‐data‐
visualization• The Data Deluge, The Economist, Feb 25th 2010.• Edward Tufte, Presenting Data and Information: A One‐Day Course. www.edwardtufte.com• Ira Greenberg, Dianna Xu, Deepak Kumar, Processing: Creative Coding and Generative Art, FriendsOfEd, 2012, forthcoming.• Nathan Yau, Visualize This: The Flowing Data Guide to Design, Visualization, and Statistics, Wiley, 2011.• Christian Langreiter, Tweet (@chl) at 6:10 AM on September 28, 2011.• Hal Varian, On How the Web Challenges Managers, The McKinsey Quarterly, January 2009.• National Science Foundation, Core Techniques and Technologies for Advancing Big Data Science & Engineering (BIGDATA),
Solicitation 12‐499, 2012. • MIT News, MIT, Intel unveil new initiatives addressing ‘big data’, May 31, 2012.• Wikipedia, Data Science. http://en.wikipedia.org/wiki/Data_science• Ben Fry, Computational Information Design (PhD Thesis), Massachusetts Institute of Technology, April 2004.• David Smith, Revolutions Blog (http://blog.revolutionanalytics.com/2011/09/data‐science‐a‐literature‐review.html),
September 2011.• Tweet from CS News Update at 9:54PM on May 21, 2012.• Matt Stiles, How Common Is Your Birthday? Parts 1 & 2. The Daily Viv Blog, May 12 & 18, 2012. Available at:
http://thedailyviz.com/2012/05/12/how‐common‐is‐your‐birthday/• Deepak Kumar. Data Science Overtakes Computer Science. ACM Inroads Magazine. Volume 3 Issue 3, September 2012. ACM
New York.• Illuminated Map Displays UK Traffic Casualties Posted by Eugene on December 7, 2011 at 1:00pm
(http://www.mymodernmet.com/profiles/blogs/illuminated‐map‐displays‐uk‐traffic‐casualties)• Min Chen & Luciano Floridi, An Analysis of Information in Visualization, Synthese 2012 (to appear), Springer.
11/20/2012 41