Scientists, Athletes, and Entertainers. Scientists Athletes Entertainers.
University of Nebraska - LincolnDigitalCommons@University of Nebraska - Lincoln
Library Philosophy and Practice (e-journal) Libraries at University of Nebraska-Lincoln
7-2011
Information Use Patterns by Scientists: A CaseStudy of NEIST, Jorhat, North East IndiaRabinarayan MishraMizoram University, [email protected]
Follow this and additional works at: http://digitalcommons.unl.edu/libphilprac
Part of the Library and Information Science Commons
Mishra, Rabinarayan, "Information Use Patterns by Scientists: A Case Study of NEIST, Jorhat, North East India" (2011). LibraryPhilosophy and Practice (e-journal). 590.http://digitalcommons.unl.edu/libphilprac/590

http://unllib.unl.edu/LPP/
Library Philosophy and Practice 2011
ISSN 1522-0222
Information Use Patterns byScientists: A Case Study ofNEIST, Jorhat, North East IndiaDr. Rabinarayan MishraAssistant ProfessorDepartment of Library and Information ScienceMizoram University, Aizawl 796 009, India
Introduction
Proper and adequate information is indispensable for scientific and economic progress of anation. A scientist in the broadest sense refers to any person who is engaged in a systematicactivity to acquire knowledge or an individual who is engaged in such practices and that arelinked to schools of thought or philosophy. Scientists are those individuals who use thescientific method in acquiring information and organize, analyze, and implement it in the areaof research.
Scientists depend on communication with fellow scientists, specialists, and experts to keepabreast of current developments. Research workers almost always rely on the work of othersscientists working the same field. Scientists frequently search for information on the latesttrends and developments. They also acquaint themselves with innovations in their fields.Thus, information helps the scientists be well-informed. Science and technology in India canbe visualized from the following figure
figure1.
Science & Technology (S&T) under the auspices of Central Government of India comprisesthe Department of Science and Technology (DST), Department of Scientific & IndustrialResearch (DSIR), Department of Atomic Energy (DAE), Department of Space (DoS),Department of Biotechnology (DBT), and Department of Ocean Development (DOD).However, the Council of Scientific and Industrial Research (CSIR), with its 40 institutesdedicated to research and development in well-defined areas and around 100 field stations,

is the major organization under DSIR, including the institutions like National InformationSystem for Science and Technology (NISSAT), and Department of Ocean Development(DOD). There are about 200 national laboratories and an equal number of research &development (R&D) institutes in the Central Sector, with about 1,300 R&D units in theindustrial sector and thousands of employees. In addition to R&D establishments, the othermajor body pursuing S&T activities in India is the country's vast university system comprising162 universities, 32 institutions deemed universities, and 10 institutes of national importancewhich are considered to be major sources of S&T, producing around 200,000 S&T personnelevery year.
North East Institute of Science and Technology (NEIST)
North East Institute of Science and Technology (NEIST), situated at Jorhat in North EastIndia. It was previously known as Regional Research Laboratory, Jorhat, and it was institutedas a wing of CSIR for research and development in the fields of oil field chemicals,agrochemical, agro technologies for medicinal & aromatic plants, drug & drug intermediates,specialty papers & boards, organic & inorganic chemicals, biochemistry & biotechnology,chemical engineering, geo science & seismicity and building materials. The major thrust ofResearch and Development (R&D) activities of NEIST has been to develop indigenoustechnologies and knowledge by utilizing immense natural wealth of the North EasternRegions of India.
Knowledge Resource Centre
As a policy decision of Government of India, all CSIR laboratories in India were converted toKnowledge Resource Centers (KRC) in 2008 including NEIST Library. Library andDocumentation Division, the earlier name of NEIST, Jorhat was established in 1961 to caterto the needs of R&D staff, research fellows, outside students, and universities of North EastRegion and other R&D and Industrial institutes such as Institute of Biotechnology and Geo-technic studies, ONGC-Jorhat, Cinnamara ONGC complex, Central Muga & Eri Research &Training Institute, Lahdoigarh, Jorhat, etc. The library provided extensive services to theNEIST branch laboratories, which are situated in Itanagar, Arunachal Pradesh and Imphal,Manipur. The KRC of NEIST, Jorhat has rich and outstanding collections of national andinternational journals, books, Indian and foreign patents, standards, reports, annotedbibliography on Dioscorea composita and D. floribunda, Solanum khasianum, Artemisinin,Genus Artemisia, Zanthoxylum Species, Genus Clerodendron, Cinnamomum Species, naturaldyes from plants, Zeolites, Zeolite analogue and Zeotype, Hydrotalcites, Anticancer Agents,Taxol, etc. The library as of 2008 has collection strength of 25,000 back volumes of journals,and 23,000 books, 6,000 Indian and foreign standards, 1.5 lakhs of Indian patents, and 6,000reports of various national and international organizations, a good quantum of e-sources suchas CD-ROMs, DVDs, etc. The library subscribes to 79 foreign and 86 Indian journals. Apartfrom the information provided by the library under study, it also provides a wide range offacilities such as document delivery service, Internet access, photocopying, electronic mail,etc.
Statement of the Problem
Information has a pragmatic value for scientists during research activities. It is obligatory onthe part of the research libraries attached to the R& D institutes to provide informationservices to scientists. The study focuses on information use patterns by scientists engaged invarious research and development programs at NEIST, it is mandatory to ascertain whetherthe scientists are being provided with the pertinent and genuine information by the libraries.The problems associated with libraries are that scientists are not provided with legitimateinformation due to multiple factors. Scientists are not being provided with subject gateways intheir fields. Hence, it is essential to discover the information needs of scientists.
Objectives of the Study
The objectives of the study are to :
Determine the information use patterns of the scientists in North-East Institute ofScience & Technology, Jorhat.Discover the purpose of use of information, and the nature and type of informationrequired by NEIST scientists.Investigate the channels through which information is accessed by the scientists ofNEIST;Ascertain the extent of current information needs and their uses by the scientists; andCorrelate the frequency of information needs and habit of library use by the scientists;
Significance of the Study
A research library is the nucleus of an information/knowledge center, which apart fromsupporting learning, teaching, and research needs of scientists, also acts as a platform foraccess to scholarly resources in electronic form. Growth and change have always beenprominent characteristics of libraries. These characteristics give rise to the development ofcollections and services within the library system. The research library responds both tochanges in the needs of scientists and within the field of information technology. Informationand communication technologies have revolutionized in collection development, which mainlyfocuses on digital materials acquired through gateways, portals, consortia, etc., on an Internetplatform. The significance of the present study is that it aims at evaluate the flexibility ofthese libraries in this fluid environment as well as their capabilities in developing a process tointegrate these changes into standard library practice in order to meet the current and futureneeds of the scientists, research associates, and research fellows.
Scope of the Study
NEIST, Jorhat comprises 175 Science & Technology staff, 16 Junior Research Fellow/SeniorResearch Fellow/Research Associates, and 34 Project Assistants, a total of 225. Thislaboratory comprises five major disciplines, including chemistry, biology, engineering,materials science, and geoscience. The present study is not limited to any specific discipline.
Methodology
The present study is based on the literature available in the library of NEIST. A structuredquestionnaire was distributed among the scientists of all the disciplines of NEIST. Dataobtained through the questionnaire were tabulated sequentially and supplemented withgraphs and analyzed. Interviews were also used for primary data collection. Further, URL siteof RRL i.e., NEIST, was also explored to obtain primary sources of information for the study,including a personal visit to the Laboratory to scan the Annual Reports, Highlights, VisionPlan of RRL, etc.
Secondary sources of information, such as unpublished dissertations, research results,published journals, books also were used to make the study more exhaustive and authentic.
Analysis and Findings
Analysis by Designation
Analysis of responses by designation of the library users’ under study has been reflected inTable 1 and Graph-1. Altogether 225 questionnaires were distributed to the scientific users inKRC, NEIST, which include 95 scientists, 80 TO/TA and 50 RA/SRF/JRF and PA. Out of225, a total number of 186 filled-in questionnaires were received which constitute82.67%.While analyzing the table it was revealed that, the users belong to the category ofRA/SRF/JRF and PA falls maximum which constitute 90% followed by scientists (81.05%)and TO/TA (80%). This shows that research scholars to the use of information in KRC.

Sl. No. Designation Questionnaire Distributed No. of Response % of Response
1. Scientists 95 77 81.05
2. TO/TA* 80 64 80
3. RA/SRF/JRF/PA* 50 45 90
Total 225 186 82.67
* RA=Research Associates, SRF=Senior Research Fellow, JRF= Junior Research Fellow,
PA= Project Assistant, TO= Technical Officer, TA= Technical Assistant.
(Table-1: Analysis by Designation)
Graph-1: Analysis by Designation
Analysis by Visit to Library
Analysis of visit to the library under study has been shown in Table 2 and Graph 2 whichreveals that, out of 186 visitors, the highest number of 110 users visit the KRC regularlywhich comes to 59.14% followed by the 76 numbers of users who visit the KRC occasionallywhich constitute 40.86%. This signifies the efficiency of the KRC, which provides the requiredinformation and other reading materials. From the above result of analysis it can beconcluded that most of the Scientists and other scientific personals are found to visiting inKRC regularly. Some of the users are interested only to use library occasionally duringleisure time. This situation has arises due to their limited time, lack of sufficient currentliterature. Frequency of KRC used by users is high due to location of current and backvolume of periodicals centrally and provision of up to date information through INTERNET.
Types of Uses Total no. of Users Percentage
110 59.14%
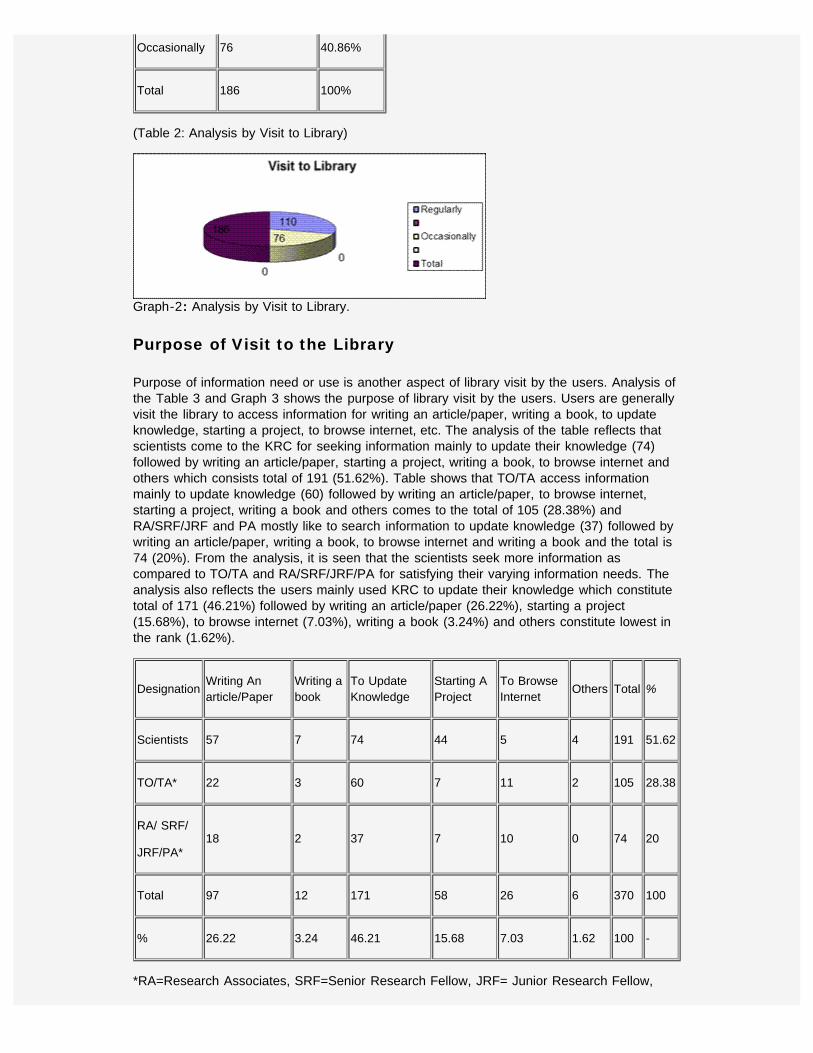
Occasionally 76 40.86%
Total 186 100%
(Table 2: Analysis by Visit to Library)
Graph-2: Analysis by Visit to Library.
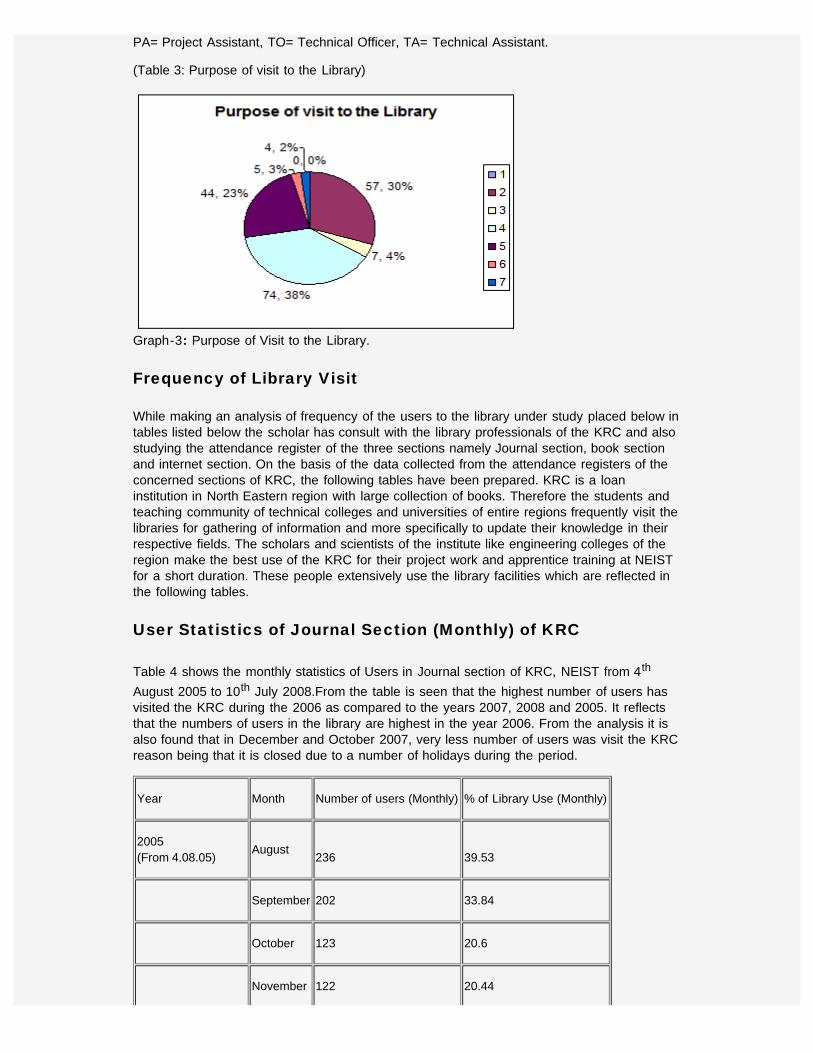
Purpose of Visit to the Library
Purpose of information need or use is another aspect of library visit by the users. Analysis ofthe Table 3 and Graph 3 shows the purpose of library visit by the users. Users are generallyvisit the library to access information for writing an article/paper, writing a book, to updateknowledge, starting a project, to browse internet, etc. The analysis of the table reflects thatscientists come to the KRC for seeking information mainly to update their knowledge (74)followed by writing an article/paper, starting a project, writing a book, to browse internet andothers which consists total of 191 (51.62%). Table shows that TO/TA access informationmainly to update knowledge (60) followed by writing an article/paper, to browse internet,starting a project, writing a book and others comes to the total of 105 (28.38%) andRA/SRF/JRF and PA mostly like to search information to update knowledge (37) followed bywriting an article/paper, writing a book, to browse internet and writing a book and the total is74 (20%). From the analysis, it is seen that the scientists seek more information ascompared to TO/TA and RA/SRF/JRF/PA for satisfying their varying information needs. Theanalysis also reflects the users mainly used KRC to update their knowledge which constitutetotal of 171 (46.21%) followed by writing an article/paper (26.22%), starting a project(15.68%), to browse internet (7.03%), writing a book (3.24%) and others constitute lowest inthe rank (1.62%).
DesignationWriting Anarticle/Paper
Writing abook
To UpdateKnowledge
Starting AProject
To BrowseInternet
Others Total %
Scientists 57 7 74 44 5 4 191 51.62
TO/TA* 22 3 60 7 11 2 105 28.38
RA/ SRF/
JRF/PA*18 2 37 7 10 0 74 20
Total 97 12 171 58 26 6 370 100
% 26.22 3.24 46.21 15.68 7.03 1.62 100 -
*RA=Research Associates, SRF=Senior Research Fellow, JRF= Junior Research Fellow,
PA= Project Assistant, TO= Technical Officer, TA= Technical Assistant.
(Table 3: Purpose of visit to the Library)
Graph-3: Purpose of Visit to the Library.
Frequency of Library Visit
While making an analysis of frequency of the users to the library under study placed below intables listed below the scholar has consult with the library professionals of the KRC and alsostudying the attendance register of the three sections namely Journal section, book sectionand internet section. On the basis of the data collected from the attendance registers of theconcerned sections of KRC, the following tables have been prepared. KRC is a loaninstitution in North Eastern region with large collection of books. Therefore the students andteaching community of technical colleges and universities of entire regions frequently visit thelibraries for gathering of information and more specifically to update their knowledge in theirrespective fields. The scholars and scientists of the institute like engineering colleges of theregion make the best use of the KRC for their project work and apprentice training at NEISTfor a short duration. These people extensively use the library facilities which are reflected inthe following tables.
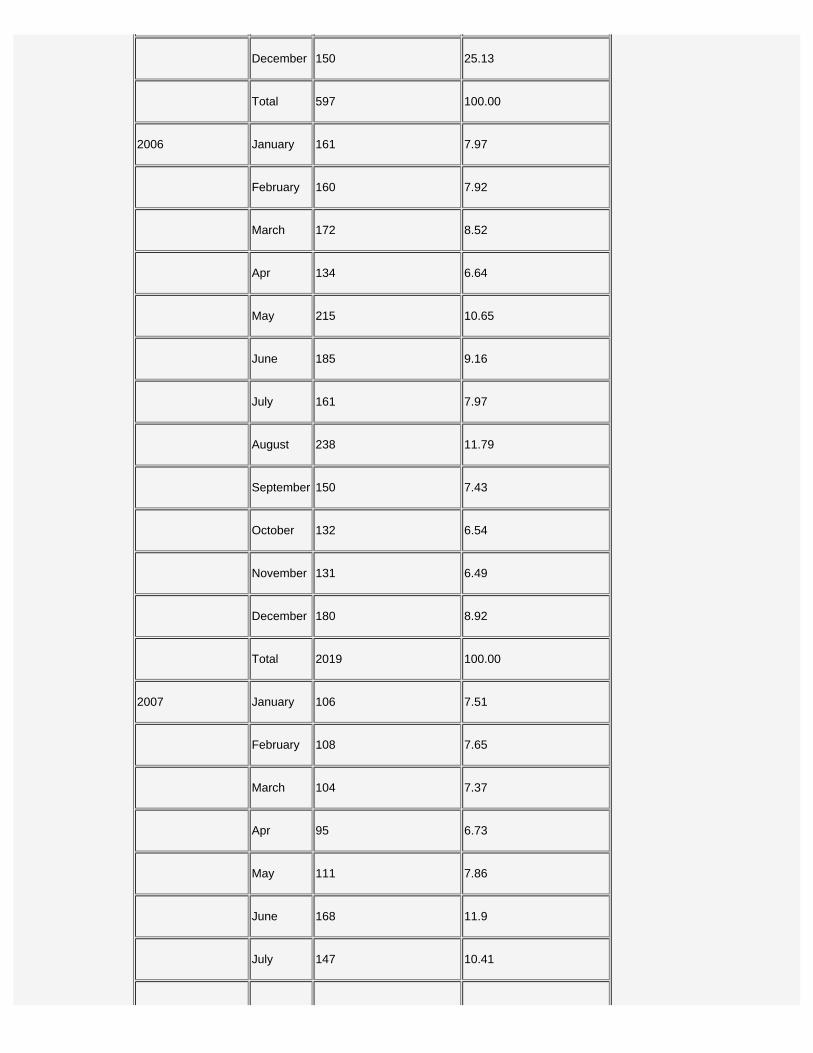
User Statistics of Journal Section (Monthly) of KRC
Table 4 shows the monthly statistics of Users in Journal section of KRC, NEIST from 4th
August 2005 to 10th July 2008.From the table is seen that the highest number of users hasvisited the KRC during the 2006 as compared to the years 2007, 2008 and 2005. It reflectsthat the numbers of users in the library are highest in the year 2006. From the analysis it isalso found that in December and October 2007, very less number of users was visit the KRCreason being that it is closed due to a number of holidays during the period.
Year Month Number of users (Monthly) % of Library Use (Monthly)
2005 (From 4.08.05)
August236 39.53
September 202 33.84
October 123 20.6
November 122 20.44
December 150 25.13
Total 597 100.00
2006 January 161 7.97
February 160 7.92
March 172 8.52
Apr 134 6.64
May 215 10.65
June 185 9.16
July 161 7.97
August 238 11.79
September 150 7.43
October 132 6.54
November 131 6.49
December 180 8.92
Total 2019 100.00
2007 January 106 7.51
February 108 7.65
March 104 7.37
Apr 95 6.73
May 111 7.86
June 168 11.9
July 147 10.41

August 188 13.31
September 117 8.29
October 75 5.31
November 120 8.5
December 73 5.17
Total 1412 100.01
2008 (up to 10.7.08) January 100 13.61
February 100 13.61
March 111 15.1
April 106 14.42
May 158 21.5
June 195 26.53
July 65 8.84
Total 735 113.61
Source: Users Attendance Register of Journal section in KRC (NEIST), Jorhat.
(Table 4: Users Statistics (per month) Journal Section in KRC of NEIST)
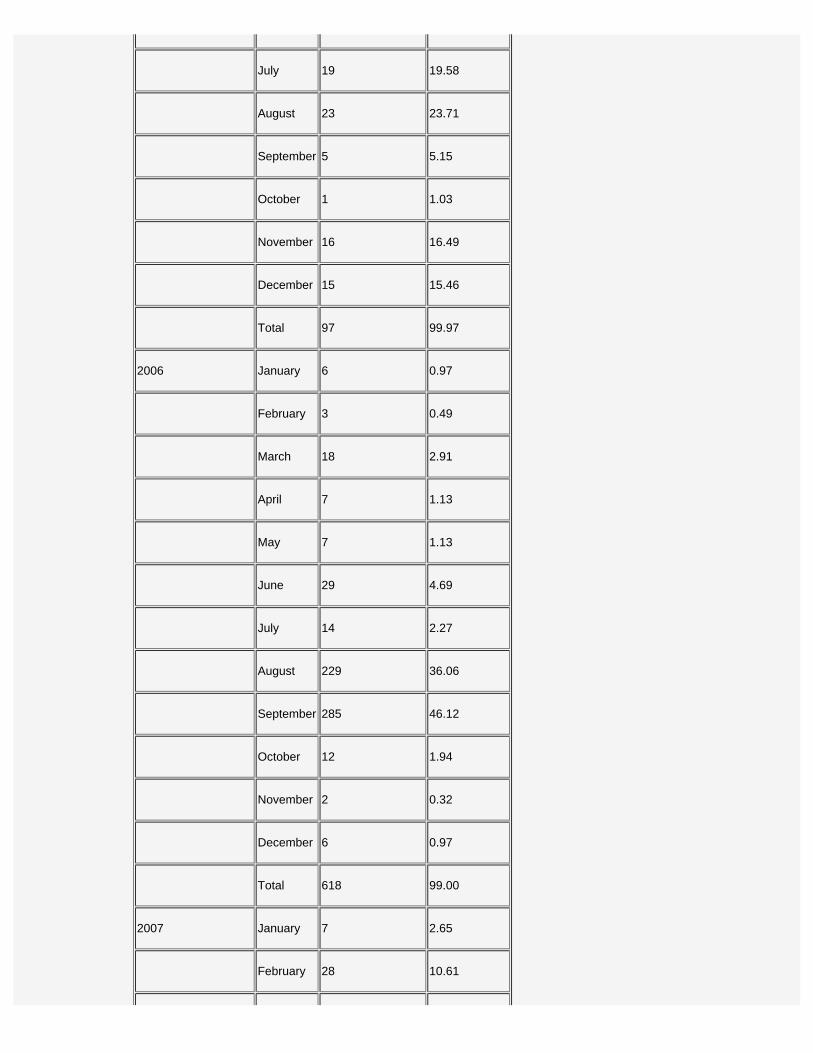
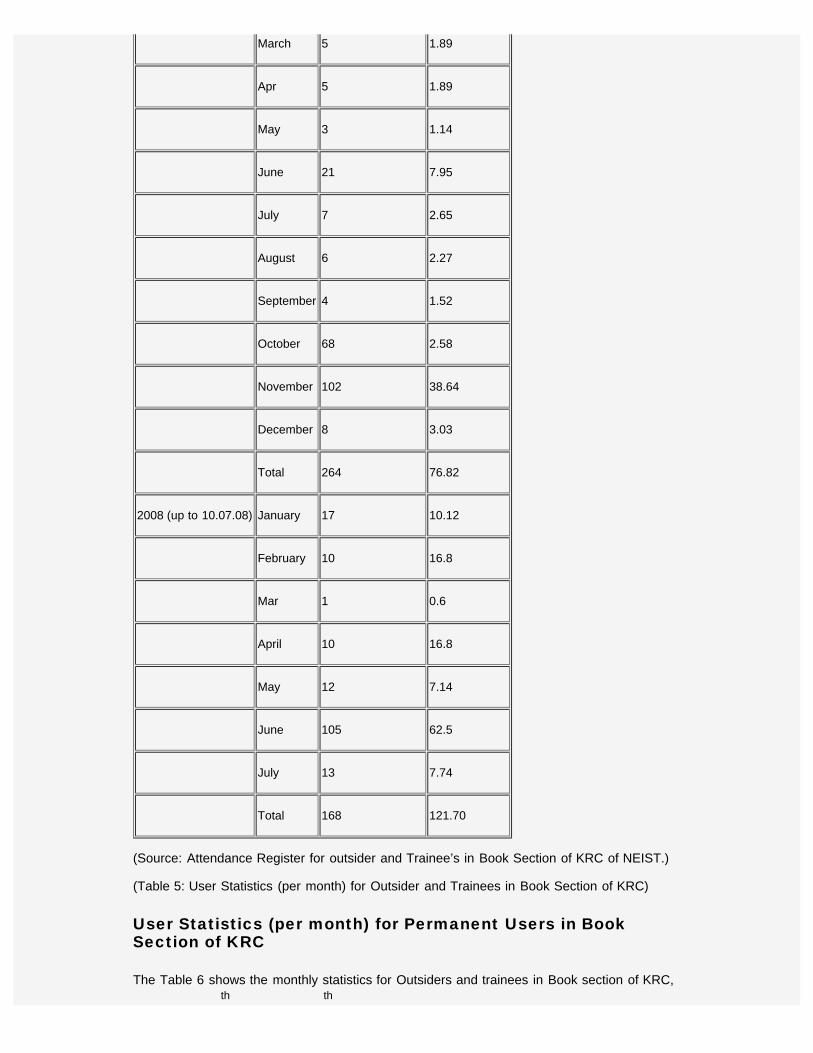
User Statistics for Outsiders and Trainee’s in Book Section ofKRC (Monthly)
The KRC, NEIST is offered membership to outsiders for utilizing some facility of Library onpayment basis. The Director of NEIST has been produce fee-based membership facility tothe outsider individuals/institutions. The institution also provides free membership for itstrainees. Table 5 shows the monthly user statistics for outsiders and trainee’s in book sectionof KRC, NEIST from June 2005 to 7th July 2008.From the table is seen that the highestnumber of users has visited the KRC during the 2006 as compared to the years 2007, 2008and 2005. It reflects that the number of library use was at the peak in the year 2006. Fromthe analysis it is also found that in October 2005, very less number of users was visited theKRC due to closure of the KRC for maximum number of holidays.
Year MonthNumber of Visitors (Monthly)
Percent of usemonthly
2005 (from June) June 18 18.55
July 19 19.58
August 23 23.71
September 5 5.15
October 1 1.03
November 16 16.49
December 15 15.46
Total 97 99.97
2006 January 6 0.97
February 3 0.49
March 18 2.91
April 7 1.13
May 7 1.13
June 29 4.69
July 14 2.27
August 229 36.06
September 285 46.12
October 12 1.94
November 2 0.32
December 6 0.97
Total 618 99.00
2007 January 7 2.65
February 28 10.61
March 5 1.89
Apr 5 1.89
May 3 1.14
June 21 7.95
July 7 2.65
August 6 2.27
September 4 1.52
October 68 2.58
November 102 38.64
December 8 3.03
Total 264 76.82
2008 (up to 10.07.08) January 17 10.12
February 10 16.8
Mar 1 0.6
April 10 16.8
May 12 7.14
June 105 62.5
July 13 7.74
Total 168 121.70
(Source: Attendance Register for outsider and Trainee’s in Book Section of KRC of NEIST.)
(Table 5: User Statistics (per month) for Outsider and Trainees in Book Section of KRC)
User Statistics (per month) for Permanent Users in BookSection of KRC
The Table 6 shows the monthly statistics for Outsiders and trainees in Book section of KRC,th th
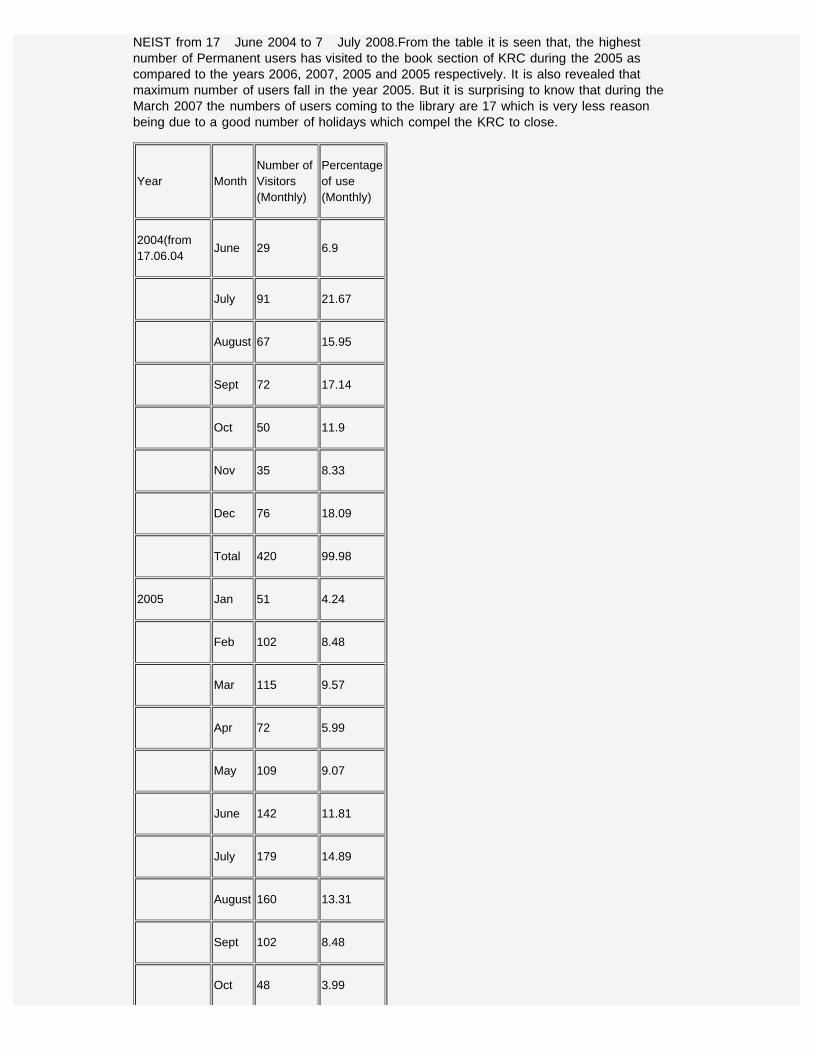
NEIST from 17 June 2004 to 7 July 2008.From the table it is seen that, the highestnumber of Permanent users has visited to the book section of KRC during the 2005 ascompared to the years 2006, 2007, 2005 and 2005 respectively. It is also revealed thatmaximum number of users fall in the year 2005. But it is surprising to know that during theMarch 2007 the numbers of users coming to the library are 17 which is very less reasonbeing due to a good number of holidays which compel the KRC to close.
Year MonthNumber of Visitors (Monthly)
Percentageof use(Monthly)
2004(from17.06.04
June 29 6.9
July 91 21.67
August 67 15.95
Sept 72 17.14
Oct 50 11.9
Nov 35 8.33
Dec 76 18.09
Total 420 99.98
2005 Jan 51 4.24
Feb 102 8.48
Mar 115 9.57
Apr 72 5.99
May 109 9.07
June 142 11.81
July 179 14.89
August 160 13.31
Sept 102 8.48
Oct 48 3.99

Nov 36 3
Dec 86 7.15
Total 1202 99.98
2006 Jan 47 7.1
Feb 34 5.14
Mar 43 6.5
Apr 30 4.53
May 112 16.92
June 60 9.06
July 37 5.59
August 96 14.5
Sept 60 9.06
Oct 42 6.34
Nov 55 8.31
Dec 46 6.95
Total 662 100.00
2007 Jan 24 5.41
Feb 53 11.94
Mar 17 3.82
Apr 36 8.1
May 43 9.68
June 27 6.08
July 52 11.71
August 50 11.26
Sept 21 4.73
Oct 25 5.63
Nov 64 14.41
Dec 32 7.21
Total 444 99.98
2008 (7.7.08) Jan 108 28.05
Feb 95 24.68
Mar 28 7.27
Apr 27 7.01
May 50 12.99
June 44 11.43
July 33 8.57
Total 385 100.00
(Source: Attendance Register for readers of Book section in KRC of NEIST)
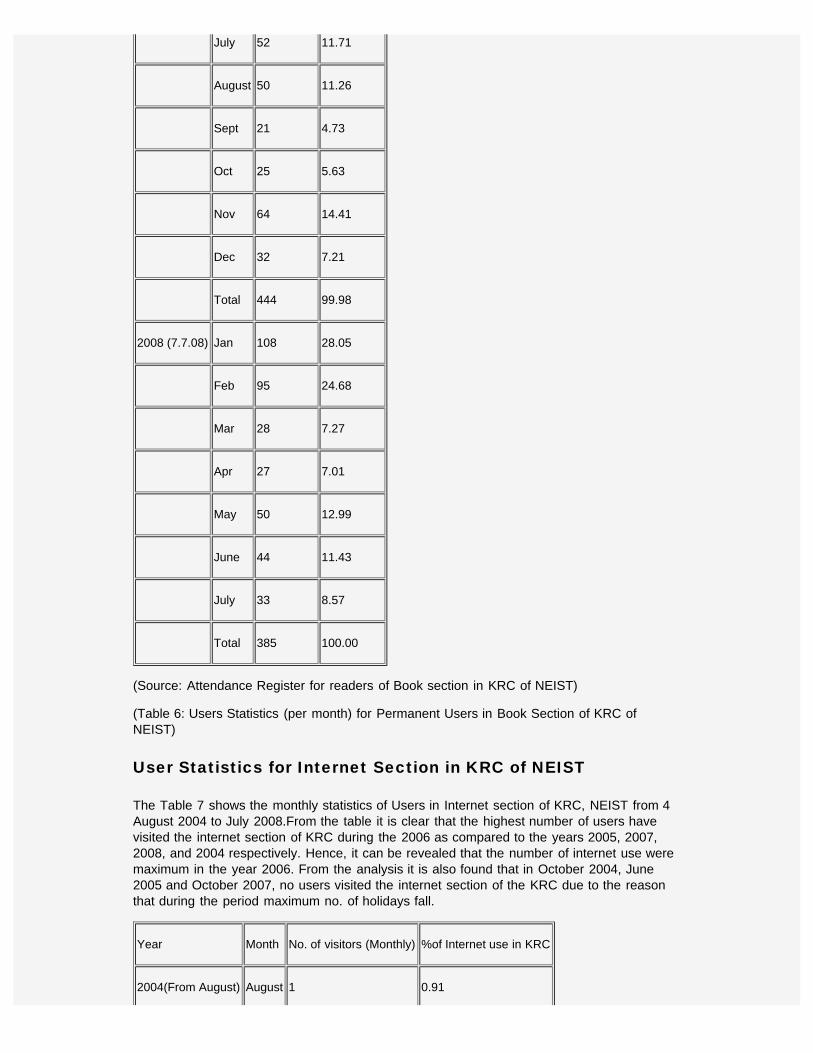
(Table 6: Users Statistics (per month) for Permanent Users in Book Section of KRC ofNEIST)
User Statistics for Internet Section in KRC of NEIST
The Table 7 shows the monthly statistics of Users in Internet section of KRC, NEIST from 4August 2004 to July 2008.From the table it is clear that the highest number of users havevisited the internet section of KRC during the 2006 as compared to the years 2005, 2007,2008, and 2004 respectively. Hence, it can be revealed that the number of internet use weremaximum in the year 2006. From the analysis it is also found that in October 2004, June2005 and October 2007, no users visited the internet section of the KRC due to the reasonthat during the period maximum no. of holidays fall.
Year Month No. of visitors (Monthly) %of Internet use in KRC
2004(From August) August 1 0.91

Sept 5 4.54
Oct 0 0
Nov 17 15.45
Dec 87 79.09
Total 110 99.99
2005 Jan 87 8.04
Feb 183 16.91
Mar 133 12.29
Apr 112 10.35
May 81 7.48
June 0 0
July 48 4.44
August 120 11.09
Sept 135 12.48
Oct 73 6.75
Nov 70 6.65
Dec 40 3.7
Total 1082 100.18
2006 Jan 66 5.44
Feb 71 5.85
Mar 91 7.49
Apr 64 5.27
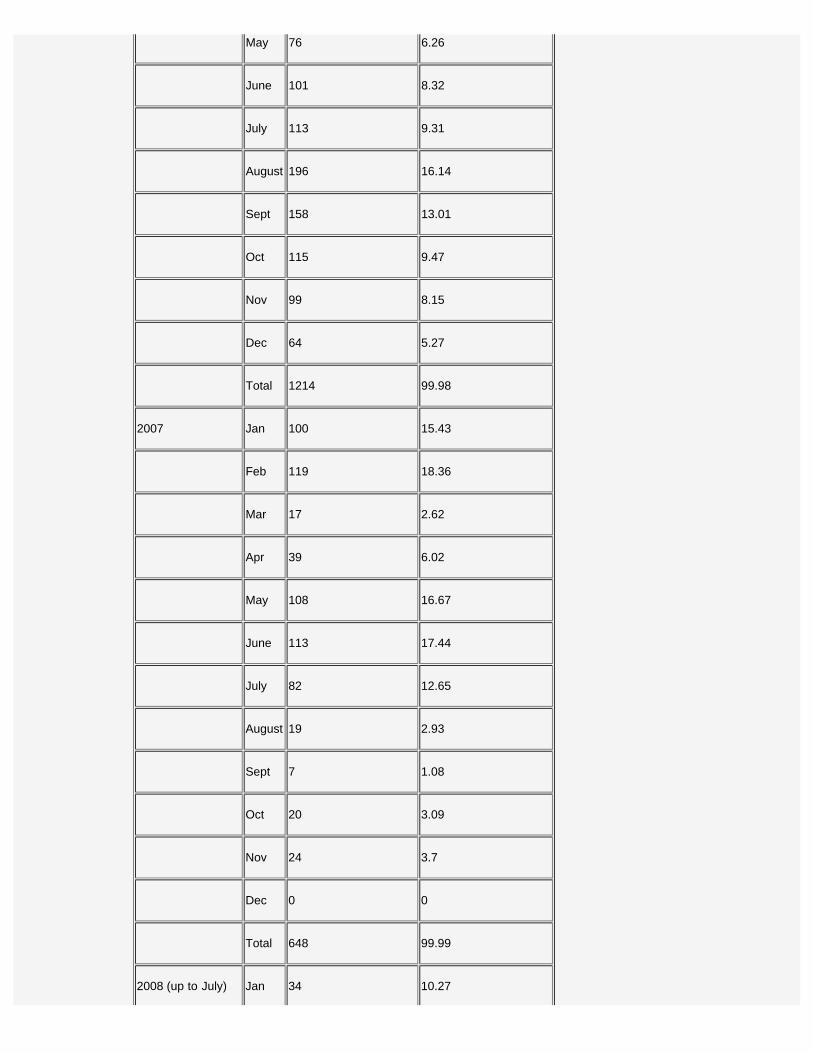
May 76 6.26
June 101 8.32
July 113 9.31
August 196 16.14
Sept 158 13.01
Oct 115 9.47
Nov 99 8.15
Dec 64 5.27
Total 1214 99.98
2007 Jan 100 15.43
Feb 119 18.36
Mar 17 2.62
Apr 39 6.02
May 108 16.67
June 113 17.44
July 82 12.65
August 19 2.93
Sept 7 1.08
Oct 20 3.09
Nov 24 3.7
Dec 0 0
Total 648 99.99
2008 (up to July) Jan 34 10.27
Feb 67 20.24
Mar 53 16.01
Apr 61 18.43
May 55 16.62
June 51 15.41
July 10 33.1
Total 331 130.08
(Source: Register on use of Computer for searching Internet at KRC of NEIST)
(Table 7 Users statistics of Internet Section in KRC of NEIST.)
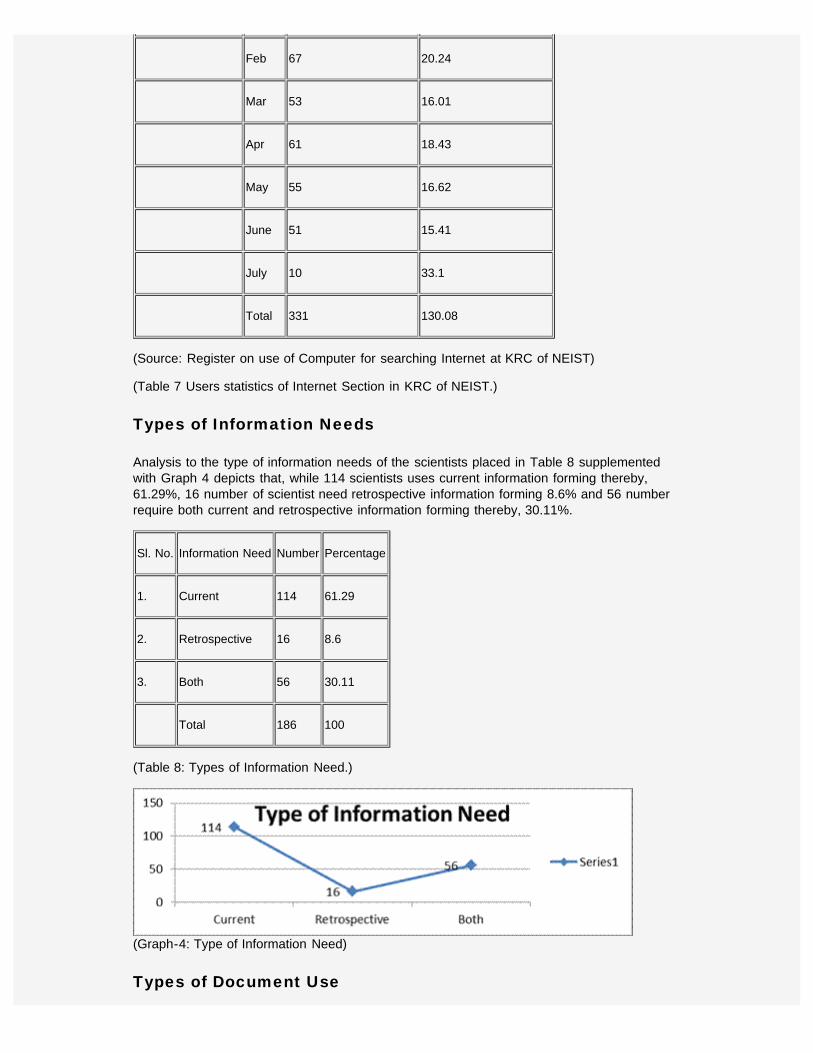
Types of Information Needs
Analysis to the type of information needs of the scientists placed in Table 8 supplementedwith Graph 4 depicts that, while 114 scientists uses current information forming thereby,61.29%, 16 number of scientist need retrospective information forming 8.6% and 56 numberrequire both current and retrospective information forming thereby, 30.11%.
Sl. No. Information Need Number Percentage
1. Current 114 61.29
2. Retrospective 16 8.6
3. Both 56 30.11
Total 186 100
(Table 8: Types of Information Need.)
(Graph-4: Type of Information Need)
Types of Document Use
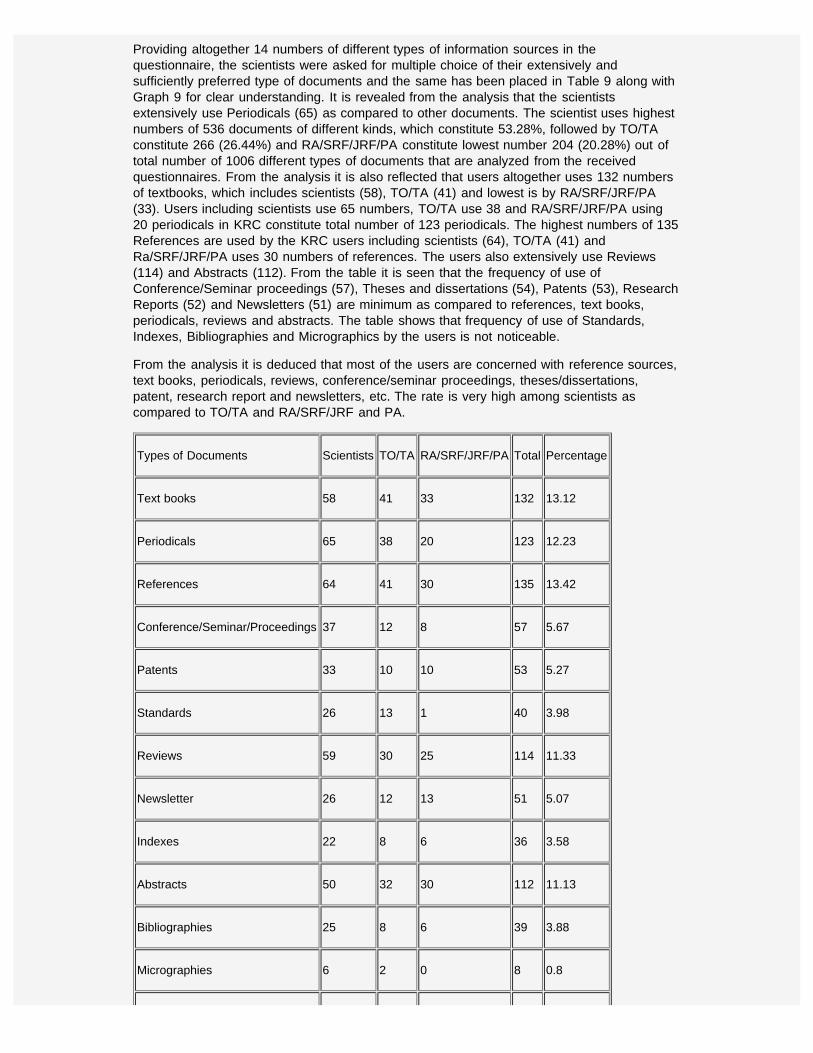
Providing altogether 14 numbers of different types of information sources in thequestionnaire, the scientists were asked for multiple choice of their extensively andsufficiently preferred type of documents and the same has been placed in Table 9 along withGraph 9 for clear understanding. It is revealed from the analysis that the scientistsextensively use Periodicals (65) as compared to other documents. The scientist uses highestnumbers of 536 documents of different kinds, which constitute 53.28%, followed by TO/TAconstitute 266 (26.44%) and RA/SRF/JRF/PA constitute lowest number 204 (20.28%) out oftotal number of 1006 different types of documents that are analyzed from the receivedquestionnaires. From the analysis it is also reflected that users altogether uses 132 numbersof textbooks, which includes scientists (58), TO/TA (41) and lowest is by RA/SRF/JRF/PA(33). Users including scientists use 65 numbers, TO/TA use 38 and RA/SRF/JRF/PA using20 periodicals in KRC constitute total number of 123 periodicals. The highest numbers of 135References are used by the KRC users including scientists (64), TO/TA (41) andRa/SRF/JRF/PA uses 30 numbers of references. The users also extensively use Reviews(114) and Abstracts (112). From the table it is seen that the frequency of use ofConference/Seminar proceedings (57), Theses and dissertations (54), Patents (53), ResearchReports (52) and Newsletters (51) are minimum as compared to references, text books,periodicals, reviews and abstracts. The table shows that frequency of use of Standards,Indexes, Bibliographies and Micrographics by the users is not noticeable.
From the analysis it is deduced that most of the users are concerned with reference sources,text books, periodicals, reviews, conference/seminar proceedings, theses/dissertations,patent, research report and newsletters, etc. The rate is very high among scientists ascompared to TO/TA and RA/SRF/JRF and PA.
Types of Documents Scientists TO/TA RA/SRF/JRF/PA Total Percentage
Text books 58 41 33 132 13.12
Periodicals 65 38 20 123 12.23
References 64 41 30 135 13.42
Conference/Seminar/Proceedings 37 12 8 57 5.67
Patents 33 10 10 53 5.27
Standards 26 13 1 40 3.98
Reviews 59 30 25 114 11.33
Newsletter 26 12 13 51 5.07
Indexes 22 8 6 36 3.58
Abstracts 50 32 30 112 11.13
Bibliographies 25 8 6 39 3.88
Micrographies 6 2 0 8 0.8

Research Report 34 10 8 52 5.17
Theses/Dissertation 31 9 14 54 5.37
Total 536 266 204 1006 100
Percentage 53.28 26.44 20.28 100
*RA=Research Associates, SRF=Senior Research Fellow, JRF= Junior Research Fellow,
PA= Project Assistant, TO=Technical Officer, TA=Technical Assistant.
(Table 9: Types of Document Use)
Graph-5: Types of Document Use.
Use of Preferred Documents
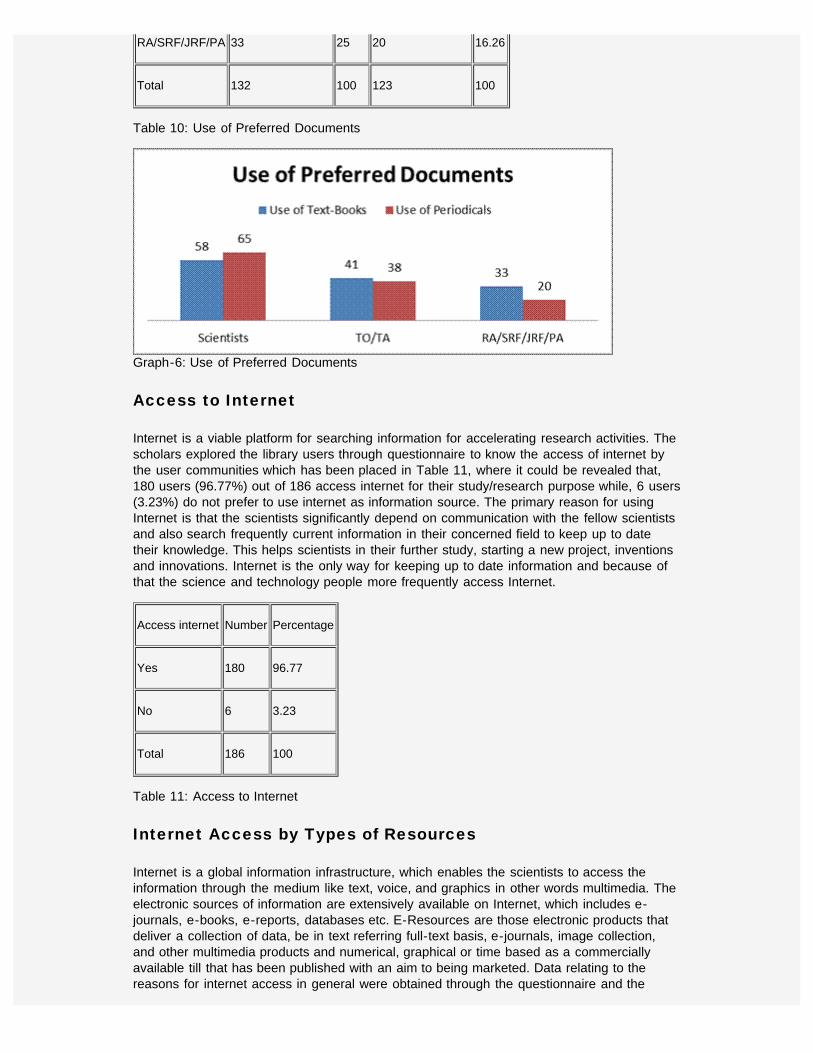
Data given in the Table 10 supplemented with Graph 6 shows that the number andcorresponding percentage of the users using textbooks and periodicals respectively. Analysisreveals that, out of a total respondent of 132 for the variable, while 58 number of scientists(43.94%) prefer to use text-books, 65 number of scientists out of a total respondents of 123prefer to use periodicals which comes to 52.85% followed by 41 number of TO/TA (31.06%)for text books and 38 number use periodicals (30.89%) respectively. Like wise, while 33number of RA/SRF/JRF/PA prefer to use text books, 20 number of RA/SRF/JRF/PA prefer touse periodicals as a source of information which forms 16.26%. This shows that, thescientists prefer periodicals as their preferred documents while, TO/TA and RA/SRF/JRF/PAuse text books as their favored documents.
User Category Use of Text-Books % Use of Periodicals %
Scientists 58 43.94 65 52.85
TO/TA 41 31.06 38 30.89
RA/SRF/JRF/PA 33 25 20 16.26
Total 132 100 123 100
Table 10: Use of Preferred Documents
Graph-6: Use of Preferred Documents
Access to Internet
Internet is a viable platform for searching information for accelerating research activities. Thescholars explored the library users through questionnaire to know the access of internet bythe user communities which has been placed in Table 11, where it could be revealed that,180 users (96.77%) out of 186 access internet for their study/research purpose while, 6 users(3.23%) do not prefer to use internet as information source. The primary reason for usingInternet is that the scientists significantly depend on communication with the fellow scientistsand also search frequently current information in their concerned field to keep up to datetheir knowledge. This helps scientists in their further study, starting a new project, inventionsand innovations. Internet is the only way for keeping up to date information and because ofthat the science and technology people more frequently access Internet.
Access internet Number Percentage
Yes 180 96.77
No 6 3.23
Total 186 100
Table 11: Access to Internet
Internet Access by Types of Resources
Internet is a global information infrastructure, which enables the scientists to access theinformation through the medium like text, voice, and graphics in other words multimedia. Theelectronic sources of information are extensively available on Internet, which includes e-journals, e-books, e-reports, databases etc. E-Resources are those electronic products thatdeliver a collection of data, be in text referring full-text basis, e-journals, image collection,and other multimedia products and numerical, graphical or time based as a commerciallyavailable till that has been published with an aim to being marketed. Data relating to thereasons for internet access in general were obtained through the questionnaire and the

same has been placed with the Table 12 along with Graph 7. Analysis shows that the usersof KRC mainly search internet for accessing to electronic source of information to promotetheir learning, research and development. While making a categorization of e-resources, outof 499, 176 number of scientists and others prefer to access e-journals which constitute35.27% followed by access to e-patent (14.43%) by 72 nos, e-books (12.83%) by 64 nos, e-reports (12.22%) and databases (12.22%) each by 61 nos, e-proceedings (10.02%) by 50nos and others (3.01%) which includes e-standards, electronic theses and dissertations by 15nos respectively.
Sl. No. Internet Access Number Percentage
1. E-book 64 12.83
2. E-journal 176 35.27
3. E-patent 72 14.43
4. E-reports 61 12.22
5. E-proceedings 50 10.02
6. E-data bases 61 12.22
7. Others* 15 3.01
Total 499 100
*Others = E-standards, E-Thesis and E-Dissertation, etc.
Table 12: Access to Internet
Graph-7: Internet Access
Internet Access by Designation
The scientists, TO/TA, RA/SRF/JRF and PA of NEIST are the identified categories, whichuse principally KRC for accessing to different types of information sources. The categories ofinformation resources has been broadly grouped under the following 6 headings as reflectedin the table. Among the resources available in KRC, e-resources are found to be used byhighest numbers of users of the NEIST. The related variable has been placed with Table 13supported with Graph 8 which shows the use of different types of e-resources. Analysis
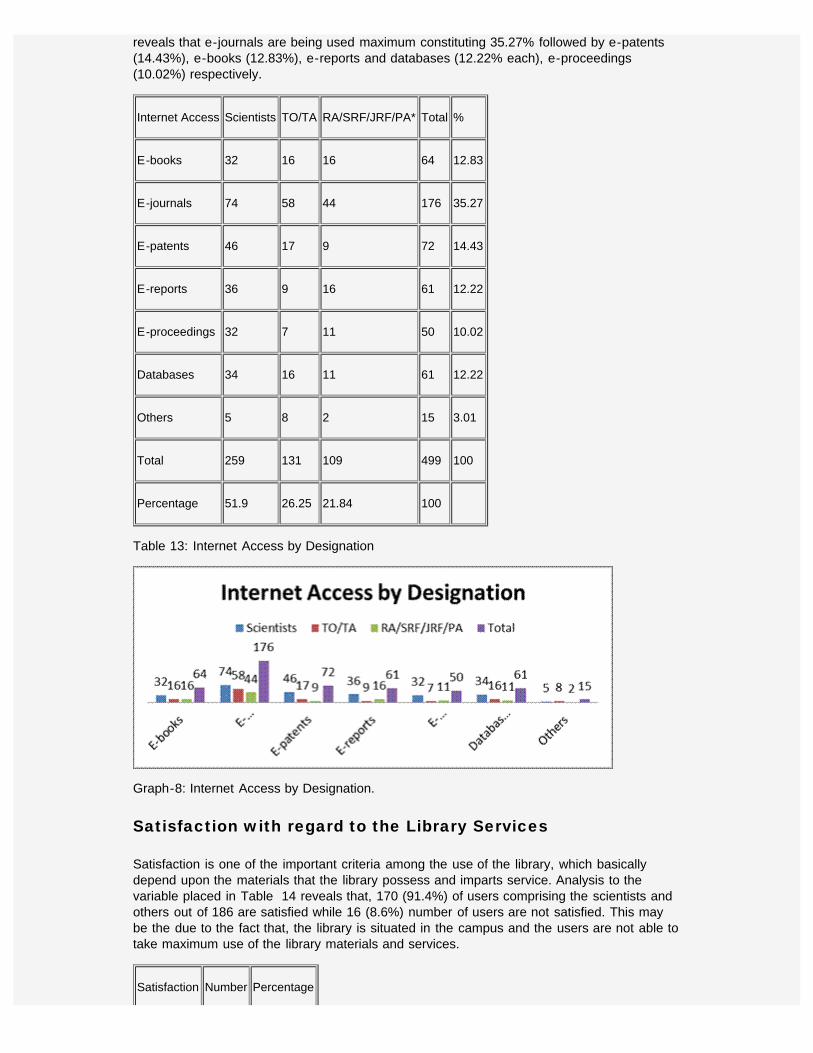
reveals that e-journals are being used maximum constituting 35.27% followed by e-patents(14.43%), e-books (12.83%), e-reports and databases (12.22% each), e-proceedings(10.02%) respectively.
Internet Access Scientists TO/TA RA/SRF/JRF/PA* Total %
E-books 32 16 16 64 12.83
E-journals 74 58 44 176 35.27
E-patents 46 17 9 72 14.43
E-reports 36 9 16 61 12.22
E-proceedings 32 7 11 50 10.02
Databases 34 16 11 61 12.22
Others 5 8 2 15 3.01
Total 259 131 109 499 100
Percentage 51.9 26.25 21.84 100
Table 13: Internet Access by Designation
Graph-8: Internet Access by Designation.
Satisfaction with regard to the Library Services
Satisfaction is one of the important criteria among the use of the library, which basicallydepend upon the materials that the library possess and imparts service. Analysis to thevariable placed in Table 14 reveals that, 170 (91.4%) of users comprising the scientists andothers out of 186 are satisfied while 16 (8.6%) number of users are not satisfied. This maybe the due to the fact that, the library is situated in the campus and the users are not able totake maximum use of the library materials and services.
Satisfaction Number Percentage

Yes 170 91.4
No 16 8.6
Total 186 100
Table 14: Satisfaction with regard to the library services
Rate of Satisfaction
The rate of satisfaction is another important variable in the given area of study to measurethe standard of library services. In this study the scholar has measured the satisfaction rateaccording to the scale of excellent, good, moderate and no comment. The concerned variablehas been placed here with under Table 15 supplemented with Graph 9 for clearunderstanding. Analysis discloses that, 113 users out of 186 respondents have placed theirsatisfaction rate as good constituting thereby, 60.75% followed by the verdict of 65 users asexcellent (34.95%) and 7 users as moderate (3.76%) respectively. Analysis further reflectsthat only one user placed no comment option which forms 0.54%. Overall it can be opinedthat, the major chunk of users are satisfied by the KRC services.
Sl.No. Satisfaction Rate Number Percentage
1. Excellent 65 34.95
2. Good 113 60.75
3. Moderate 7 3.76
4. No comment 1 0.54
Total 186 100
Table 15: Rate of Satisfaction
Graph-9: Rate of Satisfaction.
Library Automation
Automation means the use of automatic equipments and machines such as computer andother devices in the libraries. In the process of automation, it should be kept in mind that the

‘change’ is the only constant and the users are ready to accept and adapt to the changingtechnologies applied through the hardware, software and other technological devices whichhas become indispensable to keep the library alive in the present setup environment.Libraries need computers, application and trained people to run any modern librarysystematically. Computer based automated facilities are now the most effective system andnecessity. Out of 186 respondents, 114 users comprising the scientists and others are of theopinion that the library at KRC is not fully automated while, 72 respondents (38.71%) opinedthat their library is automated. It seems from the analysis that, KRC library is not fullyautomated.
Library Automation Number Percentage
Yes 72 38.71
No 114 61.29
Total 186 100
Table 16: Library Automation.
Level of Library Automation
Level of library automation is another variable in the study and the relevant data has beenshown in Table 17 complemented with Graph 10. While making an analysis of the same, itcould be revealed that, highest number of 93 (50%) users said that their library is partiallyautomated while, 85 (45.7%) users opined that the automation work at KRC is on theprocess and 8 (4.3%) users viewed that the library is fully automated. It could be deducedfrom the analysis that the KRC is not fully automated. The automation work of KRC is still onthe process barring few services such as, serial control, cataloging of back volume etc. areautomated.
Sl. No. Level of library automation Number Percentage
1. Fully 8 4.3
2. Partially 93 50
3. On the process 85 45.7
Total 186 100
Table 17: Level of Library Automation

Graph-10: Level of Library Automation
Conclusion
Careful analysis of the data revealed that, the KRC, NEIST is adequately equipped to provideincentive and value added services to the scientists and others with the present collectiondevelopment. Due to unavailability of a departmental library, the scientists and other usersprimarily depend upon the resources of KRC to promote their learning, research, anddevelopment. The library, however, is equipped with e-resources which have become theprimary sources of information for the users of the library under study. The scientists preferto use the information available through electronic form rather than traditional way. Therefore,subject gateways and portals are required to be provided with to the scientists for better useof information. Further, most of the scientists and research scholars prefer to use currentperiodicals to keep them update in the knowledge of their interested field. KRC needs to befully automated for providing value added information and services to the scientists whichhas become essential in present day context as the library has become a work house for thedifferent R&D programmes in the science and technology institutes, and also due to theincreasing demand for processing of data and retrieval of information in the easiest andquickest possible time. KRC is yet to come out with such facilities as the automation work isstill in progress.
References
Gorman, P. Information Needs of Physicians. Journal of the American Society forInformation Science. 46(10); 1995. pp. 729-736.
Kumar, T.S. Internet and Academic Libraries: Indian Scenario. Library Herald. 36(4); 1999.pp. 89–95.
M., Ram. User Education: Its Method and Technology. Herald of Library Science. 42(1-2);2003. pp. 54-57.
Mujoo-Munshi, Usha, and Kant, Manuj. Information seeking in Electronic environment.Library Herald. 34 (3-4). 1997. pp. 100-110.
Padmamma, S., Vijayakumar, M. and Vasudevan. Information seeking behaviour of VISLscientists: a study. ILA Bulletin. 38 (1). 2002.pp. 23-26.
Satish, N.G. Information Use Pattern of Rural Development Scientists: A Case Study. ILABulletin.23 (3); 1987. pp. 95 -118.
Sharma, Arvind K. Information seeking behaviour of rural people: a study. SRELS Journal ofInformation Management. 44 (4). 2007. pp.341-360.
Shokeen, Ashu, and Kaushik, Sanjay K. Information Seeking Behaviour of social scientists ofHaryana universities. Library Herald. 40 (1). 2002.pp. 28-35.
Wilson, T. D. Model in Information Behaviour Research. Journal of Documentation. 55 (3);

1999. Pp.249-270.
Wilson, T.D. On User Studies and Information Needs. Journal of Documentation. 37 (1);1981. pp .2-15.
Yates. Information Needs of Human Beings. Journal of Library and Information Science. Vol11. (1); 1986. pp. 77-89
Annual Report (2005-2006). Regional Research Laboratory, Jorhat.
Annual Report (2006-2007). Regional Research Laboratory, Jorhat.
NEIST News (2007). North-East Institute of Science and Technology, Jorhat. XXVIII (4).Pp.1-5.
Vision 2010: Strategy and Action Paper, Regional Research Laboratory (NEIST), Jorhat.
Malhotra, Rajiv and Patel, Jay (2008). “History of Indian Science and Technology: overviewof Indian Science & Technology”, available at: http://www.indianscience.org/:Reference.2.08.08.department of science and technology, ministry of science and technology.
http://en.wikipedia.org/wiki/Information (2008) (Accessed on 11.3.2008)
http://en.wikipedia.org/wiki/Scientists (2008) (Accessed on 11.3.2008)
http://www.rrljorhat.res.in/RRL/L&D /20 Departments/ 20 RRl/20 Jorhat (Accessed on11.3.2008).
http://202.54.99.7/ejournal/view_usage_stat_lab_sum.php? Labnam (Accessed on 11-08-2008).
http://niscair.res.in/ (Accessed on 10-08-2008).
http://www.csir.res.in/ (Accessed on 10-08-2008).