INFORMATION TO USERS The most advanced technology...
141
The chloride to bromide ratio as an environmental groundwater tracer, with a field study at the Wellton-Mohawk Irrigation and Drainage District Item Type text; Thesis-Reproduction (electronic) Authors Goldowitz, Joshua, 1959- Publisher The University of Arizona. Rights Copyright © is held by the author. Digital access to this material is made possible by the University Libraries, University of Arizona. Further transmission, reproduction or presentation (such as public display or performance) of protected items is prohibited except with permission of the author. Download date 24/05/2018 15:07:16 Link to Item http://hdl.handle.net/10150/277079
Transcript of INFORMATION TO USERS The most advanced technology...

The chloride to bromide ratio as an environmentalgroundwater tracer, with a field study at the
Wellton-Mohawk Irrigation and Drainage District
Item Type text; Thesis-Reproduction (electronic)
Authors Goldowitz, Joshua, 1959-
Publisher The University of Arizona.
Rights Copyright © is held by the author. Digital access to this materialis made possible by the University Libraries, University of Arizona.Further transmission, reproduction or presentation (such aspublic display or performance) of protected items is prohibitedexcept with permission of the author.
Download date 24/05/2018 15:07:16
Link to Item http://hdl.handle.net/10150/277079
INFORMATION TO USERS
The most advanced technology has been used to photograph and reproduce this manuscript from the microfilm master. UMI films the text directly from the original or copy submitted. Thus, some thesis and dissertation copies are in typewriter face, while others may be from any type of computer printer.
The quality of this reproduction is dependent upon the quality of the copy submitted. Broken or indistinct print, colored or poor quality illustrations and photographs, print bleedthrough, substandard margins, and improper alignment can adversely affect reproduction.
In the unlikely event that the author did not send UMI a complete manuscript and there are missing pages, these will be noted. Also, if unauthorized copyright material had to be removed, a note will indicate the deletion.
Oversize materials (e.g., maps, drawings, charts) are reproduced by sectioning the original, beginning at the upper left-hand corner and continuing from left to right in equal sections with small overlaps. Each original is also photographed in one exposure and is included in reduced form at the back of the book. These are also available as one exposure on a standard 35mm slide or as a 17" x 23" black and white photographic print for an additional charge.
Photographs included in the original manuscript have been reproduced xerographically in this copy. Higher quality 6" x 9" black and white photographic prints are available for any photographs or illustrations appearing in this copy for an additional charge. Contact UMI directly to order.
University Microfilms International A Bell & Howell Information Company
300 North Zeeb Road, Ann Arbor, Ml 48106-1346 USA 313/761-4700 800/521-0600


Order Number 1337653
The chloride to bromide ratio as an environmental groundwater tracer, with a field study at the Wellton-Mohawk Irrigation and Drainage District
Goldowitz, Joshua, M.S.
The University of Arizona, 1989
U M I 300 N. Zeeb Rd. Ann Arbor, MI 48106


THE CHLORIDE TO BROMIDE RATIO AS AN
ENVIRONMENTAL GROUND-WATER TRACER, WITH A FIELD
STUDY AT THE WELLTON-MOHAWK IRRIGATION
AND DRAINAGE DISTRICT
by
Joshua Goldowitz
A Thesis Submitted to the Faculty of the
DEPARTMENT OF HYDROLOGY AND WATER RESOURCES
in Partial Fulfillment of the Requirements For the Degree of
MASTER OF SCIENCE WITH A MAJOR IN HYDROLOGY
In the Graduate College
THE UNIVERSITY OF ARIZONA
19 8 9

2
STATEMENT BY AUTHOR
This thesis has been submitted in partial fulfillment of requirements for an advanced degree at the University of Arizona and is deposited in the University Library to be made available to borrowers under rules of the Library.
Brief quotations from this thesis are allowable without special permission, provided that accurate acknowledgment of source is made. Requests for permission for extended quotation from or reproduction of this manuscript in whole or in part may be granted by the head of the major department of the Dean of the Graduate College when in his or her judgement the proposed use of the material is in the interests of scholarship. In all other instances, however, permission must be obtained from the author.
SIGNED:
APPROVAL BY THESIS DIRECTOR
This thesis has been approved on the date shown below.
Hydrology and Water Resources

3
ACKNOWLEDGMENTS
My wife and best friend, Deborah E. Greenholtz, has been a great help to me throughout my graduate studies. She has put off completing her thesis so that I would have the time to complete mine, thus allowing me to be the "master" of the house, if only for a short while. I am also indebted to our children, liana and Daniel, without whom this thesis would have been completed long ago.
Dr. Stanley Davis provided the original idea for this research. I am indebted to Dr. Davis for including me in this research effort, for providing financial support, and for inspiring me with his enthusiasm. Drs. Daniel Evans and L. Graham Wilson were a great help in reviewing this thesis, offering many useful comments and asking thoughtful questions during my thesis defense. They are also two of the nicest fellows I have met while at the University of Arizona.
Elizabeth (Betsy) Behl, my fellow CI/Br researcher, helped me to endure countless Arizona field trips. Betsy was also a great help in investigating and evaluating the many analytical techniques that were used. Mr. Jeffrey Smith made the Yuma sampling trips a pleasure and a success. I cannot think of a better person to help push a rental car down a slanted clay road in a rainstorm.
Martin Barackman, June Fabryka-Martin, and Laurie Wirt were all very generous with their time and knowledge of laboratory procedure. I am also indebted to the staff of the University of Arizona Analytical Laboratory who gave me free reign to use their equipment. Dr. George Nelson was very helpful in the final bromide analysis. I am thankful to Dr. Nelson for assisting in the bromide isotope production and in the neutron activation analysis.

4
TABLE OF CONTENTS
Page
LIST OF ILLUSTRATIONS. 7
LIST OF TABLES 8
ABSTRACT 9
1. INTRODUCTION 10
2. THEORETICAL BACKGROUND 14
2.1 Definition of an Environmental Tracer 14 2.2 Review of Commonly-Used Tracers 14 2.3 Characteristics of the Ideal Environmental
Tracer 17 2.4 Theoretical Basis for Examining the Chloride to
Bromide Ratio as an Environmental Ground-Water Tracer 20
2.5 Previous Uses of the Cl/Br Ratio as an Environmental Ground-Water Tracer 23
3. GEOCHEMISTRY OF THE CHLORIDE TO BROMIDE RATIO 25
3.1 Electrochemical and Physical Properties of Chloride and Bromide 26
3.2 Chloride and Bromide in the Lithosphere 28 3.3 Chloride and Bromide in the Atmosphere and
Hydrosphere 31
3.4 Chloride and Bromide in Soils and in the Biosphere 36
3.5 Anthropogenic Influences on the Chloride to Bromide Ratio 40
4. METHODS OF ANALYSIS FOR BROMIDE 42
4.1 Specific Ion Electrode 43 4.2 Ion Exchange High Performance Liquid
Chromatography 45 4.3 Ion Chromatography 48 4.4 Phenol-Red Colorimetry 49 4.5 Iodide-Iodate Colorimetry 51 4.6 Neutron Activation Analysis 52 4.7 X-Ray Spectrometry 54
4.8 Summary 56
5
TABLE OF CONTENTS--Continued
Page
5. EXPERIMENTAL EVALUATION OF CHLORIDE TO BROMIDE RATIO CHARACTERISTICS 58
5.1 Constancy of the CI/Br With Evaporation 59
5.1.1 Procedure 59 5.1.2 Results and Conclusions 60
5.2 Bromide Absorbance on Activated Charcoal 60
5.2.1 Procedure 60 5.2.2 Results and Conclusions 62
5.3 Bromide Absorbance by a Desert Soil 62
5.3.1 Procedure 62 5.3.2 Results and Conclusions 63
5.4 Conclusions 63
6. FIELD STUDY AT THE WELLTON-MOHAWK IRRIGATION AND DRAINAGE DISTRICT 65
6.1 Study Area 65
6.1.1 Location and Climate 65 6.1.2 Settlement and Agriculture 67 6.1.3 Soils 69 6.1.4 Geology 71 6.1.5 Hydrology 72
6.1.5.1 Surface water 72 6.1.5.2 Ground water 73 6.1.5.3 Water budget 76
6.2 Data Collection 79
6.2.1 Selection of Sampling Locations 80 6.2.2 Sampling Procedures 80 6.2.3 Determination of the Chloride to
Bromide Ratio 82
6.3 Presentation and Interpretation of Results 82
6.3.1 Distribution of the CI/Br Ratio in the WMIDD 82

6
TABLE OF CONTENTS- -Continued
Page
6.3.2 Interpretation of the CI/Br Ratio Distribution 88
6.3.3 Interpretation of Chloride and Bromide Concentrations 92
7. SUMMARY AND CONCLUSIONS 96
7 .1 Summary 96 7.2 Conclusions 98
APPENDIX A. WATER BUDGET CALCULATION FOR THE 1986 WATER YEAR FOR THE WELLTON-MOHAWK IRRIGATION AND DRAINAGE DISTRICT 100
APPENDIX B. BROMIDE AND CHLORIDE BUDGET CALCULATIONS FOR THE 1986 WATER YEAR FOR THE WELLTON-MOHAWK IRRIGATION AND DRAINAGE DISTRICT 106
LIST OF REFERENCES 114

7
LIST OF ILLUSTRATIONS
Fipure Page
1 Location of the Wellton-Mohawk Irrigation and Drainage District 66
2 Soil Group Distribution of the WMIDD 70
3 Surface Water Features of the Wellton-Mohawk Area 74
4 Geologic Cross-Section Through the Lower Gila River Valley 75
5 Altitude of the Water Table at the WMIDD, December 1986 77
6 Major Ion Chemistry of Ground Water in the WMIDD 78
7 [CI] vs. [Br] in Ground Water in the WMIDD 85
8 CI/Br Ratio vs. Distance from the Upgradient Edge of the WMIDD 86
9 [CI], [Br], and the CI/Br Ratio of Ground Water in the WMIDD 87

8
LIST OF TABLES
Table Page
1 Electrochemical and Physical Properties of Chlorine and Bromine 27
2 Chloride and Bromide in the Lithosphere 29
3 Chloride and Bromide in the Hydrosphere and Atmosphere 33
A Chloride and Bromide in Soils 38
5 Chloride and Bromide in the Biosphere 39
6 Variation of the CI/Br Ratio During Evaporation 61
7 Chloride, Bromide, and the CI/Br Ratio in the Wellton-Mohawk Irrigation and Drainage District 83
8 Comparison Among the 2-Source and 3-Source Mixing Models and Measured Chemical Concentrations at the Wellton-Mohawk Irrigation and Drainage District 90
9 Chloride and Bromide Budget Values for the Wellton-Mohawk Irrigation and Drainage District, 1986 Water Year 94
9
ABSTRACT
The purpose of this study was to determine if the chloride to
bromide ratio (CI/Br) of water imported via interbasin transfer can be
used to trace the mixing of imported water with native ground water.
Laboratory experiments and a chemical literature review indicate that
chloride's and bromide's properties should make the CI/Br a useful
environmental ground-water tracer. This study has shown that the CI/Br
can be accurately quantified at environmental levels, is not attenuated
by aquifer or soil media, is chemically stable, and is present in
different levels in waters from different sources.
Infiltration and mixing of irrigation water from the Colorado River
(CI/Br - 1300) with native ground water (CI/Br - 630) was investigated at
the We11ton-Mohawk Irrigation and Drainage District near Yuma, Arizona.
The downgradient increase in the CI/Br is correlated with distance from
the upgradient limit of irrigation (r - .83), reflecting the chemical
influence of infiltrating irrigation water.

10
CHAPTER 1
INTRODUCTION
An environmental ground-water tracer is a chemical or physical
characteristic of a water source which can be used to follow the movement
of water. It can be either a naturally-occurring property or one that has
been added or modified by environmental pollution.
The purpose of this thesis is to examine the utility of the chloride
to bromide ratio (hereafter abbreviated CI/Br ratio) in water as an
environmental ground-water tracer, with an emphasis on its use in an
agricultural setting. The CI/Br ratio is evaluated to determine if it has
the necessary characteristics of an environmental tracer. The CI/Br ratio
is then used as an environmental ground-water tracer to study the
hydrology of the We11ton-Mohawk Irrigation and Drainage District in
southwestern Arizona.
Although stable and radioactive isotopes, heat, particulate matter,
and standard chemical composition of the water have all been used as
tracers, each has its limitation, and new tracers always add to the store
of useful information.
The CI/Br ratio offers the potential of opening many new areas to
hydrologic investigation. The foremost opportunity in Arizona will come
with the completion of the Central Arizona Project (CAP), which will bring
water from the Colorado River to central and southcentral Arizona.
Colorado River water has a CI/Br ratio of approximately 1250,
whereas the ground water in the delivery areas has CI/Br ratios ranging
from 100 to 600 (as described in this study). CAP water will be used for
11
irrigated agriculture, municipal water supplies, and probably ground-water
recharge. There will be opportunities to trace mixing, vadose zone flow
velocities and direction, and ground-water flow velocities and direction
in each of these applications of CAP water. The CI/Br ratio will be
equally applicable to other interbasin transfers, which are likely to
involve imported water and native water with different CI/Br ratios.
In other parts of the country, the CI/Br ratio could be an ideal
tracer for determining the origin of brines or salt pollution. Saline
pollution sources have definite CI/Br ratios ranging from 300 for seawater
to over 2500 for halide dissolution brines (Richter and Kreitler, 1986).
The CI/Br ratio may be applied to tracing seawater intrusion,
recharged runoff from salted roads, urban runoff in arid regions,
recharged sewage effluent, or effluent from manufacturing processes that
use chloride or bromide. Although ground-water contaminants can be traced
by other means, the CI/Br ratio can be used to distinguish among pollutant
sources which have different CI/Br ratios, but are similar in other
respects.
The CI/Br ratio has been reported for water from many sources, but
only five studies where it has been used as an environmental tracer could
be found: (1) Tiffany et al. (1968) used the CI/Br ratio to investigate
natural and pollution sources of chloride and bromide in the Great Lakes,
(2) Whittemore and Pollack (1979) determined the source of NaCl pollution
in central Kansas by comparing the CI/Br ratios of possible pollution
sources with the CI/Br ratio of the polluted water, (3) Koglin (1984) used
both the bromide concentration and the CI/Br ratio to determine the

12
recharge sources in the Tucson Basin, (4) Richter and Kreitler (1986) used
the CI/Br ratio to identify the source of salts in saline springs in the
Rolling Hills section of northcentral Texas, (5) currently, Elizabeth Behl
(M.S. thesis in progress at the University of Arizona) is studying the use
of the CI/Br ratio as an environmental ground-water tracer for recharged
urban runoff.
This thesis, and the companion thesis being written by Elizabeth
Behl, are the first attempts to systematically examine the CI/Br ratio
to determine its value as an environmental ground-water tracer and its
applicability to various hydrologic settings. Before the CI/Br ratio can
be recommended as an environmental ground-water tracer, the ions must be
examined for such characteristics as ease of analysis, sorption while
passing through geologic materials, possible effects of evaporation, and
chemical stability.
The body of this thesis begins with Chapter 2, which describes the
theoretical background for using the CI/Br ratio as an environmental
ground-water tracer. A definition of an environmental ground-water tracer
is given, and the characteristics of the ideal environmental ground-water
tracer are explored. A brief account of what is known of CI/Br ratio's
adherence to this list is given.
The occurrence of chloride and bromide in the environment is
reviewed in Chapter 3. Methods for the analysis of bromide at environ
mental levels are described in Chapter 4. For each analytical method, the
theoretical basis, equipment needs, and procedure are described. Each

13
method is also evaluated for use in determining bromide concentrations in
water that has been chemically altered by agriculture.
An evaluation of the CI/Br ratio is given in Chapter 5. This
includes reports on experiments to determine the constancy of the CI/Br
ratio with evaporation, and the extent to which low levels of bromide are
adsorbed onto environmental materials.
Chapter 6 reports a case study using CI/Br ratios to trace waters
of various origins in the We11ton-Mohawk Irrigation and Drainage District
in southwestern Arizona. Chapter 7 contains a summary, conclusions, and
suggestions for other uses of the CI/Br ratio.

14
CHAPTER 2
THEORETICAL BACKGROUND
This chapter describes the commonly-used environmental ground-water
tracers and lists the characteristics of the ideal environmental ground
water tracer. The CI/Br ratio is discussed specifically, listing which
of its characteristics are ideal, which are not, and which need further
investigation. The previous uses of the CI/Br ratio are described.
2.1 Definition of an Environmental Tracer
An environmental ground-water tracer is a chemical or physical
characteristic of a water body which can be used to analyze ground-water
movement. It can be either a naturally-occurring property or one that has
been added by environmental pollution.
Environmental tracers are used to study ground-water flow rate,
mixing, dispersion, and residence time. They are also applied in studies
of hydraulic connections between aquifers or between surface water and
ground water. The history, age, and origin of a water body can also be
inferred using environmental ground-water tracers (Sklash et al. , 1976;
Fontes, 1980; Toran, 1982; Jordan et al., 1983).
2.2 Review of Commonlv-Used Tracers
Radioactive isotopes, stable isotopes, heat, and water chemistry
have all been used as environmental ground-water tracers. The following
descriptions will give the reader an understanding of how environmental
ground-water tracers are used.

15
Radioactive environmental ground-water tracers are the best tool
available for estimating the age of ground water. The most commonly-used
isotopes are tritium (3H) and carbon 14 (UC).
Tritium is a rare, naturally-occurring isotope of hydrogen.
Historically, its natural background concentration in rainfall had been
less than 10 tritium units (TU), measured as the number of tritium atoms
per million hydrogen atoms. Atmospheric nuclear tests during the 1950s
and early 1960s increased this level into the thousands of tritium units
(Freeze and Cherry, 1979).
The slug of tritium-rich water deposited by rainfall in the late
1950s and early 1960s is an excellent environmental ground-water tracer
for defining recharge areas, ground-water flow velocities, and mixing and
dispersion of ground water. It has also been used for measuring recharge
rates and investigating surface water-ground water interactions (Payne,
1972).
Another radioactive environmental ground-water tracer is UC. Carbon
reaches the water table as dissolved C02. The C02 will contain a minute
amount of '4C, characteristic of the atmospheric ratio of UC/'2C. UC has
a half life of 5570 years, and can be used to estimate the infiltration
date of water up to 55,000 years before the present. If the recharge area
is known, the Darcian velocity can be calculated by dividing the distance
between the recharge area and the sampling point by the UC age (Freeze and
Cherry, 1979).
An example of a less commonly-used radioisotope environmental
ground-water tracer is ,29I. It is produced both in the atmosphere by

16
spallation of xenon isotopes and in the lithosphere as a daughter product
of uranium decay. Fabryka-Martin (1984) used 1J9I to investigate flow
paths in ground water and as an indicator for brine source and age.
The stable isotopes ,80 and 2H have been used as environmental ground
water tracers since the early 1950s. Both are rare isotopes, representing
.1% and .015% of the isotopic composition of oxygen and hydrogen respec
tively (Fontes, 1980). Their concentrations are reported in the relative
units 6 :
<5 - [(R-Rs)/Rs]*1000
where R is the ratio of 180/,60 or 2H/'H in the water sample, and Rs is the
ratio in standard mean ocean water (SMOW).
The 6 ,80 and 6 2H diverge from that of sea water because the isotopic
mixture changes as water changes phase. Water molecules containing one
of the heavier isotopes require more thermal energy to evaporate than
ordinary water molecules. At a given temperature, the heavier water
molecules are less likely to have the thermal energy needed to escape to
the gas phase, so the water body becomes more concentrated in heavy water
molecules as it evaporates.
Stable isotope measurements are used to infer the origin and
evaporative history of a water body and as a clue to the water's
temperature when it was recharged. ,3C and 34S have been used as stable
isotope environmental ground-water tracers (Press and Seaver, 1978).

17
2.3 Characteristics of the Ideal Environmental Tracer
In a review of tracer techniques, Davis et al. (1980) listed the
characteristics of the ideal injected tracer. They wrote that, "An ideal
ground-water tracer is nontoxic, inexpensive, moves with the water, is
easy to detect in trace amounts, does not alter the natural direction of
flow of the water, is chemically stable for the desired length of time,
is not present in large amounts in the water being studied, and for most
purposes is neither filtered nor sorbed by the solid medium through which
the water moves."
This list can be modified to reflect the characteristics necessary
for an environmental ground-water tracer. The following discussion
pertains to non-radioactive tracers, and is also restricted to tracers for
the mixing of two or more water sources. Parts of the above list can be
adopted directly as characteristics of the ideal environmental ground
water tracer, including, "easy to detect in trace amounts", "is neither
filtered nor sorbed by the solid material through which it moves", and "is
chemically stable for the desired length of time". "Easy to detect in
trace amount" can be modified to, "easy to detect at environmental
levels".
Conversely, "nontoxic" and "inexpensive" have no bearing on the use
of an environmental ground-water tracer, being that an environmental
ground-water tracer is a preexisting physical or chemical characteristic
of the water being studied. The characteristics, "moves with the water",
and "does not alter the natural direction of flow of the water" are

18
superfluous, because the environmental ground-water tracer is a part of
the water body being traced.
The only characteristic of the ideal injected tracer not yet
addressed is, "is not present in large amounts in the water being
studied". For the ideal environmental ground-water tracer, this can be
changed to, "is present in sufficiently different concentrations in two
water bodies."
Other favorable characteristics for environmental ground-water
tracers are, "not added to the water being traced by dissolution of
aquifer materials", and "constant in time and space within water bodies."
In light of the above discussion, an ideal environmental ground
water tracer is easy to detect accurately at environmental concentrations,
is neither filtered nor sorbed by the solid medium through which the water
moves, is not added to the water by dissolution of the solid medium, is
chemically stable for the desired length of time, is present in different
amounts in the water bodies being studied, and is constant in time and
space within a water body. The remainder of this section will be used to
describe the importance of each of these characteristics.
Ease of detection is a desirable, but not essential, characteristic.
Accuracy and precision of detection at low levels of tracer are essential.
This is true because environmental ground-water tracers are not apt to be
in high levels as they are in injected tracer tests. Obviously, the
easier and more accurate the detection, the more highly an environmental
ground-water tracer can be recommended.
19
If energy or matter is filtered (in the case of particulates or
macromolecules) or sorbed (in the case of ions or organic chemicals) by
the solid medium through which the water moves, it cannot be used as an
environmental ground-water tracer. Filtering or sorption would retard or
stop the tracer movement, so the calculated velocity would be slower than
the water velocity.
The ideal environmental ground-water tracer should not be added to
the water by dissolution of the solid medium through which it moves. If
an ionic environmental ground-water tracer is used to trace the movement
of imported water through an aquifer, dissolution of that ion from the
aquifer will make mixing difficult to establish, unless the dissolution
can be quantified and accounted for in both time and space.
Chemical stability is an important characteristic, but one that is
probably infrequently violated by non-radioactive environmental ground
water tracers. It will not be feasible to use organic chemicals as
environmental tracers if they decompose while leaching through the
unsaturated zone. Similarly, pH cannot be used as an environmental
ground-water tracer in situations where it will be neutralized by aquifer
materials.
The tracer must occur with sufficient diversity of concentration in
nature. If there is little or no difference in concentration between
surface waters and ground water, or native waters and imported water, or
recharge water and ground water, it would be fruitless to use that
characteristic as a tracer. Ideally, the tracer would be present in a
high level in one water source, and absent from the other. Practically,
20
an order of magnitude difference in tracer level would be desirable, but
even a two-fold difference would be satisfactory if detection is
sufficiently accurate.
The last characteristic is, "constant in time and space in the water
bodies being studied". An environmental ground-water tracer with this
characteristic probably does not exist. This characteristic would make
tracing the mixture of an imported water with a native ground water very
easy.
2.4 Theoretical Basis for Examining the Chloride to Bromide Ratio as an Environmental
Ground-Water Tracer
Although the natural CI/Br ratio has been used to characterize water
(e.g., Morris and Riley, 1966), it has seldom been used to trace water
movement. This section will describe the theoretical basis for using the
CI/Br as an environmental ground-water tracer, as it was understood by
this author and Dr. S.N. Davis at the onset of this research.
Dr. Davis (the advisor for this study and the source of the original
idea) had studied the distribution of bromide in natural waters and had
experience with the use of both chloride and bromide in injected tracer
tests. Both ions are commonly used in injected tracer tests, with bromide
recognized as being nearly ideal as an injected tracer (Davis et al.,
1980).
Ratios of CI/Br in rain water have been reported to be between 20
and 200, with most falling near 150 (Duce et al., 1963; Duce et al., 1965;
Block et al., 1966; Lininger et al., 1966; Seto et al., 1969; Rahn et al.,
21
1976). Koglin's 1984 study of ground water in the Tucson Basin reported
a similar average ratio. This indicated that 150 could be the expected
baseline ratio in unpolluted surface water and ground water. In 1983,
Elders and Cohen reported a CI/Br ratio of about 1000 for the Colorado
River. This indicated that significant differences exist in the natural
chloride to bromide ratio, and that the ratio varies enough between water
sources for it to be used as an environmental ground-water tracer.
Chloride is easily detectable at environmental levels. Detection
of bromide at environmental levels has been reported using various
chemical techniques, including X-ray diffraction, neutron activation, high
performance liquid chromatography, and ion chromatography. It was unknown
whether these techniques could accurately determine environmental levels
of bromide in the presence of chloride.
Both chloride and bromide are widely assumed to be conservative when
used as injected tracers, where their concentrations range from tens to
thousands of milligrams per liter. There is some indication that bromide
may not be entirely conservative while moving through soils, because it
may be partially sorbed by the organic matter in soil (Krasintseva, 1966;
Yamada, 1968; Yuita et al., 1982; Maw and Kempton, 1982; Lag and Steinnes,
1976). Therefore, it was not known if bromide is conservative at the low
levels found in nature and expected in this study.
The inorganic ions, chloride and bromide, are chemically stable, and
their naturally-occurring salts are highly soluble. Therefore, lack of
chemical stability was not a concern.

22
Dissolution of the solid material through which the water moves will
shift the CI/Br ratio of the ground water towards that of the solid
material. The extent of this effect is dependent on the nature of the
solid material. For instance, evaporite deposits may have a strong
effect, while most metamorphic or igneous rock will have a negligible
effect.
In summary, a number of factors indicated that the CI/Br ratio would
be a good environmental tracer. The CI/Br ratio is chemically stable, and
it exists in sufficiently different levels in the hydrosphere. Chloride
is easily detected, and bromide has been detected at environmental levels.
Chloride is neither filtered nor sorbed, and bromide is not filtered and
probably not sorbed to a significant degree by aquifer materials.
Leaching of chloride and bromide is possible in some environments.
The chloride to bromide ratio has an additional characteristic that
is favorable to its use in the desert Southwest. As a ratio of two ions,
it is a characteristic that should remain constant as water evaporates.
This makes it ideal for tracing recharged water from streams, agricultural
applications, or artificial recharge projects as it mixes with or replaces
native ground water.
An important application of the chloride to bromide ratio may come
with the interbasin transfer of Central Arizona Project (CAP) water to
central and southcentral Arizona. With the completion of this project,
Colorado River water with a CI/Br ratio of approximately 1250 will be
delivered for agricultural and municipal use. CAP water will be used for

23
irrigation and recharge projects in areas where the native ground waters
have ratios ranging from 100 to 600.
2.5 Previous Uses of the CI/Br Ratio as an Environmental Ground-Water Tracer
The first use of CI/Br ratio as an environmental tracer was in 1968,
when Tiffany et al. investigated "Natural and Pollution Sources of Iodide,
Bromide, and Chloride in Great Lakes". Bromide to chloride ratios were
reported for each of the Great Lakes, and were used to determine that the
only significant input of halides was rain water. Bromide concentrations
were anomalously high near urban shorelines, indicating a contribution
from exhaust fumes of cars using bromide-laden leaded gasoline.
Richter and Kreitler (1986) used the CI/Br ratio to investigate the
geochemistry of salt water beneath the Rolling Hills in northcentral
Texas. Two brine types were distinguished: (1) a brine with a CI/Br ratio
less than 400, derived from deep-basin aquifers, and (2) a brine with a
CI/Br ratio greater than 2500, derived from the dissolution of halite by
fresh ground water. Based on CI/Br ratios, it was determined that brine
discharges in the northern section of the study area are halite dissolu
tion brines, while brine discharges in the southern section have their
sources in deep-basin brine aquifers.
A similar study was carried out by Whittemore and Pollack in 1979.
They used the CI/Br ratio to determine the source of NaCl contamination
in natural surface waters in central Kansas.
Koglin (1984) used both bromide and the CI/Br ratio as environment
al ground-water tracers in the Tucson basin, Arizona. Using bromide

24
concentrations, Koglin distinguished four ground-water zones in the Tucson
basin, agreeing with previous studies using other geochemical indicators.
He attributed the zonation to "differing degrees of influence from
natural, and/or anthropogenic sources of recharge."
Currently, Behl (M.S. thesis in progress) is studying the CI/Br
ratio as an environmental ground-water tracer for recharged urban runoff.
She has re-analyzed Koglin's data for the Tucson basin using geostatisti-
cal methods. The geostatistical analysis, coupled with Behl's chemical
analysis of Tucson urban runoff samples, have been used to verify Koglin's
assertion that the low CI/Br ratio zone in the central basin is influenced
by recharged urban runoff.
At least 20 studies have reported the Cl/Br ratio for a particular
water source or water body (see Chapter 4). Some of the studies were
reports on the baseline chemistry of a water resource. Many discussed the
Cl/Br ratio of rainwater, airborne particles, and atmospheric gases.
Others examined the Cl/Br ratio of solid materials (soil, evaporites, and
carbonate deposits) to infer the chemistry of formation waters or waters
that have passed through the materials.
This study, and the contemporaneous study by Behl, are the first
systematic studies of the characteristics of the Cl/Br ratio to determine
if it is valid to use this ratio as an environmental ground-water tracer.
This study concentrates on the use of the Cl/Br ratio in an agricultural
setting, while Behl's study concentrates on the urban environment.

25
CHAPTER 3
GEOCHEMISTRY OF THE CHLORIDE TO BROMIDE RATIO
Knowledge of the CI/Br ratio of natural waters and understanding the
factors which influence the Cl/Br ratio of water are necessary for
determining which hydrogeological settings may be analyzed using the Cl/Br
ratio as an environmental ground-water tracer. This knowledge and
understanding are also helpful for interpreting the measured Cl/Br ratio
of water bodies.
Chloride is one of the major chemical constituents of most natural
waters, and is important in the life cycles of all organisms. Analysis of
chloride concentration by precipitation of CI" with AgN03 is one of the
oldest quantitative chemical techniques. For these reasons, the chloride
concentration of the world's waters has been amply studied and documented.
Conversely, bromide is a trace constituent of nearly all waters in
which it has been measured. It is not toxic in environmental levels, and
it has not been found to be a necessary nutrient for any organism.
Bromide was not discovered until 1826, and accurate analytical methods for
environmental levels of bromide were not available until the 1950s.
Documentation of the bromide concentration of the worlds' waters is far
from complete, and data on its concentration in fresh ground water and
surface water are nearly nonexistent.
This chapter gives a general picture of the [CI], [Br], and Cl/Br
ratio of natural waters. The same is done for the atmosphere, litho-
sphere, and biosphere because these realms influence the Cl/Br ratio of
the waters with which they have contact.

26
3.1 Electrochemical and Physical Properties of Chloride and Bromide
Chlorine and bromine, along with iodine and fluorine, make up the
halogen or salt-forming elements. The halogens are group seven on the
periodic chart of the elements, and thus have an outer electron shell
configuration of nsJ np5 . This structure, just one electron short of a
complete octet, makes the halogens very reactive. Indeed, they are among
the most highly electronegative of all elements.
Bromine has four isotopes ranging in atomic weight from 79 to 82,
with weights 80 and 82 being radioisotopes. It has an atomic weight of
79.904 and an ionic radius of 1.96 angstroms (Pauling, 1970). The
lighter, smaller chlorine has an atomic weight of 35.453 and an ionic
radius of 1.81 angstroms. It has three natural isotopes ranging in atomic
weight from 35 to 37, with 36 being a radioisotope.
Both elements have high positive first ionization energies, meaning
that an electron can be lost only with great difficulty (see Table 1 for
electrochemical and physical properties). The high negative electron
affinities of chloride and bromide indicate that for each ion, an electron
is gained easily to complete the octet. The high electronegativities
indicate that these elements form bonds with highly ionic character,
rather than covalent character. Only fluorine, oxygen, and nitrogen are
more highly electronegative. Both elements have large and positive
standard electrode potentials, meaning that they are easily reduced from
X2 to 2X* and that they will occur in nature mostly in the ionic form.
Of the two, the lighter chloride is much more abundant in the
atmosphere, biosphere, hydrosphere, and lithosphere. Chlorine is a major

Table 1. Electrochemical and Physical Properties of Chlorine and Bromine.
Atomic Weight
First Ionization Energy
(eV/atom)
Electron Affinity (eV/atom)
Electronegativity
Standard Electrical Potential (V)
Ionic Radius (angstroms)
Covalent Bond Radius Energy
(angstroms) (KJ/ Mde)
Chlorine
35.453 12.96 -3.70 3.16 1.36 1 . 8 1 0.99 243
Bromine
79.904 11.81 -3.53 2.96 1.07 1.96 1.14 192
Data Source: Petrucci (1982)

28
chemical constituent of sea water, fresh water, and most biological
fluids. Bromide, where it occurs, is nearly always at trace levels.
3.2 Chloride and Bromide in the Lithosphere
Although opinions vary as to the average concentration of bromine
in the earth's crust, there is agreement that it is a relatively rare
element. Mineralogy texts list bromide as the 47th most common element in
crustal rocks, with an average concentration of about 2.5 ppm (Hurlbut and
Klein, 1975). Chloride is the 15th most common element in the earth's
crust, with an average concentration between 125 and 130 ppm. Table 2
lists the [CI] and [Br] and the CI/Br ratio of many lithospheric
materials.
Among the rock-forming minerals, including quartz, feldspars, mica,
hornblende, pyroxene, and olivine, bromide rarely exceeds 1 ppm (Hurlbut
and Klein, 1975). Chloride is also of minor importance in the common
rock-forming minerals (Hurlbut and Klein, 1975). Chloride is found in
some of the apatite group of minerals and in the relatively rare sodalite.
Rarely, mica, hornblende, and natural glass may contain chloride in
significant amounts (Davis and DeWeist, 1966). Because the ionic ratios
of bromide and chloride differ by only about 7%, bromide can replace
chloride in a crystal lattice.
Hem (1970) listed 127 as the CI/Br ratio of igneous rocks.
Vinogradov (1959) determined the CI/Br ratio of crystalline rocks to be
200. In a more detailed study, Correns (1961) determined the average
chloride, bromide, and CI/Br ratio of many common igneous rocks in samples

Table 2. Chloride and Bromide in the Lithosphere.
Source Bromide Chloride
Earth's Crust 2.5 130 Crystalline Rocks of Crust —
Igneous Rock
Granite 1.2 270
Granodiorite 7.4 20 Diorite 3.7 240 Gabbro 3.8 80 Ultramofic 0.018-0.023 1.05-1.66 Basalt 2.2 120
Sedimentary Rock
Sedimentary Rocks 20 — Lower Cambrian Sedimentary — Precambrian Carbonates — Pliocene Redbeds — Recent Carbonates — —
Metamorphic Rock
Shale — —
Coal 14.2 1000
All concentrations are in parts per million.
CI/Br Reference
52 Hurlbut & Klein 200 Vinogradov
225 Correns, in Williams and Harris
2.7 65 21 -66
55
— Bowen 52 Krasintseva 82 Williams and Harris 270 Krasintseva 365 Williams and Harris
45 Terekian and Wedepohl in Williams and Harris
70.4 Klein
ho vo

30
taken from around the world. The CI/Br ratio ranged from 2.7 for
granodiorite to 225 for granite. The halide concentrations are higher in
sedimentary rocks than in igneous. The CI/Br ratio is generally lower,
and the bromide content is related to the organic content of the sediments
from which the rock is formed. The average bromide content of sedimentary
rocks is about 20 ppm (Bowen, 1979), a concentration factor of ten over
the crustal average.
The most important repository of chloride and bromide in the
lithosphere is in evaporite deposits. Bromide is unique in that no
bromide minerals form as sea water evaporates, but instead it is
incorporated into chloride-dominated evaporites (Volyashko, 1956).
Precipitated salts of marine origin have Cl/Br ratios of about 10,000
(Vinogradov, 1959) , and contain from 50 to 100 ppm bromide (Wilgus and
Holser, 1984). Halite that has been dissolved and recrystallized in a
second cycle of solution and recrystallization has a bromide content of
less than 20 ppm and as low as 0 ppm (Holser, 1979).
As sea water evaporates, a series of minerals precipitates. The
first to form is halite, followed by sylvite, followed by carnalite, and
finally bischfite. Each mineral to form has a higher bromide concentra
tion than the one before, because as chloride precipitates, the super
natant water becomes relatively more concentrated in bromide.
This is true within each mineral bed, as well as within the series
of minerals, so that not only does sylvite contain more bromide than
halite, but the last sylvite formed contains more bromide than the first
sylvite formed (Valyashko, 1956).

31
3.3 Chloride and Bromide in the Atmosphere and Hydrosphere
In 1966, Morris and Riley presented the chloride and bromide
analyses of 219 water samples taken from the worlds' oceans. The analyses
indicated a chloride to bromide ratio of 289.935, plus or minus 1.0, with
no significant variation between sampling sites.
The source of moisture and airborne salt particles in a maritime
atmosphere is evaporation from the ocean and ocean spray (Block et al.,
1966: Arimoto et al., 1985). Surprisingly, the CI/Br ratios reported for
this airborne salt and moisture are not the same as the CI/Br ratio for
sea water. It has been widely reported that airborne salt particles and
rain that nucleates around these particles have a CI/Br ratio of between
20 and 200, with most reported values falling close to 150 (Duce et al.,
1965; Block et al., 1966; Lag and Steinnes, 1976; Arimoto et al., 1985;
and others). Therefore the Cl/Br ratio of airborne salt particles and
precipitation is about half the Cl/Br ratio of sea water.
The low Cl/Br ratio of sea salt aerosols with respect to ocean water
has been explained by a mechanism named "syn-bubble breaking fractiona
tion" . This phenomenon was first explored in a laboratory study by
Sugawara and Kawasaki (1958). A theoretical explanation of this mechanism
is given in Block et al. (1966).
The open ocean is covered with bubbles, formed by whitecaps and wave
action. As soon as these bubbles form, fluid begins to stream down the
bubble sides, carrying some of the smaller chloride ions back to the ocean
surface. When the bubble bursts, it sends a bromide-enriched droplet into
the air, where it evaporates to form an airborne sea salt particle. Sea

32
salt aerosols have a Cl/Br ratio of about 150 versus a Cl/Br ratio of
about 300 for ocean water, so about half of the chloride originally
present in a newly-formed bubble is carried back to the ocean surface.
Not all of the rainfall Cl/Br ratios reported from around the world
fall within the 20 to 200 range. In a study of pollution-free rainfall
in the remote Enewetak Island, Arimoto et al. (1985) found a ratio of
approximately 300. Seto et al. (1969) found a Cl/Br ratio of 333 six km
inland from the Hilo Hawaii coast and a ratio of 25 from a rainfall sample
38 miles from the coast.
The range and average Cl/Br ratio of fresh surface water and ground
water is not as well known. Koglin (1984) found Cl/Br ratios for urban
runoff in Tucson, Arizona to vary between 26 and 156. Surface waters
collected from the major watersheds in Arizona have ratios ranging from
the low 20s for tributaries to the Verde River, to 1250 for the Colorado
River. The high ratio in the Colorado is assumed to reflect the high
chloride contribution of salt springs along the Little Colorado River and
from ground-water inflow along the Colorado River in southeastern Utah
(S. N. Davis, 1987, personal communication).
Davis and DeWeist (1966) observed that chloride and bromide
concentrations in ground water are between 1 and 1000, and between .00001
and .1, respectively. Koglin (1984) found 130 to be the average Cl/Br
ratio in ground water in the Tucson basin. Bathurst et al. (1982) found
the Cl/Br ratio to vary from 370 to 400 in Canterbury ground water. Table
3 lists the [CI] and [Br] and Cl/Br of many atmospheric and hydrospheric
sources.

Table 3. Chloride and Bromide in the Hydrosphere and Atmosphere.
Source Bromide Chloride CI/Br Reference
Atmospheric
Particulates
Fine (Watertown, MA) Course (Watertown, MA) Roof (Cambridge, MA) Curb (Cambridge, MA)
Gasses
Inorganic (Arizona) Organic (Arizona)
Precipitation
Terrestrial Average Tucson, Arizona Israel Hamilton, Ontario Enewetak Hawaii
10 km inland 20 km inland 30 km inland
85.7ng/m3
25.7ng/m3
22-106ng/m3
32-795ng/m3
5.3ng/m3
17.Ong/m3
0.017 0.061-3.58 0.004-0.165 7.lug/kg
86.2ng/m3
306ng/m3
1.04-5.7ng/m3
0.8-3.Ong/m3
240ng/m3
680ng/m3
1.7 3.5-106.0 0.25-14.0 2000ug/kg
1.01 11.9 42.9 7.9
45 40
20-200 100 13-300 29-88 281
250 140 100
Thurston & Spangler Thurston & Spangler Lininger et al. Lininger et al.
Rahn Rahn
Rahn Koglin Block et al. Harris & Williams Arimoto et al.
Seto, Duce, Woodcock
OJ w

Table 3--Continued
Source Bromide
Hydrosphere
Ocean — Mediterranean Sea 0.204
Surface Water
Fresh
Black Sea 0.016 Lake Kineret (Israel) 1.7 Lake Edasjon (Sweden) 0.252
Lake Valloxen (Sweden) 0.482
Colorado River 0.07 Verde River 0.36-0.66 Bill Williams River 0.55 Irrigation Return Flow 0.32-1.74
WMIDD
Brackish & Saline
Big Soda Lake (NV) Closed Basin Sump (NV)
1 8 . 0 32.0
Chloride CI/Br Reference
— 287.935 Morris & Riley 6.51 319.1 Valyashko
5.69 355 Valyashko 2.11 1.24
Lundstrom, Olin, & Nydahl
Lunds trom, 01in, & Nydahl
88.5 1250 This study 9.2-23.7 25.6-36.0 This study 62.3 113 This study
200-2300 626-1350 This study
7570 25200
420 785
Whitehead & Feth Whitehead & Feth

Table 3--Continued
Source Bromide Chloride CI/Br Reference
Mono Lake (CA) Great Salt Lake (UT)
Ground Water
Fresh
35.0 8 6 . 0
0.00001-0.1 0.036-2.24
0.15-0.50 0.84
Range Tucson Basin Gofu (Japan) Eastern England Canadian Shield
Ikaria Island (Greece) 0.051
Brackish, Saline, and Brine
Canadian Shield 35
Canadian Shield 290 Canadian Shield 1077 Eastern England 15
14500 140000
1-1000 3.2-332.2
14-52 60
1.801
2411
32800 121000
8100
414 1628
130 208-322 36-347 71.4
35.3
68
113.1 112.3 540
Whitehead & Feth Whitehead & Feth
Davis & DeWiest Koglin
Frape, Fritz, & McNutt
Frape, Fritz, & McNutt
All concentrations are in parts per million, unless otherwise indicated.
u>
36
3.4 Chloride and Bromide in Soils and in the Biosphere
Bromide is not a nutrient for plants or animals, and is not toxic
to plants or animals at the levels at which it occurs in nature. Neither
bromide nor chloride is taken up preferentially by terrestrial plants, but
rather they compete for absorbance by plant roots (Epstein, 1953). This
means that plant roots do not distinguish between the two, but rather
absorb both bromide and chloride in amounts related to their concentra
tions in the root zone (Maw and Kempton, 1982; Yuita et al., 1982).
Chao (1966) found that the amount of bromide absorbed was affected
by the type of nitrogen fertilizer used, but was much more dependent on
the bromide concentration of the irrigation water.
In a study of pollution in the Great Lakes, Tiffany et al. (1968)
found that biological uptake of halides was not significant, but that
iodide and bromide were partially bound to floating biological materials.
This may indicate that lacustrine vegetation absorbs bromide preferen
tially with respect to chloride.
Bromide is absorbed preferentially by marine fauna. In a study of
trace and major elements in seaweed, Yamamota (1984) found that while sea
water has a chloride to bromide ratio of 289.3, seaweed has a ratio of 20.
This was based on the analyses of 24 seaweed samples. This may indicate
that marine fauna preferentially absorb bromide over chloride.
No unusual bromide levels are reported for the animal kingdom in
unpolluted environments, except for corals, which show an extraordinary
bromide concentration of 14,000 ppm dry weight, accumulated in sea water
which has a bromide level of only 65 ppm.

37
A large body of evidence exists for the uptake of bromide by the
organic fraction of soil (Kasintseva, 1964; Yamada, 1968; Lag and
Steinnes, 1976; Wilkins, 1978; Maw and Kempton, 1982; etc.)
Yamada (1968) found a positive correlation between bromide content
and soil organic content in Japanese soils. He found that bromide could
be released from these soils if the organic matter was oxidized with
peroxide. Wilkins (1978) examined the relationship between bromide
content and organic matter by plotting bromide (ug/g dry soil) versus loss
by ignition (%). She found that the data plotted on a straight line with
high positive correlation.
Lag and Steinnes (1976) studied the bromide content of Norwegian
forest soils and found that bromide was concentrated in the humus layer.
Maw and Kempton (1982) found that just one to ten per cent of the bromine
in soils is in the inorganic bromide form, with the rest being complexed
with humic acids. Only the inorganic bromide is soluble in water.
In soil studies conducted around the world, researchers have found
that bromide is concentrated in the upper organic rich soil horizons.
This leads to increasing CI/Br with depth through a soil column.
Straub (1964) studied the absorbance of trace elements by the
organic matter in an activated sludge process. It was found that 9-14%
of the "Br was removed from a waste stream in 24 hours. No speculation
was made as to whether greater absorbance would have been achieved with
a longer residence time. This and other short-term adsorption studies
(Serlin, 1984) have shown bromide to be conservative and not taken up by
organic matter or soils to an appreciable degree. Tables 4 and 5 list the

38
Table 4. Chloride and Bromide in Soils,
Source Bromide Chloride CI/Br Reference
Japan (Miomote River Basin)
Forest 95 Paddy 7 Upland Fields 153
81 67 90
0.85 9.57 0.59
Yuita Yuita Yuita
USSR
Podzolic A Horizon Deep Horizon
Serozems
England (Glasgow)
Rural 13 Urban Park 14 Urban Park 32 (near road)
1 . 0 180 800
Vinogradov Vinogradov Vinogradov
Farmer & Cross Farmer & Cross Farmer & Cross
Norway
Forest Soils:
Near ocean Inland
90 20
1500 500
16. 25
Lag/Steinness
All concentrations are in mg/kg.

Table 5. Chloride and Bromide in the Biosphere.
Source Bromide Chloride CI/Br Reference
Flora
Terrestrial Plants Terrestrial Plant Leaves (Japan)
Seaweed (Japan)
Foods
Oils, fruit, beverages Meat, fish, dairy,
vegetables, grains Endive, lettuce, celery
Toxicity
Freshwater Organisms:
Active toxicity No observed effect
concentration
40 30
180
<1 3-7
Up to 200
44-5800 mg/1 7.8-250 mg/1
3390
3700
113
20.5
N/A N/A
Maw & Kempton Yuita
Yamamoto
Greve Greve
Greve
Canton Canton et al.
All concentrations are in mg/kg dry weight, unless otherwise indicated.
40
[CI] and [Br] and the CI/Br for many soils and biological sources,
respectively.
3.5 Anthropogenic Influences on the Chloride to Bromide Ratio
Industrial activities have influenced the bromide cycle, the bromide
concentrations in nature, and thus the CI/Br ratio in the environment.
In this section, some aspects of this influence will be discussed.
Bromide is extracted from sea water by the chlorination process
(Petrucci, 1982):
Cl2(g) + 2Br"(aq) - Br2(l) + 2Cl"(aq)
Eighty percent of the bromide produced worldwide is used to manu
facture ethylene dibromide (Heath, 1971). Since the 1930s, nearly all the
ethylene dibromide produced has been used as a gasoline additive. Farmer
and Cross (1978) explain that its purpose is to scavenge lead from engines
in which tetraethyl lead has been used as an "octane booster". Until the
Environmental Protection Agency mandated the reduction in lead content in
gasoline, the average bromide content of gasoline had been 1.2 grams of
bromide per gallon.
Lead halides are formed in combustion and enter the atmosphere in
auto exhaust. Bromide is then freed by reactions in the atmosphere (Duce,
1965). Elevated bromide levels in the environment attributable to
automobile emissions have been found on inhalable particulate matter in
Boston (Thurston and Spengler, 1985), and Cambridge, Massachusetts

41
(Lininger et al. 1966), in urban soils (Farmer and Cross, 1978), and in
the Great Lakes (Tiffany et al., 1966).
Bromide is also added to the urban environment by the emissions of
coal-fired power plants. Mier (1975) found that a moderate-sized plant
will eject about 9 Kg per day of bromide into the atmosphere. Auto
emissions and power plant emissions can effect the CI/Br ratio of urban
runoff and recharge.
Agricultural activities can also affect the CI/Br ratio of runoff
and recharge. Bromide and chloride are constituents of some common
pesticides and herbicides. Methyl bromide and ethylene dibromide are used
as fumigants to control nematode populations. The fumigants decay and
release bromide to the soil (Roughan and Roughan, 1984).
Wilkins (1978) found bromide at low levels in KC1 formulations. She
found KC1 to contain about 700 ppm bromide, and that steer manure has
about 40 ppm bromide.

42
CHAPTER 4
METHODS OF ANALYSIS FOR BROMIDE
Among the desired tracer characteristics listed in the theory
section is ease of analysis. For a tracer to be widely accepted and used,
its analysis should be relatively rapid, inexpensive, and accurate. If
a tracer's analysis is accurate, but either expensive or time consuming,
it may still be useful in situations where a tracer test is needed but
other tracer techniques are not applicable.
To use the CI/Br ratio, the water must be tested for both ions. In
either pristine or polluted waters, chloride generally occurs at
concentrations that can be rapidly, accurately, and inexpensively
determined by a number of analytic methods. Bromide, however, usually
occurs at sub-ppm levels in natural waters. At the onset of this
research, it became clear that a great deal of time would need to be
devoted to finding a rapid, inexpensive technique that could be used to
accurately determine the bromide concentration in the chemical matrix of
natural waters or waters affected by agriculture.
In this section, seven methods for the analysis of bromide will be
described. Each subsection will describe the principle of operation,
equipment requirements, procedure, and detection limits for the method.
Each subsection will also address the method's strengths and weaknesses
with respect to its use with waters affected by agriculture.
The seven methods that will be described are (1) specific ion
electrode, (2) high performance liquid chromatography, (3) ion chromatog-

43
raphy, (4) phenol-red colorimetry, (5) iodide-iodate colorimetry, (6) X-
ray fluorescence, and (7) neutron activation analysis.
4.1 Specific Ion Electrode
Specific ion electrode (SIE) technology dates from the mid- 1960s.
The technology was developed to provide simple, inexpensive chemical
analysis in a portable system.
The bromide SIE is made up of an ion-sensitive membrane and an
electrical connection housed in a cylindrical epoxy body. A silver
sulfide-silver bromide mixture makes up the ion sensitive membrane. When
the electrode is emersed in a solution containing bromide, a potential
develops across the membrane. The potential is proportional to the
bromide concentration (Orion, 1982).
Materials needed for this technique include a bromide SIE (an Orion
94-35 was used for this study), a reference electrode, and a multiscale
voltmeter to measure the electric potential.
The first step in the procedure is to establish a rating curve,
relating [Br] to millivolts. A set of bromide standards is made, with
their concentrations bracketing the suspected concentrations of the
unknowns. Buffer is added to each standard so that it has roughly the
same ionic strength as the unknown solutions. Once the rating curve is
established, it can be used to read off a bromide concentration for an
unknown for which a potential has been measured.
The bromide SIE has a number of shortcomings when used with natural
water samples or with water from an agricultural region. Bromide

44
electrodes have a detection limit of 5xl0"6 M. , or 0.4 ppm. As stated
earlier, nearly all natural waters have bromide concentrations below 1.0
ppm, and most have concentrations below 0.4 ppm.
In order to use the bromide SIE, most natural waters would need to
be preconcentrated. This method was used by Koglin (1984), who concen
trated natural waters ten-fold and found that the SIE yielded errors of
50-100% when compared to other methods. With sub-ppm determinations, the
response time of the electrode is much longer, taking up to 20 minutes to
reach a stable reading (this study).
A more serious problem is that the chloride ion interferes with
bromide determinations. Manufacturer's literature stated that the bromide
determination will be in error if the chloride to bromide ratio is above
400/1 on a molar basis, which translates to 177/1 on a ppm basis.
The Grans plots method has been used to overcome this problem
(Orion, 1982). This involves multiple additions of known solutions and
multiple determinations for each sample. It is a very time consuming, and
not entirely accurate method.
Onken et al. (1975) noticed that if no bromide was present the
bromide electrode would still register a potential, according to the
relationship:
y - O.Olx + 0.26
where:
y - apparent [Br]

45
x - true [CI]
They used this relationship to subtract the apparent bromide concentration
from the determined bromide concentration to get the actual concentration.
This technique worked well with higher bromide concentrations, but yielded
errors up to 1 ppm when the actual bromide concentration was in the 1 ppm
range.
The bromide specific ion electrode technology is inexpensive, but
analysis is not rapid when bromide concentrations are low, and the
analyses are not accurate if chloride is present. It is not an approp
riate analytical tool for agricultural waters, where the CI/Br ratio is
typically above 177, or for natural waters, most of which have bromide
concentrations below 0.4 ppm.
4.2 Ion Exchange High Performance Liquid Chromatography
High Performance Liquid Chromatography (HPLC) evolved from column
chromatography as researchers sought increased speed, resolution, and
sensitivity in the analysis of ionic species. In 1983, Stetzenbach and
Thompson developed the Ion Exchange HPLC (IEHPLC) to produce a "simple,
accurate, and highly sensitive technique for the analysis of bromide..."
The principle of operation of IEHPLC can be explained by describing
the function of the heart of the system, the chromatographic column. The
column consists of a 25-cm long by 4.6 nun ID stainless steel tube, packed
with minute silica particles, which have been coated with ion exchange
resin.

46
As a sample is pumped through the column, the ions continually
adsorb to and desorb from the ion exchange resin. The anions commonly
found in water have different affinities for ion exchange resin. Those
ions with greater affinity for ion exchange resin (i.e., Br) will spend
a greater proportion of time adsorbed to the resin, and their passage
through the column will be slowed accordingly. Those ions with a lesser
affinity for the resin (i.e., CI) will pass through the column more
quickly.
The effect of the different rates of adsorbence and desorbence,
coupled with the movement of the liquid phase, is that the various ions
present in the water sample will be separated within the column and will
elute from the column separately. As each ionic species elutes, it can
be detected and quantified with an ultraviolet absorbance detector.
In addition to the column, the system includes a computer to
regulate the solvent pumps and the chart recorder, two non-pulse high
pressure pumps to deliver pure water and phosphate buffer solution, a
mixing cell to mix the solvents, an injection valve where the sample is
introduced, a UV source and detector to measure the absorbance as the ions
elute, and a chart recorder to produce a graph of the ion outputs.
For our research, we used a SpectraPhysics (Santa Clara, California)
model SP-8700 Liquid Chromatograph, a Valco (Houston, Texas) 7000 psi
injection valve, a 25 cm by 4.6 mm ID column packed with Whatman SAX lOum
particles, and a Hitachi (Tokyo, Japan) model 10-40 variable wavelength
ultraviolet recorder.

47
To yield accurate analyses, the ions must be eluted in separate,
sharp, symmetrical peaks. The operator must "optimize" the system with
respect to those characteristics. This is done by finding the correct
combination of mobile phase pumping rate, mobile phase combination, sample
injection volume, and UV wavelength. Optimization techniques are
described in Hechenberg and Haddad (1984). One must also have a good
quality, well-maintained column that is capable of separating the peaks.
Our system was optimized for bromide analysis with a mobile phase
of 0.03M KH2P04 ,a 50ul sample loop, and a flow rate of 3.0 ml/min., with
the UV detector set at 190nm. Although these settings yielded the best
results, we were unable to fully separate the bromide peak from the
nitrate peak. The partial overlapping of the peaks led to inaccurate
results when analyzing preconcentrated ground water from the Tucson basin
and mixed standard solutions. Our system was also unable to detect
bromide at the lower limit reported by Thompson and Stetzenbach.
IEHPLC is a good analytical technique for traditional bromide tracer
tests, where bromide levels are significantly higher then N03"2 or N02"
levels, or where lower levels of bromide need to be detected but not
quantified.
This technique is probably not suited to analyzing bromide as an
environmental tracer in agricultural regions. Agricultural drainage
waters may have elevated N03"2 and CI* levels. High chloride levels may
necessitate dilution of the sample so as not to "poison" the column, thus
bringing the bromide level to or below the detection limit.
48
4.3 Ion Chromatography
Ion Chromatography was developed during the mid-1970s by Dow
Chemical Corporation. An ion chromatograph (IC) can be described as an
HPLC that has been designed specifically for ion analysis. For this
reason, the principles and methods of operation for the two systems are
similar.
Within the chromatographic column, the sodium hydroxide eluent and
the sample ion simultaneously replace anions on the anion exchange resin.
The column effluent is then passed through a suppressor column to remove
the excess sodium hydroxide. The suppressor column is so called because
by removing the NaOH, the electrical conductivity of the mobile phase is
suppressed.
The effluent from the suppressor column then passes through a
conductivity cell, where the elution of the desorbed sample ion causes a
measurable peak in the conductivity. The suppression reaction increases
both selectivity and sensitivity of the chromatograph and dramatically
decreases baseline noise.
Because the IC eluents are strong acids and bases, the entire
hydraulic system is made up of chemically-inert materials. The column
packing material is styrene/divinylbenzene, which can withstand high and
low pH values and high pressures.
The IC is well suited to the analysis of bromide at environmental
levels, and can be used to analyze some agricultural waters. Literature
from the Dionex Corporation (patent holders for the IC process) indicates

49
that chloride and bromide can be determined simultaneously within four
minutes of sample injection, with no sample pretreatment.
The IC is not applicable for analyzing for bromide in water samples
from the Wellton-Mohawk Irrigation and Drainage District or Colorado River
water. Ground-water samples from these sources have CI/Br ratios ranging
from 600 to 1350. With three orders of magnitude between the chloride and
bromide concentration, the bromide peak is obliterated by the chloride
peak (Minich, 1987).
4.4 Phenol-Red Colorimetrv
Colorimetric analytical techniques have long been part of the
chemist's repertoire. They have largely been supplanted by more sophis
ticated and accurate techniques.
Colorimetric methods entail involving the target ion either directly
or as a catalyst in a chemical reaction that changes the color of an
indicator. Some means is then used to quantify the depth of color
developed in the solution and to relate this to a concentration for the
ion.
In the phenol red method, phenol red is used as the indicator.
Bromide is first oxidized to bromine by chloramine-T in a buffered
solution. The bromine then combines by electrophilic substitution with
the phenol red to form bromophenol blue (Basel et al., 1982) There is a
linear relationship between the bromide concentration in the original
sample and the depth of the blue color developed in the reaction vessel.
50
Because this is a slow reaction, the amount of bromophenol blue
produced depends not only on the bromide concentration, but also on how
long the reaction is allowed to proceed. For this reason, the reaction
is timed and arrested after 20 minutes, by the addition of Na2S203.
The equipment and materials needed for this method are reagents,
glassware, a stopwatch, and a spectrophotometer. The spectrophotometer
is used to quantify the depth of color developed in the reaction vessel
by measuring the fraction of light passing through the sample. If a
spectrophotometer is not available, a set of bromide standards can be run,
and their color used to visually bracket the concentration of unknown
samples.
This method will yield accurate analysis on water samples containing
between 0.1 and 1.0 ppm bromide (Standard Methods for the Analysis of
Water and Wastewater, 1985, method #405). In our investigation, using a
SpectraPhysics model S1900 spectrophotometer, we were able to measure
bromide standards over the range of 0.1 to 1.2 ppm bromide. A plot of
bromide concentration versus percent of light absorbed showed a correla
tion of 0.999.
This method is subject to interferences caused by oxidizing agents,
reducing agents, iodide, chloride, bicarbonate, and ammonium ion (Basel
et al., 1982). Stetzenbach and Thompson (1983) reported an apparent
concentration of 1-4 ppm bromide in groundwater due to interferences.
Basel et al. have shown that CI" HC03"' and NH4" levels as low as 100, 50,
and 0.1 mg./l, respectively, can have a significant effect on bromide
analyses.
51
This method is not suited to measuring bromide in water from an
agricultural setting. We found that bromide readings were not comparable
to those obtained from other chemical methods. The concentrated, complex
chemical matrix of agricultural return flows appears to overwhelm the
method with interferences.
4.5 Iodide-Iodate Colorimetrv
Another colorimetric method for determining bromide is based on
..the catalytic effect of traces of bromide ion on the rate of oxidation
of iodide to iodate by potassium permanganate in a sulfuric acid solution"
(Annual Book of ASTM Standards, Part 31, Method D-1246-77 B). For a given
reaction time, under controlled conditions of pH, temperature, and
reactant concentration, the concentration of unreacted iodide is inversely
proportional to the original bromide concentration.
For this method, a sample containing not more than 0.1 ug of bromide
is added to a separatory funnel. A mixture of KI-H2S04 as a pH regulator
and iodide donor is added to this. The solution is then cooled in an ice
bath for 45 minutes. KMn04 is then added, and the reaction is allowed to
proceed for 10 minutes. After 10 minutes, CC14 is added to the reaction
vessel and shaken. All the remaining iodide fractionates to the CC14,
which is then removed from the separatory funnel. The depth of the red
color in the CCl4 is read on a spectrophotometer.
This method is subject to interference from oxidizing and reducing
agents. The procedure is very time consuming, and involves handling

52
concentrated acid solutions and CC14. We found that one could not analyze
more that ten samples in a day.
4.6 Neutron Activation Analysis
Neutron activation analysis (NAA) is a branch of radioanalysis, the
application of the phenomena of radioactivity to analytical chemistry.
Radioanalysis dates to the mid-1930s, with the development of NAA taking
place in the 1950s and 1960s. NAA's development coincided with the
proliferation of research and commercial nuclear reactors during those
decades.
The principle of operation of NAA is based on the conversion of a
fraction of the nuclides in a sample to short-lived radionuclides,
followed by comparing the decay rate of the irradiated sample with that
of an irradiated standard. A sample of material placed near the core of
a nuclear reactor will be bombarded by fast neutrons. Some of these
neutrons will enter the nuclei of atoms in the sample, thus transforming
them into heavier radionuclides. Subsequently, the rate and energy of the
gamma ray emission spectra from the sample can be used to determine its
elemental composition.
In the case of bromide, "Br and "Br are converted by neutron capture
into 80Br and "2Br. The number of radioactive bromide atoms produced is
dependent on the bromide concentration in the sample, the neutron flux,
and the length of time that the sample is irradiated. After irradiation,
the bromide content is quantified by comparing the radioactive emission
spectra with a spectra produced by a standard.
53
For this study, NAA was performed at the TRIGA (General Atomic
Technologies) rector run by the Department of Nuclear and Energy Engineer
ing, University of Arizona. The accurate determination of bromide by NAA
at this facility requires at least 10 micrograms of bromide. Assuming a
bromide concentration of 1.0 mg/1 as an average concentration for water
from the WMIDD, the analysis would require a sample of at least 10 ml.
This volume is impractical for irradiation and counting, so some precon-
centration was necessary. The following very efficient preconcentration
method was developed with the advice and assistance of L. Wirt.
(1) Transfer a water sample large enough to contain at least
10 ug of bromide to a beaker. For WMIDD water, 10 or
20 ml samples were used.
(2) Add dilute HN03 dropwise to lower the pH to 2.0.
(3) Add enough AgN03 to precipitate 1.5 times the chloride
content. This provides enough Ag* to precipitate all of
the chloride and bromide. The sample will turn a cloudy
white.
(4) Cover the beaker with foil and set it in a dark place
for three hours. This allows the AgCl and AgBr to
coagulate and settle without decomposing.
(5) Add one drop of AgN03 solution. If additional white
precipitate forms, repeat Steps 3, 4, and 5.
(6) Rinse three cellulose nitrate filters with 0.1 M HN03.
Using acid-washed tweezers, put two into a plastic
sandwich bag, and install the third on the Whatman

54
Filter system. Be careful not to touch the filters or
the inside of the bag with your fingers.
(7) Rinse the inside of the filter funnel with 0.1 M HN03
and pump the solution through the filter. This removes
any bromide contamination. Repeat the process.
(8) Filter the sample. Rinse the inside of the beaker with
0.1 M HNOj and filter the rinse water. Repeat this step
until no precipitate remains in the beaker. Similarly,
rinse down the insides of the filter funnel to ensure
that all the precipitate is on the cellulose nitrate
filter.
(9) Remove the clamp and filter funnel from the filter appa
ratus. Using acid-washed tweezers, fold the cellulose
nitrate filter in half, forming a semicircle. Refold the
filter, forming a quarter circle. Place the quarter
circle between the two other cellulose nitrate filters
in the plastic bag, making a "sandwich".
4.7 X-Rav Spectrometry
X-ray fluorescence spectrometry (XRFS) has been a widely-used
analytical technique since the late 1950s. It is based on recognition of
each element's characteristic energy of photon emissions when electrons
fall from the excited state. XRFS has been used to analyze bromide at
trace levels in atmospheric particulates and in ground-water samples.

55
There is some variation in hardware among XRF spectrometers, but
they all conform to the same general operating procedures. To excite
electrons within the specimen, it is bombarded with rays (photons or
electrons). The excited electrons then fall back to the low energy state,
emitting a photon with energy characteristic of the difference in energy
between the two orbitals.
The beam of emitted photons is then separated by a crystal into the
spectrum of characteristic energies, in much the same way as a prism
separates light into a spectrum. One of the characteristic energy levels
for the analyte is then selected, detected, and integrated to quantify the
intensity of the characteristic energy line. The intensity is then
multiplied by a conversion factor to yield an elemental concentration
(Jenkins et al., 1981).
The equipment requirements include: an X-ray source to provide an
X-ray beam, a sample holder to provide precise and repeatable sample
positioning, an analyzing crystal to separate the emission spectrum into
distinct wavelengths, a Si(Li) or Ge(Li) crystal to detect emissions, and
a multichannel peak height analyzer to quantify the emission intensities.
Jenkins et al. (1981) reported accuracies in the 0.1 percent range
for low ppm analyses, with each analysis taking only a few minutes.
Analyses can be performed on either liquid or powder samples. The last
point is significant in that it allows for a choice among a greater range
of preconcentration techniques.

56
4.8 Summary
This author and Ms. Elizabeth Behl analyzed bromide standards,
surface waters, ground water, urban runoff, and irrigation return flow by
all but one of the methods described in this section. High performance
liquid chromatography, the phenol-red colorimetric method, the iodide
colorimetric method, and the specific ion electrode were performed by the
team, neutron activation analysis was done by this author, and ion
chromatograph was conducted independently at two different facilities by
this author and E. Behl. Because of time constraints, we were not able
to use an X-ray spectrometer.
It is important that recommendations concerning the analysis of
bromide at environmental levels be based on first-hand experience. Many
of the analytical techniques which were attempted failed to perform as
well as had been described in the literature, due to the low bromide
levels and the complex and concentrated chemical matrix present in some
environmental samples.
All seven methods will yield accurate and reproducible results when
analyzing standards made up of bromide salts dissolved in deionized or
distilled water. All seven methods will also work well if those bromide
standards are used in laboratory studies of adsorption of bromide onto
environmental materials, bromides behavior during evaporation, or bromide
used as a tracer in a column test.
When a ground-water tracer test is performed which requires quan
titative bromide determination, NAA, HPLC, IC, and XRFS will all yield
satisfactory results. Of these, IC is by far the quickest and easiest

57
method. SIE is another quick and easy method, but it will be accurate
only if the tracer test is so designed that the CI/Br ratio does not
exceed 177, even after the bromide tracer has been dispersed. HPLC may
not yield accurate results if the ground water contains elevated N02 or
N03 levels.
E. Behl (personal communication, 1987) has found that IC is the best
method for analyzing bromide in urban runoff samples. It can distinguish
bromide from the complex matrix and is much more rapid than NAA. NAA is
the only method available for the analysis of bromide in irrigation return
flows. Other methods will not work well because of the high ratio of
chloride to bromide (IC, SIE, HPLC), or because of the level of other
interfering ions (HPLC, Phenol Red, Iodometric).
Finally, of the analytical methods tested, only NAA and X-ray
fluorescence will determine the total amount of the element bromine.
Although not tested in the current research project, some sewage and
irrigation return water may contain various organic compounds of bromine
rather than the simple anion, bromide.
58
CHAPTER 5
EXPERIMENTAL EVALUATION OF CHLORIDE TO BROMIDE RATIO CHARACTERISTICS
Chapter 2 describes several important characteristics of the CI/Br
ratio which have not been investigated or fully defined in the literature.
Two of these characteristics that can be investigated in the laboratory
are: (1) the constancy of the CI/Br ratio with evaporation, and (2) the
conservativity of environmental levels of bromide passing through
environmental materials.
Prior to our experiments, it was felt that the CI/Br ratio would
remain constant as a water body evaporated, because there would be no
"syn-bubble breaking fractionation", but that there was a possibility that
a small amount of bromide would volatilize. In addition, bromide is
conservative at high levels, but some absorbance might take place on
organic matter.
Conservativity is an important characteristic of any environmental
or artificial ground-water tracer. It is especially important for the use
of the CI/Br ratio as an environmental ground-water tracer because a small
change in the bromide concentration by absorption leads to a large
increase in the ratio. Two experiments were performed to test whether or
not bromide acts conservatively at low concentrations. The first is a
batch test conducted by E. Behl, testing for absorbance of bromide on
activated charcoal. The second is a batch test conducted by this author
to test for absorbance of bromide on a desert soil.

59
5.1 Constancy of the Cl/Br with Evaporation
Implicit in the use of the Cl/Br ratio as an environmental ground
water tracer in an agricultural setting is that the ratio remains constant
with evaporation. This assumption is especially important in the hot,
dry, desert Southwest, where evaporation from irrigated fields is a major
consumptive use. If the Cl/Br ratio does not remain constant with
evaporation, then the use of the Cl/Br ratio of the irrigation water
source cannot be used as a tracer. An experiment was designed to verify
the constancy of the Cl/Br ratio with evaporation.
5.1.1 Procedure
Water with a known Cl/Br ratio was mixed and then left standing in
a black plastic pan (75 cm long, 40 cm wide, 18 cm high). The pan was
covered with a perforated, clear plastic sheet. The plastic sheet allowed
light in and water vapor out, but protected the water from airborne
particles. Spacers were inserted between the plastic sheet and the top
of the pan to provide for increased air circulation. This increased the
evaporation rate and minimized condensation on the plastic sheet by
lowering the humidity within the pan.
At dawn, the pan was set where it would be in direct sunlight
throughout the day. The rate of evaporation was monitored by periodically
measuring the volume of water remaining in the pan. This was done by
decanting the evaporating water into a 2000-ml graduated cylinder. After
recording the volume, a measured sample was taken for bromide and chloride

60
determinations. Chloride was determined by mercurimetric titration, and
bromide was determined by the phenol-red colorimetric method.
5.1.2 Results and Conclusions
The experiment was repeated with various initial Cl/Br ratio ratios
and concentrations chosen to span the expected values for irrigation
waters. The experimental results are presented in Table 6. In each
experiment, the change in the Cl/Br ratio shows no trend, with the
variation within the limit of experimental error.
This series of experiments indicates that with chloride and bromide
concentrations typical of irrigation waters, the Cl/Br ratio remains
constant with evaporation. This observation will not hold for very
concentrated solutions, or where an irrigation water evaporates to near
dryness. In these cases, which are not likely to be encountered in an
agricultural setting, halite precipitation removes chloride preferentially
over bromide.
5.2 Bromide Absorbance on Activated Charcoal
This experiment was conducted by E. Behl as part of her study of the
Cl/Br ratio as an environmental ground-water tracer in the urban
environment (Behl, 1987).
5.2.1 Procedure
A 1 mg/1 solution was added to a beaker containing activated
charcoal. The mixture was mixed momentarily, and then left to stand.

i
Table 6. Variation of the CI/Br Ratio During Evaporation.
Initial [C1-] (ppm)
Initial [Br-] (ppm)
Time (Military)
Trial 1
Trial 2
Trial 3
Trial 4
50.0 0.64 0630 1100 1300 1400 1540
50.0 0.53 0600 1100 1300 1400 1600
100.0 0.53 0700 1000 1400 1600 1730
250.0 0.53 0630 0900 1100 1300 1530
Volume (ml)
CI/Br (ppm/ppm)
2000 1462 960 766 566
78.1 8 2 . 8 87.2 81.2 87.3
2000 1471 974 784 557
94.3 96.2 95.7 94.3 95.8
2000 1620 940 670 560
188.7 185.9 182.4 190.4 190.5
2000 471.6 1653 473.4 1497 '• 462.6 842 470.4 650 474.7
62
Water samples were taken periodically over 7.5 hours and analyzed for
bromide by HPLC, using the equipment setup described in Chapter 4.
5.2.2 Results and Conclusions
Behl's results show that the rate of decreases logarithmically with
time. The bromide concentration dropped by 0.10 ppm during the first 30
minutes, but only fell another 0.03 ppm during the next 7.5 hours.
Every published report of bromide absorbance by soil indicates that
the bromide is absorbed by the organic carbon in the soil. In this
experiment, Behl has shown that the absorbance of bromide by activated
charcoal, which is entirely carbon, is minor. The absorbance of bromide
by soils with low or moderate levels of carbon should be negligible.
5.3 Bromide Absorbance bv a Desert Soil
The batch tests performed by Tennyson and Sedergren (1980) were
described in Chapter 3. They found that bromide in the range of 0.03 to
2.35 ppm was not absorbed by a silt loam soil. Their methods were used
as a model for a set of batch tests with a desert soil.
5.3.1 Procedure
A soil sample was collected from a remote desert area south of
Tucson, Arizona. Soil was sieved with a 0.5-cm screen, and two 100 g
samples of sieved soil were retained. Each of these samples was rinsed
with one liter of distilled water to remove any soluble native bromide
salts. The water was decanted from each mixture and filtered, with the

63
fines that accumulated on the filter paper being returned to the soil
sample. The soil samples were dried in a 100° C oven for approximately 6
hours. Each soil sample was then cooled, broken up, and placed into a
two-liter beaker. One liter of distilled water containing 1.00 ppm
bromide was added to each beaker. The mixtures were stirred for 20
minutes, and then allowed to stand for 20 minutes.
50-ml samples were collected from each beaker and filtered. The
filtered water samples were analyzed in triplicate using IC, performed at
the University of Arizona Analytic Center.
5.3.2 Results and Conclusions
In each of the two experimental runs, the bromide concentration
dropped by an insignificant amount, within the limits of experimental
accuracy. In one beaker, the bromide concentration dropped from 1.00 ppm
to 0.99 ppm, and in the other from 1.00 ppm to 0.97 ppm. This suggests
that the absorbance of bromide by soil would have very little effect on
infiltrating rain water, irrigation water or recharge water in a desert
environment.
5.4 Conclusions
This study, as well as many previously-reported studies, has shown
that bromide is either not adsorbed, or is negligibly adsorbed on soil
material. This conclusion is in apparent contradiction to the studies
which have found the upper organic-rich soil layers to be enriched in
bromide relative to chloride. The contradiction may be explained by the

64
adsorption of a small fraction of the bromide in the infiltrating rain
water over a long period of time.
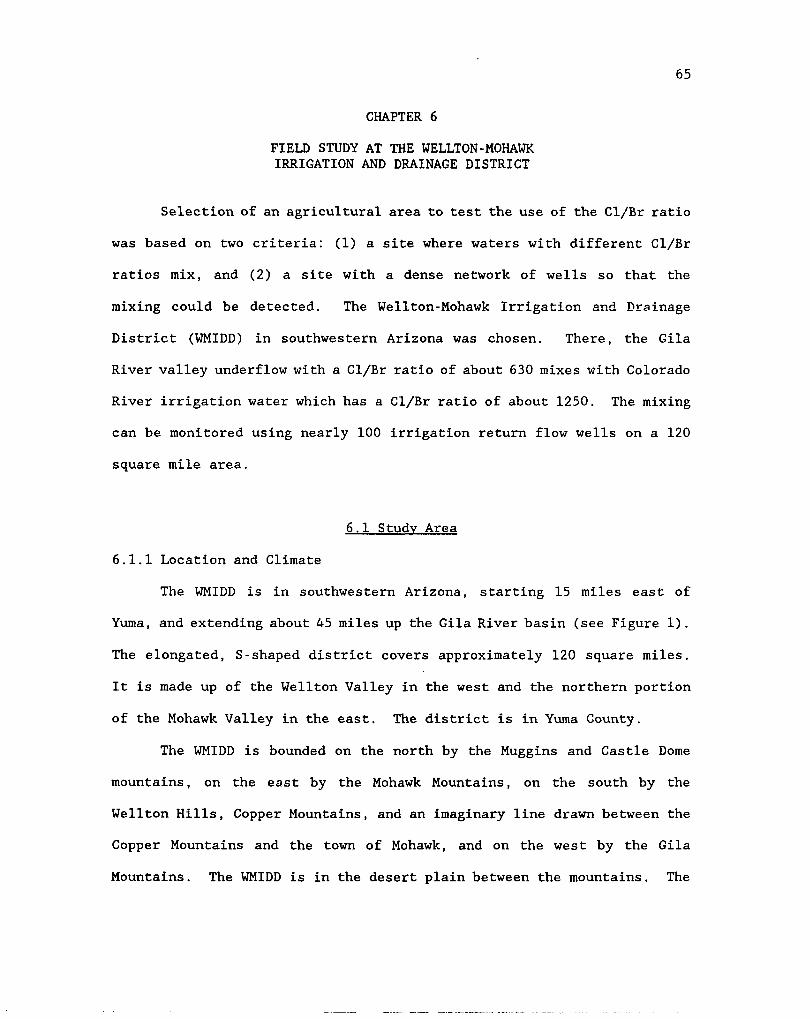
65
CHAPTER 6
FIELD STUDY AT THE WELLTON-MOHAWK IRRIGATION AND DRAINAGE DISTRICT
Selection of an agricultural area to test the use of the CI/Br ratio
was based on two criteria: (1) a site where waters with different Cl/Br
ratios mix, and (2) a site with a dense network of wells so that the
mixing could be detected. The We11ton-Mohawk Irrigation and Drainage
District (WMIDD) in southwestern Arizona was chosen. There, the Gila
River valley underflow with a Cl/Br ratio of about 630 mixes with Colorado
River irrigation water which has a Cl/Br ratio of about 1250. The mixing
can be monitored using nearly 100 irrigation return flow wells on a 120
square mile area.
6.1 Study Area
6.1.1 Location and Climate
The WMIDD is in southwestern Arizona, starting 15 miles east of
Yuma, and extending about 45 miles up the Gila River basin (see Figure 1).
The elongated, S-shaped district covers approximately 120 square miles.
It is made up of the Wellton Valley in the west and the northern portion
of the Mohawk Valley in the east. The district is in Yuma County.
The WMIDD is bounded on the north by the Muggins and Castle Dome
mountains, on the east by the Mohawk Mountains, on the south by the
Wellton Hills, Copper Mountains, and an imaginary line drawn between the
Copper Mountains and the town of Mohawk, and on the west by the Gila
Mountains. The WMIDD is in the desert plain between the mountains. The

66
111
WMIDD
"\ Tucson \
113'
100 km 111
Figure 1. Location of the Wellton-Mohawk Irrigation
and Drainage District.

67
elevation ranges from about 400 feet above sea level in the east to about
200 feet in the west, giving the valley a slope of less than one foot per
thousand feet.
The WMIDD is within the Sonoran Desert, and so it has a hot, dry
climate suitable for year-round irrigated agriculture. The region
receives about 90% of the available sunshine, but only 2 to 3 inches of
rain per year.
6.1.2 Settlement and Agriculture
When the Spanish explorer, Hernando de Alaron, sailed up the
Colorado River in 1540, he found American Indians of the Yuman culture
living along the banks of the Colorado and Gila rivers. Spanish influence
in the region increased, culminating in the establishment of a local
mission in 1780 and the eventual incorporation of all of the territory
south of the Gila River into Mexico.
The area became part of the Arizona Territory with the Gadsen
Purchase of 1848. During the next half century, Yuma became a trading
post, the location of the Colorado River Crossing for the Butterfield
Stage Line and other San Antonio-to-San Diego mail carriers, and the site
of a military fort. By 1870, the Wellton Valley had been settled by
homesteaders, and the population of Yuma had reached 1,142. The
population of the Wellton-Mohawk area grew with the state and with the
expansion of irrigated agriculture into the valleys (Moser, 1966).
Historically, the Yuman Indians had practiced irrigation near the
confluence of the Colorado and Gila rivers, raising maize, watermelon,

68
squash, arid beans. The size and complexity of the irrigation systems
expanded under Mexican and American operation in the 1700s and 1800s.
The legislative actions which led up to the formation of the WMIDD
began in 1902, with the National Reclamation Act. This act authorized the
Federal Government to build large-scale irrigation structures and to
recoup its investment through user fees. Laguna Dam was built in 1909 to
impound the Colorado River, and to provide an assured water source for
California and eventually the Gila Valley.
The Gila River Reauthorization Act of 1947 gave the We11ton-Mohawk
area an appropriation of Colorado River water sufficient to irrigate
75,000 acres. Delivery of water began in 1952.
Throughout the history of agriculture in the study area, there had
been two problems: water availability and soil salinity. Local soils are
naturally saline, after eons of evaporation of the scant rainfall. Prior
to the delivery of Colorado River water, crops had been irrigated with
local ground water. The cycling of water through the soil and back to the
ground water increased the ground water's salinity. At the same time, the
purging action of the high flows on the Gila River was on the wane because
of dams built upstream on the Gila and because of increased water use in
the Phoenix area (Moser, 1966).
The water availability problem was solved with the importation of
Colorado River water. Initially, irrigation with large volumes of
Colorado River water ameliorated the salinity problem by leaching built-
up salts from the root zone to the ground water. The salinity problem
returned when the water table rose in response to the large influx of

69
water. Dissolved salts were then transported to the surface by capil
larity and evapotranspiration from the shallow water table. By 1958, farm
land was being abandoned due to water-logging of the soils and increasing
soil salinity (USBR, 1981; Moser, 1966).
To lower the water table, the abandoned irrigation wells were
reactivated as irrigation return flow wells. The system of irrigating
with Colorado River water and pumping poor quality water from the aquifer
was successful and continues to the present time.
6.1.3 Soils
Soil characteristics are germane to the study of an environmental
tracer in an agricultural setting in that their properties determine the
types of crops grown, the infiltration rate, and irrigation practices.
They also influence the salinity and ionic ratios of infiltrated water by
dissolution or absorption of ions.
Three major soil groups and one minor one cover the WMIDD. The
major groups are the Indio-Ripley-Lagunita, Dateland-Wellton, and the
Ligurta-Cristobal-Corrizo. The minor soil group is the Laposa-Rock
Outcrop. The distribution of the soil groups within the study area is
illustrated in Figure 2.
The Indio-Ripley-Lagunita soils dominate the center of the valley,
which is the recent floodplain of the Gila River. Its profile is silty
in the upper zone, underlain by a sandy horizon. Sections of the Indio
are saline to strongly saline. It is 35% Indio, 15% Ripley, 15% Lagunita,
and 15% other.

WELLTON-MOHAWK IRRIGATION AND DRAINAGE
SOIL GROUP DISTRIBUTION OF THE WMID
Laguna Mountains
R
' ! vvv:- •••:
"... ii ..v.*.*;
' » . • • • . • • • , , • ' , * . • ' , ' A « '•; •: ;.. :•: v- •
:•; •.;• • • V.- :vf••
• o • • . • • * • o. ' • ' • a.
N
I Gila Mountains
5 Miles
Figure 2. Soil Group Distributio

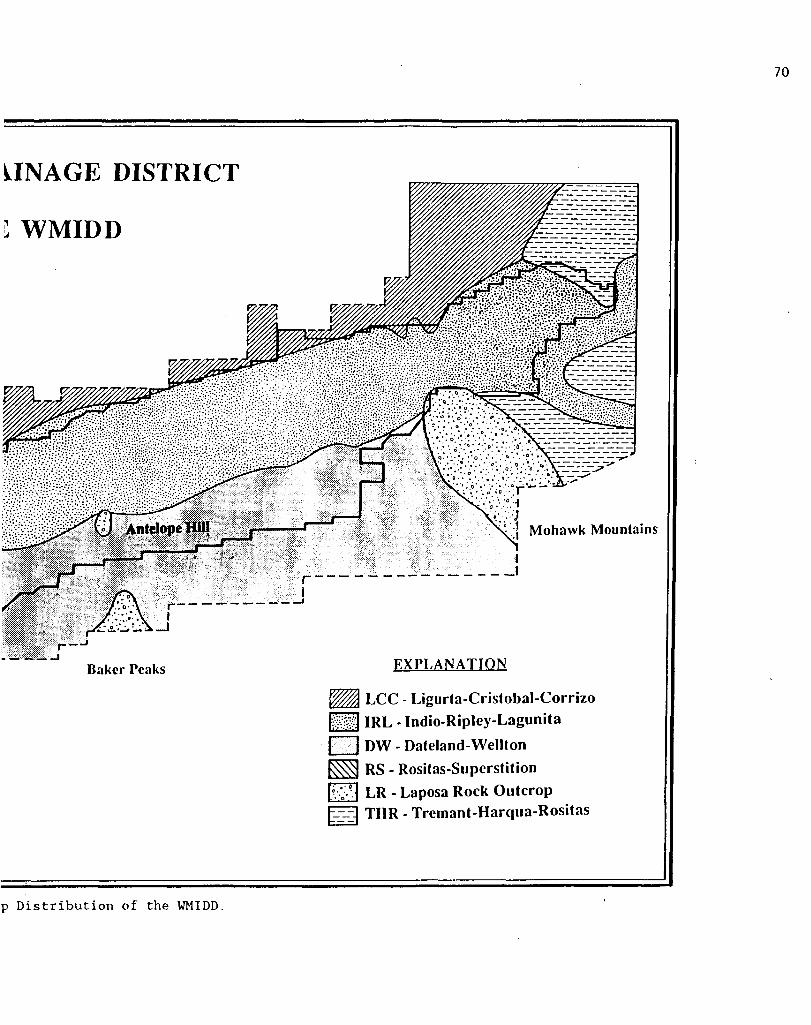
LINAGE DISTRICT
I WMIDD
J / ,
•'•' :• :;v.v:- ••;
Mohawk Mountains
i
Baker Peaks EXPLANATION
W/. LCC - Ligurla-Cristobal-Corrizo
{fll IRL - Indio-Ripley-Lagunita
( | DW - Daleland-Wellton
RS - Rositas-Superslition
LR - Laposa Rock Outcrop THR - Tremant-Harqua-Rositas
p Distribution of the WMIDD.


71
The Dateland-Wellton soils cover the southern portion of the
irrigation district. Dateland soil is a fine sandy loam, covering the
lower parts of fans and terraces. Wellton soil, which covers the upper
parts of fans and terraces, has a loamy surface and a fine-grained sandy
loam subsoil. Dateland and Wellton soils each cover about 40% of the
area, with the remainder covered by other soils.
The Ligurta-Cristobal-Corrizo soils cover the northern edge of the
study area. These coarse-grained soils (averaging 35% gravel) cover
alluvial fans, terraces, and floodplains. They are underlain by extremely
saline subsoils. The percent coverages of Ligurta, Cristobal, Corrizo,
and other soils are 40%, 30%, 15%, and 15%, respectively.
The Laposa-Rock Outcrop soil group occurs in the Gila and Mohawk
mountains where they impinge on the irrigation district and on the
isolated Antelope Hills within the district. The Laposa is an extremely
gravelly soil, representing mostly the mechanical decay products of
granite, gneiss, schist, andesite, and rhyolite. Soil descriptions and
distributions are from the Soil Survey of the Yuma-Wellton Area compiled
by the USDA Soil Conservation Service (Barmore, 1978).
6.1.4 Geology
Geographically, the WMIDD can be divided into two sections: the
Wellton Basin in the west, and the northern section of the Mohawk Basin
in the east. Both are northwest-trending, sediment-filled structural
basins.
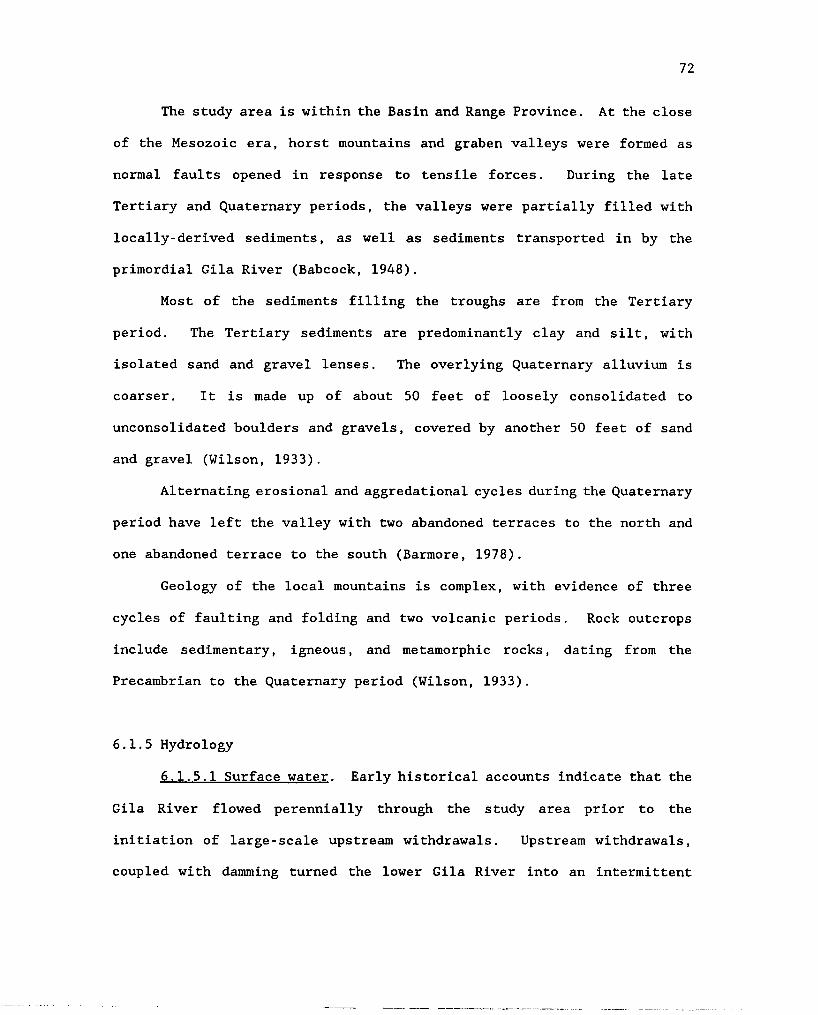
72
The study area is within the Basin and Range Province. At the close
of the Mesozoic era, horst mountains and graben valleys were formed as
normal faults opened in response to tensile forces. During the late
Tertiary and Quaternary periods, the valleys were partially filled with
locally-derived sediments, as well as sediments transported in by the
primordial Gila River (Babcock, 1948).
Most of the sediments filling the troughs are from the Tertiary
period. The Tertiary sediments are predominantly clay and silt, with
isolated sand and gravel lenses. The overlying Quaternary alluvium is
coarser. It is made up of about 50 feet of loosely consolidated to
unconsolidated boulders and gravels, covered by another 50 feet of sand
and gravel (Wilson, 1933).
Alternating erosional and aggredational cycles during the Quaternary
period have left the valley with two abandoned terraces to the north and
one abandoned terrace to the south (Barmore, 1978).
Geology of the local mountains is complex, with evidence of three
cycles of faulting and folding and two volcanic periods. Rock outcrops
include sedimentary, igneous, and metamorphic rocks, dating from the
Precambrian to the Quaternary period (Wilson, 1933) .
6.1.5 Hydrology
6.1.5.1 Surface water. Early historical accounts indicate that the
Gila River flowed perennially through the study area prior to the
initiation of large-scale upstream withdrawals. Upstream withdrawals,
coupled with damming turned the lower Gila River into an intermittent

73
stream, with no flow into the study area during normal years (Babcock et
al., 1947).
Although there is normally no inflow from upstream, a visitor to the
WMIDD would see the Gila River flowing perennially within most of the
study area. This is due to the irrigation practices, which have raised
the ground-water level so that the water table is above the river bed.
So within recorded history, this section of the Gila has gone from a
losing perennial stream to a losing intermittent stream, to a gaining
irrigation return flow wasteway!
The more significant surface water system consists of 378 miles of
canals and return flow channels (see Figure 3). The Wellton and Mohawk
canals delivered 366,275 acre feet of Colorado River water to farms during
1986, and the Wellton-Mohawk Main Conveyance returned 118,500 acre feet
of drainage water to the Colorado. All but the smallest channels are
lined. Water is diverted to the WMIDD at Laguna Dam, and return flow is
routed to the Gulf of California via a bypass drain to the Santa Clara
Slough, a salt water marsh on the northern end of the Gulf of California.
6.1.5.2 Ground water. The aquifer system in the study area consists
of two units: a lower Tertiary age deposit consisting mostly of silts and
clays, and an upper Quaternary age unit dominated by boulders, gravel, and
sand. The total thickness of the sediment column is estimated to reach
700 feet. The upper aquifer has a saturated thickness ranging from 60 to
100 feet.
Figure 4 displays a schematic cross section cutting perpendicular
to the valley. It shows that the upper aquifer consists of approximately

SURFACE WATER FEATURES OF THE ̂
L..
•J
Convey I
L_
Main
! Wellton-Mohawk
i
5 Miles
Figure 3. Surface Water Features of the

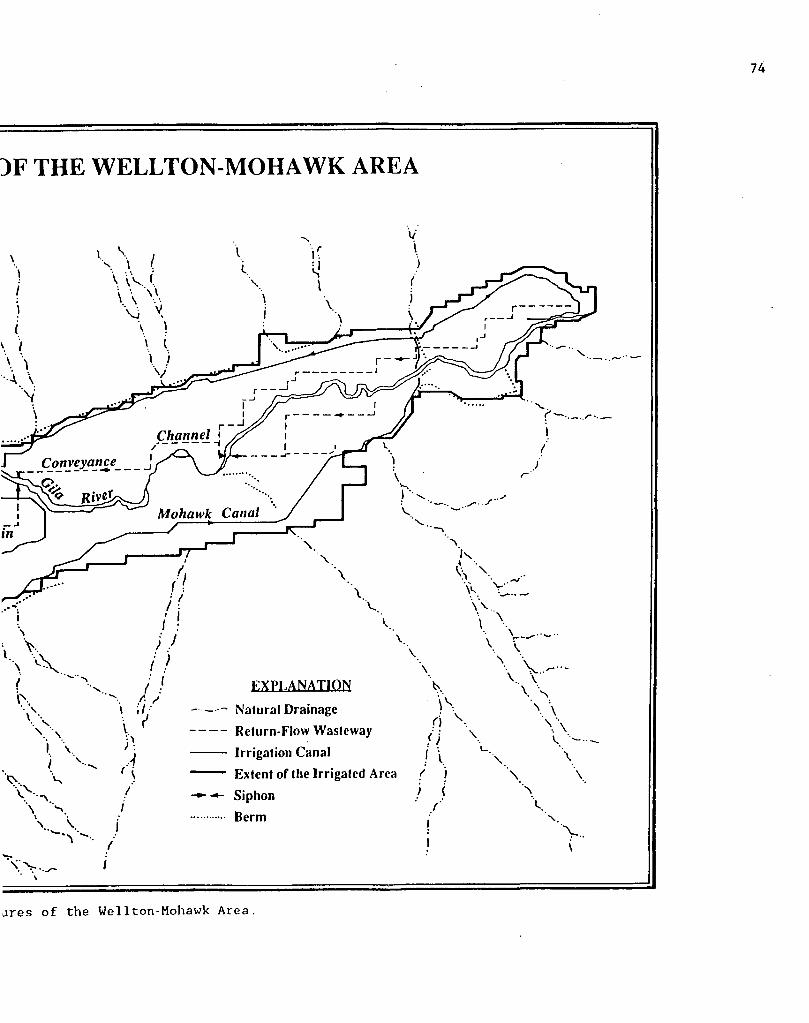
3F THE WELLTON-MOHAWK AREA
Channel
Conveyance_ _
Mohawk Canal /
FXPI.ANATION
~ Natural Drainage
- Return-Flow Wasteway
Irrigation Canal
Extent of the Irrigated Area f I
•*- Siphon
Berm
jres of the Wellton-Mohawk Area


GEOLOGIC CROSS-SECTION THROUGH THE LOWER GILA RIVER VALLEY
South North
River
Tertiary Lake Deposit
Figure 4.
EXPLANATION
Sand l.'vl Talus Gravel
ciay 1 1 Sedimentary Rock
FTT1 Fluvial Gravel (Z3 Basement Rock
Vertical Exaggeration = 50 Geologic Cross-Section Through the Lower Gila River Valley.
76
50 feet of sand over approximately 50 feet of gravel. Nearly all of the
irrigation return flow wells end in a clay horizon at 100 to 120 feet.
The Tertiary lake bed deposits are mostly clay with intermittent layers
of fine sand and cemented sand. This indicates that most of the flow is
in the higher conductivity upper aquifer.
The peizeometric surface in the WMIDD as of December 1986 is
illustrated in Figure 5. It is based on observations from about 400
peizometers located throughout the district. The shape and location of
the surface is nearly constant year round, with only minor variations in
head over time. Over the length of the WMIDD, the water table elevation
drops from 320 to 150 feet above sea level, with an overall head gradient
of 0.0007 ft/ft. This map, and a U.S. Bureau of Reclamation map of
transmissivities, were used to calculate ground-water flow rates. The
elevated water table lobes on the south side of the district are due to
irrigation on the relatively low transmissivity Wellton Mesa.
Water quality in the WMIDD is poor. TDS ranges from 1560 ppm to
5700 ppm. Figure 6 illustrates the spatial variability of the water
quality. The Stiff diagrams in Figure 6 are based on a USBR chemical
analyses of water samples taken during December 1986. The character of
the water changes in the downgradient direction from a Na*-S0/2 water
upstream to a Na*-Cl" water downstream.
6.1.5.3 Water budget. A water budget calculation was performed to
determine the yearly evapotranspiration from the WMIDD. The flow system
was assumed to be in steady state, so that the change in storage from one
year to the next would be zero. This assumption is valid because there

WELLTON-MOHAWK IRRIGATION AND DRAINAGE E ALTITUDE OF THE WATER TABLE AT THE WMIDD, DECEIV
5 Miles 0
Figure 5. Altitude of the Water Table at the \


[NAGE DISTRICT ), DECEMBER 1986
Altitude is in feet above mean sea level
fable at the WMIDD, December 1986.


WELLTON-MOHAWK IRRIGATION AND DRAINAGE MAJOR ION CHEMISTRY OF GROUND WATER IN TH
i
614
618
617 621
8A 7A
~5E 620 622 ±_ 31A 623
625 615
162
UA 604 624
5 Miles
Figure 6. Major Ion Chemistry of Ground 1


IAINAGE DISTRICT fER IN THE WMIDD
68A 601
66A
dr 614
53B
31A
50ME/L
CI Ca+- -HCO" Mq+2 —so/2
ry of Ground Water in the WMIDD.


79
is very little change in the elevation of the water table over time. The
change in storage in the unsaturated zone is also minor, because the
unsaturated zone is less than 10 feet thick throughout most of the WMIDD,
and because most of the area is irrigated year-round.
The water budget equation used was:
E - P + I + TU + (G, - G0) + (R, - R„) - GP
where E - evapotranspiration
I - irrigation
G| - ground-water inflow
R, = river inflow
GP = ground-water pumpage
P - precipitation
TU — tributary underflow
G0 - ground-water outflow
R„ — river outflow
When the water budget was solved for the 1986 water year the estimated
evapotranspiration was 244,590 acre-feet per year. This is 67% of the
volume of the irrigation water applied. The calculations supporting this
analysis are presented in Appendix A.
6.2 Data Collection
This section begins with a description of how the sampling sites
were chosen, followed by the sampling procedure and a description of the
analytical procedures.

80
6.2.1 Selection of Sampling Locations
Ground-water samples were collected from 23 irrigation return flow
wells and one peizometer within the WMIDD. Samples were collected by the
author, with the assistance of Mr. Jeffrey L. Smith. In addition to
sampling wells throughout the WMIDD, special emphasis was placed on
sampling wells which would represent sources and sinks of ground water.
Towards this end, sampling densities were highest near the upgradient and
downgradient ends of the valley. Samples were also taken along the
northern and southern boundaries of the valley so that any mountain-front
recharge, or recharge from local stream underflow, could be characterized.
Representative samples were taken of the surface water inflows and
outflows to the WMIDD. Irrigation water was sampled from the Wellton
Mohawk Canal. Irrigation return flow samples were taken from the main
drain and the Gila River at the downstream western end of the district.
6.2.2 Sampling Procedures
In preparation for the sampling trip, sample bottles and all
apparati that would come in contact with water samples were washed.
Bottles and apparati were washed with hot soapy water, rinsed repeatedly
with tap water, rinsed with dilute nitric acid, and rinsed repeatedly with
distilled water. Sample bottles were sealed, and apparati were stored in
plastic wrap.
Upon arriving at a well to be sampled, the sampling and testing
equipment was set out, and a data sheet was prepared. Next, the
filtration system was assembled, consisting of a Milli-Q filter built

81
around a Whatman 0.45 micron filter. This was attached to a one-liter
Erlenmeyer flask with a hand-operated pump. A four-gallon Rubbermaid
bucket was rinsed three or four times in the well discharge and filled.
Temperature, pH, and electrical conductivity measurements would be made
on the water in the bucket using a Centigrade thermometer calibrated to
tenths of a degree, pHydron vivid pH paper sensitive to tenths of a pH
unit between pH 6 and 8, and a Cole-Palmer 1482-69 conductivity probe.
The bucket was emptied, rinsed in well discharge, and refilled.
About 200 ml of this water were pumped through the filter system and used
to rinse the inside of the filter apparatus, the one-liter Erlenmeyer
flask, and the 64-oz sample bottle. Water was filtered and decanted into
the 64-oz sample bottle until it was full. The sample bottle label and
the sample data sheet were completed, indicating date, time, well number,
temperature, pH, and electrical conductivity. The entire sampling
procedure took about 15 minutes per well. The procedure for sampling
surface water was identical.
To obtain a Gila River valley underflow sample that was unaffected
by infiltrated irrigation water, it was necessary to sample peizometer
number 062. This is the farthest upgradient access point within the
WMIDD. The sampling procedure was the same as the procedure for sampling
a well, except that the water sample was bailed from the peizometer.
Prior to collecting the sample, the peizometer was bailed 60 times to
replace the stagnant water. This represents about 2.5 well volumes.
82
6.2.3 Determination of the Chloride to Bromide Ratio
Chloride concentrations were determined about one week after
collection. Approximate analyses were made with a Hach digital titrator.
Each sample was then determined in triplicate following the mercuric
nitrate titration procedure D-512-A described in the Annual Book of ASTM
Standards, Part 31 (1981). Using the results of the approximate chloride
determinations, mercuric nitrate solutions were prepared to concentrations
such that titrations would use between 15 to 50 ml of titrant. Restrict
ing the titrant volume to this range increases the accuracy of titrations
(Fernando, 1978).
Bromide was determined by neutron activation analysis using the
procedures outlined in Section 4.6. As mentioned in that section, about
10 micrograms of bromide are required for very accurate analysis. To
estimate the volume of sample to precipitate, a CI/Br ratio of 1000 was
assumed, and a volume to contain sufficient bromide was calculated based
on the measured chloride concentrations. Based on these calculations, it
was decided to use 40 milliliters for the dilute samples and 20 milli
meters for the more concentrated samples.
6.3 Presentation and Interpretation of Results
6.3.1 Distribution of the CI/Br Ratio in the WMIDD
The final CI/Br ratio was calculated by dividing the mean of the
chloride determinations by the mean of the bromide determinations for each
well. The chloride concentration, bromide concentration, and Cl/Br ratios
are presented in Table 7. The bromide concentration in the We11ton-Mohawk
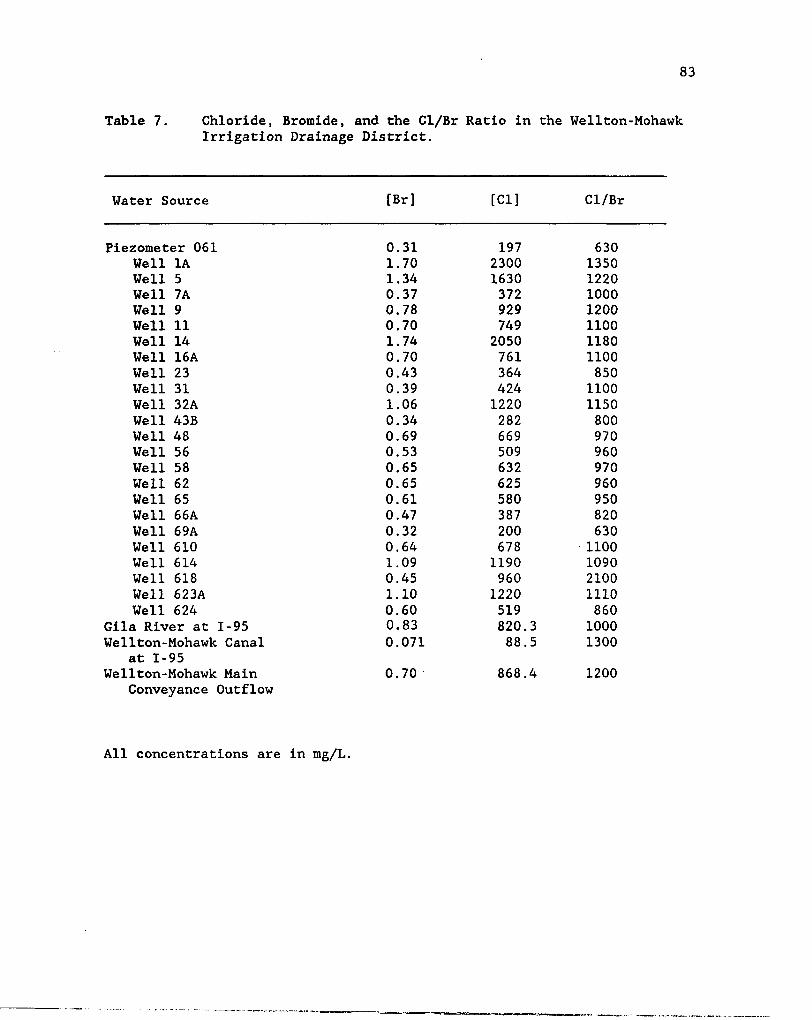
83
Table 7. Chloride, Bromide, and the CI/Br Ratio in the We11ton-Mohawk Irrigation Drainage District.
Water Source [Br] [CI] CI/Br
Piezometer 061 Well 1A Well 5 Well 7 A Well 9 Well 11 Well 14 Well 16A Well 23 Well 31 Well 32A Well 43B Well 48 Well 56 Well 58 Well 62 Well 65 Well 66A Well 69A Well 610 Well 614 Well 618 Well 623A Well 624
Gila River at 1-95 We11ton-Mohawk Canal
at 1-95 We11ton-Mohawk Main
Conveyance Outflow
0.31 1.70 1.34 0.37 0.78 0.70 1.74 0.70 0.43 0.39 1 .06 0.34 0.69 0.53 0.65 0.65 0 . 6 1 0.47 0.32 0.64 1.09 0.45 1.10 0 . 6 0 0.83 0.071
0.70
197 2300 1630 372 929 749 2050 761 364 424 1220
282 669 509 632 625 580 387 200 678 1190 960 1220 519 820.3 88.5
868.4
630 1350 1220 1000 1200 1100 1180 1100 850 1100 1150
800 970 960 970 960 950 820 630 1100 1090 2100 1110 860
1000 1300
1200
All concentrations are in mg/L.

84
aquifer ranged from 0.31 ppm at peizometer 062 to 1.74 ppm at well 14.
Chloride concentrations ranged from 197 ppm at peizometer 062 to 2297 ppm
at well 1A. The CI/Br ratio ranged from 626 at well 69A to 1350 at well
1A.
Irrigation water delivered to the WMIDD has a chloride concentration
of 88.5 ppm, a bromide concentration of 0.071 ppm, and a CI/Br ratio of
1246. The ion concentrations in the irrigation water vary slightly
throughout the year. Irrigation return flow from the downstream end of
the We 11ton-Mohawk main conveyance has a chloride concentration of 868,
a bromide concentration of 0.70, and a CI/Br ratio of 1258. The CI/Br
ratio of this water represents a weighted average of the discharges from
all of the irrigation return flow wells in the district.
There is a strong correlation between the concentrations of chloride
and bromide. The plot of [CI] versus [Br] is shown in Figure 7. The
correlation coefficient is 0.81. There is also a relationship between the
CI/Br ratio and the distance from the upgradient end of the WMIDD. A plot
of CI/Br ratio versus distance from the upgradient edge of the WMIDD
(Figure 8) shows a correlation coefficient of 0.84.
The spatial distribution of the CI/Br ratio is shown in Figure 9.
This map indicates that the CI/Br ratio increases to the north along any
line of latitude, as well as increasing in the downgradient direction.
The outliers in the general east to west increase are a group of low CI/Br
ratio wells (wells 43B, 23, and 624) along the southern edge of the WMIDD,
and one high CI/Br ratio well (well 618) along the northern edge of the

1.80
1.60
1.40 -
1.20 -
CD
£ 1.00 -
-D 0.80 -j
E o m 0.60
0.40 -
0.20 -
0.00
• • •
• •
D n • D
400
Figure 7.
•
•
Cfl
•
• O
! , , 1 800 1200 1600 2000
Chloride in mg/l
[CI] vs. [Br] in Ground Water in the WMIDD.

1.80 -
1.60 -
• []
•
• • •
• • • • •
O •
400 1600 2000 800 1200 Chloride in mg/l
Figure 8. CI/Br Ratio vs. Distance from the Upgradient Edge of the WMIDD.

WELLTON-MOHAWK IRRIGATION AND DRAINAGl [CI], [Br], AND THE CI/Br RATIO OF GROUND WATER IN
1 09 1.200 =
1.100 J
1-34 '1,630 = 1.200
0.37/372 =
1.000
0.43/364 = 847
0.78/929= 1,200
0.70/749 =1,100
0.60 519 = 865
0 5 Miles
Figure 9. [CI], [Br], and the CI/Br Ratio of


tAINAGE DISTRICT ^TER IN THE WMIDD
10732/200 -626
0.65/632- 972 0.61/580=951
0.65/624 = 961 0.47.- 386 =
823
1 09 1,200 =
1.100 j 0.69 669 = 969
1.06/ 1,220= 1,150 0.34/282 = 828
Numerator is [CI] in mg/l Denominator is [Br] in mg/l Quotient is the CI/Br ratio
L/Br Ratio of Ground Water in the WMIDD.


88
district. The low ratio wells are located downgradient from the Gila
tributaries which drain the valleys south of the district.
6.3.2 Interpretation of the CI/Br Ratio Distribution
At the onset of this research, the aim was to trace the mixing of
the Gila River underflow with the Colorado River irrigation water in the
WMIDD. In this section, a theoretical examination will be made to
determine whether the mixing of these two water sources would result in
the observed CI/Br ratio distribution.
To model this system, it is assumed that there are only two sources
of water, chloride and bromide. These are Gila River underflow and
Colorado River irrigation water. Complete mixing is assumed, as is the
condition that the native ground water has been completely replaced. The
first assumption is implicit in the statement of the model. Complete
mixing is a reasonable assumption because the aquifer material is coarse
and because irrigation and pumpage occur throughout the area.
It is probably true that very little native water remains in the
aquifer for two reasons: (1) more than three aquifer volumes of irrigation
water have been pumped through the aquifer since 1954, and (2) irrigation
water moves downward, and the irrigation return flow wells are screened
from about 50 feet to the bottom of the aquifer.
To calculate the theoretical CI/Br ratio, the district is divided
into four cells defined by equal head lines: h - 320-280, h = 280-230, h
— 230-200, and h — 200-150 (see Figure 5). The CI/Br ratio is calculated
by finding the average of the chloride and bromide of the two water
89
sources, weighted by the percent of the water contributed by the two water
sources, i.e., upstream underflow and irrigation recharge, by the
following equation:
C x ~ [ ( C M * V U ) + ( W l / O ^ + V , )
where:
Cx — concentration of ion leaving the cell
Cxu - concentration of the ion in the upstream underflow
Vu — volume of the upstream underflow
Cxlt — concentration of the ion in the recharge
VR — volume of recharge
For the upstream section (320-280), the yearly underflow volume is
based on a Darcy's law calculation, and [CI] and [Br] are based on the
measured values in the upgradient wells. For subsequent cells, the
underflow volume is based on Darcy calculations, and the ion concentra
tions are based on calculated concentrations from the upstream cell. The
volume of irrigation recharge is the product of recharge rate per area
times area. The total yearly recharge for the WMIDD is equal to the
yearly pumpage. This can be assumed because the location of the water
table throughout the WMIDD is nearly constant from year to year. The [CI]
and [Br] of the recharge are found by multiplying the concentrations
measured in the Wellton-Mohawk Canal by the concentration factor of
(366,280 AcFt)/(118,000 AcFt), the ratio of irrigation water applied to

Table 8. Comparison Among the 2-Source and 3-Source Mixing Models and Measured Chemical Concentrations at the We11ton-Mohawk Irrigation and Drainage District.
2-Source Mixing Model [CI] [Br] CI/Br
3-Source Mixing Model [CI] [Br] CI/Br [CI]
Measured Values [Br] CI/Br
Inflow
197 0.31 635 197 0.31 635 197 0.31 635
Cell I
267 0.228 1172 252 0.277 909 624 0.65 961
Cell II
273 0.221 1235 269 0.240 1120 1220 1.06 1150
Cell III
273 0.220 1243 269 0.249 1082 1630 1.34 1200
Outflow
274 0.220 1245 273 0.225 1217 2300 1.70 1350
[CI] and [Br] values are in mg/L.

91
pumped return flow. The concentration factor is corroborated by the
evaporation term calculated with the water budget.
The results of the two-source mixing are shown in Table 8. The
modeled increase in CI/Br ratio from east to west is much more rapid than
the actual increase, but the increase in [CI] and [Br] is not nearly as
great. From these results, it can be concluded that some low CI/Br ratio
salt source is increasing the chloride and bromide concentrations, but
moderating the increase in the CI/Br ratio.
A three-source mixing model was run to better the fit between the
modeled and observed chemistry. This model is essentially the same as the
previous model with the addition of a third inflow, underflow recharged
from the local tributary valleys. These are the San Cristobal and Mohawk
valleys in the southeast, and the smaller intermountain areas in the north
and northwest.
The volume of tributary underflow was determined by Darcy's law to
be approximately 1000 AcFt/yr from the San Cristobal Valley. The San
Cristobal Valley represents roughly one-fourth of the surface area of the
watershed in this section of the Gila River, so the total tributary
underflow can be estimated at 4000 AcFt/yr. This corresponds to a
recharge to rainfall ratio of 1/100, based on an average yearly rainfall
of 3 inches. The [CI] and [Br] of the underflow are assumed to be 100.0
and 1.0 ppm, respectively. This is based on the average rainfall values
for this part of the country (Koglin, 1984) multiplied by the concentra
tion factor of 100 (rainfall/recharge).

92
The flow system was broken into the same four cells used in the two-
source mixing estimation. The tributary underflow was added as four 1000
AcFt slugs entering under Cristobal Wash, Owl Wash, Mohawk Wash, and the
group of small washes draining the western half of the district. The two-
source mixing equation was modified to find the weighted average
concentration based on three sources.
The results of the three-source mixing equation are shown in Table
8. The CI/Br ratio results are fairly close to the measured values. The
"fit" could probably be improved by dividing the flow system into more
cells and locating and distributing the tributary underflows more exactly.
The estimated ion concentrations are much lower than the observed
concentrations, again indicating that there is another salt source.
6.3.3 Interpretation of Chloride and Bromide Concentrations
Both mixing estimations indicated that there is a salt source which
is increasing the halide concentrations in the WMIDD. Possible contrib
utors of salt to the district's ground water are dry deposition of
windblown particles, dissolution of salt from the soil, and agricultural
chemicals. Agricultural chemicals can be eliminated as a source, because
the amount of chloride and bromide applied to the soil in fertilizers,
pesticides, herbicides, and fungicides are orders of magnitude too small
to affect the ground water's salinity.
To aid in determining the origin of the high salinity in the WMIDD,
a salt budget was calculated. The calculations which support the chloride
and bromide budgets are presented in Appendix B. By calculating the

93
amount of excess chloride and bromide entering the flow system, the
sources of CI/Br ratio can be determined. The most basic statement of the
salt budget is:
(Salt In) - (Salt Out) - Change in Stored Salt
The salt budget for the WMIDD can be calculated by using the same water
inflows used in the water budget and multiplying the volumes by the
chloride concentration and bromide concentration of each inflow and
outflow to find the kilograms fluxes for the two ions.
The calculated chloride and bromide budgets indicate that approx
imately 200,000,000 pounds of chloride and 2,000,000 pounds of bromide are
lost by the WMIDD per year. Table 9 lists the chloride and bromide budget
values for the WMIDD. This indicates that there are halides leaving the
WMIDD by dissolution of salts from the WMIDD's soils or aquifer. The CI/Br
ratio of the source of this salt is approximately 1,100.
The most likely source of the excess chloride and bromide is
dissolution of salts from the agricultural soils and from the aquifer
itself. Saline soils are common in the WMIDD. To determine whether it
is reasonable to have nearly 200 million pounds of chloride leached from
the WMIDD per year, calculations were made to determine if this represents
a significant percent of the aquifer and soil area.
The chloride loss was converted to a volume of NaCl by converting
first to a weight of NaCl represented by the weight of lost chloride, and
then converting to a volume of NaCl, based on the weight and density of

Table 9. Chloride and Bromide Budget Values for the Wellton-Mohawk Irrigation and Drainage District, 1986 Water Year.
Variable Volume Weight CI (ft of water)(lb. of water) (mg/L)
Br Weight of (mg/L) Chloride
Weight of Bromide
Precipitation
Irrigation
Tributary Underflow
Groundwater Inflow
Groundwater Outflow
Gila River Inflow
Gila River Outflow
Ground-water Pumpage
6.99x10'
1.59x10'°
1.74x10"
1.08x10"
4.55xl07
3.78x10*
5.14xl09
4.36x10'°
9.92x10"
1.09x10'°
6.74x10'
2.84x10"
0
2.36x10'°
3.21x10"
1.7
88.5
100.0
192.0
2300.0
820.0
871.0
0.017 4.36xl04
0.071 8.78xl07
1.0 1.09x10®
0.31 1.29xl06
1.71 6.53x10s
0.83 1.93xl07
0.80 2.79x10s
436
7.04xl04
1.09xl04
2.OlxlO3
4.83x10'
1.96xl04
2.57x10s
Evaporation 1.14x10' 7.11x10"

95
the compound. The calculations to support this discussion are presented
in Appendix B.
The calculations presented in Appendix B indicate that the change
in salt storage represents only about 0.1% of the aquifer volume, so it
is not an unreasonable rate of leaching.
Another possible explanation for the chloride and bromide discrep
ancy is that there is a salt inflow that has been overlooked. Dry
deposition of wind-blown salt particles may contribute some salt to this
arid region. Sources of the particles could be the salt flats and salty
marshes of the Salton Sea or the Santa Clara Slough in Sonora, Mexico.
It is also possible that the assumption that all the native water
has been replaced by pumpage is not valid. The ground water had become
quite salty prior to the introduction of Colorado River irrigation water.
Each of these sources could account for the increased salinity of
the ground water in the downgradient direction. A CI/Br ratio of
approximately 1,100 is indicative of a mixed source. It is not high
enough to represent an evaporite deposit, but it is too high to represent
native ground water or a meteoric source. The volume of salt added to the
system and the mixed ratio indicated that most of the salt is probably
dissolving from the soils and aquifer, with minor contributions from
native water and dry deposition.

96
CHAPTER 7
SUMMARY AND CONCLUSIONS
The purpose of this thesis was to examine the utility of the CI/Br
as an environmental ground-water tracer, with emphasis on its applicabil
ity to an environmental setting. The method of analysis was: (1) to
compile a list of the characteristics of the ideal environmental ground
water tracer, (2) to determine through a literature search which of those
characteristics the CI/Br ratio has, which it does not, and which need
further investigation, (3) to perform laboratory studies on the charac
teristics which needed further investigation, (4) to use the CI/Br ratio
as an environmental ground-water tracer in the We11ton-Mohawk Irrigation
and Drainage District.
7.1 Summary
The list of characteristics of the ideal environmental ground-water
tracer was compliled by modifying the list af characteristics of the ideal
artificial tracer (Davis et al., 1980). It was determinaed that the ideal
environmental ground-water tracer: is easily detected at environmental
levels, is niether filtered nor sorbed by the medium through which the
water passes, is is not added to the water by dissolution of the solid
medium, is chemically stable for the desired length of time, is present
in sufficiently different concentrations in waters from different sources.
Laboratory studies of six methods of analysis have shown that IC is
the most rapid, and most accurate method for determining bromide
concentrations at environmental levels. NAA is more time consuming, but

97
it also yields accurate results. NAA has the advantage over IC in that
it can be used to analyze for environmental levels of bromide in the
presence of high chloride concentrations.
Laboratory investigations by this author and Elizabeth Behl have
shown that bromide is absorbed by organic matter and soils to a negligible
degree. Chloride is known to be conservative. These two findings
indicate that the CL/Br ratio will not be changed due to filtration or
sorption on solid media.
The CI/Br ratio is chemically stable. It was found that the CI/Br
ratio varies between various water sources in Arizona. The only
characteristic of the CI/Br ratio that is not ideal is that it could be
added to ground water by the dissolution of aquifer material. This
negative characteristic may actually be helpful in some circumstances if
the CI/Br ratio is being used to infer the source of a waters salinity.
The CI/Br ratio was found to have an additional positive charac
teristic. A laboratory study showed that the CI/Br ratio does not change
in an evaporating pan of water. This is an important characteristic for
tracing irrigation water in an arid region. It is important in that it
indicates that the CI/Br ratio of infiltrated irrigation water will be
equal to the CI/Br ratio of the original irrigation water, even if there
is significant evaporation of the irrigation water prior to and during
infiltration.
A study of the CI/Br ratio of surface and ground water in the
We11ton-Mohawk Irrigation and Drainage District has shown the CI/Br's
usefulness for tracing ground-water movement in an agricultural setting.

98
It was found that the mixing of Gila River underflow (CI/Br s 630) with
the infiltrating irrigation water (CI/Br = 1250) could be traced, but that
there is at least one other salt source within the irrigation district.
7.2 Conclusions
(1) Ion Chromatography is the best method for determining
the bromide concentration in most natural waters.
Neutron Activation Analysis must be used to analyze for
bromide in very dilute natural waters, of where the
CI/Br ratio approaches 1000.
(2) The CI/Br ratio of a water source remains constant with
evaporation, and is not sorbed by desert soils. This
makes it an excellent environmental tracer for infil
trating imported water in an arid region.
(3) The increase in the CI/Br ratio in the downgradient
direction in the Wellton-Mohawk Irrigation and Drainage
District is due to the high CI/Br ratio in the irriga
tion water, and to dissolution of salt from the aquifer
material or soil of the region.
(4) Although the Wellton-Mohawk Irrigation and Drainage
District has been irrigated with Colorado River water
since 1952, dissolution os salts is still occurring.
The dissolution of salts is responsible for the poor
quality of the irrigation return flow.
(5) Agricultural chemicals applied within the Wellton-Mohawk
Irrigation and Drainage District do not affect the CI/Br
ratio of ground water or irrigation return flow.
(6) It has been demonstrated that the CI/Br ratio can be
used to trace the mixing of water imported by interbasin
transfer with native ground water. As Central Arizona
Project water is used, there will be opportunities to
use the CI/Br ratio to trace its mixing with native
water in the delivery areas.

APPENDIX A
WATER BUDGET CALCULATION FOR THE 1986 WATER YEAR FOR THE WELLTON-MOHAWK IRRIGATION AND DRAINAGE DISTRICT

101
APPENDIX A
WATER BUDGET CALCULATIONS FOR THE WELLTON-MOHAWK IRRIGATION AND
DRAINAGE DISTRICT, 1986 WATER YEAR
A water budget equation was solved to to determine the yearly
evaporation and recharge for the We11ton-Mohawk Irrigation and Drainage
District for the 1986 water year. A water budget equation is an algebraic
expression which equates all the water inflows to a system with all the
water outflows to a system. The system considered for this analysis was
the surface water within the irrigation district and the ground water in
the alluvial aquifer below the irrigation district.
The form of the water budget equation used was:
E - P + I 4- TU + (G, - G0) + (R, - R,,) - GP
where:
E - evapotranspiration;
P = precipitation;
I - irrigation;
TU - tributary underflow;
G, - ground-water inflow;
G0 = ground-water outflow;
R, - river inflow;
Ro -= river outflow; and
GP - ground-water pumpage.

102
This appendix presents the sources of information and calculations
for the above-mentioned terms. The solution to the water budget equation
for the 1986 water year is also presented. The following paragraphs
describe the above-mentioned terms.
P, precipitation
Precipitation was calculated by multiplying p, the yearly precipita
tion at the Wellton-Mohawk Irrigation and Drainage District (Arizona
Climate, 1987), by A, the area of the irrigation district (WMIDD, 1986).
P - pA
- .251ft 2.79 x 10" ft3
- 6.99 x 10' ft3
- 1.6 x 10⁴ AcFt/yr
I, irrigation
The volume of irrigation water applied to the Wellton-Mohawk
Irrigation and Drainage District during the 1986 water year was 366,280
AcFt (WMIDD, 1987).
TU, tributary underflow
Tributary underflow is the ground water that flows into the alluvial
aquifer below the Wellton-Mohawk Irrigation District beneath washes that
flow into the irrigation district.

103
Tributary underflow was calculated by multiplying p, the yearly
precipitation, by A the area of the contributing watersheds (not including
the area of the We 11 ton-Mohawk Irrigation and Drainage District), by f,
an infiltration factor. The infiltration fractor was 0.01, based on the
estimate that about 1% of the local rainfall recharges to the aquifer.
TU - p A f
- .251 ft 6.94 x 10'° ft2 0.01
- 1.74 x 10' ft3
= 4,000 AcFt
G,, ground-water inflow
Ground-water inflow was calculated using Darcy's law. Transmis-
sivity (T) values were based upon a U.S. Bureau of Reclamation map of
transmissivities in the We11ton-Mohawk Irrigation and Drainage District
(USBR, 1985). The width of the aquifer (w) and the hydraulic gradient
(dh/dl) were measured on a water table elevation map for December 1986.
(WMIDD Water Level Map, 12/86).
G, - Tw dh/dl
- 33,420 ft2/day • 365 days/yr • 13,200 ft • 10 ft/14,900 ft
= 1.08 x 10" ft3 yr
- 2,480 AcFt/yr

104
G0, ground-water outflow
Ground-water outflow was measured using the same equation and data
sources as G,.
G0 - Tw dh/dl
- 26,730 ft2/day 365 days/yr 7,390 ft 10 ft/15,840 ft
- 4 . 55 x 107 ft3/yr
= 1,050 AcFt/yr
R,, river inflow
There is no river inflow into the Wellton-Mohawk Irrigation and
Drainage district during most years. During 1986, there was no river
inflow, so R, — 0.
Ro, river outflow
River outflow is calculated by multiplying an estimate of the
instantaneous river discharge (Q), by time. The estimate of Q is based
upon periodic stream gaging performed at the Wellton-Mohawk Irrigation and
Drainage District (Slokum, 1986).
Ro - Q- t
- 12 ft3/sec 86,400 sec/day 365 days/yr
- 3.78 x 10" ft3/yr
- 8,690 AcFt/yr

105
GP, ground-water pumpage
Ground-water pumpage was 118,000 AcFt for the 1986 water year
(WMIDD, 1987).
Substitution of the measured and calculated values into the water
budget equation yields:
E - P + I + TU + (G, - G0) + (R, - RJ - Gp
- (16,050) + (366,280) + (4,000) + (2,480 - 1,050)
+ (0 - 8,690) - (118,000) - 261,000 AcFt/yr
This represents approximately 71% of the irrigation water applied
to the We11ton-Mohawk Irrigation and Drainage District during the 1986
water year. This agrees very closely with estimates made using other
methods (Wilson, 1987).
If we assume that the ground-water system is in steady state (water
level changes are small from one year to the next), then the recharge to
ground water is equal to the yearly ground-water pumpage. This is true
because the yearly pumpage is set to remove recharge, and thus keeps the
water table at the same level from one year to the next. This indicates
that yearly recharge for the 1986 water yeas was 118,000 AcFt. This
represents approximately 32% of the irrigation water applied during the
1986 water year.

APPENDIX B
BROMIDE AND CHLORIDE BUDGET CALCULATIONS FOR THE 1986 WATER YEAR FOR THE
WELLTON-MOHAWK IRRIGATION AND DRAINAGE DISTRICT

107
APPENDIX B
BROMIDE AND CHLORIDE BUDGET CALCULATIONS FOR THE WELLTON-MOHAWK IRRIGATION
AND DRAINAGE DISTRICT, 1986 WATER YEAR
Bromide and chloride budgets were calculated for the Wellton-Mohawk
Irrigation and Drainage District for the 1986 water year. They were
calculated to determine the yearly change in chloride and bromide storage.
This information can be used to determine if chloride and bromide are
leaching from the system, and if so at what rate. The ratio of CI/Br lost
from the system could be a clue to the salinity of the return flow leaving
the system, and contributing the salinity problem of the lower Colorado
River.
The chloride and bromide budgets were calculated separately using
the equation:
AS = PCP + IC, + TUCtu + (G,Ccl - GQCcq +
(R|Gri • ROCro) • GPCcp - ECe
AS is the change in storage in either chloride or bromide. The variables
P, I, TU, G,, G0, R,, Rq, GP, and E have the same meaning as defined in
Appendix A. Each of the water quantity terms is followed by a chemical
concentration term (C) . C represents the chemical concentration (in mg/L)
of either chloride or bromide, depending on which budget is being
calculated.

108
In this appendix, the sources of information and calculation methods
for the C terms are described, and the bromide and chloride budgets are
solved for the 1986 water year.
The change in storage (in pounds) was calculated for both chloride
and bromide. Each term was converted to a weight in pounds by first
multiplying the volume of water by the specific gravity of water. This
product was multiplied by the appropriate halide concentration in mg/L or
ppm and then divided by 106 to yield a weight in pounds of halide.
The following paragraphs describe the methods for estimating the
chloride and bromide concentrations for the various sources. The water
volume, water weight, [CI] , [Br], weight of chloride and weight of bromide
for each term are presented in Table 9.
PC„. weipht of halide deposited by precipitation. P was determined
to be 6.99 x 10" ft3 (see Appendix A). Cp, the concentration of chloride
and bromide in precipitation was estimated to be equal to the chloride and
bromide concentrations in precipitation falling on Tucson, Arizona,
described in Koglin (1984). This is the closest location for which [CI]
and [Br] are available for rainfall. Tucson is also located in a
geographic region which is similar to the study area. The [CI] and [Br]
found by Koglin are 1.7 and 0.017, respectively.
IC.. weight of halide imported with irrigation water. I was 1.59
x 10'° ft3 (see Appendix A). C,, the [CI] and [Br] in the irrigation water
was 88.5 and 0.071 mg/L, respectively. [CI] was measured using mercuri-
metric titration, and [Br] was measured using neutron activation analysis.

109
The chemical concentrations were measured in water collected from the
Wellton Canal upgradient from the irrigation district.
TUCt... weight of halide advected into the We 11 ton-Mohawk Irrigation
and Drainage District with tributary underflow. TU was estimated at 1.74
x 10® ft3, or 1% of the yearly precipitation falling on the contributing
watershed. As with precipitation falling on the Wellton-Mohawk Irrigation
and Drainage District, it was assumed that the [CI] and [Br] are similar
to the concentrations in Tucson precipitation. Since bromide and chloride
are conservative, and 1% of the rainfall recharges to the water table, it
was assumed that the recharge would be 100 times more concentrated than
the precipitation.
G.C,-.. weight of halide advected into the Wellton-Mohawk Irrigation
and Drainage District with ground water. G, was estimated to be 1.08 x
10" ft3. [Cl] and [Br] were measured on a water sample from piezometer
61 upgradient from the Wellton-Mohawk Irrigation and Drainage District.
The [Cl] and [Br] concentrations were 192 and 0.31, respectively.
G„C™. weight of halide advected out of the Wellton-Mohawk Irrigation
and Drainage District with ground water. G0 was calculated to be 4.55 x
107 ft3. [Cl] and [Br] were measured on a water sample from irrigation
return flow well 1A, on the downgradient edge of the irrigation district.
The [Cl] and [Br] were 2300 and 1.70, respectively.
R.C„,. weight of halide advected into Wellton-Mohawk Irrigation and
Drainage District with flow in the Gila River. There is no flow into the
study area in the Gila River, so R,Cri - 0 for both chloride and bromide.

110
weight of halide advected out of the We 11 ton-Mohawk Irrigation
and Drainage District with flow in the Gila River. R„ was calculated to
be 3.78 x 10* ft3. The [CI] and [Br] were measured on a sample of Gila
River water collected at the intersection of the river with the western,
downgradient border of the study area. The [CI] and [Br] were 820 and
0.83, respectively.
GpC^p. weight of halide pumped from the alluvial aquifer below the
We11ton-Mohawk Irrigation and Drainage District. Approximately 5.14 x
109 ft3 of irrigation return flow was pumped from the We 11 ton-Mohawk
Irrigation and Drainage District during the 1986 water year. The actual
concentrations of chloride and bromide in this water would be a weighted
average reflecting the volume pumped from each well and the chemical
concentrations in the water from each well. Neither of these data sets
is available.
A water sample was collected from the Wellton-Mohawk main drainage
conveyance which carries return flow from the study area. The sample was
collected from the intersection of the conveyance and the western,
downgradient edge of the study area. The sample was collected at a time
when nearly all of the return flow wells were in operation. The sample
is a fairly good weighted average because all the wells were contributing,
and the sample location assured that the water in the conveyance was
mixed. The [CI] and [Br] were 871 and 0.80, respectively.
ECc. halide advected out of the Wellton-Mohawk Irrigation And
Drainage District with evaporation. Experiments performed as part of this
research have shown that an evaporating body of water does not lose

I l l
chloride or bromide to the atmosphere. It is assumed that ECe - 0 for
both chloride and bromide.
All of the measured and calculated values which are used in the
chloride and bromide budgets are shown in Table 9. Substitution of the
values into the chloride and bromide budgets yields:
•'
ASCI - -2.15 x 10' lb/yr
ASBr - -1.97 x 10s lb/yr
This indicates that nearly 200,000,000 pounds of chloride and 200,000
pounds of bromide are leached from the We11ton-Mohawk Irrigation and
Drainage District per year. The CI/Br ratio of the source of the leaching
halides is:
CI/Br - AScl/ASBr
- 2.15 x 10s/1.97 x 105
- 1091
To determine if the AS weights are reasonable, the weight of leached
halides was converted into an equivalent salt volume. This equivalent
salt volume was then compared to the total aquifer volume to determine
what percent of the aquifer the leaching salts represents.
If the leaching salt source is assumed to be NaCl, the yearly
leached salt would occupy 2.63 x 106 ft3, based on the equation:

112
P
where:
Vs- volume of salt leached;
ASC, - weight of salt leached;
( —) - ratio of molecule weight of NaCl to the atomic weight of CI; m
p - density of NaCl.
Substitution yields:
V- (2.15 *10' lb) (fftfjj ( w.n\b/it>)
- 2.63 x 106 ft3
A rough estimate was made of the volume of the alluvial aquifer
below the We11ton-Mohawk Irrigation and Drainage District using the
equation:
VA - L x W x D
where L, W, and D represent the length, width, and depth of the aquifer;
and VA equals the volume of the aquifer.
Substitution yields:

113
VA - L x W x D
r r n t i 5280 ft. .. .. 5280 ft. . A - (40 miles x mjje ) (3 miles x ^
- 1.34 x 10" ft3
If we divide Vs by V K , we see that the volume of salt leached on a yearly
basis represents approximately 0.002 % of the volume of the aquifer. This
is not an unreasonably large percentage of the aquifer to leach on a
yearly basis.

114
LIST OF REFERENCES
Anonymous, 1982, Handbook of Electrode Technology. Orion Research Corporation.
Arimoto, R.A., R.A. Duce, B.J. Ray, and C.K. Unni, 1985, Atmospheric trace elements at Enewetak Atoll: 2. Transport to the ocean by wet and dry deposition,
Babcock, H.M., 1948, We 11ton-Mohawk Area, Yuma County, Arizona: Records of wells, well logs, water analysis, and maps showing location of wells. U.S. Geological Survey unpublished report, 40 p.
Babcock, H.M., S.C. Brown, and J.D. Hera, 1947, Geolopv and Ground-Water Resources of the Wellton-Mohawk Area. Yuma County, Arizona, U.S. Department of the Interior, Geological Survey.
Barmore, R.L., 1978, Soil Survey of Yuma-Wellton Area. U.S. Department of Agriculture Soil Conservation Service, 104 p., 100 illustrations.
Basel, C.L., J.D. DeFreese, and D.D. Whittemore, 1982, Interferences in automated phenol-red method for determination of bromide in water. Analytical Chemistry, v. 54, pp. 2090-2094.
Behl, E., 1987, Personal communication.
Block, M.R., D. Kaplan, V. Kertes, and J. Schnerb, 1966, Ion separation in bursting air bubbles: An explanation for the irregular ion ratios in atmospheric precipitation, Nature, v. 209, pp. 802-803.
Bowen, H.J.M., 1979, Chemistry of the Elements. Academic Press, New York, New York.
Chao, T.T., 1966, Effect of nitrogen forms on the absorption of bromide by sorghum. Agronomy Journal, v. 58, pp. 595-596.
Correns, C.W., 1956, The geochemistry of the halogens. In: Physics and Chemistry of the Earth. Ahrens, L.H., K. Rankama, and S. K. Runcorn, editors, New York, McGraw-Hill, 317 p.
Davis, S.N., 1987, Personal communication.
Davis, S.N., G.M. Thompson, H.W. Bentley, and G. Stiles, 1980, Groundwater Tracers--A Short Review, Ground Water, v. 18, no. 1, pp. 14-23.
Duce, R.A. , J.W. Winchester, and T.W. VanNahl, 1965, Iodine, bromine, and chlorine in the Hawaiian marine atmosphere, Journal of Geophysical Research, v. 70, pp. 1775-1799.

115
LIST OF REFERENCES--Continued
Duce, R.A., J.T. Wassen, J.W. Winchester, and F. Burns, 1963, Atmospheric iodine, bromine, and chlorine, Journal of Geophysical Research, v. 68, pp. 3943-3957.
Elders, W.A., and L.H. Cohen, 1983, The Salton Sea geothermal field, California as a natural analog of a radioactive waste repository in salt: Battelle Memorial Institute, ONWI Publication BMI/ONWI-513, 146 p.
Fabryka-Martin, J.T., 1984, Natural Iodine-129 as a Ground-water Tracer, M.S. Thesis, Dept. of Hydrology and Water Resources, University of Arizona, Tucson, Arizona.
Farmer, J.G., and J.D. Cross, 1978, Bromine in soil an indicator of automobile lead pollution? Water, Air, and Soil Pollution, v. 9, pp. 193-198.
Fernando, Q., and M.D. Ryan, 1982, Calculations in Analytical Chemistry. New York, Harcourt Brace Jovanivich, 241 p.
Fitzpatrick, K. , and W.T. Frankenberger, 1985, Single column chromatography. I. Analysis of inorganic anions in soil, Soil Science Society of America Journal, v. 49, pp. 587-592.
Fontes, J.C., 1980, Environmental isotopes in groundwater hydrology. In: Handbook of Environmental Isotope Geochemistry. P. Fritz and J.C. Fontes, editors, Elsevier Publishing Company,
Frape, S.K., and P. Fritz, 1984, Water-rock interaction and chemistry of groundwaters from the Canadian Shield, Geochimica et Cosmochimica Acta, v. 48, pp. 1617-1627.
Freeze, R.A., and J.A. Cherry, 1979, Groundwater. Englewood Cliffs, New Jersey, Prentice-Hall, 604 p.
Heath, R.L., 1971, Table of Isotopes, In: Handbook of Physics and Chemistry. R.C. Weast, editor, Chemical Rubber Company, Cleveland, Ohio.
Heckenberg, A.L., and P.R. Haddad, 1984, Determination of inorganic anions at parts per billion levels using single-column ion chromatography without sample preconcentrations. Journal of Chromatography, v. 299, pp. 301-305.
Hem, J.D., 1970, Study and Interpretation of the Chemical Characteristics of Natural Water, U.S. Geological Survey Water-Supply Paper 1473.

LIST OF REFERENCES --Continued
Holser, W.T., 1979, Mineralogy of Evaporites, in R. Burns, ed. , Marine Minerals: Mineralogical Society of America, Short Course Notes, v. 6, pp. 211-294.
Jackson, D. , and W.H. Lloyd, 1984, An integrated hydrochemical approach to deduce the response of an aquifer system during its history of abstraction, Ground Water, v. 22, no. 6, pp. 735-745.
Jenke, D.R., and G.K. Pagenkopf, 1984, Optimization of anion separation by nonsuppressed ion chromatography, Analytical Chemistry, v. 56, pp. 85-88.
Jenkins, R., R.W. Gould, and D. Gedcke, 1981, Quantitative X-Rav Spectrometry. Marcel Dekker, Inc., New York.
Jordan, J.K. Frohlich, and D. Hebert, 1983, Use of isotope methods in hydrogeology, Water Resources Research, v. 10, no. 3, pp. 279-284.
Krasintseva, V.V., 1964, Geochemistry of Chlorine and Bromine, Geochemistry International, v. 1, pp. 78-82.
Klein, D.A., A.W. Andren, J.A. Carter, J.F. Emery, C. Feldman, W. Fulkerson, W.S. Lyon, J.C. Ogle, Y. Talmi, R.I. Van Hook, and N. Bolton, 1975, Pathways of Thirty-seven Trace Elements Through Coal-Fired Power Plants, Environmental Science and Technology, v. 9, no. 10, pp. 973-979.
Koglin, E.N., 1984, Bromide as an environmental tracer in ground water of the Tucson Basin, Arizona, M.S. Thesis, Dept. of Hydrology and Water Resources, University of Arizona, Tucson, Arizona.
Komabayasi, M., 1962, Enrichment of inorganic ions with increasing atomic weight in aerosols, rainwater, and snow in comparison with seawater, Journal of the Meteorological Society of Japan, v. 40, no. 1, pp. 25-38.
Konikow, L.F., and J.D. Bredehoeft, 1974, Modeling flow and chemical quality changes in an irrigated stream-aquifer system, Water Resources Research, v. 10, no. 3, pp. 546-562.
Lag, J., and E. Steinnes, 1976, Regional distribution of halogens in Norwegian forest soils, Geoderma, v. 16, pp. 317-325.
Lininger, R.L., R.A. Duce, J.W. Winchester, and W.R. Matson, 1966, Chlorine, bromine, iodine, and lead in aerosols from Cambridge, Massachusetts, Journal of Geophysical Research, v. 71, no. 10, pp. 2457-2463.

117
LIST OF REFERENCES--Continued
Lundstrom, U., A. Oline, and F. Nydahl, 1984, Determination of low levels of bromide in fresh water after chromatographic enrichment, Talanta, v. 31, no. 1, pp. 45-48.
Maw, G.A., and R.J. Kempton, 1982, Bromide in soils and peats, Plant and Soil, v. 65, pp. 103-109.
Method D-1247-77, Annual Book of ASTM Standards. Part 31, Water, Philadelphia, American Society for Testing and Materials, pp. 617-620.
Method D-512-A, Annual Book of ASTM Standards. Part 31, Water, Philadelphia, American Society for Testing and Materials, pp. 355-358.
Minich, M., 1987, Personal communication.
Morris, A.W., and J.P. Riley, 1966, The bromide/chlorinity and sul-fate/chlorinity ratio of seawater, Deep-Sea Research, v. 13, pp. 699-705.
Moser, T.H., 1966, Pumped drainage in the We11ton-Mohawk District, Unpublished proceedings of the ASCE Water Resources Conference, May 16-20, 1966, pp. 1-10.
Nazer, T.K., A.B. Hallak, W.I. Abu-Gharbieh, and N.S. Saleh, 1982, Bromide residues in the soil and fruits of certain crops after soil fumigation with methyl bromide, Journal of Radioanalytical Chemistry, v. 74, no. 1, pp. 113-116.
Onken, A.B., R.S. Hargrove, C.W. Endt, and O.C. Wilke, 1975, The use of a specific ion electrode for determination of bromine in soils, Soil Society of America Proceedings, v. 39, pp. 1223-1225.
Onken, A.B., C.W. Wendt, R.S. Hargrove, and O.C. Wilke, 1977, Relative movement of bromide and nitrate in soils under three irrigation systems, Soil Society of America Journal, v. 4, pp. 50-52.
Pauling, L. , 1970, General Chemistry. W.H. Freeman and Company, San Francisco, California.
Payne, B.R., 1972, Isotope Hydrology, In: Advances in Hvdroscience. V.T. Chao, editor, v. 8, pp. 95-138.
Petrucci, R.H., 1982, General Chemistry. New York, Macmillan Publishing Company, 764 p.
Press, F. , and R. Seaver, 1978, Earth. W.H. Freeman and Company, San Francisco, California, 649 p.

118
LIST OF REFERENCES- -Continued
Rahn, K.A., R.D. Borys, and R.A. Duce, 1976, Tropospheric halogen gases: inorganic and organic components, Science, v. 192, pp. 549-550.
Rav-Acha, C., E. Chashen, A. Serri, and B. Limoni, 1985, The role of formation and reduction of THM and chlorite concentrations in the disinfection of water with C12 and C102, Environmental Pollution (Series B), v. 10, pp. 47-60.
Richter, B.C., and C.W. Kreitler, 1986, Geochemistry of Salt Water Beneath the Rolling Plains, North-Central Texas, Ground Water, v. 24, no. 6, pp. 735-742.
Roughan, J.A., and P.A. Roughan, 1984, Pesticide residues in foodstuffs in England and Wales, Part I: Inorganic bromide ion in lettuce grown in soil fumigated with bromomethane, Pesticide Science, v. 15, pp. 431-438.
Semra, G. , G. Tuncel, I. Olmez, J.R. Parrington, G.E. Gordon, 1985, Composition of fine particles in the regional sulfate component in Shenandoah Valley, Environmental Science and Technology, v. 19, pp. 529-537.
Serlin, C.L., 1984, Chemical stability and adsorption of anionic tracers in an acid environment, Unpublished Master's Thesis, University of Arizona, Tucson, Arizona.
Seto, Y-B., R.A. Duce, and A.H. Woodcock, 1969, Sodium-to-chloride ratio in Hawaiian rains as a function of distance inland and elevation, Journal of Geophysical Research, v. 74, no. 4, pp. 1101-1103.
Sklash, M.G., R.N. Farvolden, and P. Fritz, 1976, A conceptual model of watershed responses to rainfall, developed through the use of oxygen-18 as a natural tracer, Canadian Journal of Earth Science, v. 13, pp. 271-283.
Smith, S.J., and R. J. Davis, 1974, Relative movement of bromide and nitrate through soils, Journal of Environmental Quality, v. 3, no. 2, pp. 152-156.
Stetzenbach, K.J., and G.M. Thompson, 1983, A new method for simultaneous measurement of chloride, bromide, nitrate, cyanate, and iodide at sub-ppm levels in ground water, Ground Water, v. 21, no. 1, pp. 36-41.
Straub, C.P. 1964, Low-level radioactive wastes: their handling, treatment, and disposal, U.S. Atomic Energy Commission.
119
LIST OF REFERENCES --Continued
Sturges, W.T., R.T. Harrison, and R. Dams, 1985, Development of a technique for the determination of lead and bromine in atmospheric particles by X-ray fluorescence, Atm. Env. , v. 19, no. 9, pp. 1495-1502.
Sugawara, K. , and N. Kawasaki, 1958, Separation of Ions by Syn-Bubble Breaking Fractionation, Records of Oceanographic Works in Japan, no. 2, p. 227.
Tennyson, L.C., and C.D. Sedergren, 1980, Percolate water and bromide movement in the root zone of effluent irrigation sites, Water Resources Bulletin, v. 16, no. 3, pp. 433-437.
Thurston, G.D., and J.D. Spengler, 1985, A Quantitative Assessment of Source Contributions to Inhalable Particulate Matter Pollution in Metropolitan Boston, Atmospheric Environment, v. 19, no. 1, pp. 9-24.
Tiffany, M.A., J.W. Winchester, and R.H. Loucks, 1969, Natural and pollution sources of iodine, bromine, and chlorine in the Great Lakes, Journal of Water Pollution Control Federation, v. 41, no. 7, pp. 1319-1329.
Vinogradov, A.P., 1959, The geochemistry of rare and dispersed chemical elements in soils. New York Consultants Bureau, Inc.
Volyashko, M.G., 1956, Geochemistry of bromide in the process of salt deposition and the use of bromide content as a genetic and prospecting criterion, Geochemistry, v. 570, pp. 570-589.
Wellton-Mohawk Irrigation and Drainage District, 1986, Monthly water distribution report, Wellton-Mohawk Irrigation and Drainage District internal memorandum.
Wellton-Mohawk Irrigation and Drainage District--a short history and discusison, Wellton-Mohawk Irrigation and Drainage District information pamphlet, no date available.
Whittemore, D.O., and L.M. Pollack, 1979, Determination of salinity sources in water resources in Kansas by minor alkali metal and halide chemistry, Kansas Water Resources Research Institute, Contribution 208.
Wilgus, S.K., and W.T. Holser, 1984, Marine and nonmarine salts of western interior, United States, The American Association of Petroleum Geologists Bulletin, v. 68, no. 6, pp. 765-767.

120
LIST OF REFERENCES--Continued
Wilkins, C. , 1978, The distribution of bromine in the soil and herbage of North-West Pembrokeshire, Journal of the Agricultural Society of Cambridge, v. 90, pp. 109-115.
Williams, H.H., and R.C. Harris, 1970, Chloride and bromide in carbonate rocks in relation to the chemical history of ocean water, Canadian Journal of Earth Science, v. 7, pp. 1539-1547.
Wilson, E.D., 1933, Geology and Mineral Deposits of Southern Yuma County, Arizona, Arizona Bureau of Mines, Geological Serial No. 7, Bulletin 134.
Yamada, Y. , 1968, Occurrence of bromide in plants and soil, Talanta, v. 15, pp. 1135-1141.
famamcto, T., Y. Otsuka, K. Aoyama, and K. Okamoto, 1984, Character of each element on its distribution in seaweeds, Hydrobiologia, v. 116/117, pp. 510-512.
Yuita, K. , Y. Nobusawa, M. Shibuya, and S. Aso, 1982, Iodine, Bromine, Chlorine Contents in Soils and Plants of Japan, Soil Sci. Plant Nutr., v. 28, no. 3, pp. 315-336.