Information Technology Powering Cancer Research for ... 2017... · Information Technology Powering...
36
Information Technology Powering Cancer Research for Discover and Novel Hypothesis Generation -- Pathomics Joel Saltz Department of Biomedical Informatics Stony Brook University Feb 2017 BHI
Transcript of Information Technology Powering Cancer Research for ... 2017... · Information Technology Powering...

Information Technology Powering Cancer Research for Discover and Novel
Hypothesis Generation -- Pathomics
Joel SaltzDepartment of Biomedical Informatics
Stony Brook University
Feb 2017BHI

• Pathology data is employed in care guidelines and clinical settings for virtually all cancer disease sites.
• Treatment decisions frequently hinge on subjective assessments -- poor inter-observer reproducibility.
• Widespread clinical adoption of Digital Pathology platforms in coming years
• Combination of Digital Pathology platforms and maturing of machine learning and artificial intelligence methodology will make possible adoption of image data driven decision support systems.
• Development and adoption of such systems will have tremendous impact on improving quality and consistency of clinical decision making.
Thesis

Tools to Analyze Morphology and Spatially Mapped Molecular Data - U24 CA180924
• Specific Aim 1 Analysis pipelines for multi- scale, integrative image analysis.
• Specific Aim 2: Database infrastructure to manage and query Pathomics features.
• Specific Aim 3: HPC software that targets clusters, cloud computing, and leadership scale systems.
• Specific Aim 4: Develop visualization middleware to relate Pathomics feature and image data and to integrate Pathomics image and “omic” data.

SEER Virtual Tissue Repository
• Lynne Penberthy MD, MPH NCI SEER• Ed Helton PhD NCI CBIIT Clinical Imaging Program• Ulrike Wagner CBIIT Clinical Imaging Program• Radim Moravec NCI PhD, NCI SEER• Ashish Sharma PhD Biomedical Informatics Emory• Joel Saltz MD, PhD Biomedical Informatics Stony Brook• Tahsin Kurc PhD Biomedical Informatics Stony Brook• Georgia Tourassi, Oak Ridge National Laboratory
Vision – Enable population/epidemiological cancer research that leverages rich cancer phenotype information available from Pathology tissue studies
NCIP/Leidos 14X138 and HHSN261200800001E - NCI

SEER Virtual Tissue Repository
• SEER registries are a potential source of information about unusual outcomes and rare cancers
• Leverage Pathology labs which store FFPE tumors, slides and digital images
• Link to SEER data – track long term outcomes • SEER: 500K Cancer patients per year• Accrue linked clinical data, Pathology slides from
SEER sites
SEER VIRTUAL TISSUE REPOSITORY
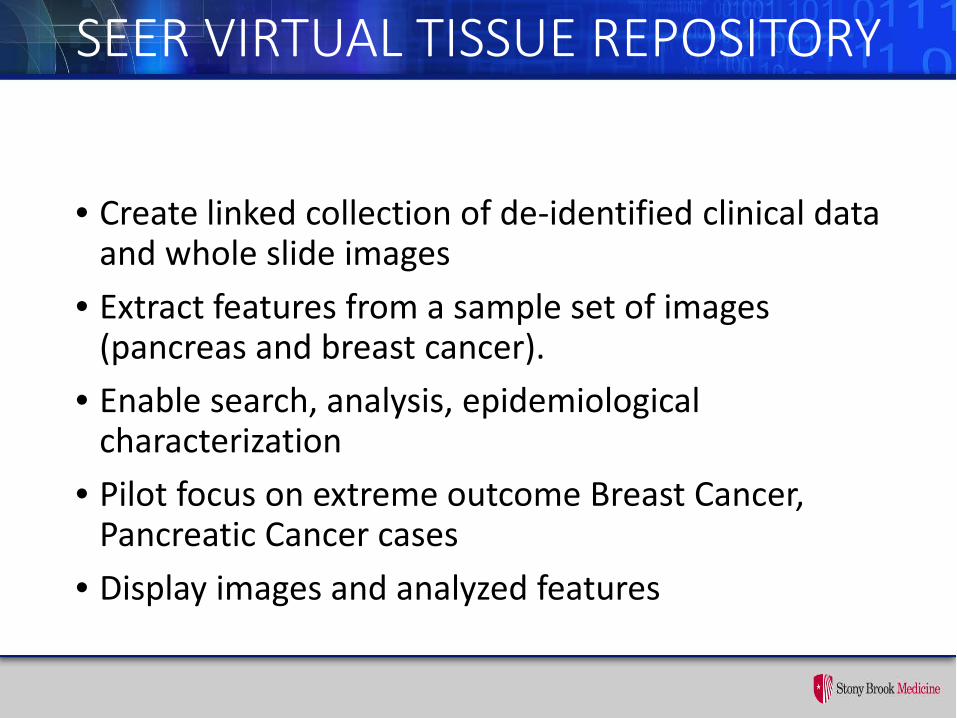
• Create linked collection of de-identified clinical data and whole slide images
• Extract features from a sample set of images (pancreas and breast cancer).
• Enable search, analysis, epidemiological characterization
• Pilot focus on extreme outcome Breast Cancer, Pancreatic Cancer cases
• Display images and analyzed features

Robust Nuclear Segmentation• Robust ensemble algorithm to segment nuclei across tissue types• Optimized algorithm tuning methods• Parameter exploration to optimize quality• Systematic Quality Control pipeline encompassing tissue image
quality, human generated ground truth, convolutional neural network critique
• Yi Gao, Allen Tannenbaum, Dimitris Samaras, Le Hou, Tahsin Kurc


Feature Viz Suite
• Explore Relationship Between Imaging Features, Outcome, ”omics”
• Explore relationships between features and explore how features relate to images

Feature Explorer - Integrated Pathomics Features, Outcomes and “omics” – TCGA NSCLC Adeno Carcinoma Patients

Feature Explorer - Integrated Pathomics Features, Outcomes and “omics” – TCGA NSCLC Adeno Carcinoma Patients

PathomicsRelationship Between Image and Features

Select Feature Pair – dots correspond to nuclei

Subregion selected – form of gating analogous to flow cytometry

Sample Nuclei from Gated Region

Gated Nuclei in Context

Docker and Virtual Machine Distributions

3D Slicer Pathology – Generate High Quality Ground Truth

Apply Segmentation Algorithm

Adjust algorithm parameters, manual fine tuning

Classification
• Automated or semi-automated identification of tissue or cell type
• Variety of machine learning and deep learning methods
• Quantification of lymphocyte infiltration• Collaboration with TCGA Pan Can Atlas Immune Group
• Classification of Neuroblastoma• Classification of Gliomas

Team
• TCGA Pan Can Immune:• Vesteinn Thorsson• lya Shmulevich
• TIL Project Leads• Joel Saltz• Dimitris Samaras• Tahsin Kurc• Alex Lazar
• caMicroscope Lead • Ashish Sharma
• Deep Learning Graduate Students
• Le Hou• Vu Nyugen
• Pathology Fellows/ Faculty• Anne Zhao• John Van Arnam• Rebecca Batiste
• Biostatistics• Arvind Rao
• Active Learning Collaborator
• Lee Cooper

TCGA PanCan TILS Collaborative Effort
• Deep learning algorithm trained on 20K+ patches
• Pathologist correction is essential to reduce false positives as there are many patches.
• GUI developed to accomplish this –rolled out to TCGA Pathologists
• TCGA TIL rich tumors including –NSCLC adenocarcinoma, breast, pancreatic, colorectal, skin and uveal melanoma
• Working group of TCGA Pathologists - leverage tool to generate TCGA TIL data and TIL maps (Alex Lazar)
• CNN Algorithm presented at USCAP 2017 – Zhao et al

Training a CNN
CNN Non Lymphocyte Lymphocyte
Pathologist’s labelPredicted label
Minimize the difference between
predicted label and the true
label.
Presenter
Presentation Notes
Given a dataset of images with corresponding labels. The CNN is trained to output predicted labels that match the true labels of its inputs. However this requires a lot of labeled data.

Patch Based Performance Evaluation of CNN Classification – TCGA Non Small Cell Lung Cancer

Lymphocyte Classification Heat Map
Trained with 22.2K image patchesPathologist corrects and edits

Image based TIL prediction
• Initial unsupervised training step (autoencoder) -initialize CNN
• Train CNN on initial supervised dataset• Apply CNN to obtain predicted lymphcyte heatmaps• Pathologists edit heatmaps using caMicroscope• Extract new training data from edited heatmaps• Sampling algorithm to adjust thresholds
• USCAP 2017 Zhao et al, submitted publication to International Conference on Computer Vision

caMicroscope with TIL heatmap

Adjust sensitivity - High

Adjust sensitivity - Low

Prediction without editing
Prediction edited by Pathologist 2
Prediction edited by Pathologist 1
Tissue Specimen
TIL Distribution Maps

TCGA Pan Can Immune
• Roughly 3.5K TIL maps generated to date with pipeline on track to complete roughly 10K by mid-April
• Comparison with TIL molecular epigenetic and RNA seq data
• Initial draft manuscript completed March 24th
• Deeper dive into TCGA “omics” analytics

Dissemination
• Containers • Containerized segmentation algorithm/FeatureDB Employed
to support TIES, MICCAI, and competitions supported through Kalpathy-Kramer ITCR
• Full containerized implementation of caMicroscope/FeatureDB/Segmentation algorithm/Feature Scape - Feb 1 2017
• Cloud Pilots• TCIA• HPC via NSF and DOE• TCGA – PanCanAtlas – Lymphocyte characterization• Integrated Features/NLP joint with TIES

ITCR Team
Stony Brook UniversityJoel SaltzTahsin KurcYi GaoAllen TannenbaumErich BremerJonas AlmeidaAlina JasniewskiFusheng WangTammy DiPrimaAndrew WhiteLe HouFurqan BaigMary Saltz
Emory UniversityAshish SharmaAdam Marcus
Oak Ridge National LaboratoryScott KlaskyDave PugmireJeremy Logan
Yale UniversityMichael Krauthammer
Harvard University Rick Cummings

Funding – Thanks!• This work was supported in part by U24CA180924-
01, NCIP/Leidos 14X138 and HHSN261200800001E from the NCI; R01LM011119-01 and R01LM009239 from the NLM
• This research used resources provided by the National Science Foundation XSEDE Science Gateways program under grant TG-ASC130023 and the Keeneland Computing Facility at the Georgia Institute of Technology, which is supported by the NSF under Contract OCI-0910735.

Thanks!