Information Technology Department Programs and Services
14
Information Technology Department Programs and Services Information Systems Telecommunications Software Development Administration Client Services 239
Transcript of Information Technology Department Programs and Services

Information Technology Department Programs and Services
InformationSystems
TelecommunicationsSoftware
DevelopmentAdministration Client Services
239

INFORMATION TECHNOLOGY DEPARTMENT
Note: Total percentage may not equal 100% due to rounding.
Charges for Services54.15%
Miscellaneous4.34%
Balance Forward -Operating23.85%Transfers - General
Revenue1.31%
Transfers - Others11.78%
Other Finance Sources4.574%
TOTAL BUDGET $7,546,091 OPERATING REVENUES (SOURCES) FY 2010-2011
Compensation And Benefits38.61%
Operating Expenses52.73%
Capital Expenditures4.57%Reserves - Captial
4.09%
TOTAL BUDGET $7,546,091 OPERATING EXPENDITURES (USES) FY 2010-2011
240

INFORMATION TECHNOLOGY DEPARTMENT: SUMMARYMISSION STATEMENT:
PROGRAMS AND SERVICES:
Information Systems - Non Mandated.
TRENDS AND ISSUES:
During FY 2010-2011, the Information Technology Department will be subject to the following budgetary directives:1. No cost of living allowance (C.O.L.A.), or merit increases in the budget.2. Most positions in the senior management class are charged twelve (12) furlough days and all other positions are charged six (6) days.3. Increases to health benefits continue to be shifted to employees and retirees. Employees, employee dependents and retirees will absorb an increase of 15% in health benefit premiums.
MAJOR SERVICE LEVEL IMPACTS:
Necessary budget reductions have resulted in the following major service level impacts to the Brevard County community:1. A 17% manpower reduction of the Information Operators at the Viera Complex Information Booth, who provide guidance to an average of 2,500 customers monthly.2. Defer the replacement of 77 Computer Switches and Routers ,pushing their proposed replacement out from the current industry standard of six years to our actual assets lifecycles, which range between six and nine years.3. Continue deferring the replacement of 1,937 small computers and laptops which have reached the industry standard for replacement.
The accompanying charts illustrate the major service level impacts to the community.
1. Increasingly sophisticated computer system attacks pose security threats to mission critical databases within the County. I.T.D. will need to pursue additional resources in both systems and personnel in the coming years in order to minimize these risks.2. The general public increasingly expects and demands increased access to do business with the County via the Internet. This capability requires increased funding, but a positive return on investment can be expected, if managed properly.3. I.T.D. is insufficiently staffed to properly maintain and take full advantage of existing software systems. The current staff is at full capacity with the current workload. The addition of new systems will require the addition of expensive personnel resources. 4. The SAP Financial Management System must be upgraded by December 31, 2012. Based upon experience, the cost will likely be between $600,000 and $800,000. I.T.D currently has $200,000 set aside for this effort.5. I.T.D. will be using approximately $1,430,000 of Balance Forward cash for operating expenses for FY 2010/2011. I.T.D. is also not providing adequate training to staff. Both of these issues are not sustainable.
The Information Technology Department, within available resources, continues to apply advances in technology to deliver practical solutions by integrating proven technology and cost effective resource use.
Develop, procure and enhance information resources and databases. Ensure reliable, integrated voice, data and video capabilities and performance.Maintain a high level of computer system availability, performance, data integrity and security. Promptly and courteously respond to problems.
In general there has been a continued trend toward larger numbers of technology users, accessing more sophisticated and complex programs. As County departments increasingly rely on computer systems to automate their business processes, Information Technology Department (I.T.D.) must absorb increasing requirements to expand network and database capacity, reliability, and to ensure business continuity.
The following are issues of concern:
241
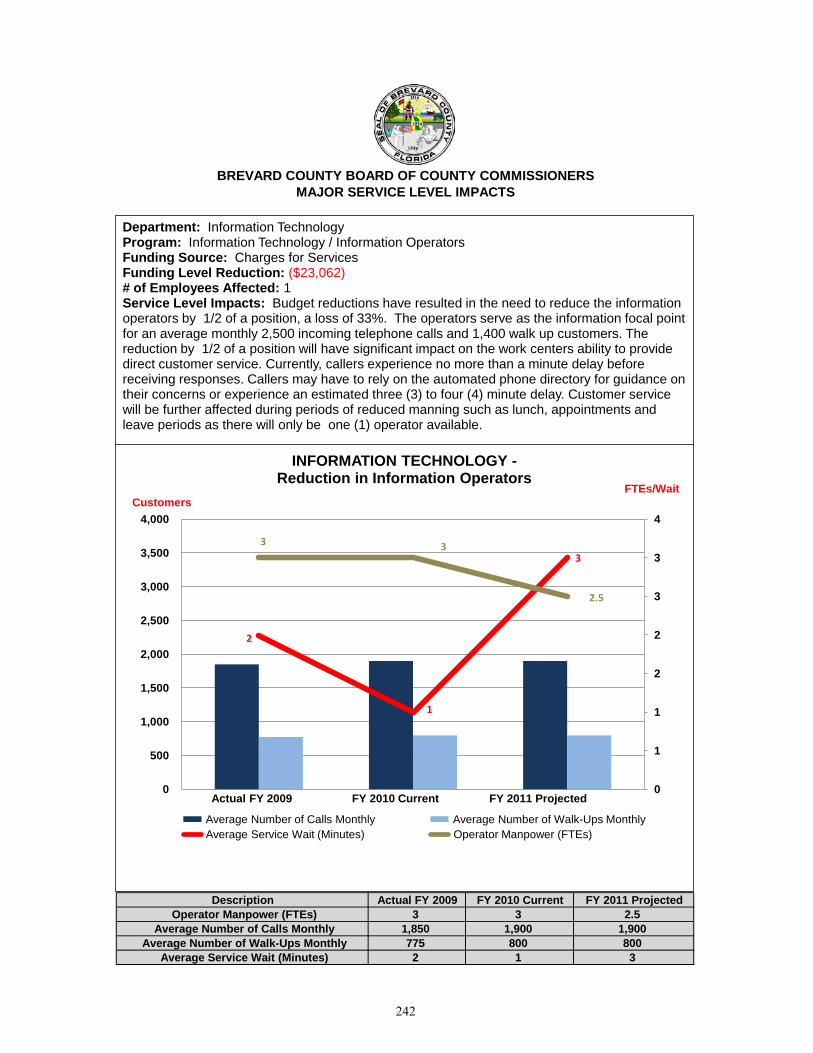
Description Actual FY 2009 FY 2010 Current FY 2011 Projected Operator Manpower (FTEs) 3 3 2.5
Average Number of Calls Monthly 1,850 1,900 1,900 Average Number of Walk-Ups Monthly 775 800 800
Average Service Wait (Minutes) 2 1 3
BREVARD COUNTY BOARD OF COUNTY COMMISSIONERSMAJOR SERVICE LEVEL IMPACTS
Department: Information TechnologyProgram: Information Technology / Information OperatorsFunding Source: Charges for Services Funding Level Reduction: ($23,062)# of Employees Affected: 1Service Level Impacts: Budget reductions have resulted in the need to reduce the information operators by 1/2 of a position, a loss of 33%. The operators serve as the information focal point for an average monthly 2,500 incoming telephone calls and 1,400 walk up customers. The reduction by 1/2 of a position will have significant impact on the work centers ability to provide direct customer service. Currently, callers experience no more than a minute delay before receiving responses. Callers may have to rely on the automated phone directory for guidance on their concerns or experience an estimated three (3) to four (4) minute delay. Customer service will be further affected during periods of reduced manning such as lunch, appointments and leave periods as there will only be one (1) operator available.
2
1
3
3 3
2.5
0
1
1
2
2
3
3
4
0
500
1,000
1,500
2,000
2,500
3,000
3,500
4,000
INFORMATION TECHNOLOGY -Reduction in Information Operators
Average Number of Calls Monthly Average Number of Walk-Ups MonthlyAverage Service Wait (Minutes) Operator Manpower (FTEs)
Actual FY 2009 FY 2010 Current FY 2011 Projected
FTEs/Wait Customers
242

Description Actual FY 2009 FY 2010 Current FY 2011 Projected Router Suggested Life Cycle 6 6 6 # Units in Use 121 121 121 # Routers replaced per plan 0 0 0 # Routers Exceeding 6 Years 34 52 77
BREVARD COUNTY BOARD OF COUNTY COMMISSIONERSMAJOR SERVICE LEVEL IMPACTS
Department: Information TechnologyProgram: Information Technology / Renewal and ReplacementFunding Source: Charges for Services Funding Level Reduction: ($170,600)# of Employees Affected: 1Service Level Impacts: Budget reductions have resulted in the need to repeat previous fiscal years' deferral of capital replacement, specifically routers and switches. These assets provide service to the following systems; SAP, Accela, County Web Site, and County E-mail. Failure to adequately maintain these routers may cause catastrophic outages to end users resulting in prolonged delays during a router failure, consequently causing delays to agencies dependent on technology to perform their functions. The suggested replacement cycle of these assets is six years and they range in price from $5,180 to $11,000. Equipment age is not the only critical factor when determining replacement. The increasing demand for higher bandwidth and added functionality, Voice Over Internet Protocol (VOIP) capability, requires upgraded equipment. Efficiencies based on technological enhancements and subsequent manpower reductions cannot be realized without the upgrades.
121 121 121
34
52
0
10
20
30
40
50
60
70
80
90
0
20
40
60
80
100
120
140
Actual FY 2009 FY 2010 Current FY 2011 Projected
INFORMATION TECHNOLOGY -Deferral of Routers/witches Renewal & Replacement
# Units in Use # Routers replaced per plan # Routers Exceeding 6 Years
> 6 Years> 9 Years
ScheduledReplaced
77 Units -Averaged
Cost $622,930
243

Description Actual FY 2009 FY 2010 Current FY 2011 Projected PC Suggested Life Cycle 497 496 497 # PCs replaced per plan 122 84 45
BREVARD COUNTY BOARD OF COUNTY COMMISSIONERSMAJOR SERVICE LEVEL IMPACTS
Department: Information TechnologyProgram: Information Technology / Renewal and ReplacementFunding Source: Charges for Services Funding Level Reduction: ($0 for IT Directly / $2,613,013 Countywide)# of Employees Affected: 0Service Level Impacts: Budget reductions have resulted in the need to repeat last fiscal year's deferral of capital replacement, specifically office computers and laptops. Countywide, there are approximately 1,937 computers that are exceeding the five (5) year replacement cycle, and 497 that are at the five (5) year mark. By deferring replacement of technology equipment, end users may experience delays in processing information from new programs that require updated computers.
497 496 497
122
84 45
0
500
1,000
1,500
2,000
2,500
0
100
200
300
400
500
600
Actual FY 2009 FY 2010 Current FY 2011 Projected
INFORMATION TECHNOLOGY -Deferral of Small Computer Renewal & Replacement
PC Suggested Life Cycle # PCs replaced per plan # PCs Exceeding 5 Years
1,937 PCs -Totaling
$2,613,013
Scheduled/Replaced
PCs Needing Replacement
244
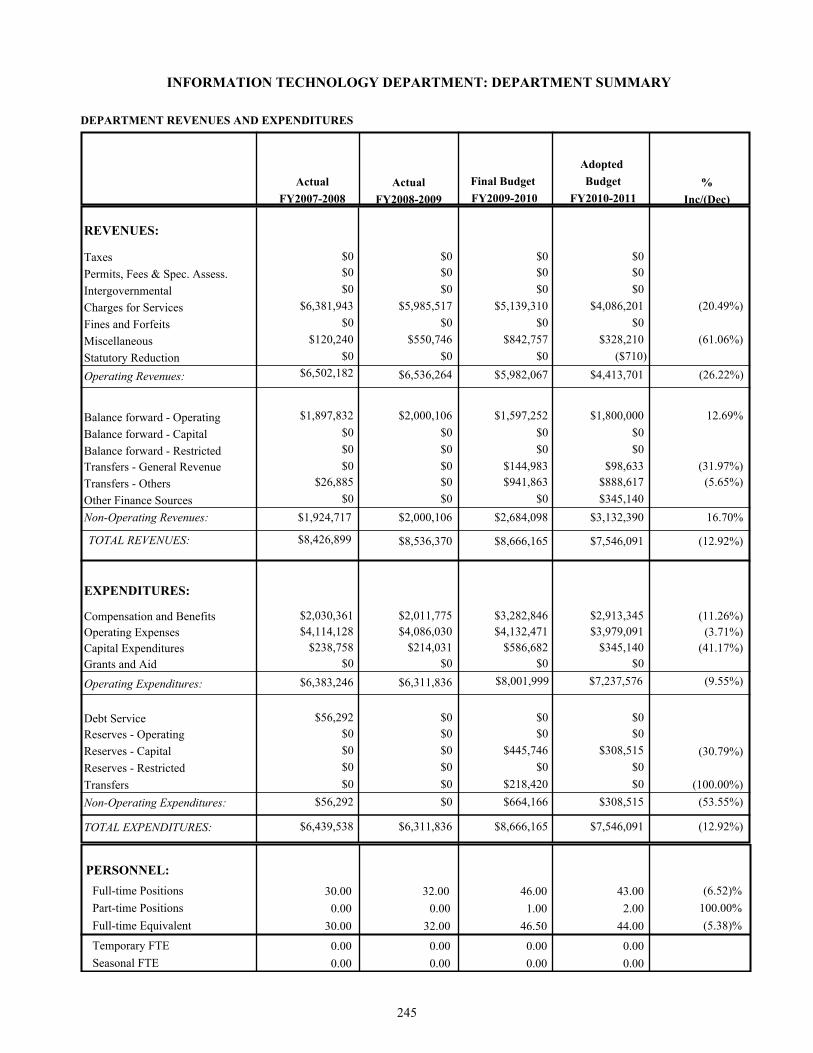
INFORMATION TECHNOLOGY DEPARTMENT: DEPARTMENT SUMMARY
DEPARTMENT REVENUES AND EXPENDITURES
%
Inc/(Dec)
Adopted
Budget
FY2010-2011
Final Budget
FY2009-2010
Actual
FY2008-2009
Actual
FY2007-2008
REVENUES:
Taxes $0 $0 $0 $0
Permits, Fees & Spec. Assess. $0 $0 $0 $0
Intergovernmental $0 $0 $0 $0
Charges for Services $5,985,517 $5,139,310 $4,086,201 (20.49%)$6,381,943
Fines and Forfeits $0 $0 $0 $0
Miscellaneous $550,746 $842,757 $328,210 (61.06%)$120,240
Statutory Reduction $0 $0 ($710)$0
Operating Revenues: $6,536,264 $5,982,067 $4,413,701 (26.22%)$6,502,182
Balance forward - Operating $2,000,106 $1,597,252 $1,800,000 12.69%$1,897,832
Balance forward - Capital $0 $0 $0 $0
Balance forward - Restricted $0 $0 $0 $0
Transfers - General Revenue $144,983 $98,633 $0 (31.97%)$0
Transfers - Others $0 $941,863 $888,617 (5.65%)$26,885
Other Finance Sources $0 $0 $345,140 $0
Non-Operating Revenues: $2,000,106 $2,684,098 $3,132,390 16.70%$1,924,717
TOTAL REVENUES: $8,536,370 $8,666,165 $7,546,091 (12.92%)$8,426,899
EXPENDITURES:
Compensation and Benefits $2,011,775 $3,282,846 $2,913,345 (11.26%)$2,030,361
Operating Expenses $4,086,030 $4,132,471 $3,979,091 (3.71%)$4,114,128
$214,031 $586,682 Capital Expenditures $345,140 (41.17%)$238,758
Grants and Aid $0 $0 $0 $0
Operating Expenditures: $6,311,836 $8,001,999 $7,237,576 (9.55%)$6,383,246
Debt Service $0 $0 $0 $56,292
Reserves - Operating $0 $0 $0 $0
Reserves - Capital $0 $445,746 $308,515 (30.79%)$0
Reserves - Restricted $0 $0 $0 $0
Transfers $0 $218,420 $0 (100.00%)$0
Non-Operating Expenditures: $0 $664,166 $308,515 (53.55%)$56,292
TOTAL EXPENDITURES: $6,311,836 $8,666,165 $7,546,091 (12.92%)$6,439,538
Full-time Positions
Part-time Positions
Full-time Equivalent
Temporary FTE
Seasonal FTE
(5.38)%
(6.52)%
100.00%
PERSONNEL:
43.00 46.00 32.00
2.00 1.00 0.00
32.00 44.00 46.50
0.00
0.00 0.00 0.00
0.00 0.00
30.00
0.00
30.00
0.00
0.00
245

ACTUALFY 2008-2009
• Output : Number of lines maintained and serviced 5,241 5,361 5,087
• Outcome : System availability 99% 99% 98%
• Efficiency : Annual cost per line $210.93 $312.56 $388.53
• Output : Number of systems maintained and serviced 220 220 220(computer servers and network equipment)
• Outcome : System Availability 99% 99% 99%
• Efficiency : Annual Cost Per User $1,580 $890 $703.00
• Output : Logged requests for PC repair & Support 4,089 6,500 8,700
• Outcome : Percent of calls completed within time frame 95% 95% 95%
• Efficiency : Cost per Incident $113.51 $61.20 $85.00
INFORMATION TECHNOLOGY PROGRAM PROFILEGOALS:
OBJECTIVES:
4. Manage, maintain and improve the County's telephone system infrastructure.
1. Manage, maintain and improve the County's telephone system infrastructure.
FY 2010-2011PERFORMANCE MEASUREMENTS:PROJECTED PROJECTEDFY 2009-2010
To apply advances in technology to automate business processes. This will, in-turn, enable users to provide expanded services to residents and visitors in a more timely, accurate, and cost effective manner.
Telecommunication/Systems Administration
Telecommunications/Telephone Services
Client Services/PC Support
2. Advise County agencies on the development, procurement and implementation of software applications. 3. Provide County users with highly responsive service to resolve technical issues.
246

INFORMATION TECHNOLOGY PROGRAM PROFILE
1 ($413,083)2 ($4,144)3 ($4,000)4 ($8,560)5 ($170,600)6 ($161,193)7 ($51,980)8 ($23,062)
($836,622)
REVENUES:
Operating Revenues decrease by 23.42% as a result of reductions in charges for service through the Cost Allocation Plan.
Non-Operating Revenues decrease by 10.67% primarily due to the conservative spending practices employed in order to allow for maximum balance forward being carried into FY 2010-2011.
Eliminate 411 Operator Support
REDUCTIONS
PROGRAM CHANGES:
Reduce an Information Officer from Full Time to Part Time
Eliminate IT Department's Cell Phones and Pagers
EXPENDITURES:
Operating Expenditures decrease by 9.55% as a result of position eliminations, services reductions and the delaying of replacing capital equipment such as servers which have been pushed out another year creating a tenuous nine year life cycle versus the IT standard of 6 years.
BUDGET ANALYSIS:
Eliminate Yellow Page Advertisements
Reduced Telephone System Maintenance Contract Costs
TOTAL
Reduce Renewals and ReplacementsReduce End-User Computer TrainingEliminate Remaining Telephone Technician Position
Non-Operating Expenditures decrease 30.79% as funds were utilized on critical equipment replacement in FY 2009-2010.
247

PROGRAM REVENUES AND EXPENDITURES
INFORMATION SYSTEMS: PROGRAM PROFILE
%
Inc/(Dec)
Adopted
Budget
FY2010-2011
Final Budget
FY2009-2010
Actual
FY2008-2009
Actual
FY2007-2008
REVENUES:
Taxes $0 $0 $0 $0
Permits, Fees & Spec. Assess. $0 $0 $0 $0
Intergovernmental $0 $0 $0 $0
Charges for Services (20.49%)$5,960,058 $5,139,310 $4,086,201 $6,367,038
Fines and Forfeits $0 $0 $0 $0
Miscellaneous (47.43%)($2,254) $624,337 $328,210 $88,067
Statutory Reduction $0 $0 ($710)$0
Operating Revenues: $5,957,804 $5,763,647 $4,413,701 (23.42%)$6,455,104
Balance forward - Operating 12.69%$2,000,106 $1,597,252 $1,800,000 $1,897,832
Balance forward - Capital $0 $0 $0 $0
Balance forward - Restricted $0 $0 $0 $0
Transfers - General Revenue $144,983 $98,633 (31.97%)$0 $0
(5.65%)Transfers - Others $0 $941,863 $888,617 $26,885
Other Finance Sources $0 $0 $345,140 $0
Non-Operating Revenues: $2,000,106 $2,684,098 $3,132,390 16.70%$1,924,717
TOTAL REVENUES: $7,957,910 $8,447,745 $7,546,091 (10.67%)$8,379,821
EXPENDITURES:
Compensation and Benefits (11.26%)$2,011,775 $3,282,846 $2,913,345 $2,012,929
Operating Expenses (3.71%)$4,085,418 $4,132,471 $3,979,091 $4,111,122
Capital Expenditures $586,682 $345,140 $214,031 (41.17%)$238,758
Grants and Aid $0 $0 $0 $0
Operating Expenditures: $6,311,224 $8,001,999 $7,237,576 (9.55%)$6,362,808
Debt Service $0 $0 $0 $56,292
Reserves - Operating $0 $0 $0 $0
Reserves - Capital (30.79%)$0 $445,746 $308,515 $0
Reserves - Restricted $0 $0 $0 $0
Transfers $0 $0 $0 $0
Non-Operating Expenditures: $0 $445,746 $308,515 (30.79%)$56,292
TOTAL EXPENDITURES: $6,311,224 $8,447,745 $7,546,091 (10.67%)$6,419,100
Full-time Positions
Part-time Positions
Full-time Equivalent
Temporary FTE
Seasonal FTE
(5.38%)
(6.52%)
100.00%
PERSONNEL:
43.00 46.00 32.00
2.00 1.00 0.00
32.00 44.00 46.50
0.00
0.00 0.00 0.00
0.00 0.00
30.00
0.00
30.00
0.00
0.00
248
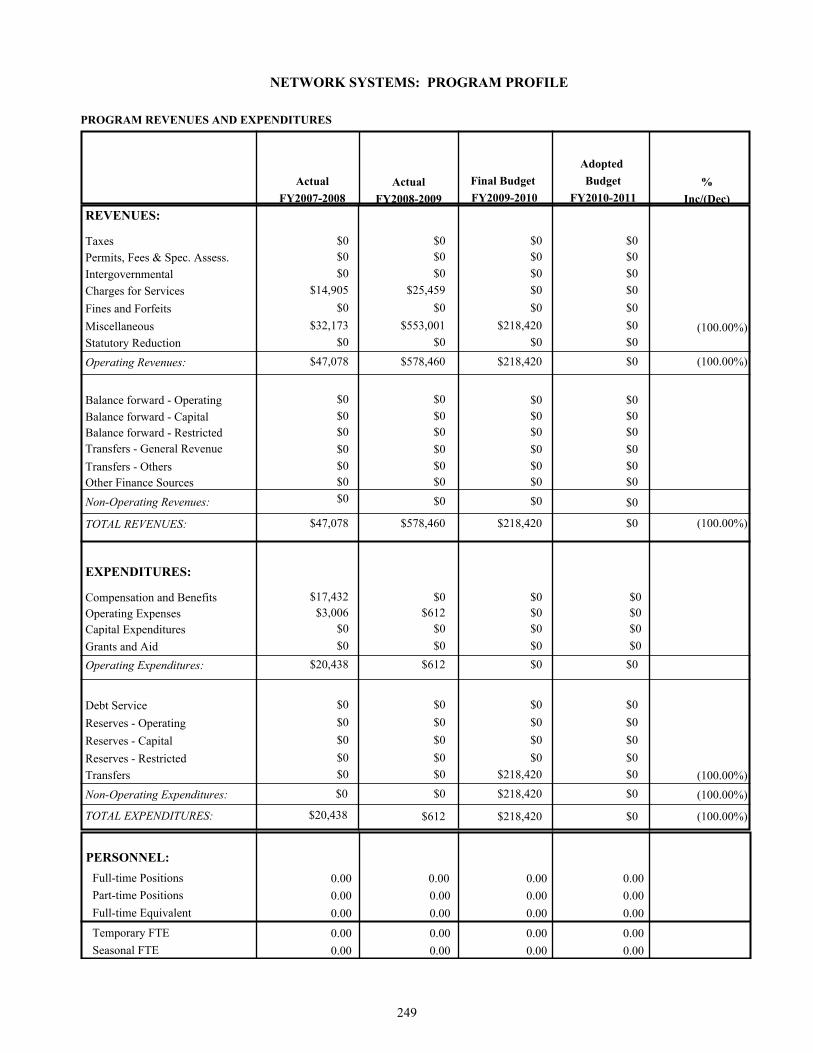
PROGRAM REVENUES AND EXPENDITURES
NETWORK SYSTEMS: PROGRAM PROFILE
%
Inc/(Dec)
Adopted
Budget
FY2010-2011
Final Budget
FY2009-2010
Actual
FY2008-2009
Actual
FY2007-2008
REVENUES:
Taxes $0 $0 $0 $0
Permits, Fees & Spec. Assess. $0 $0 $0 $0
Intergovernmental $0 $0 $0 $0
Charges for Services $25,459 $0 $0 $14,905
Fines and Forfeits $0 $0 $0 $0
Miscellaneous (100.00%)$553,001 $218,420 $0 $32,173
Statutory Reduction $0 $0 $0 $0
Operating Revenues: $578,460 $218,420 $0 (100.00%)$47,078
Balance forward - Operating $0 $0 $0 $0
Balance forward - Capital $0 $0 $0 $0
Balance forward - Restricted $0 $0 $0 $0
Transfers - General Revenue $0 $0 $0 $0
Transfers - Others $0 $0 $0 $0
Other Finance Sources $0 $0 $0 $0
Non-Operating Revenues: $0 $0 $0 $0
TOTAL REVENUES: $578,460 $218,420 $0 (100.00%)$47,078
EXPENDITURES:
Compensation and Benefits $0 $0 $0 $17,432
Operating Expenses $612 $0 $0 $3,006
Capital Expenditures $0 $0 $0 $0
Grants and Aid $0 $0 $0 $0
Operating Expenditures: $612 $0 $0 $20,438
Debt Service $0 $0 $0 $0
Reserves - Operating $0 $0 $0 $0
Reserves - Capital $0 $0 $0 $0
Reserves - Restricted $0 $0 $0 $0
Transfers (100.00%)$0 $218,420 $0 $0
Non-Operating Expenditures: $0 $218,420 $0 (100.00%)$0
TOTAL EXPENDITURES: $612 $218,420 $0 (100.00%)$20,438
Full-time Positions
Part-time Positions
Full-time Equivalent
Temporary FTE
Seasonal FTE
PERSONNEL:
0.00 0.00 0.00
0.00 0.00 0.00
0.00 0.00 0.00
0.00
0.00 0.00 0.00
0.00 0.00
0.00
0.00
0.00
0.00
0.00
249

DESCRIPTION POSITION DESTINATIONFUNDING SOURCE
TOTAL COST
INFORMATION SYSTEMS:
Bldg. Industry Consulting Svc. (BICSI) TBD Orlando User Fees $641Local Seminars TBD TBD User Fees $1,434Microsoft Framework Exams TBD TBD User Fees $250
TOTAL FOR PROGRAM: $2,325
INFORMATION TECHNOLOGY DEPARTMENT: TRAVEL A & B SUMMARY
250

DESCRIPTION QUANTITY UNIT COSTFUNDING SOURCE
TOTAL COST
IT TELECOMMUNICATIONS:
Switch/Routers 4 $7,016 User Fees $28,062Switch/Routers 1 $4,662 User Fees $4,662Switch/Routers 1 $4,950 User Fees $4,950Switch/Routers 7 $9,900 User Fees $69,300Computer 1 $2,000 User Fees $2,000Disk Drive 12 $1,012 User Fees $12,144Fiber Drives 12 $750 User Fees $9,000PBX Hardware & Software 1 $28,000 User Fees $28,000PBX Hardware & Software 1 $22,000 User Fees $22,000PBX Hardware & Software 1 $24,000 User Fees $24,000PBX Hardware & Software 1 $10,000 User Fees $10,000PBX Hardware & Software 1 $7,200 User Fees $7,200Laptops for PBX's 4 $550 User Fees $2,200Switches 4 $14,846 User Fees $59,384Routers 5 $8,000 User Fees $40,000Dell T3400 Workstation 2 $1,635 User Fees $3,270Laptops 4 $2,083 User Fees $8,332PC Desktop Workstation 1 $1,636 User Fees $1,636PC Desktop Workstation Training Facility 9 $1,000 User Fees $9,000
TOTAL FOR PROGRAM: $345,140
INFORMATION TECHNOLOGY DEPARTMENT: CAPITAL OUTLAY SUMMARY1
251

TE
LE
CO
MM
UN
ICA
TIO
NS
Fu
nd
ing
FY
FY
FY
FY
FY
Eq
uip
men
t T
ype
Sou
rce
2010
-201
120
11-2
012
2012
-201
320
13-2
014
2014
-201
5
Up-
grad
e W
ide
Are
a N
etw
ork
(rou
ters
& sw
itche
s)U
ser F
ees
$166
,361
$48,
000
$40,
000
$40,
000
$40,
000
No
supp
ort a
nd o
ut o
f life
cyc
leR
epla
ce P
BX
Har
dwar
e an
d So
ftwar
e U
ser F
ees
$91,
200
$8,0
00$8
,000
$8,0
00$8
,000
N
o su
ppor
t and
out
of l
ife c
ycle
Rep
lace
Com
pute
r Wor
ksta
tions
and
Lap
tops
Use
r Fee
s$1
3,23
6$3
,000
$3,0
00$3
,000
$3,0
00
No
supp
ort a
nd o
ut o
f life
cyc
le, o
ut o
f war
rant
y
INF
OR
MA
TIO
N T
EC
HN
OL
OG
Y D
EP
AR
TM
EN
T:
RE
NE
WA
L A
ND
RE
PL
AC
EM
EN
T P
RO
GR
AM
252