Information Systems System Analysis 421 Class Seven Structuring System Requirements: Process...
77
Information Systems System Analysis 421 Class Seven Structuring System Requirements: Process Modeling
-
Upload
patrick-wilkins -
Category
Documents
-
view
221 -
download
1
Transcript of Information Systems System Analysis 421 Class Seven Structuring System Requirements: Process...

Information Systems System Analysis 421Class Seven
Structuring System Requirements: Process Modeling

Learning Objectives
Understand the logical modeling of processes through studying data flow diagrams
How to draw data flow diagrams using rules and guidelines
How to decompose data flow diagrams into lower-level diagrams
Balancing of data flow diagrams
8.28.2

Learning Objectives
Explain the differences among four types of DFDs: current physical, current logical, new physical and new logical
Discuss the use of data flow diagrams as analysis tools
Compare and contrast data flow diagrams with Oracle’s process modeling tool and with functional hierarchy diagrams
Discuss process modeling for Internet applications
8.38.3

Data Modeling
Entity Relationship
PrototypesData FlowDiagram
System Modeling
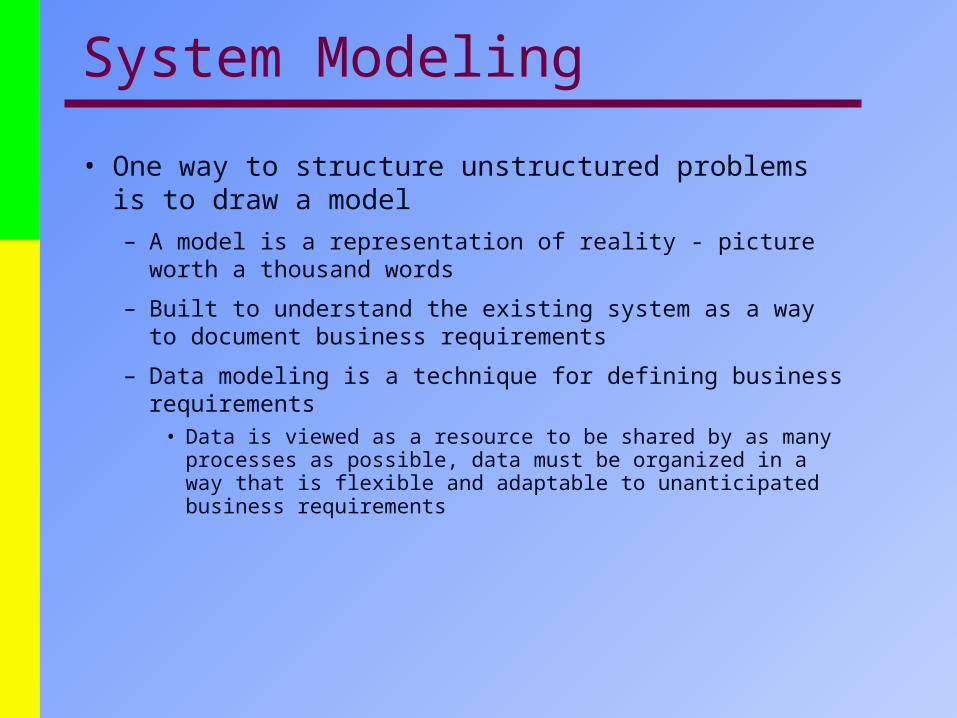
• One way to structure unstructured problems is to draw a model– A model is a representation of reality - picture worth a
thousand words
– Built to understand the existing system as a way to document business requirements
– Data modeling is a technique for defining business requirements
• Data is viewed as a resource to be shared by as many processes as possible, data must be organized in a way that is flexible and adaptable to unanticipated business requirements

System Modeling
• Physical model shows not only what a system does but how the system is physically and technically implemented - depicts technical design
• Logical models depict business requirements illustrates the essence of the system
– Move biases that are the results of the way the current system is implemented
– Reduce the risk of missing requirements
– Allow us to communicate with end users
– Help analysts and users understand business terminology and rules
Process Modeling
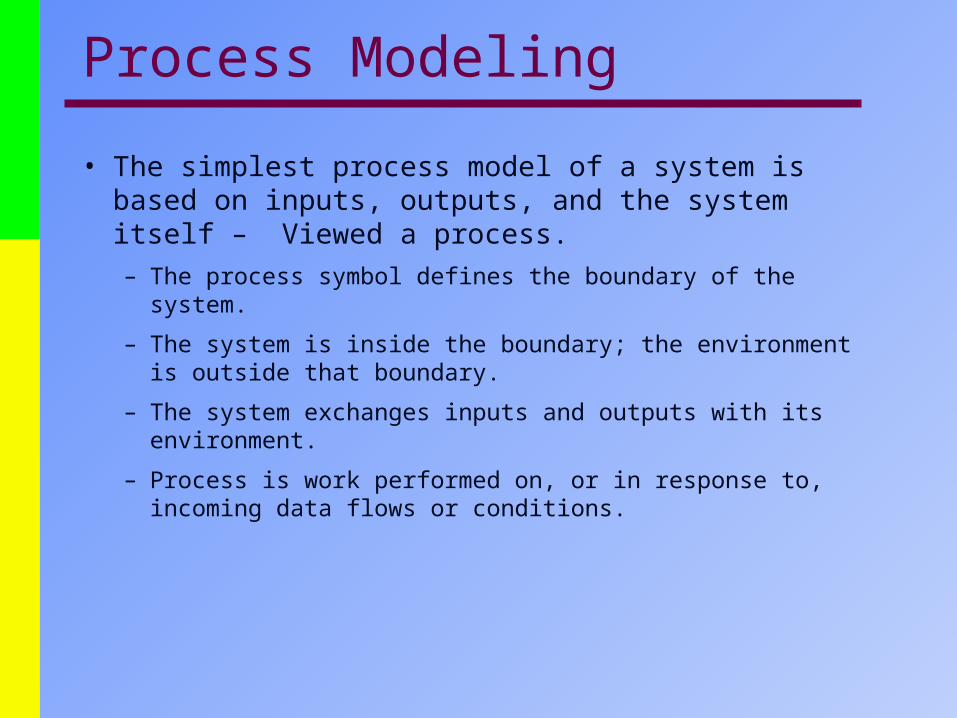
• The simplest process model of a system is based on inputs, outputs, and the system itself – Viewed a process. – The process symbol defines the boundary of the system.
– The system is inside the boundary; the environment is outside that boundary.
– The system exchanges inputs and outputs with its environment.
– Process is work performed on, or in response to, incoming data flows or conditions.

Process Modeling• Graphically represent the processes that capture, manipulate,
store and distribute data between a system and its environment and among system components
• Data flow diagrams (DFD)– Graphically illustrate movement of data between external
entities and the processes and data stores within a system
• Modeling a system’s process– Utilize information gathered during requirements
determination
– Structure of the data is also modeled in addition to the processes
8.88.8

Process Modeling
• Deliverables and Outcomes– Set of coherent, interrelated data flow diagrams
– Context data flow diagram (DFD)• Scope of system
– DFDs of current system• Enables analysts to understand current system
– DFDs of new logical system• Technology independent
• Show data flows, structure and functional requirements of new system
– Project dictionary and CASE repository
8.98.9

Data Flow Diagrams
• Data modeling is done during the project definition stage and refined in physical design
• Similar to ERD Data model - DFD also helps the analyst identify business vocabulary and uncover business requirements
• Can be used on current system to understand requirements
• Can be fit on several sheets of paper
• The level of data flow diagram can be compared to a highway and street maps that you might use - National => State => City
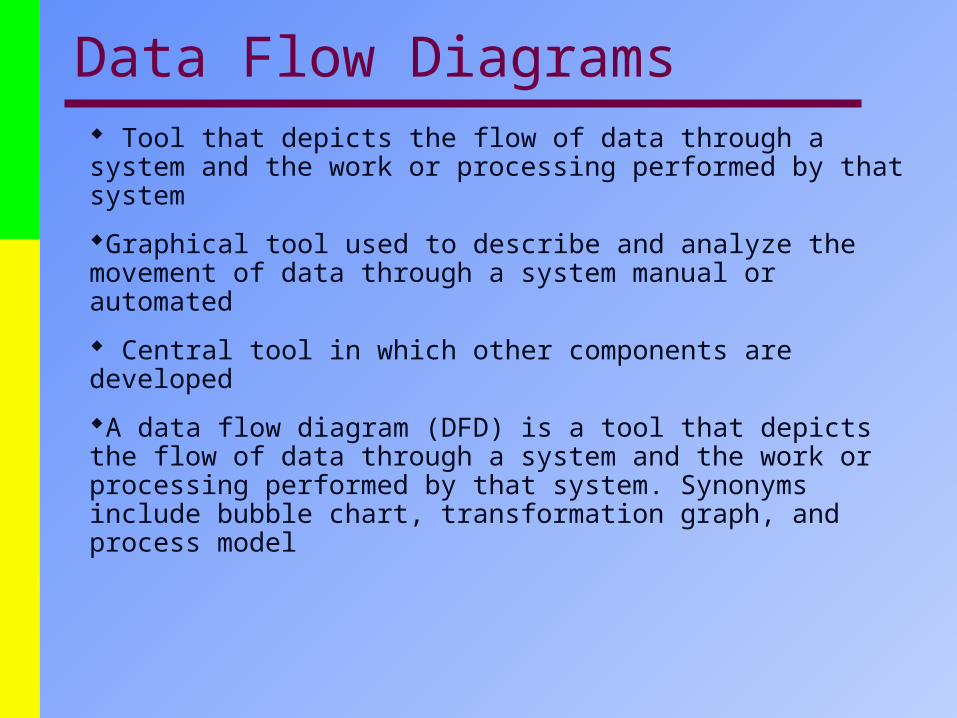
Data Flow Diagrams Tool that depicts the flow of data through a system and the work or processing performed by that system
Graphical tool used to describe and analyze the movement of data through a system manual or automated
Central tool in which other components are developed
A data flow diagram (DFD) is a tool that depicts the flow of data through a system and the work or processing performed by that system. Synonyms include bubble chart, transformation graph, and process model

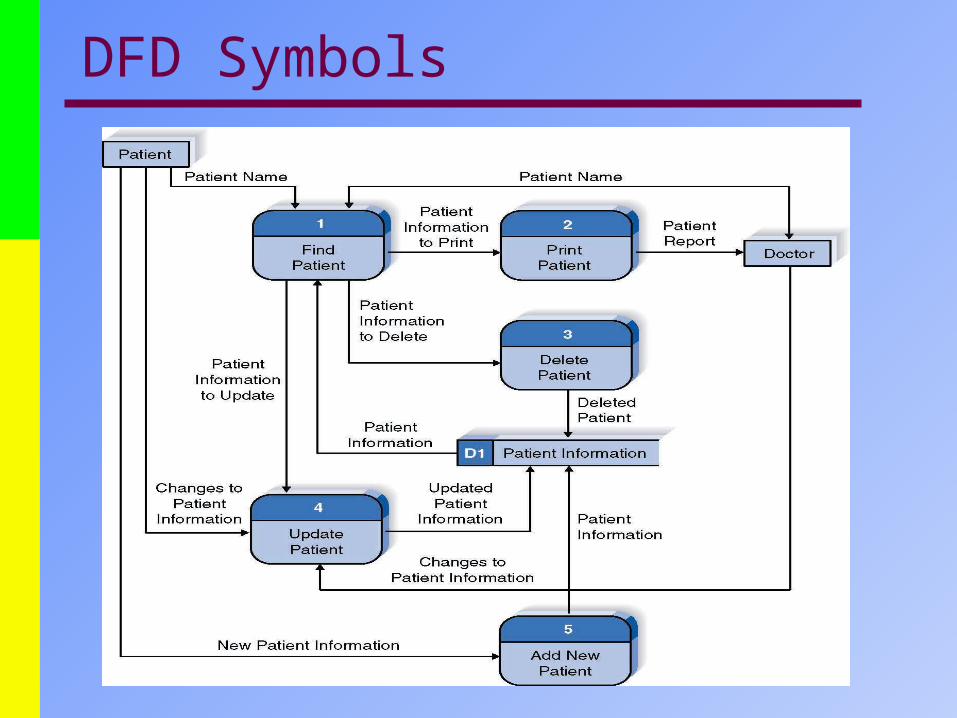
DFD Symbols

DFD Symbols
• Named vector or arrow– Called a data flow
– Portrays a data path
• Bubble – Called a process
– Portrays transformation of data
• Narrow open rectangle– Called a data store
– Portrays a file or data base
• Box– Called a source or sink
– Portrays an internal or external agent
– Used to define a system’s boundaries
new order
3.2
VerifyCredit
VerifyCredit
3.2
Customer Master File
Customer

DFD Symbols
• Data flow - data move in a specific direction
• Processes - people, procedures or device that transforms data - work to be done
• Source or destination - external source or destination of data which may be people, program, organization or other entities - The squares represent external agents – the boundary of the system.
• Data Store - where data is house
Good Sold FileCustomer Update
Goods Sold
2.0

DFD Symbols
Orders
Customer File
Customer
1
VerifyCredit 2
ShipOrder
CreditHistory
AcceptedOrders
ExternalEntity
Data Store
Process
Data Flow
DFD Symbols

Data Flow
• A data flow is data in motion.
• The flow of data between a system and its environment, or between two processes inside a system an relationship between a system and its environment, or between two processes is communication.
– A data flow represents an input of data to a process, or the output of data (or information) from a process. A data flow is also used to represent the creation, deletion, or update of data in a file or database (called a data store on the DFD).
– A data flow is depicted as a solid-line with arrow.

Data Flow
3.1.2 Create a new
member account
3.1.1 Generate an
employee bank statement
3.1.3 Freeze member account number
Accounts Receivable Department
Employee
Member Accounts Employees
Existing account
New account status
Employee status
Frozen account notification
Employee address
Bank statement
Membership application

Data Flow
• No data flow should ever go completely unnamed.
• Data flow names should describe the data flow without describing how the flow is or could be implemented.
• All data flows must begin or end at a process, because data flows are the inputs and outputs of a process.
• Naming Convention - Should be descriptive nouns and noun phrases that are singular, as opposed to plural.
– Should be unique.
• Use adjectives and adverbs to help to describe how processing has changed a data flow.

Data Flow
Orders
Process Order
Cencel Order
Change Order
Address
Summarize Unfilled Orders
OrderCancelled Order
Change of Address Summary of Orders
New Order
Address
Unfilled Order
l
New Order
Order to be
Deleted
2
1
2
2

Data Flow Packet ConceptData Flow Packet Concept
• Data is seen as a package of information
Telephone Service Provider
Pay phone
bill
Itemized calls and
invoice
Itemized calls
Invoice
Correct use of the packet concept
Incorrect use of the
packet concept
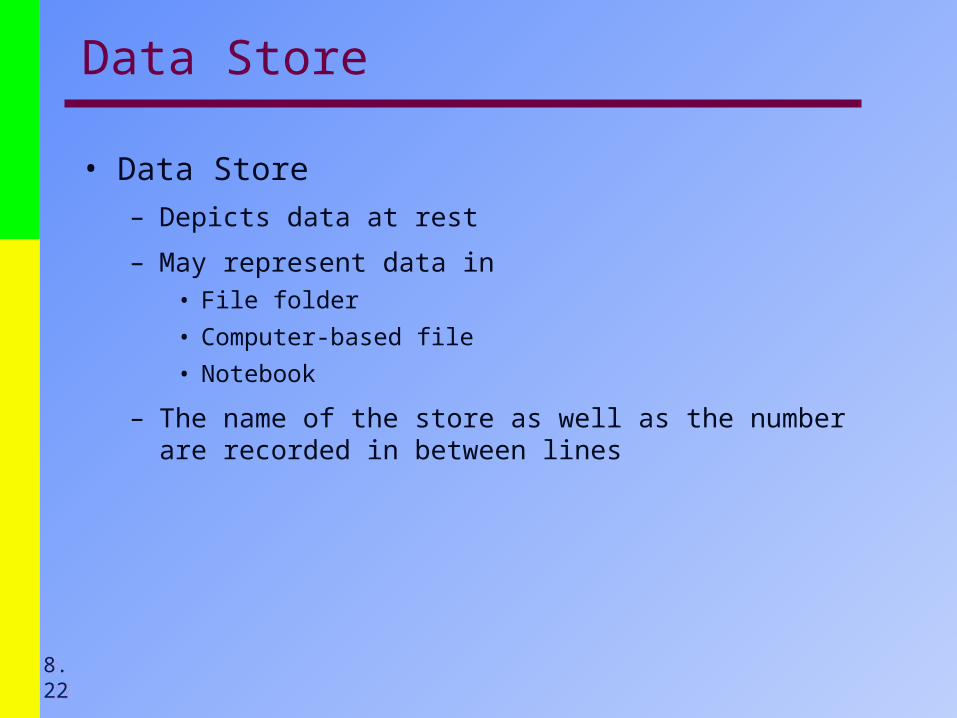
Data Store
• Data Store– Depicts data at rest
– May represent data in• File folder
• Computer-based file
• Notebook
– The name of the store as well as the number are recorded in between lines
8.228.22

Data Stores
• Most information systems capture data for later use.
• The data is kept in a data store.
– A data store is an ``inventory’’ of data. Synonyms include file and database (although those terms are too implementation-oriented for essential process modeling).
– A data store is represented by the open-end box.
• If data flows are data in motion, think of data stores as data at rest.
• Data stores should describe ``things’’ about which the business wants to store data.
• It is permissible to duplicate data stores on a DFD to avoid crossing data flow lines.
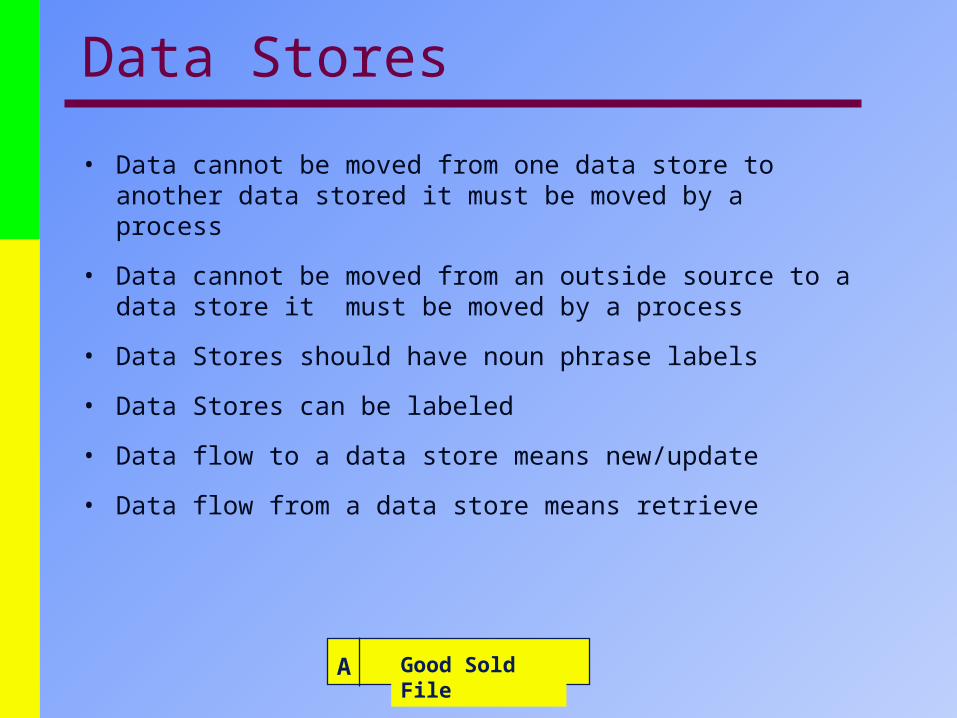
Data Stores
• Data cannot be moved from one data store to another data stored it must be moved by a process
• Data cannot be moved from an outside source to a data store it must be moved by a process
• Data Stores should have noun phrase labels
• Data Stores can be labeled
• Data flow to a data store means new/update
• Data flow from a data store means retrieve
Good Sold FileA
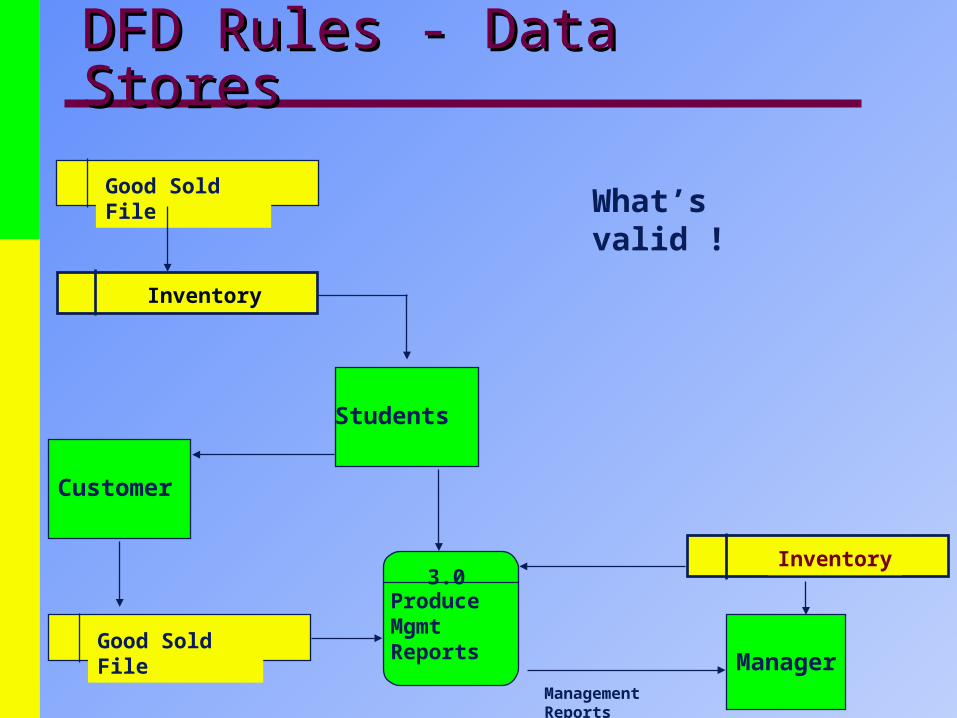
DFD Rules - Data StoresDFD Rules - Data Stores
Good Sold File
Inventory
Good Sold FileManager
ProduceMgmtReports
3.0Inventory
Management Reports
Customer
Students
What’s valid !
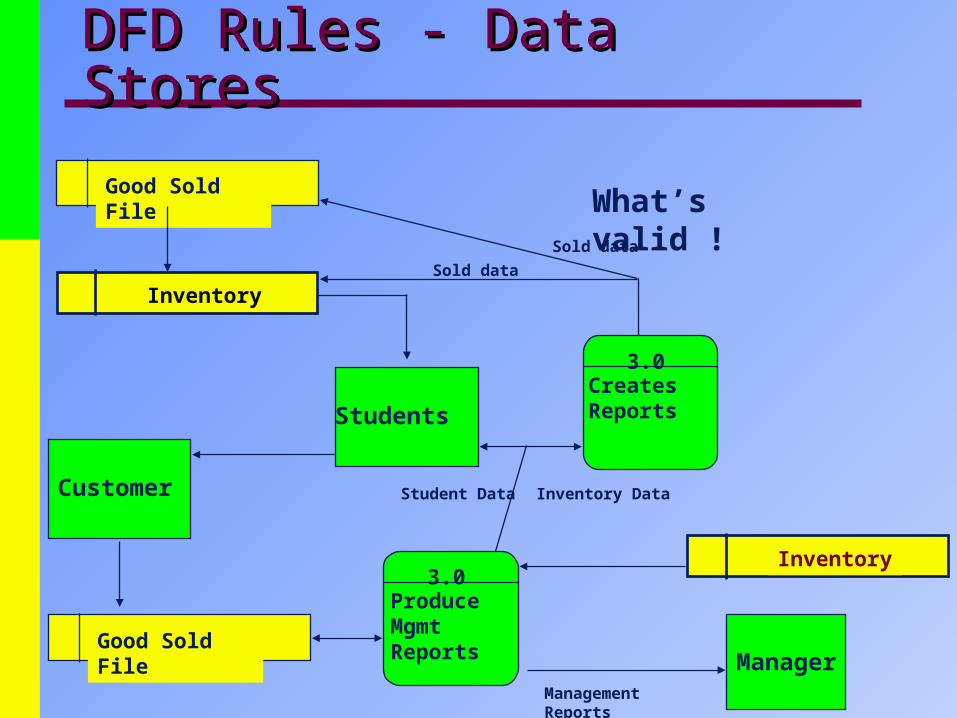
DFD Rules - Data StoresDFD Rules - Data Stores
Good Sold File
Inventory
Good Sold FileManager
ProduceMgmtReports
3.0Inventory
Management Reports
Customer
Students
What’s valid !
CreatesReports
3.0
Inventory DataStudent Data
Sold data
Sold data
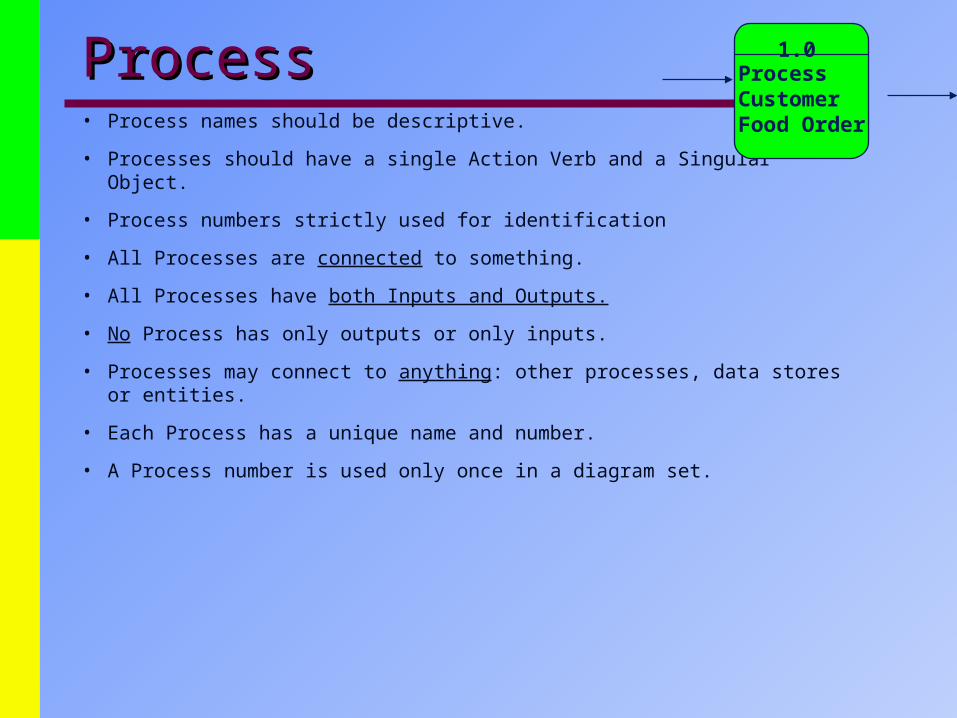
Process Process • Process names should be descriptive.
• Processes should have a single Action Verb and a Singular Object.
• Process numbers strictly used for identification
• All Processes are connected to something.
• All Processes have both Inputs and Outputs.
• No Process has only outputs or only inputs.
• Processes may connect to anything: other processes, data stores or entities.
• Each Process has a unique name and number.
• A Process number is used only once in a diagram set.
ProcessCustomerFood Order
1.0

ProcessProcess
• Black Holes and Miracles
y
Data Store
1
Process 1
1
Process 1
x
x
EntityEntity
Data Store
y
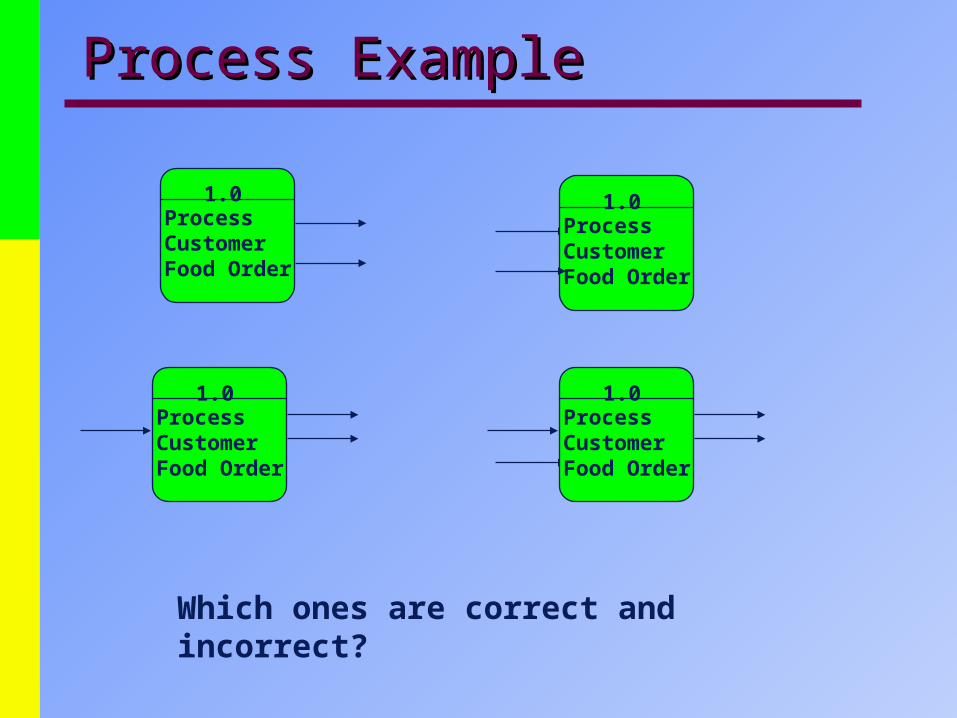
Process ExampleProcess Example
ProcessCustomerFood Order
1.0
ProcessCustomerFood Order
1.0
ProcessCustomerFood Order
1.0
ProcessCustomerFood Order
1.0
Which ones are correct and incorrect?

• Source/Sink– Depicts the origin and/or destination of the data
– Sometimes referred to as an external entity
– Drawn as a square symbol
– Name states what the external agent is
– Because they are external, many characteristics are not of interest to us
8.308.30
External Entities

External Entities
• All information systems respond to events and conditions in the environment.
• The environment of an information system includes external entities that form the boundary of the system, and define places where the system interfaces with its environment.
• A external entity defines an a person, organization unit, other system, or other organization that lies outside of the scope of the project, but which interacts with the system being studied.
• External agents provide the net inputs into a system, and receive net outputs from a system.
• Common synonyms include external agents

External Entities
• The term external means “external to the system being analyzed or designed.”
• An external agent is represented by a square on the data flow diagram.
• External agents on a logical data flow diagram may include people, business units, other internal systems with which your system must interact, and external organizations.
• External agents should be named with descriptive, singular nouns.
• As a general rule, external agents should be located on the perimeters of the page, consistent with their definition as a system boundary.
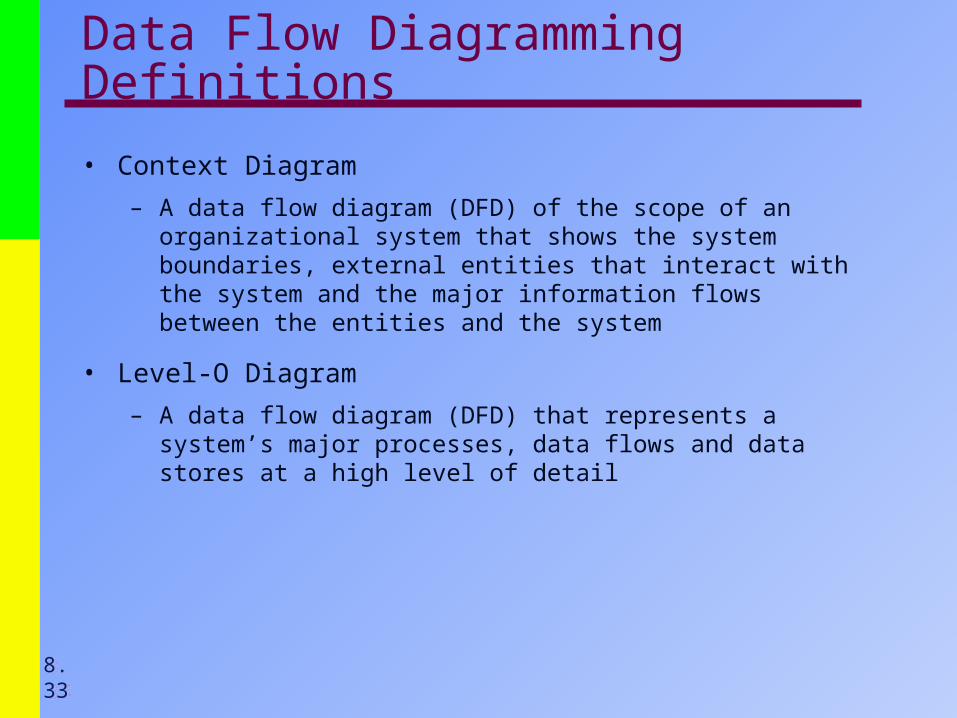
Data Flow Diagramming Definitions
• Context Diagram
– A data flow diagram (DFD) of the scope of an organizational system that shows the system boundaries, external entities that interact with the system and the major information flows between the entities and the system
• Level-O Diagram
– A data flow diagram (DFD) that represents a system’s major processes, data flows and data stores at a high level of detail
8.338.33

Fast Food Restaurant
• Context diagram an overview of an organization system that shows– the system boundaries
– sources that interact with the system
– major information flow between the entities
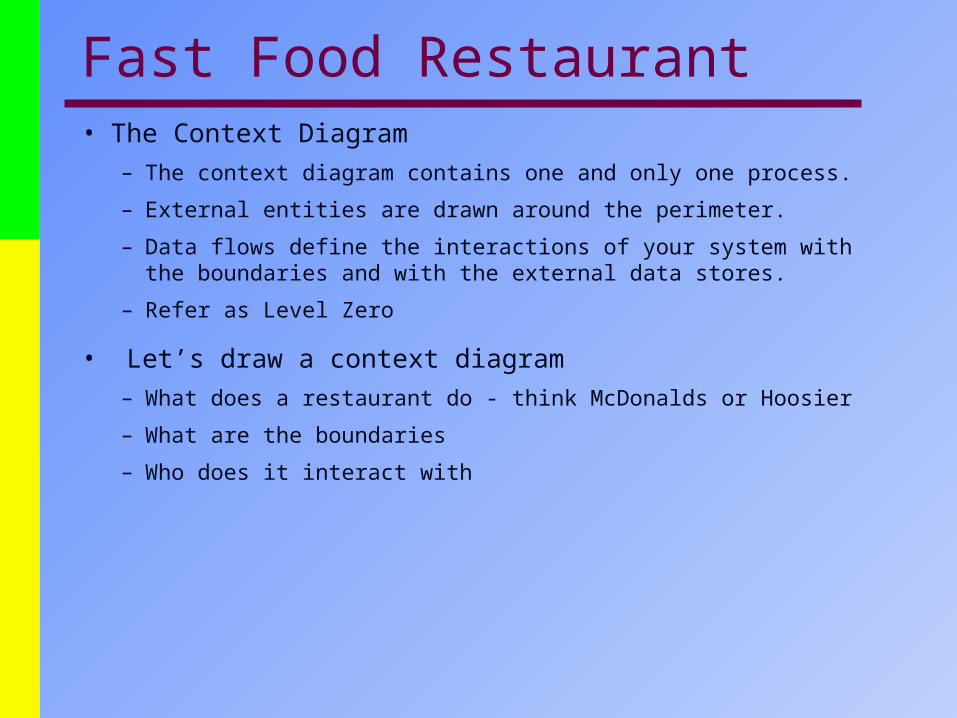
Fast Food Restaurant• The Context Diagram
– The context diagram contains one and only one process.
– External entities are drawn around the perimeter.
– Data flows define the interactions of your system with the boundaries and with the external data stores.
– Refer as Level Zero
• Let’s draw a context diagram– What does a restaurant do - think McDonalds or Hoosier
– What are the boundaries
– Who does it interact with

Developing DFDs: An Example
• Hoosier Burger’s automated food ordering system
• Context Diagram (Figure 8-4) contains no data stores
• Next step is to expand the context diagram to show the breakdown of processes (Figure 8-5)
8.368.36

Figure 8-4Context diagram of Hoosier Burger’s food ordering system
8.378.37

Figure 8-5Level-0 DFD of Hoosier Burger’s food ordering system
8.388.38

Data Flow Diagramming Rules
• Source/Sink
– Data cannot move directly from a source to a sink
– A source/sink has a noun phrase label
• Data Flow
– A data flow has only one direction of flow between symbols
– A fork means that exactly the same data goes from a common location to two or more processes, data stores or sources/sinks
8.398.39
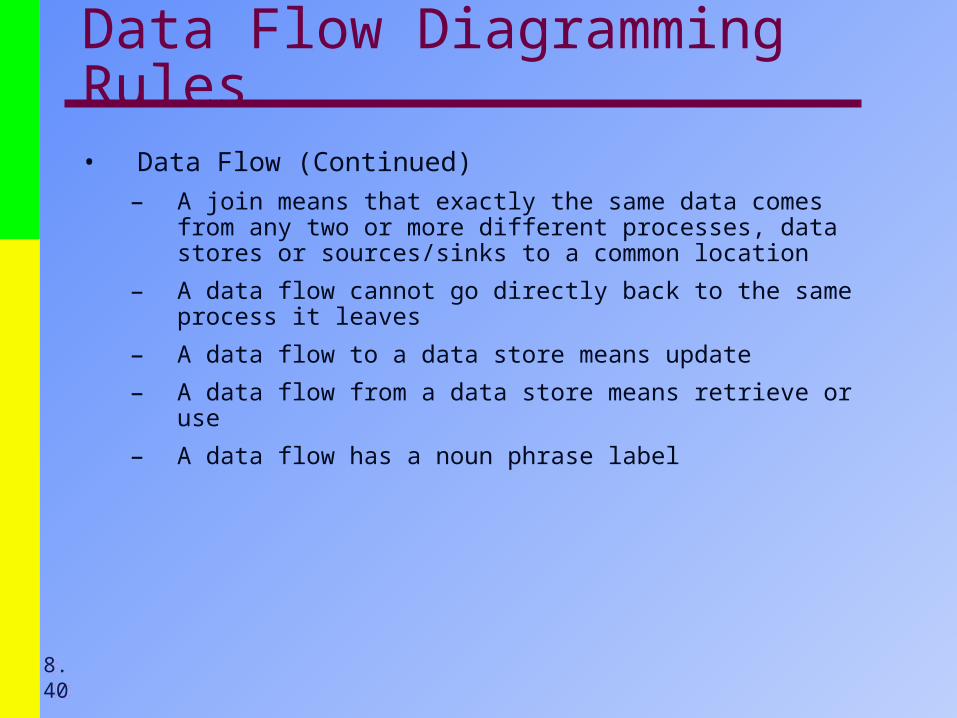
Data Flow Diagramming Rules• Data Flow (Continued)
– A join means that exactly the same data comes from any two or more different processes, data stores or sources/sinks to a common location
– A data flow cannot go directly back to the same process it leaves
– A data flow to a data store means update
– A data flow from a data store means retrieve or use
– A data flow has a noun phrase label
8.408.40

Data Flow ExampleData Flow Example
Incorrect Correct
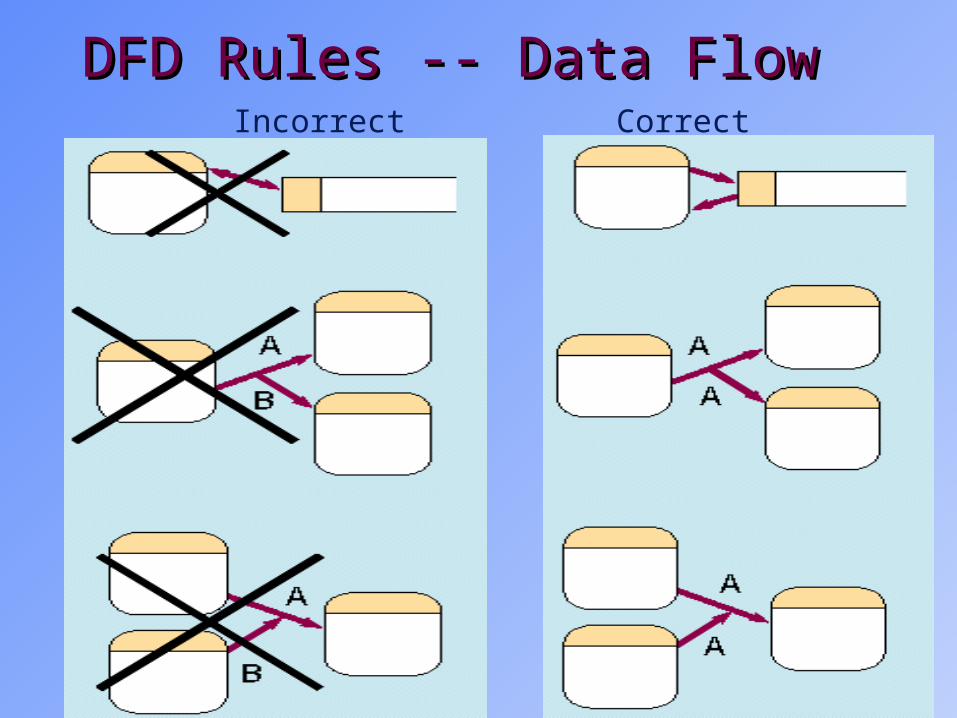
DFD Rules -- Data FlowDFD Rules -- Data FlowIncorrect Correct

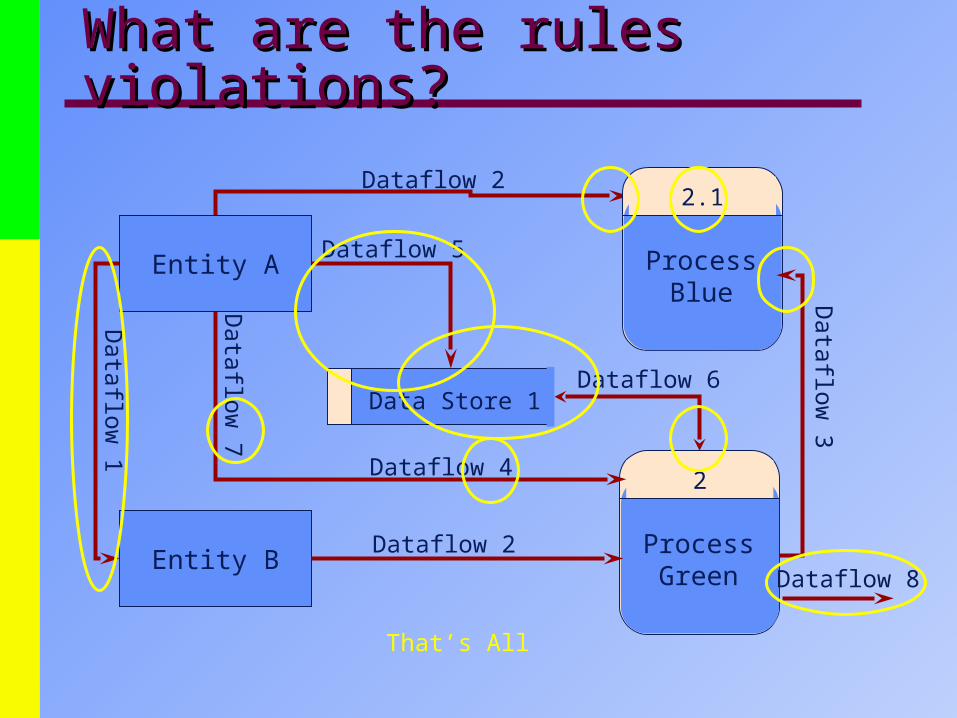
What are the rules What are the rules violations?violations?
Entity B
2
Process Green
2.1
Process Blue
Entity A
Data Store 1
Dataflow 2
Dataflow 2
Dataflow
1
Dataflow
7
Dataflow 5
Dataflow
3
Dataflow 4
Dataflow 6
Dataflow 8
That’s All
Decomposition of DFDs
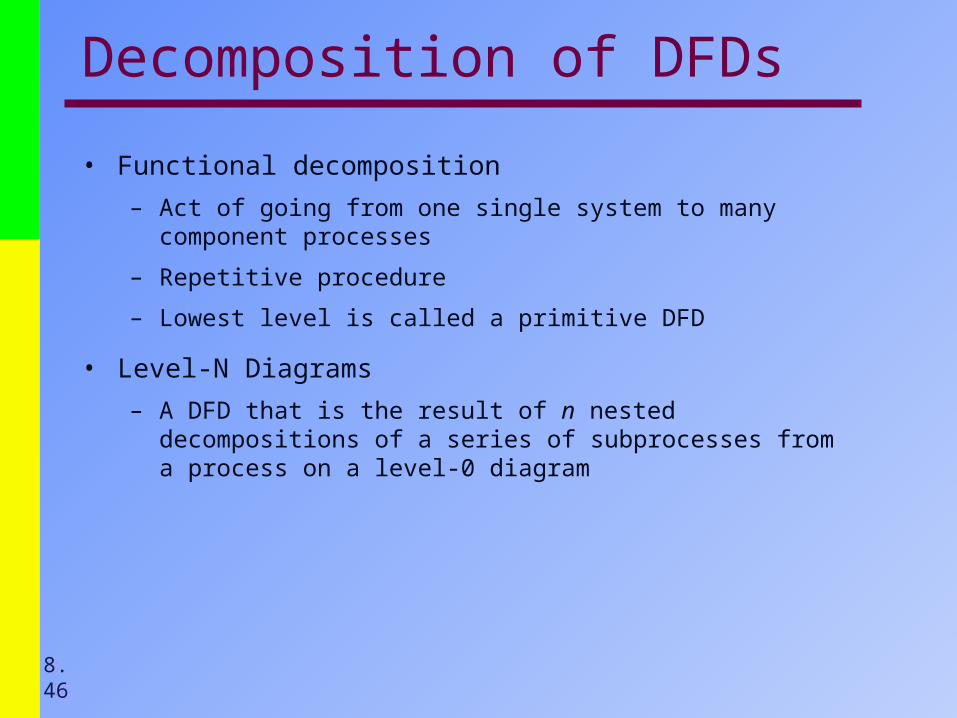
• Functional decomposition
– Act of going from one single system to many component processes
– Repetitive procedure
– Lowest level is called a primitive DFD
• Level-N Diagrams
– A DFD that is the result of n nested decompositions of a series of subprocesses from a process on a level-0 diagram
8.468.46

Relationship Among DFD Relationship Among DFD levelslevels
Level 0 DiagramLevel 0 Diagram
• Shows all the processes that comprise the overall system
• Shows how information moves from and to each process
• Adds data stores

Level 1 DiagramsLevel 1 Diagrams
• Shows all the processes that comprise a single process on the level 0 diagram
• Shows how information moves from and to each of these processes
• Shows in more detail the content of higher level process
• Level 1 diagrams may not be needed for all level 0 processes

Level 2 DiagramsLevel 2 Diagrams
• Shows all processes that comprise a single process on the level 1 diagram
• Shows how information moves from and to each of these processes
• Level 2 diagrams may not be needed for all level 1 processes
• Correctly numbering each process helps the user understand where the process fits into the overall system
• The Data Flow Diagram (DFD) is an essential tool for creating formal descriptions of business processes and data flows.
• Use cases record the input, transformation, and output of business processes.
• Eliciting scenario descriptions and modeling business processes are critically important skills for the systems analyst to master.

Balancing DFDs
• When decomposing a DFD, you must conserve inputs to and outputs from a process at the next level of decomposition
• This is called balancing
• Example: Hoosier Burgers– In Figure 8-4, notice that there is one input to the
system, the customer order
– Three outputs: • Customer receipt
• Food order
• Management reports
8.518.51

Balancing DFDs
• Example (Continued)– Notice Figure 8-5. We have the same inputs and
outputs
– No new inputs or outputs have been introduced
– We can say that the context diagram and level-0 DFD are balanced
8.528.52

Figure 8-4Context diagram of Hoosier Burger’s food ordering system
8.538.53

Figure 8-5Level-0 DFD of Hoosier Burger’s food ordering system
8.548.54

Balancing DFDs
• An unbalanced example– Figure 8-10
– In context diagram, we have one input to the system, A and one output, B
– Level-0 diagram has one additional data flow, C
– These DFDs are not balanced
8.558.55

Figure 8-10An unbalanced set of data flow diagrams(a) Context diagram(b) Level-0 diagram
8.568.56

DFD: Balancing and DFD: Balancing and LevelingLeveling
• When Zooming In, Do Not forget the Parent!
– Parent Process
– Child Diagram
P1P1
P1.2P1.2
P1.1P1.1
P1.3P1.3D1D1
Is th
is C
hild
Dia
gram
Bal
ance
d?
Is th
is C
hild
Dia
gram
Bal
ance
d?

DFD: Exercise Problem Level 0DFD: Exercise Problem Level 0
E1P1
DF1P2
E2
P3DS1
DS2
DF3
DF2
DF3
DF4
DF5
DF6

DFD: Exercise Problem Level 1DFD: Exercise Problem Level 1
P1.1DF1
P1.2E2
P1.3
DS2
DF7 DF9
DF8
DF6
P1.4DF2
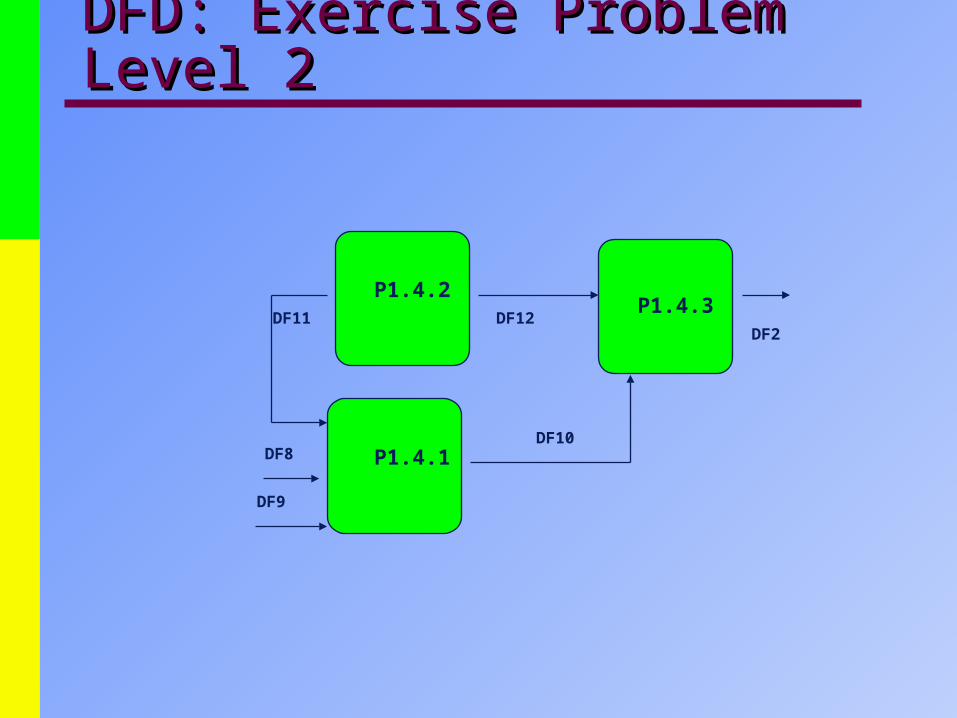
DFD: Exercise Problem Level 2DFD: Exercise Problem Level 2
P1.4.2E2
P1.4.1
DF11 DF12
DF10
P1.4.3DF2
DF8
DF9

Four Different Types of DFDS
• Current Physical– Process label includes an identification of the
technology (people or systems) used to process the data
– Data flows and data stores are labeled with the actual name of the physical media on which data flow or in which data are stored
8.618.61

Four Different Types of DFDS
• Current Logical
– Physical aspects of system are removed as much as possible
– Current system is reduced to data and processes that transform them
• New Logical
– Includes additional functions
– Obsolete functions are removed
– Inefficient data flows are reorganized
• New Physical
– Represents the physical implementation of the new system
8.628.62

Guidelines for Drawing DFDs
• Completeness– DFD must include all components necessary for system
– Each component must be fully described in the project dictionary or CASE repository
• Consistency– The extent to which information contained on one level of a
set of nested DFDs is also included on other levels
• Timing– Time is not represented well on DFDs
– Best to draw DFDs as if the system has never started and will never stop.
8.638.63

Guidelines for Drawing DFDs• Iterative Development
– Analyst should expect to redraw diagram several times before reaching the closest approximation to the system being modeled
• Primitive DFDs– Lowest logical level of decomposition
– Decision has to be made when to stop decomposition
• Rules for stopping decomposition– When each process has been reduced to a single decision,
calculation or database operation
– When each data store represents data about a single entity
– When the system user does not care to see any more detail
8.648.64

Using DFDs as Analysis Tools
• Gap Analysis– The process of discovering discrepancies between
two or more sets of data flow diagrams or discrepancies within a single DFD
• Inefficiencies in a system can often be identified through DFDs
8.658.65

Oracle’s Process Modeler and Functional Hierarchy Diagrams• Process Modeler
– Unique to Oracle
– Similar to DFDS but outputs and methods differ in several ways.
– Table 8-4 illustrates differences
• Functional Hierarchy Diagrams– Picture of various tasks performed in a business and how
they are related
– Tasks are broken down into their various parts
– Does not include data flows
8.668.66

Summary
• Data flow diagrams (DFD)– Symbols
– Rules for creating
– Decomposition
– Balancing
• Four different kinds of DFDs– Current Physical
– Current Logical
– New Logical
– New Physical
8.678.67

Summary
• DFDs for Analysis
• DFDs for Business Process Reengineering (BPR)
• Oracle’s Process Modeler
• Functional Hierarchy Diagrams
8.688.68

Process Decomposition
What do you do when a complex system is too difficult to fully understand when viewed as a whole
We separate a system into its component subsystems, which in turn are decomposed into smaller subsystems, until such a time as we have identified manageable subsets of the overall system.
• This technique is called decomposition.
– Decomposition is the act of breaking a system into its component subsystems, processes, and subprocesses. Each lower level reveals more or less detail) about the overall system
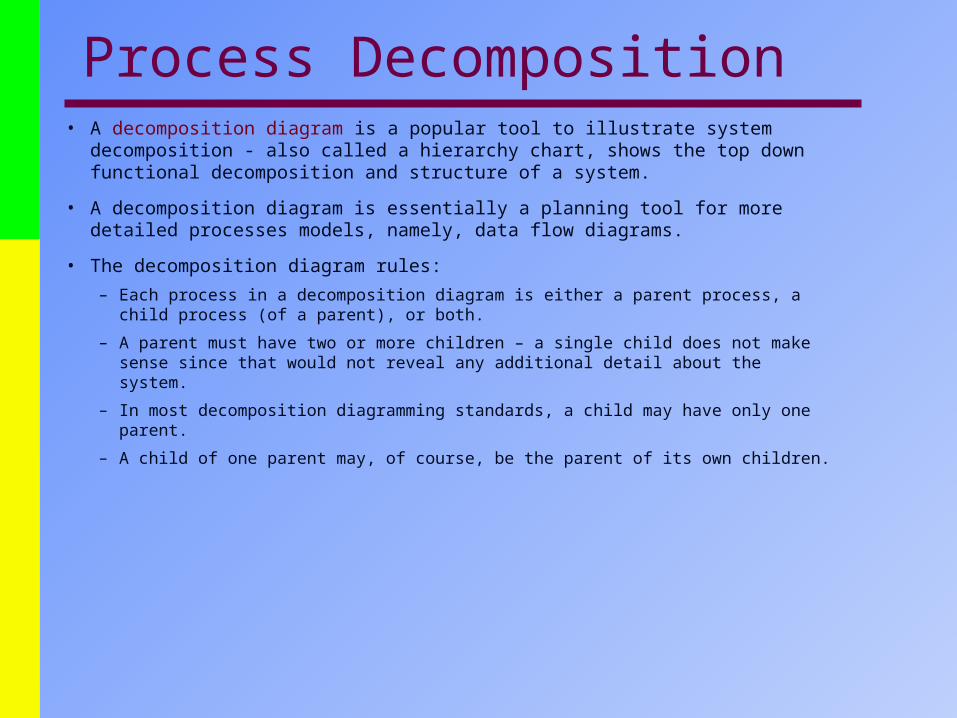
Process Decomposition• A decomposition diagram is a popular tool to illustrate system
decomposition - also called a hierarchy chart, shows the top down functional decomposition and structure of a system.
• A decomposition diagram is essentially a planning tool for more detailed processes models, namely, data flow diagrams.
• The decomposition diagram rules:
– Each process in a decomposition diagram is either a parent process, a child process (of a parent), or both.
– A parent must have two or more children – a single child does not make sense since that would not reveal any additional detail about the system.
– In most decomposition diagramming standards, a child may have only one parent.
– A child of one parent may, of course, be the parent of its own children.

Process Decomposition0
The System
1 A Function
2 Another Function
1.1 Activity of the
Function
1.2 Another Activity of the Function
Task 1.2.2
Task 2.1.1Task 1.1.1
Task 1.1.2
Task 1.1.3
Task 1.2.1
2.2 Another Activity of this Function
2.1 Acivity of this
Function
Task 2.1.2
Task 2.1.3
Task 2.1.4
Task 2.2.1
Task 2.2.2
Task 2.2.3
Process Decomposition
How do you build the hierarchy
• Logical processes are work or actions that must be performed no matter how you implement the system.
• Naming conventions for logical processes depend on where the process is in the decomposition diagram/data flow diagram and type of process depicted.
• There are three types of logical processes: functions, events, and elementary processes
Process Decomposition
• A function is a set of related and on-going activities of the business. A function has no start or end – it just continuously performs its work as needed. – Each of these functions may consist of dozens, or hundreds
of more discrete processes to do support specific activities and tasks.
– Functions serve to group the logically related activities and tasks.
– Functions are named with nouns that reflect the entire function.
– Think of some functions - Payroll, Order Management, Travel System
Process Decomposition's• An event is a logical unit of work that must be completed
as a whole. An event is triggered by a discrete input, and is completed when the process has responded with appropriate outputs. Events are sometimes called transactions.– Functions consist of processes that respond to events.
– Each of these events has a trigger and response that can be defined by its inputs and outputs.
– System functions are ultimately decomposed into business events.
– Each business event is represented by a single process that will respond to that event.
– Name some events for Payroll, OM and Travel

Process Decomposition's• An event process can be further decomposed into
elementary processes that illustrate in detail how the system must respond to an event.
• Elementary processes are discrete, detailed activities or tasks required to complete the response to an event. In other words, they are the lowest level of detail depicted in a process model. A common synonym is primitive process.– Elementary processes should be named with a strong action
verb followed by an object clause that describes what the work is performed on (or for).

DFD: Exercise Problem DFD: Exercise Problem Draw both a Context and Level 1 DFD for Order Entry Department work process at Bebop Records.
Bebop Records is a mail order company that distributes CDs and tapes at discount prices to record club members. When an order processing clerk receives an order form, she verifies that the sender is a club member by checking the MEMBER FILE. If the sender is not a member, the clerk returns the order along with a membership application form. If the customer is a member, the clerk verifies the order item data by checking the ITEM FILE. Then the clerk enters the order data and saves it to the DAIILY ORDERS FILE. At the same time the clerk also prints an invoice and shipping list for each order, which are forwarded to the ORDER FULFILLMENT DEPARTMENT for processing there.

DFD: Exercise Problem DFD: Exercise Problem
A . ( 5 P o in t s ) W h a t i s w r o n g w i th th e fo l lo w in g D F D ?
AcceptC ustom er
In form ation
1
C ustom er
C ustom er
P roduceC ustom er
Invo ice
2
In fo rm a tionF rom C us tom er
C us tom erD a ta
C us tom erO rde r
C us tom erD a ta
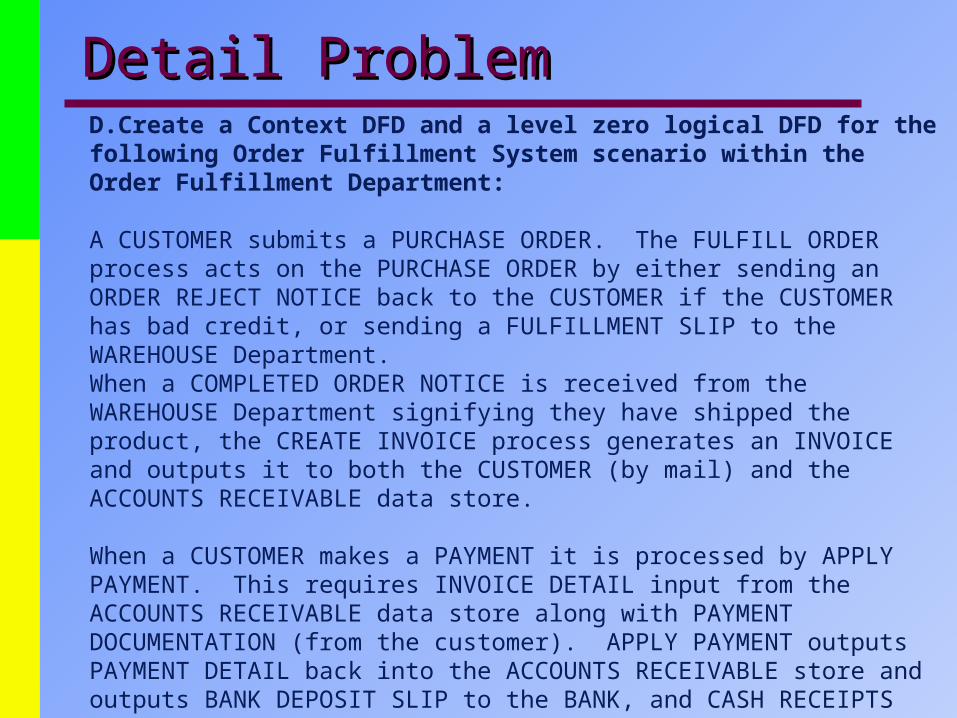
Detail ProblemDetail ProblemD.Create a Context DFD and a level zero logical DFD for the following Order Fulfillment System scenario within the Order Fulfillment Department:
A CUSTOMER submits a PURCHASE ORDER. The FULFILL ORDER process acts on the PURCHASE ORDER by either sending an ORDER REJECT NOTICE back to the CUSTOMER if the CUSTOMER has bad credit, or sending a FULFILLMENT SLIP to the WAREHOUSE Department. When a COMPLETED ORDER NOTICE is received from the WAREHOUSE Department signifying they have shipped the product, the CREATE INVOICE process generates an INVOICE and outputs it to both the CUSTOMER (by mail) and the ACCOUNTS RECEIVABLE data store.
When a CUSTOMER makes a PAYMENT it is processed by APPLY PAYMENT. This requires INVOICE DETAIL input from the ACCOUNTS RECEIVABLE data store along with PAYMENT DOCUMENTATION (from the customer). APPLY PAYMENT outputs PAYMENT DETAIL back into the ACCOUNTS RECEIVABLE store and outputs BANK DEPOSIT SLIP to the BANK, and CASH RECEIPTS ENTRY to the ACCOUNTING Department.