Investigation causes of pavement structure failure using ...

UNIVERSITY OF NAIROBI
SCHOOL OF COMPUTING & INFORMATICS
TITLE: INFORMATION SYSTEM FAILURE CAUSES-AN
INVESTIGATION IN KENYAN ORGANIZATIONS 7
BYESTHER A. MUKOYA
P56/P/7530/2005
SUPERVISOR: Chepken. K. C
Submitted in partial fulfillment of the requirements of the Master of Science in Information Systems
October 2009,
university of NAIROBI Library
IHJ!0378984 9
\

Declaration
This project, as presented in this report, is my original work and has not been
presented for any other university award.
Student: Esther Mukoya Registration No.: P/56/P/7530/2005
Sign: Date: ...3̂ .&$&... ,2-Sdl
This project has been submitted as part-fulfillment of the requirement for Masters
of Science in Information Systems of the University of Nairobi with my approval as
the University Supervisor.
Supervisor: Chepken K. C
Date: lo ll^JihsPS
School of Computing & Informatics University of NAIROBI
P. 0. Box 30197 NAIROBI
Page i

Dedication
This project is dedicated with great appreciation to my best friends and companions
Martin Gwada and Kesley Gwada.

LIST OF TABLESTable 2-1: Defining ‘Issues of Influence’ under three ‘Spheres of Influence’ (Yeo, 2002)....................................................................................................................................................... 24Table 2-2: Top 5 failure factors under Sp, SI and S2 (Yeo, 2002)..................................... 24Table 4-1 : Failure Classifications (Chris Sauer)...................................................................33Table 4-2: Factors that lead to failures from survey.............................................................. 36Table 4-3: CHAOS success points adapted from Standish Chaos R eport.........................43Table 4-4: Chaos failure points adapted from Standish Chaos report.................................43Table 4-5: Relative importance scores of the factors of failures from survey responses.44Table 4-6: Categories and related indicators o f factors for failure...................................... 45Table 4-7: Proposed IS failure model and descriptions........................................................ 49Table 5-1: Evaluation Results.................................................................................................... 52

LIST OF FIGURESFigure 2-1: Descriptive framework for ICT success or Failure (David Gichoya, 2005)...20Figure 2-2: IS Sphere Model (Feghali, T. and Zbib, I.J. 2007)............................................ 22Figure 2-3: IS/IT projects success/failure factors model (Yeo, 2002,)................................ 23Figure 2-4: Project Success Model (Douglas Havelka, Kimberly Conrad, and BonnieGlassberg).................................................................................................................................... 25Figure 3-1: Research design...................................................................................................... 26Figure 3-2-System Architecture of proposed prototype system........................................... 30Figure 3-3-Context Data Flow Diagram of proposed prototype system .............................31Figure 4-1: Which sector is your organization primarily in ? ................................................34Figure 4-2: How long have you been involved in ICT project development?................... 35Figure 4-3: On average, how many projects have you undertaken?....................................35Figure 4-4: Project outcomes..................................................................................................... 36Figure 4-5: percentage o f Yes Responses for stages at which IS projects fail................... 37Figure 4-6: Percentage of Yes Responses to ISD practices...................................................38Figure 4-7: Level of participation in application development............................................ 39Figure 4-8: Opinions on application systems..........................................................................41Figure 4-9: problems encountered............................................................................................ 41Figure 4-10: Probable causes o f problem s.............................................................................. 42Figure 7-1 Login Screen.............................................................................................................57Figure 7-2 System u sers .............................................................................................................58Figure 7-3 Parameters................................................................................................................. 59Figure 7-4 Computation welcome screen................................................................................ 60Figure 7-5: Computation............................................................................................................60Figure 7-6: R eport.......................................................................................................................61
Page iv

Table of Contents
Declaration.......................................................................................................................................iDedication.......................................................................................................................................iiTable of Contents...........................................................................................................................vAcknowledgments...................................................................................................................... viiAbstract........................................................................................................................................... 11. CHAPTER 1: INTRODUCTION...........................................................................................2
1.1. Problem Definition........................................................................................................... 31.2. Research Questions........................................................................................................... 41.3. Objectives...........................................................................................................................41.4. Project Scope..................................................................................................................... 51.5. Project Justification.......................................................................................................... 5
2. CHAPTER 2-LITERATURE REVIEW ............................................................................... 72.1. Concept o f Information Systems.....................................................................................72.2. Project Success and Failure Criteria............................................................................... 8
2.2.1. Success.........................................................................................................................82.2.2. Failure........................................................................................................................102.2.3. Project stakeholders.................................................................................................112.2.4. Process/Product....................................................................................................... 112.2.5. Technical vs. Non-Technical Issues......................................................................12
2.3. Some Major Factors o f Failure......................................................................................172.3.1. Lack of top management commitment to the project......................................... 172.3.2. Incomplete/Changing Requirements.....................................................................172.3.3. Poor Planning...........................................................................................................182.3.4. Under Funding and Bad Estimations.....................................................................182.3.5. Poor Relationship Management............................................................................. 18
2.4. Research Models.............................................................................................................. 192.4.1. The ITPOSMO m odel............................................................................................ 192.4.2. A descriptive conceptual framework for developing countries context...........192.4.3. IS Sphere M odel......................................................................................................212.4.4. Yeo IS projects success/failure factors model.....................................................222.4.5. Project Success M odel............................................................................................ 24
3. CHAPTER 3: RESEARCH METHODOLOGY................................................................263.1. Data gathering Process...................................................................................................273.2. Survey Instrument........................................................................................................... 27
3.2.1. Questionnaire design Considerations................................................................... 273.2.2. Sampling Technique and Sample S ize.................................................................29
3.3. System Design and Development................................................................................. 303.3.1. System Design......................................................................................................... 303.3.2. Computation of the success Potential................................................................... 313.3.3. Hardware, Software and Interface.........................................................................32
4. CHAPTER 4: FINDINGS AND DATA ANALYSIS....................................................... 334.1. Results and Findings.....................................................................................................33
Page v
4.1.1. IS project failure definition.................................................................................... 334.2. Data Analysis................................................................................................................... 344.3. Analysis o f user perceptions on failure....................................................................... 384.4. Calculation of relative importance scores for the factors......................................... 424.5. Framework for the Proposed IS failure M odel...........................................................444.6. Dimensions and Descriptions of the proposed m odel............................................... 45
5. CHAPTER 5: DISCUSSIONS............................................................................................. 505.1. Discussions.......................................................................................................................50
5.1.1. O verview .................................................................................................................. 505.1.2. Objective one resu lts.............................................................................................. 505.1.3. Objective two results.............................................................................................. 505.1.4. Objective three results............................................................................................ 515.1.5. Objective four results.............................................................................................. 51
5.2. Evaluation of the M odel.................................................................................................525.3. Limitations of the study..................................................................................................52
6. CHAPTER 6: CONCLUSION AND RECOMMENDATIONS......................................546.1. Conclusions..................................................................................................................... 546.2. Recommendations for Further research........................................................................546.3. REFERENCES................................................................................................................55
7. APPENDIX............................................................................................................................. 577.1. Appendix A -U ser Manual -System Description........................................................577.2. Appendix B- Program C ode..........................................................................................627.3. Appendix C: Questionnaire analysis............................................................................647.4. Appendix D-Sample Questionnaires............................................................................66
Page vi

AcknowledgmentsFirst and most, I want to thank my God for His grace in giving me strength and single-
mindedness that has enabled me to come this far in this post-graduate program.
To my mother, Angeline Mukoya, who taught me, quite early, that I can be what I want.
She has especially been an inexhaustible source of impetus in this program.
I wish to express my gratitude to Mr. Chepken, my MSc project supervisor, for his
competent and empathetic guidance through the entire project. Your prolific experience
put issues in the correct perspective for me.
Thanks also to my classmates in the postgraduate program, especially Mr. Omondi
Charles and Winston Ojenge for their direction and support. You always had constant and
eye-opening suggestions for my research.
My special thanks go to the companies that participated in this research, most notably,
Mr. Robert Kuloba, Acting director Research and Development Utalii College and Mr.
Gichohi ICT manager Utalii college, KCCT ICT department staff, Davis and Shirtliif ICT
department, Grand Regency ICT manager, Jonah Gekara Computer programmer,
Computer Castles and Mr. Chebii of the Government of Information Technology (GIT)
Kenya for the interesting and enthusiastic interviews.
Lastly, I wish to remember my dear sister, Emily Mukoya’s compassionate words in
times when I almost gave up.
Page vii

Abstract
Information system development failures still plague the software development industry despite
advances in the development process. Learning from an Information System Development Project
(ISDP) failure plays a key role in the long term success of Information systems development
process. In addition, learning from failure assumes a higher level of significance in the context of
Kenya, a developing country since it is very important that the scarce resources are optimally
utilized. This thesis reports on several causes of failed ISDP to inform the reader about the various
complexities involved in information systems development projects in Kenya.
To investigate the situation of IS/IT projects failure, it is critical to clarify criteria of success/failure,
identify influential factors, and finally propose appropriate recommendations through realizing
reasons behind the causes of failure. The research reveals that managerial/strategic and cultural
factors have the most influential impact for that matter. It is mandated that Kenyan organizations
promote the commitment and support of senior management, raise general awareness for IS/IT
projects’ structure and functionality, and foster a correct cultural context to prevent failure in this
kind of projects.
The major aim of the research was to propose a model that outlines the major causes and indicators
that may lead to Information System Project Failures. Other objectives carried out in the research
include; investigation of various system development practices and finding out of factors that lead
to IS development failures in Kenyan organizations. This research was carried out by use of
questionnaires and interviews to IS practitioners and users in Kenyan organizations.
The outcome of this thesis is a model of several causes of failure in ISDP process. A prototype
system was developed from the model to help Project Manager gauge the viability of a project
before and during the development. This model enhances the understanding of the broad range of
factors that influence the success of information systems development (ISD) projects.
Page 1

1. CHAPTER 1: INTRODUCTION
Most contemporary firms face dramatic pressures for continual change and adaptation in their
business environments. Pressures toward globalization, competitive agility, and customer
centeredness are compelling firms to re-examine their traditional structures and work processes and
engineer new value-adding processes. Further, information technologies are becoming critical to
the capabilities developed by firms to compete effectively in the emerging information-intensive
business environments. As a result, firms are investing significantly in ICT projects for building
seamless ICT processes, and knowledge-based applications for competitive agility.
Most of these organizations spend millions of dollars each year on the acquisition, design,
development, implementation, and maintenance of information systems vital to their mission
programs and administrative functions. The need for safe, secure, and reliable system solutions is
heightened by the increasing dependence on computer systems and technology to provide services
and develop products, administer daily activities, and perform short- and long-term management
functions.
Information Systems failures are rarely publicized as widely as IS successes. This is despite the fact
that, lessons gleaned from past IS failures may keep organizations from repeating the same foibles
over and over again. Failure is defined not only by the metric of technical performance inadequacy,
but also by organizations' inability to successfully select needed technology; implement
technology; resolve conflicts between various factions and departments; resistance of users in
accepting IS products; and failure to accurately project future needs
Heeks (2003) conducted an investigation of e-government projects in developing countries. The
results of his survey show an extremely disappointing position: 35% projects are total failures, 50%
projects are partial failures, and 15% projects are successes.
It is evident from literature that a substantial portion of total IS projects ends in full or partial
failures. Results of some existing studies from Kenya and other developing countries are:
❖ David Gichoya (2005) has reported widespread failure of ICTs in Government of Kenya.
❖ Baark and Heeks (1999) found that all donor-funded projects in China were partial failures.
❖ Moussa and Schware (1992) concluded that almost all World Bank-funded projects in
Africa were partial failures
The IS failure research is of paramount importance in developing countries where the failure rate is
higher as compared to industrialized countries. This scenario has established the need for studying
Page 2

ISDP in Kenya, especially the failed ones. It may be said that there are more opportunities and
lessons for learning from failed IS projects than there are from the successful IS projects.
This research is of significance to a wide audience in the IS community who are interested in
understanding the impact and various factors that lead to failure of an ISDP in the peculiar
environment of a developing country like Kenya. The end product of this project is a model of the
factors that cause IS failures. Essentially, the frequencies of the responses to each of the questions
within the survey instrument are used to populate the proposed model. Each project component
included within the model is represented as a survey question. The completed model can easily
perform an analysis in order to isolate the probable effect of a component (variable) on overall
project success/failure.
These findings are important because they can assist managers in early evaluation of on-going
projects and enable them to address the investigated development issues
1.1. Problem Definition
Information systems development is a complex process. Most Information systems projects are
challenging because they require attention to the interests, motivations, expectations, and actions of
a variety of stakeholders, including IS professionals, senior management, business management,
and external partners, such as vendors and consultants. Further, a variety of institutional, social, and
technological factors usually affect progress on such projects and the prospects for successful
outcomes from these projects. In fact, the literature is filled with examples of failed efforts.
Therefore, a deeper understanding of complexity of Information systems projects in organizations
is required; the factors that should be addressed in the successful management of IS projects. The
processes that are likely to be effective in such projects.
Research suggests that failed projects suffer from the poor management of people- related problems
rather than technical problems; [Linberg 1999; Sumner 1999; DeMarco and Lister 1999] however,
it is important to analyze project failures from all perspectives. Poor software development
practices places organizational resources, such as time, money and the pool of software
practitioners (programmers, database developers, system analysts, etc.) at risk.A.
Practitioners become burned out, de-motivated and are likely to have decreased personal
productivity. This may lead to increased staff turnover, which again leads to lower (team)
productivity. The end-result is that time; money and organizational goodwill are placed at further
risk. Unfortunately, commonly used productivity and cost metrics only provide project managers
with a ‘snap shot’ of the current state of the project.
Most information systems development projects have failed to meet their goals such as satisfaction
of end-user needs, development within budgeted costs, implementation on time, and development
Page 3

in accordance with organizational standards. This is mainly because many organizations practice
adhoc-development. This is where systems development often takes place in a rather chaotic and
haphazard manner relying entirely on the skills and experience of the individual staff members
performing the work. Adhoc development may be practiced entirely or for subset of the
development (small projects).
With this kind of development, process capability is unpredictable because the software process is
constantly changed or modified as the work progresses. Schedules, budgets, functionality and
product quality are generally inconsistent. Performance depends on capabilities of individuals and
varies with their innate skills, knowledge and motivations. Performance can only be predicted by
individual capability rather than organizational capability. Success that rests solely on the
availability of specific individuals provides no basis for long term productivity and quality
improvement throughout an organization.
With the existence of an organization-wide software process, system development process does not
entirely depend on the same individuals being available for each system development project.
Information System projects can produce excellent results through both the heroic efforts of a
dedicated team and mature proven software process.
1.2. Research Questions
The questions that were pertinent in this research are;
❖ What information system development practices lead to IS failures?
❖ Is it possible to determine whether or not an information system will fail in the early stages?
1.3. Objectives
The main objective of this research was to propose a model that outlines the causes and indicators
that may lead to ISDP failures in Kenyan organizations.
Other objectives include:
❖ To investigate various systems development practices by different organizations
❖ To find out the factors of IS development project failures occurring in Kenyan organizations.
❖ To devise a model of the indicators of information system and project failure based on a
literature review and survey
❖ To develop a prototype system that can be used to calculate the success potential of an
Software project
Page 4
>

1.4. Project Scope
The range of issues concerning the general topic of Information system project failures is vast -
defining criteria for project success/failure, identifying factors, investigating the reasons behind
existence of these factors and also bringing up solutions to tackle these causes - which requires a
large volume of research to cover all these related aspects. To narrow down this large array of
issues and become more specific, this research is aiming to address the area of factors triggering the
Information System project failures in Kenyan organizations employing these systems.
Moreover, the failure analysis of Information System projects is drastically multi-faceted in terms
of the perspective from which the topic is examined. The survey subjects’ being studied in the
course of this research are mostly all IT practitioners and IS users who have been involved in
development of an Information system. This being said, the viewpoints of other key stakeholders
such as senior management in hosting organizations (project sponsors), any system users, etc. are
not taken into account for the sake of limiting the scope of the research. The different role players
in a project could have different appreciation of failure factors attributing a project which keeps the
subject open for further research.
This research does not intend to make any distinction among the type of organizations in its
investigation and study them collectively regardless of being public or private sector and the nature
of the business they are involved in. Time and again academic researches have shown evidence that
the typology of organizations employing an IS/IT project could be a significant parameter to be
considered when scrutinizing the failure of IS/IT projects that again will keep the doors open for an
expansion to the present research.
The study confined itself to factors that lead to failure in Information system development
processes. This study did not focus on technological specifications and detailed financial costs.
1.5. Project Justification
This study provided a greater understanding of some of the components of the software
development process leading to cancelled, or projects that are delivered late and over-budget,
and/or do not meet customer/user requirements. This project research sought to focus management
attention on the importance of a number of failure components of the software development
process. Downstream problems can be avoided or lessened if these components receive more
managerial attention. This project research can be used to raise awareness among project managers
of the potential downstream impact of their actions (or inactions) during a software development
process. The impact includes various aspects of the resulting software product, including its
timeliness of delivery, affordability and ability to meet customer/user requirements. This study was
Page 5

also intended to help make the development process more repeatable, resulting in better project
estimation and planning.
Increasingly, organizations have no choice but to adopt and follow a systems development process.
Many organizations have aggressively committed to total quality management goals to increase
competitive advantage. There is a need for organizations to understand the best approaches to
employ in a particular system development process, hence need for a systematic and uniform
process for information systems development. The IS development failure in Kenya poses more
importance for learning and investigation of causes of failure, as the failure not only wastes the
allocated resources but also discourages further investment.
Kenya, a third world country, has limited availability of resources such as money and skilled power
and suffers uncertain political environment. Thus opportunity costs are unquestionably high with
ISDP failures. For these reasons a failure in development of IS in Kenya creates a significantly
important area of research. This research is significant because it identifies key practices in systems
development processes across different organizational sectors. In this regard the study tries to find
out practices of system development in some organizations. The guidance provided at the end of
this research can be tailored to the individual project based on cost, complexity, scope of the effort,
needs of the decision authorities and criticality to the organization’s mission. Further, managers can
use the insight gained to evaluate the status of an on-going development project while it is still
early enough to take corrective action, regardless of the methodology used
Several previous Researches have been done on the factors that lead to Information System Failures
and they continually show that companies have difficulty with information technology (IT) projects
to complete on time or on budget. In fact many are cancelled before completion or not
implemented. A1 Neimat, Taimour (2005)
In his research on “Factors Affecting the Successful Implementation of ICT Projects in Kenya
Government” David Gichoya (2005) mentioned that factors of failure can either be barriers or
inhibitors. Barriers are those occurrences that hinder ICT implementation. While Inhibitors do not
necessarily prevent the implementation of ICT projects but they do prevent advancement and
restrict successful implementation and sustainability.
Page 6
.v

CHAPTER 2-LITERATURE REVIEW
1.6. Concept of Information Systems
In the modern economy of today’s world, enterprises are largely investing in information systems
and technology and particularly in the ways these can help them in managing their businesses. This
transition has appeared to be an indispensable change in most of prosperous companies on the
ground that it is increasingly believed these investments could be rich sources of competitive
advantage (Gardner, 1998). The term of ‘information systems’ has originally born to refer to any
wide variety of computing hardware, communication technology and software combinations
designed to manipulate information related to certain business processes (Flowers, 1996). It is
believed that the concept of information systems is fundamentally interdisciplinary to the extent
that technological disciplines intersect with managerial, psychological and sociological paradigms
(Yeo, 2002).
There has been enormous research on the processes and outcomes of information systems
development in organizations. Several studies have generated a wealth of findings and knowledge
about effective management of system development processes. According to a study by Kirsch,
Laurie J (2000), the development of an integrative framework for Information system development
process consists of seven core concepts;
❖ Tasks- These are distinct work activities carried out for a distinct purpose. In the ISD
context, a task is a work done to build the system and can vary from project to project.
❖ Stakeholders- These are persons or a group of people with a vested interest in the outcome
of and Information System Development project. Examples include: the project manager,
analysts, programmers, management, vendors and consultants.
❖ Agenda- A set of goals, objectives or expectations relative to the development effort.
Agenda may include task related goals such as satisfaction of end-users, development
within budgeted costs, implementation on time and development in accordance with
organizational standards.
❖ Transactions- refer to specific informal and formal means through which stakeholdersA.
ensure that appropriate tasks are completed.
❖ Context- refers to occurrences or incidents outside of the project team but which affected
the teams work and the course of the project. The incidents are triggers that have an impact
on downstream activities of the team.
❖ Structure- Structure is defined as the “policies and activities occurring within the
organization that prescribe or restrict the behavior of organization members.” In the
Page 7
_y

Information System Development context there are three likely sources of structure:
methodologies, development tools, and organizational policies and rules.
❖ Outcomes- These are results realized at any point during the Information systems
development process. The outcomes may be the result of a planned or unplanned evaluation.
1.7. Project Success and Failure Criteria
Projects that meet agreed upon business objectives, and are completed on time and within budget
make up the generally accepted industry ‘standard’ organizational/managerial definition of project
success. User satisfaction is the single most widely cited measure of system success in the
information systems literature. From this the opposite can be assumed to be true, that projects that
DO NOT meet agreed business objectives, and are NOT completed on time and NOT within the
budget make up the definition of project failure. This definition has traditionally been used because
it is, in part, relatively easy to measure.
The facts of the lists of characteristics to successful or failed projects vary a lot in their scope and
purpose; they are either very general or very specific related only to a special case (Pinto & Slevin,
1989). Horine (2005) has come up with some sensible reasons to answer why finding attributes of a
successful/failed project is not at all a straightforward matter. He believes that lack of a universal
harmony to compromise project success/failure metrics, lack of common collective acceptance
standards among all key stakeholders engaged in a certain project, and the discrepancy between
what business companies call project success/failure and that of textbooks which investigate the
matter from a theoretical and utopian viewpoint are amongst the most important reasons.
1.7.1. Success
From a global perspective, Kerzner (2003) has described a successful project with seven
characteristics as ‘critical success factors’ (CSFs);
❖ within the planned time,
❖ within the predicted budget,
❖ aligned with expected performance and specification level,
❖ accepted by the client,
❖ minimum or mutually agreed on scope alterations,
❖ minimum disturbance of the main stream of work flow in the host organization,
❖ the least effect on the corporate culture.
Duncan (1987), Blaney (1989) and Redmill (1990) also explicitly have nominated these criteria for
a project success; whereas the last three ones are more contemporary needing more speculation.
Kerzner (2003) discusses that in modern project management, it is almost impossible to see that a
Page 8
\

project is finished without any alteration in its initial scope which in turn might diminish the morale
of the work or eventually even bring the project to a total halt. It is advisable to keep the level of
change for project scope to its minimum and those really needed to be taken into account should be
in complete consensus of both project manager and client. Possible disruptions occurring in the
every day’s work flow in the host organization because of the ongoing project is the other issue. By
mistake many project managers might think of the project as a stand-alone entity happening in an
organization which is not always possible. A viable project should be managed within the
guidelines, policies, procedures, rules and directives of the host company. The corporate culture is
the other focal issue. A project destined to success can not deviated from cultural norms reigning a
certain parent company even though the project’s nature, its management and team are essentially
not aligned with those cultural values. Successful project notation and excellence in project
management in an organization is only and only achieved through a continuous stream of managed
projects which requires strong and visible corporate commitment to project management concept.
Several studies have shown that there is great disagreement on how different role-players such as
project users or IT managers are weighing success/failure definitions. When it comes to IT
managers’ point of view, while they believe in ‘meeting user requirements’ as both a success and
failure criterion, they prioritize ‘meeting timescales and budgets’ as to avoid project failures and
‘meeting expected quality’ and ‘organization’s commercial prosperity’ as significant signs for a
successful project. On the other hand, from project users’ perspective, where ‘meeting user
requirements’ and ‘staying in the planned budget’ are recognized as criteria for both success and
failure, they specifically identify their own ‘happiness’ as a success criterion and ‘achieving project
purpose’ as a failure criterion. These results will bring out two main conclusions; firstly the criteria
for project success must be agreed on by all the engaged parties far before the actual project gets
started and it should get reviewed constantly as the project goes ahead. Since most of the success
criteria are subjective issues, they are strongly prone to change. The definition ‘good quality should
be clearly depicted in the mind of all main stakeholders at the very beginning of the project. IT
managers might define quality as maintainability, capacity for expansion or efficiency whereas
project users could describe it as usability or responsiveness to system request.A.
Horine (2005) from an idealistic perspective summarizes a comprehensive score of qualities and
traits common among those most successful projects. He from an academic point of view believes
that although no two projects are completely identical and each has its own set of unique
challenges, there exists always a shared core of principles lying at the heart of any project success.
A successful project should:
• Be aligned with organizational objectives
• Have effective top-management supportPage 9

Have effective and competent leadership
Address all key stakeholders’ agreement on the purpose, goals, and scope of the project
Address all key stakeholders’ shared common vision on the project results
Address all key stakeholders’ shared realistic expectations for the project results
Have results that meet the expectations of the key stakeholders
Be able to manage and validate stakeholders’ expectations constantly all the way to the end
Make an investment in proper planning
Have clearly defined and agreed upon scope, approach, and deliverables during planning
Communicate clearly each stockholder’s and team member's role(s) and responsibilities
Place a high priority on accurate and complete work effort estimates
Develop and agree upon a realistic schedule
Make the project team to have a strong results-focus and customer-orientation
Provide consistent, effective, and focused on ‘understanding’ project communications
Measure project progress consistently from the current baseline
Pursue aggressively project issues and subsequent action items
Foster a strong sense of collaboration and teamwork
Manage closely expectations and changes surrounding scope, quality, schedule, and cost
Provide skilled project resources when needed
Identify proactively risk and determine mitigation strategies to reduce project exposure
Anticipate and overcome obstacles to ensure project meets objectives
1.7.2. Failure
The complex nature of finding a definition of failure due to the need to consider various
stakeholders is important when looking at software development projects.
In order to get a concisely focused definition of project failure, it is first appropriate to present
some considerations and components of project failure. Specifically, there are three major factors
that influence the notion of project ‘failure’:
i. The perspective of one or more project stakeholders, influenced by the culture, practices
and system-related goals of the organization being asked to define failure. Various
Stakeholder perspective influences his/her perception of project failure, as all aspects of
project development are filtered through this perception.
ii. The development process and/or the resulting software product. Failure factors of the
development process can be considered in relation to a particular stage of the product
lifecycle.
iii. The Non-technical and/or technical focus.
Page 10

An additional failure consideration for many software development managers is that a project
results in cancellation. In the strict sense of intention to design, construct and deliver a completed
software-based product, termination should be considered a failure, at least to some extent.
Regardless of whether a project is considered to be a failure or not, cancellation is clearly not the
most desirable outcome for any project stakeholder. The Standish Group’s widely cited research
equates project cancellation with failure.
1.7.3. Project stakeholders
The variety of project stakeholders adds some complexity to the task of defining project failure. A
schema for system evaluation developed by Klein and Jiang [2001] includes the following typical
project stakeholders:
Senior/Executive Management: Oversee project managers, provide political support for this project,
and may interact with MIS management, project managers and/or customer/users.
Project Manager. Oversee the project development team and interacts with customer/users.
Customer/user: Pays for and/or uses the completed software system.
Software Practitioner. Includes programmers, database designers and system analysts.
Senior Management interacts with the Software Project Manager, who interacts with both
Developers/IT Professionals and the Customer and Users. Developers and IT Professionals interact
with their Software Project Manager and the Customer and Users. Finally, the Customer and Users
interact with the Software Project Manager and Developers and IT Professionals. In some
instances, there is also interaction between Senior Management and the Customer and Users.
Each of these groups brings different backgrounds, and has different expectations and
understanding of any metric that might be collected in order to evaluate project success or failure.
1.7.4. Process/Product
Process/Project management: including meeting cost, schedule and quality objectives, quality of
project management process itself and the satisfaction of project stakeholders needs as they relate
to project management process.
Product-, including effects of the final product as they relate to meeting the goals and purpose of the
system, business outcomes (including'dmpacts at both the organizational and individual levels),
technical performance of the system, efficiency of the product’s operations (considering cost, time
and productivity), end-user satisfaction with the completed system and the personal satisfaction of
development staff (including professional growth, and challenging and interesting work).
Page 11
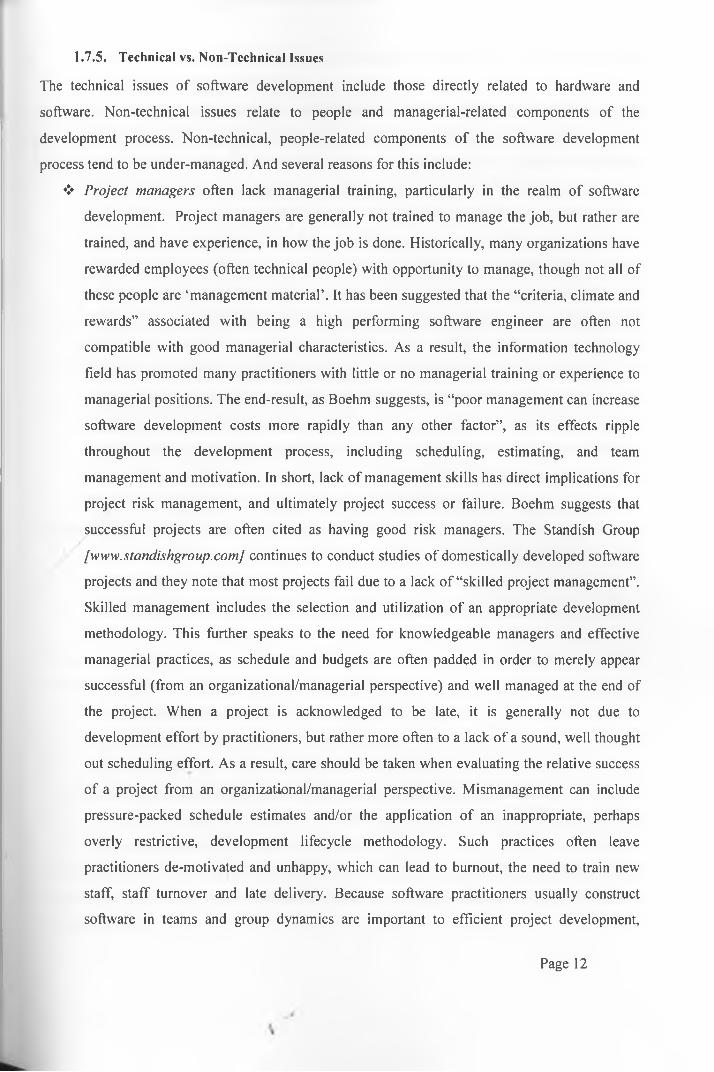
1.7.5. Technical vs. Non-Technical Issues
The technical issues of software development include those directly related to hardware and
software. Non-technical issues relate to people and managerial-related components of the
development process. Non-technical, people-related components of the software development
process tend to be under-managed. And several reasons for this include:
❖ Project managers often lack managerial training, particularly in the realm of software
development. Project managers are generally not trained to manage the job, but rather are
trained, and have experience, in how the job is done. Historically, many organizations have
rewarded employees (often technical people) with opportunity to manage, though not all of
these people are ‘management material’. It has been suggested that the “criteria, climate and
rewards” associated with being a high performing software engineer are often not
compatible with good managerial characteristics. As a result, the information technology
field has promoted many practitioners with little or no managerial training or experience to
managerial positions. The end-result, as Boehm suggests, is “poor management can increase
software development costs more rapidly than any other factor”, as its effects ripple
throughout the development process, including scheduling, estimating, and team
management and motivation. In short, lack of management skills has direct implications for
project risk management, and ultimately project success or failure. Boehm suggests that
successful projects are often cited as having good risk managers. The Standish Group
[www.standishgroup.com] continues to conduct studies of domestically developed software
projects and they note that most projects fail due to a lack of “skilled project management”.
Skilled management includes the selection and utilization of an appropriate development
methodology. This further speaks to the need for knowledgeable managers and effective
managerial practices, as schedule and budgets are often padded in order to merely appear
successful (from an organizational/managerial perspective) and well managed at the end of
the project. When a project is acknowledged to be late, it is generally not due to
development effort by practitioners, but rather more often to a lack of a sound, well thought
out scheduling effort. As a result, care should be taken when evaluating the relative success
of a project from an organizational/managerial perspective. Mismanagement can include
pressure-packed schedule estimates and/or the application of an inappropriate, perhaps
overly restrictive, development lifecycle methodology. Such practices often leave
practitioners de-motivated and unhappy, which can lead to burnout, the need to train new
staff, staff turnover and late delivery. Because software practitioners usually construct
software in teams and group dynamics are important to efficient project development,
Page 12

turnover interferes with the formation of cohesive and productive development teams,
which in turn hampers productivity.
• The High-Tech Illusion: DeMarco and Lister [1999] described the “High-Tech Illusion” as a
second reason why managerial effort and emphasis is so often placed on technical issues.
That is, anyone who is professionally involved in a relatively new technology, such as
software development, believes that he or she is in an “intrinsically high-tech business”. As
a result, they tend to over-manage technical issues and lose sight of the critical and on-going
role that people, particularly software practitioners, play in these ‘high-tech’ businesses.
Managing technical issues tends to be more straightforward than managing people. A third
reason for under-management of the non-technical issues is that managing technical issues
tends to be more straightforward than managing people, who ‘come pre-packaged’ with
their unique personalities, strengths, weaknesses and opinions. Related to this are the
managers of development projects who have some difficulty in relating to practitioners, in
terms of their different professional roles within the development process. In addition, the
practitioners’ perception of project success does not necessarily match that of project
manager or the more senior management within the organization for which the system is
being developed. Managers who attempt to motivate their development team as they
themselves would prefer to be motivated are not likely to succeed
Some notable research has failure divided into two phases:
• development failures (goals, technology, economy, view of organization, process
characteristics, self-image) and
• Use failures (technical solution, data problems, conceptual problems, people reactions,
complexity).
Chris Sauer highlights five main indicators of failure. This classification provides a suitable
framework to help make initial diagnosis of the type of failure.
• Correspondence failure-T a\\ure to achieve predefined objectives
• Process failure-Failure to produce a system in given limits
• Interaction failure-Leve\ of use or user satisfaction failure
• Expectation failure-Inability to-meet the expectations of specific stakeholder
• Terminal failure-Project terminated, can’t be tolerated more. The ability to abandon the
project when there is no probability of success.
In this research, IS failure has been defined as any phenomenon that hinders the success of an
information system during development, installation, deployment, implementation and continuous
use of that system.
Page 13

Heeks (2002) observes that there is a big difference between ICT implementation and use between
developed and developing countries. However, Westrup (2002) observes that similarities can also
be expected. These similarities include funds which are never sufficient, bureaucracy and user
needs. The difference is how problems are addressed in different countries. Most developing
countries are characterized by limited computer applications, inadequate infrastructure and shortage
of skilled manpower (Odedra 1993). Odedra (1993) notes that “this situation exists not merely due
to lack of financial resources, but largely due to lack of coordination at different levels in making
effective use of the technology”. This uncoordinated efforts can only result in duplication if each
department implements its own IS projects without due regard to compatibility within the
government.
Poulymenakou and Serafeimidis (1997) from the London School of Economics, UK, feel that IS
can be perceived to fail in three different ways:
❖ during development;
❖ at the stage of introduction to the users’ organization (implementation); or
❖ at some point during their operation.
They found that in the unsuccessful IT projects, the project was managed as a technology project.
An IT project can often lead to failure because of the lack of human considerations. Some of the
elements of failure identified were:
❖ approaches to the conception of systems;
❖ IS development issues (e.g. user involvement);
❖ systems planning;
❖ organizational roles of IS professionals;
❖ organizational politics;
❖ organizational culture;
❖ skill resources;
❖ development practices (e.g. participation);
❖ management of change through IT;
♦> project management;
❖ monetary impact of failure;
❖ “soft” and hard” perceptions of technology;
*> systems accountability;
*♦* project risk;
Page 14
\_y
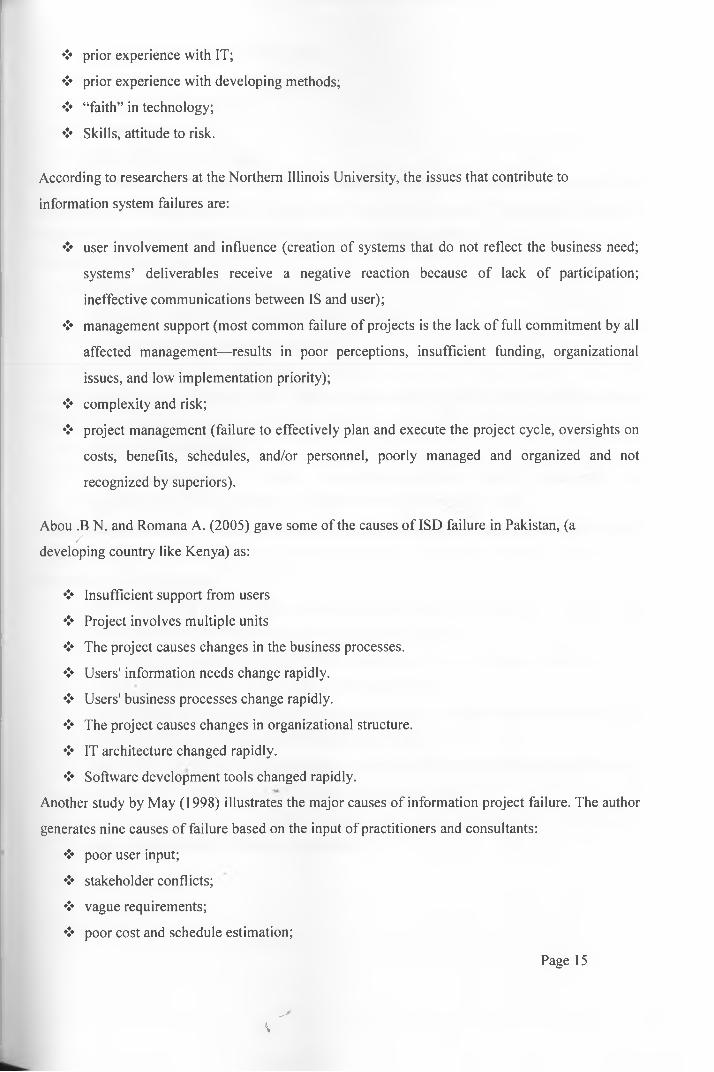
❖ prior experience with IT;
❖ prior experience with developing methods;
❖ “faith” in technology;
❖ Skills, attitude to risk.
According to researchers at the Northern Illinois University, the issues that contribute to
information system failures are:
❖ user involvement and influence (creation of systems that do not reflect the business need;
systems’ deliverables receive a negative reaction because of lack of participation;
ineffective communications between IS and user);
❖ management support (most common failure of projects is the lack of full commitment by all
affected management—results in poor perceptions, insufficient funding, organizational
issues, and low implementation priority);
❖ complexity and risk;
❖ project management (failure to effectively plan and execute the project cycle, oversights on
costs, benefits, schedules, and/or personnel, poorly managed and organized and not
recognized by superiors).
Abou .B N. and Romana A. (2005) gave some of the causes of ISD failure in Pakistan, (a/
developing country like Kenya) as:
❖ Insufficient support from users
❖ Project involves multiple units
❖ The project causes changes in the business processes.
❖ Users' information needs change rapidly.
❖ Users' business processes change rapidly.
❖ The project causes changes in organizational structure.
❖ IT architecture changed rapidly.
❖ Software development tools changed rapidly.
Another study by May (1998) illustrates the major causes of information project failure. The author
generates nine causes of failure based on the input of practitioners and consultants:
❖ poor user input;
❖ stakeholder conflicts;
❖ vague requirements;
❖ poor cost and schedule estimation;
Page 15
\_ v

• lack of matching between skills and job;
• failure to plan;
• communication breakdowns;
• poor architecture;
• and late failure warning signals
Linberg (1999) used development projects reports, interviews and surveys to assess what
contributes, from the perspective of practitioners, to a successful project. Participants were asked,
“ What was the most successful project that you have worked on, and why?"
The common themes were:
• The project was a technical challenge.
• The product worked the way it was intended to work.
• The team was small and high performing.
Participants in Linberg’s study (1999) were also asked,
“ What was the least successful project that you have worked on, and why?" and the common
themes were as follows:
• Poor project management.
• Poor marketing research [relates to developing systems that do not match the
customer/users technical platform; i.e. hardware and/or operating system].
Linberg developed a project success continuum from the practitioner’s perspective, which includes
whether the project was completed or cancelled. For each of these two outcomes, projects were
rated as one of the following:
• Failed: completed projects that were characterized by the development of a product that
“causes customer discontent” due to lack of perceived quality.
• Low success: cancelled projects that were characterized by practitioners that did not learn
anything new which could be applied to a subsequent project.
• Successful: completed projects that were characterized by average cost, effort and schedule
performance when compared to the industry as a whole.
• High success: cancelled projects that were characterized by new knowledge for practitioners
and artifacts that could be applied to future development work.
• Exceptionally successful: completed projects that were characterized by “meeting all
quality, cost, effort and schedule expectations”.
Page 16

1.8. Some Major Factors of Failure
1.8.1. Lack of top management commitment to the project
Several research and studies on the Information system projects failure put vast amount of
emphasis on insufficient support from senior management and leadership through setting unclear
purpose from employing a certain project, incapability to manage complexity, under-nourishing
initiatives, failure to anticipate short-term disruptions, inability to demonstrate the invisible
progress and eventually disregard for the stability and maturity of the used technology as a major
cause of Information system failures. Glaster (2005) underlines the necessity to provide the most
qualified staff and resources for supporting initiatives in establishing a new Information system
project. He also admits the fact that any new changes resulted from newly introduced Information
System project would for sure disrupt in short-terms the everyday routine of the work in any
system. This needs support and encouraging words of the top management to mitigate the
frustration raised in the morale of subordinates. Glaster (2005) suggests that top management must
continuously strive to reveal the fulfillment of series of short-term deliverables to the organization.
The last but not the least, he recognizes the fact that an adopted technology in a Information System
project could require a lot to reach to a certain level of stability, supportability and maturity prior to
be completely acceptable by the users and the host organization. The emerging technologies of this
kind always bear with them a high risk of failure on one hand, but on the other hand they could
provide a tremendous competitive advantage by letting the host organization achieve differential
value by being an early adopter. Running pilot projects experiencing the immature technology with
limited implementation scope and minimizing the potential harms are considered as a subtle
solution in these cases.
1.8.2. Incomplete/Changing Requirements
Most software project failures are due to errors in the software requirements specification.
According to (UK Health, 2003) requirements issues accounted for 40% of the causes of Software
project failures. , hardware failures for 26%, software bugs 11%, maintenance issues 6% and
system use around 17%”. According to (Standish, 1995) CHAOS survey, the top two “project
impaired” factors were “incomplete requirements” and “lack of user involvement”. Also according
to Annie, I. Anton, (2003), the software industry is “clearly, facing a requirements engineering
crisis. Finding and fixing a software problem after delivery is often more expensive then finding
and fixing it during the requirements and design phase”.
It is important to understand the problem before expressing the requirements for the solution. It is
normal that small projects can succeed without formal requirements engineering, but any project of
Page 17

a considerable size and complexity requires proper requirements (Annie, I. Anton, 2003). As
argued by (Nuseibeh, and Easterbrook, 2000) the primary measure of success of a software system
is the degree to which it meets the purpose for which it was intended. Broadly speaking, software
systems requirements engineering is the process of discovering that purpose, by identifying
stakeholders and their needs, and documenting these in a form that is agreeable to analysis,
communication, and subsequent implementation.
1.8.3. Poor Planning
The relationship between project planning aspect and the degree of success/failure in projects is
quite a controversial matter. Where there is a vast amount of positive ideas in favor of a concrete
planning for a project to ensure the success, the literature review has brought to the scene some
opposing opinions. Dvir et al. (2003) argue that even though a decent level of planning for a
successful project is vital, there is not an essential positive correlation between planning and
success - if not negative all together. Kippenberger, (2000) believes that in reality being able to
perform a project according to what has been planned is an exception rather than a norm. He
actually believes that too much emphasis on planning and trying to stick to it would decrease the
chances of success for a project. He reveals two important points related to excessive attachment to
the plans; firstly, financial planning focuses more on the cost than the time, so spending excessive
efforts to save money to avoid cost overruns, will create delays which result in time overruns that
are more costly than what was planned for. Secondly, when it comes to time planning (scheduling),
project managers either constantly look backwards or so fixed at the present moment to compare
the progress according to the plan which consequently prevents them from looking forward and
anticipating changes and doing corrections in time.
1.8.4. Under Funding and Bad Estimations
Funding that does not last right throughout a project may contribute to delaying the project’s
completion (Procaccino J. Drew 2002). Further, practitioners have reported the importance of a
sponsor/champion from their process perspective [Procaccino and Verner 2001) Having enough
funds to last throughout a project also relates to the importance practitioners place on having other
stakeholders participate in the decision-making process
1.8.5. Poor Relationship Management
This relates to User Relationships. Lack of trust and inadequate user involvement, unclear roles and
expectations among users or other stakeholders can lead to Information system project failure.
Page 18
1.9. Research Models
Literature has several models for assessing failure and the way forward for ICT systems in general.
Some of these models were considered relevant to this research.
1.9.1. The ITPOSMO model
The ITPOSMO model was envisaged by Heeks (2002). The ITPOSMO model seeks to explain the
high rates of failures of information systems in developing countries This model assumes the
designers of IS are remote which means their contextual inscriptions are liable to be significantly
different from user actuality. It assumes the designers come from developed countries or have been
trained in developed countries and their knowledge of the local circumstances is at variance with
the local reality. This model can be used in explaining some of the reasons as to why
implementation of ICT in Kenya fails. According to Heeks (2002), local improvisation is done to
reduce actuality-reality gaps. This can be through hybrids that recognize local capacities and
improve success rates. However, Heeks notes that schemes to develop these hybrids in the
Developing Countries are virtually nonexistent thus hampering improvisation. Participative
approaches to implementation e.g. group working and end-user involvement; have to be carefully
considered since most have been developed for the industrialized countries. Examples of how these
participative IS techniques were a failure, are the case of Mexico’s General Hospital and an end-
user development initiative for health IS in South Africa (Heeks 2002). The implementations failed
because of the large gap between design assumptions and requirements and actuality of
organizations into which ICT was introduced. The conclusion drawn is that these implementations
failed because there was too large a gap between the design assumptions and requirements of those
techniques and the actuality of organizations into which they were introduced and not necessarily
because of participative design is necessarily wrong.
1.9.2. A descriptive conceptual framework for developing countries context
This model which was developed by David Gichoya (2005) seeks to identify the characteristic
challenges, which make ICT implementation in Kenya government fail to succeed. The model
illustrates the key factors in ICT implementation in government. The input variables are
categorized into factors for success (drivers and enablers), and factors for failure (barriers and
inhibitors). The factors for failure are those occurrences that constraint proper/smooth
implementation of ICT projects in government. These can either be barriers or inhibitors.
Barriers can be considered as those occurrences that hinder ICT implementation. The barriers are
as listed below.
Page 19
>

Infrastructure
❖ Finance
❖ Poor data systems and lack of compatibility
❖ Skilled personnel
❖ Leadership styles, culture, and bureaucracy
❖ Attitudes
Inhibitors do not necessarily prevent the implementation of ICT projects but they do prevent
advancement and restrict successful implementation and sustainability. The inhibitors are as listed
below.
❖ User needs
❖ Technology
❖ Coordination
❖ ICT policy
❖ Transfer of ICT idolizers
❖ Donor push
Figure 1-1: Descriptive framework for ICT success or Failure (David Gichoya, 2005)
Page 20
\
1.9.3. IS Sphere Model
Feghali, T. and Zbib, I.J. (2007) identified twenty nine (29) project failure indicators in order to
establish a prevention model. These are categorized into three different headings:
❖ Cultural
❖ Managerial
❖ Technical
A predictive model to test IS and project failure was proposed. The proposed IS failure model is
represented by a sphere (IS-Sphere) and can be used to help IT managers gauge their progress in
terms of preparedness to prevent and predict IS failure in their enterprises. This study defines IS
failure as any phenomenon that hinders the success of an information system during development,
installation, deployment, implementation and continuous use of that system.
The three values that give the coordinates of the radius of the sphere with its centre at (0, 0, 0) are
based on the three factors derived from the categories: managerial, cultural and technical. Each
factor is dependent on the values of its respective indicators. The Indicator value is the average of
all responses for that indicator. Thus a sample of the respondents rates an indicator on a scale of 1-7
and average is calculated. The indicators were then scaled down to take a value between 0 and 1.
To get the value of the factors, the sum of each indicator values is calculated for that factor. The
factor values give the coordinates of the Sphere. From this model, the larger the IS-Sphere is the
healthier it is in terms of resisting failure factors.

The coordinates on the three-dimensional (3D) factors are values generated from each of the three
factors: Cultural, managerial and technical.
1.9.4. Yeo IS projects success/failure factors model
Yeo (2002) in a very interesting work has created a broad systematic framework capable of
presenting a wide range of possible success/failure factors. Yeo in his triple-system(S) model
represents three systems: organizational system (SI) as a primary system which is to be ‘served’
and is context-driven, formalized information system (S2) as a supporting system which is to be
‘serving’ SI and is content-driven and finally strategic project planning and delivery system (Sp)
which operates in the organizational context of SI in order to deliver a successful S2 and thus is
process-driven system. Sp has a very holistic role and responsibility that is overseeing the process
Page 22

of preparing, planning, coordinating , and also taking care of rising social, cultural and technical
issues in the system’s development and implementation.
Figure 1-3: IS/IT projects success/failure factors model (Yeo, 2002,)
This consolidating triple-S model provides a rigorous framework to pinpoint, group and analyze a
host of success/failure factors when it comes to IS/IT project subject. Yeo in his article names these
three systems as spheres o f influence (SOI) and afterwards nominates 10 main issues o f influence
(IOI) which go under SOIs according to their relevance. These issues in turn are translated to listsA-
of failure factors identified by the researcher from an in-depth literature review. Table below
demonstrates the outcome of this endeavor.
Sp Process driven issues SI Context driven issues S2 Content driven issues
Related to Related to Related to
Business planning Corporate culture Information technology
Page 23
\_y

Project planning Corporate management Business process and system
design
Project management and
control
Users Is professional and knowledge
resources
Politics
Table 1-1: Defining ‘Issues of Influence’ under three ‘Spheres of Influence’ (Yeo, 2002)
Rank Sp Process driven issues SI Context driven issues S2 Content driven Issues
1 Underestimate of timeline Lack of user involvement and
inputs from onset
Consu ltant/vendor
underestimated the project
scope and complexity
2 Weak definition of
requirements and scope
Top down management style Incomplete specifications
when project starts
3 Inadequate project risk
analysis
Poor internal communication Inappropriate choices of
software
4 Incorrect assumption
regarding risk analysis
Absence of an influential
champion and change agent
Changes in design
specifications late in the
project
5 Ambiguous business
needs and unclear vision
Reactive and not pro-active in
dealing with problems
Involve high degree of
customization in application
Table 1-2: Top 5 failure factors under Sp, SI and S2 (Yeo, 2002)
1.9.5. Project Success Model
Model developed by Douglas Havelka, Kimberly Conrad, and Bonnie Glassberg. The model was
developed from a comprehensive set of factors that impact information systems development
project. The model can be used to improve the likelihood of project success.
The output of the model is a set of factors that can be used by managers to improve the
development process or by researchers to further investigate the relationships among the various
factors. The factors identified were classified into ten separate categories: System, Team, Process,
Domain, Project, Organizational, Management, User Personnel, IS Personnel, and
Communication.
Page 24

Figure 1-4: Project Success Model (Douglas Havelka, Kimberly Conrad, and Bonnie Glassberg)
/
Page 25

2. CHAPTER 3: RESEARCH METHODOLOGY
The research strategy employed in this project is the use of questionnaires and in-depth follow-up
interviews with Information System practitioners and users. This enabled me to structure a
customized model of factors leading to failures in Information System projects in Kenyan
organizations. This model was evaluated by use of the Project viability Assessment system
developed from the causes of failures analyzed with the responses from the survey. The
methodology adopted includes:
❖ Literature review of relevant ISD methodologies in general; this includes study of online
journals and papers.
❖ Study of online models in use for factors that lead to failures in Information system
processes.
❖ Survey and case studies about existing practice and problems among Kenyan companies.
The survey was conducted by use of questionnaires. Follow up interviews were also done
for the questionnaire responses that were not clear to the researcher. The inputs were then
used for formulating adapted ISD methods, techniques, and practices. A prototype system
was designed from the proposed model and evaluated by use of data collected from the
questionnaires
Figure 2-1: Research designThe primary objective was to propose a model that outlines causes and indicators that may lead to
ISP failures. Both technical perspectives and User (both end users and senior management)
perspectives were examined. The User group included representatives from any level of employees
that have been involved in development of an IS system. The individuals in the user groups had
varied degrees of interaction with IS specialists and all had participated in the ISD development
process in some manner.
Tinstone (1999) says that, “the concept of multiple perspectives is a remedy intended to overcome
domination by the technical perspective. Similarly, an end user will not likely examine the
Page 26
_v

technical aspect, since he would assume that the technical issues would be taken care of by
someone familiar with that domain”. This research has employed the multiple view perspective as a
deliberate instrument to capture parallel views and not necessarily to avoid domination by any one
stakeholder. The model was designed to embrace the public and private sectors as well as
educational institutions. There are many differences in the circumstances of IS development
between each of this organizational types but some degree of commonality can be expected.
2.1. Data gathering Process
In order to be able to suggest possible ways of preventing software failures, it is necessary to
investigate in detail, what is going on in the real software world. To do this it is first necessary to
examine what has gone before with a view to determining what general characteristics of failure
tend to become apparent. Current work at this point is directed at finding a means of taking
symptoms and “distilling” them into the true characteristics of a system problem. This takes into
consideration that errors creep into the very best of practices owing to very understandable
coincidences of a number of events. E.g. an apparent symptom can be given as “software package
inadequacy” but was actually due to the private agenda of an individual within the project team.
What this has meant is gathering extensive cases from the literature and conducting field work to
gather information during on-going system problem and success scenarios.
2.2. Survey Instrument
2.2.1. Questionnaire design Considerations
The primary instrument of this research was a questionnaire. The questions generally have multiple
choice answers indicated by a tick or a circle. In specific instances, respondents were asked to add
their observations or comments. Two sets of questionnaires were used in each organization one was
meant for IS practitioners while the second one was meant for IS users. In-depth interviews were
used as follow-ups for responses that were not clear to the researcher. This approach provided new
insights, grounded in the Kenya IS development reality, into factors that lead to the failure of IS
Development projects.
Finally, questions on similar themes w'fere grouped together and were sequenced to form a logical
progression where possible. More difficult questions were put before easier ones given the
complexity and length of the survey. One other key consideration in the questionnaire design was
providing all questions in a closed form. This resulted in a data form that was easier to code and
analyze than open questions.
Page 27

The questionnaires and the interviews used the framework of the Project Success model by Douglas
Havelka, Kimberly Conrad, and Bonnie Glassberg to be informed of some of the factors for ISD
failures. The model shows the factors that can be used by IS managers to improve the development
process or by researchers to further investigate the relationships among the various factors. The
Project Success model (Havelka D., Kimberly C., and Glassberg B.) has the following factors:
a. System factors are characteristics or properties of the computer-based information systems
that support the organization's business processes. They may influence information systems
development (ISD) project outcome by increasing the amount of work required or the level
of difficulty involved. The system factors are: current system quality, system size, and
system integration.
b. Team factors are attributes or characteristics related to the project team charged with
designing and developing the new system. These factors include: team composition, team
size, team authority, and team motivation.
c. Process factors are characteristics of the information systems development process itself.
The process factors include: planning, data gathering techniques, feasibility study, and
testing.
d. Domain factors are those factors that are characteristics or properties of the application or
business domain. These factors include" unique requirements, stability of requirements,
flexibility required, and complexity of the application. Although domain factors may be
difficult or impossible for managers to control, they can be evaluated. Appropriate strategies
can then be determined to address challenges that some domains pose.
e. Project factors are those constructs that are based on the specific development project
being studied. The project factors identified are the budget, control of the project, initiator,
leader, time/schedule constraints, and goal congruence.
f. Organizational factors are those properties, characteristics, or attributes of the
organizational culture or structure that may affect ISD project success. The organizational
factors identified were hardware and software environment, multiple user areas, politics,
rapport between IS and users, and outside resources.A-
g. Management factors are those that are characteristics of the organizations management
structure for controlling and directing development activities. The management factors
identified were accountability, adequate supervision, management commitment, and
management goals for the system.
h. User factors include: user communication skills, user bias, and user commitment.
Characteristics and attributes of the users of the system being developed can influence the
project's success. The primary reason for user participation in systems development is toPage 28
transfer their job knowledge. Without an adequate level of communication skills, the
communication and interaction between the users and IS personnel may be difficult. Users
that have a high level of understanding of the current system should be able to point out
specific problems and areas for improvement that can be incorporated into the new system.
User commitment to the project will directly impact the project's success. Users that want
the project to succeed will be more willing to provide documents, answers to questions, and
perform other development activities.
i. IS personnel factors on the systems development team will also impact the project's
success. These IS factors are: IS communication skills, experience, technical IS skills, bias,
and domain knowledge. Communication skills of the IS personnel can be expected to affect
the level of communication and knowledge exchange during development. Some
organizations, recognizing the lack of adequate IS communication skills, have begun using
facilitators to enhance the level of communication between IS personnel and users. The ISD
process is dependent on communication between many individuals. For an ISD project to be
successful user and IS personnel must incorporate their respective knowledge into the
application.
j. The communication factors impact the ability to exchange knowledge. The
communication factors include: clarification/feedback, communication among team
members, persuasion, and interaction between users and IS personnel.
2.2.2. Sampling Technique and Sample Size
Two sets of questionnaires were sent to one hundred (100) IS managers and IS users in the Kenya
to look at why information systems development processes may fail. There were twenty one (21)
respondents reporting on seventy three (73) distinct projects. Nine (9) Follow-up interviews were
conducted for questionnaires that were not clear to the researcher. Among the user group, there
were twenty (20) respondents.
No attempt was made to apply any sampling theory in selecting the participants. Priority was given
to expected success in recovering participant responses so that the research could be completedA-
without additional complications. Respondent organizations were therefore selected based on
previous acquaintance with the researcher. This enabled the bypassing of the usual obstacles that
would be encountered in questionnaire based research.
Page 29

2.3. System Design and Development
The software project viability system was developed so as to be used to evaluate the model that is
proposed in the research. The system was designed to help software project stakeholders to assess
the potential success of ISD projects.
Figure 2-2-System Architecture of proposed prototype system
2.3.1. System Design
❖ The software project viability assessment system: This module has a database which
contains three tables:
o User table- used to store user information. The users table distinguishes between
administrators group and non-administrative users group of the system. These two
groups have different roles in the system. The administrative users can add and edit
user information, issue rights and privileges in using the system. They can also edit
the system parameters to suit the project being investigated. The non-administrative
users use the system to compute the project viability/success potential only,
o The Parameters table is used to store the relative importance scores for the different
factors that cause failure.
o The questions table stores the questions for the system. The Analysis module picks
the set of responses of the user, does a calculation of the success potential and
appropriate information based on the success potential is given.
❖ Administrators Module: In this module, administrators
o Can add, edit or delete questions in the table questions,
o can also edit the parameters (relative scores) in the parameters table
o Can add users and edit users rights/privileges
Page 30

This is to make the system adaptable to the environment since its applicability is dependent on the
individual project based on cost, complexity, scope of effort and its criticality to the organization’s
mission.
❖ User Interface: This provides a set of questions to the user. Questions are queried from
database and the responses are used to get success potential and discussions. The Responses
to a set of questions given by the user, determine which of the possible five (5) Likert scales
the respondent is close to.
❖ Report: A report is given to the user with the success potential calculated as a percentage
and suitable advice is given.
R eports /advice
Figure 2-3-Context Data Flow Diagram of proposed prototype system
2.3.2. Computation of the success Potential
Success potential has been calculated as the difference between the maximum possible points
(100%) and the sum of the failure potential for each factor. The computation has been analyzed as
follows:
The user inputs a response by selecting one of the choices of the likert scale given for each question
on the user interface. All these option have been assigned the Likert scale values as shown below:
❖ Very likely-5❖ Likely-4❖ Possible-3❖ Unlikely-2❖ Very Unlikely-1
A-
The failure potential of each factor was computed using the formula:
Sx= (Fi*La)/maximum value of Likert Scale
Where Sx =Failure Potential for the factor
Fi=relative score assigned to the factor
La = Likert scale option selected
Page 31
_y

The maximum value of Likert Scale which is five (5)
Total Success Potential for the entire project = 100-(Sum (Sx))
EXAMPLEQl: What is the likelihood that Lack of top management support may be/have been encountered in
the project?
Supposing a user selects unlikely, the Likert scale value for unlikely is 2, the relative score for the
factor lack of senior management is 13%
Thus
Failure Potential, Sx = (13%*2)/5= (0.13*2)/5= 5.2
All other factors are calculated in the same manner and a summation is done to obtain the failure
potential of the entire project. Success potential is the difference between 100 and the failure
potential obtained.
2.3.3. Hardware, Software and Interface
To implement the model and algorithm, a stand-alone, Pentium 4 laptop, installed with Visual
Studio, was used. The programming language chosen was Visual Basic.net 2005 for its ease of
availability and attractive user interface. The sample code appears in APPENDIX B.
Page 32

3. CHAPTER 4: FINDINGS AND DATA ANALYSIS
This chapter presents details of the analysis and findings of the study. The chapter also presents the
proposed framework of the IS failure Model. More emphasis was placed on responses with respect
to ISD failures.
3.1. Results and Findings
The main outcome of this research was a model that includes some of the early and on-going
components that affect the success of the software development process. The proposed model can
assist in determining the relative importance of each of the factors that lead to failures in system
development addressed in the research.
The model was intended to provide project managers with insight into some of the risks that can
threaten the development process and the resultant product.
3.1.1. IS project failure definition
In determining the success/failure of the IS projects, Sauer’s definition of IS project failure was
used. Chris Sauer’s attempted to classify the failures categories. The classification is given in the
Table4-1 below and this classification provides a suitable framework to help make initial diagnosis
of the types of failure. The third column in the table indicates the types of failures evident in this
research.
Type Description Presence in
Survey
Correspondence failure Failure to achieve predefined objectives Positive
Process failure Failure to produce a system in given limits Positive
Interaction failure Level of use or user satisfaction failure Positive
Expectation failure Inability to meet the expectations of specific Positive
stakeholder
Terminal failure Project terminated, can’t be tolerated more Negative
Table 3-1 : Failure Classifications (Chris Sauer)
N.B Positive indicates that that type of failure was notable in the research while negative means the failure was not fully notable in this research.
According to Heeks R. (2002), ICT success or failure in developing countries can be categorized
into three depending on the degree of success
Page 33
_y
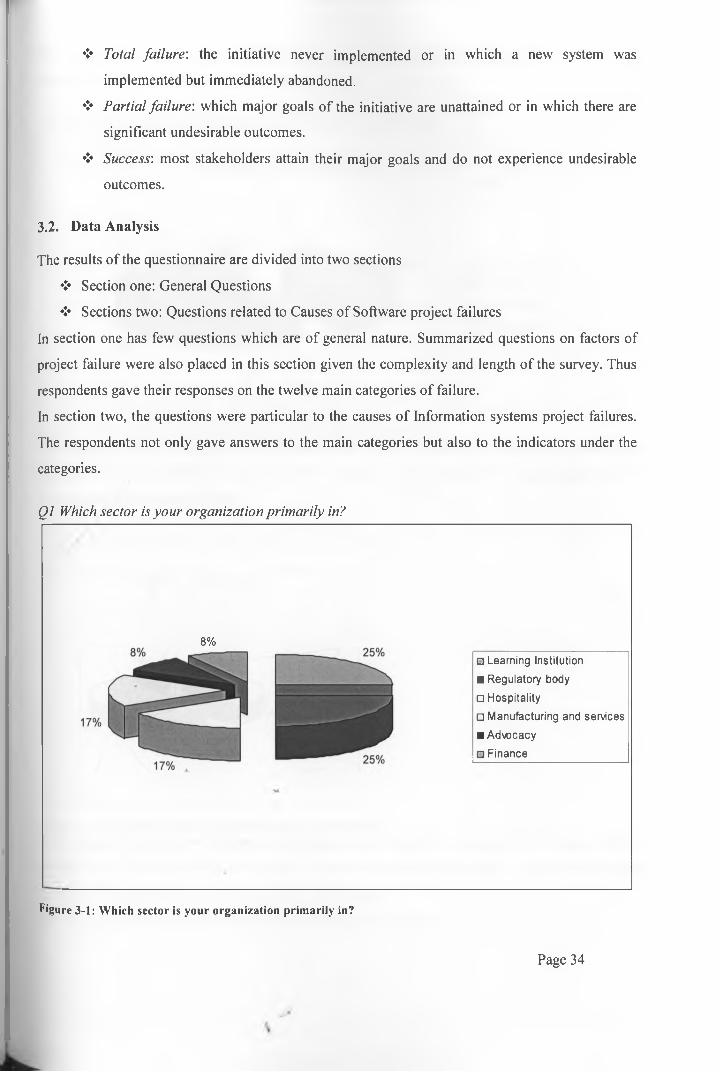
❖ Total failure: the initiative never implemented or in which a new system was
implemented but immediately abandoned.
❖ Partial failure: which major goals of the initiative are unattained or in which there are
significant undesirable outcomes.
❖ Success: most stakeholders attain their major goals and do not experience undesirable
outcomes.
3.2. Data Analysis
The results of the questionnaire are divided into two sections
❖ Section one: General Questions
❖ Sections two: Questions related to Causes of Software project failures
In section one has few questions which are of general nature. Summarized questions on factors of
project failure were also placed in this section given the complexity and length of the survey. Thus
respondents gave their responses on the twelve main categories of failure.
In section two, the questions were particular to the causes of Information systems project failures.
The respondents not only gave answers to the main categories but also to the indicators under the
categories.
Q1 Which sector is your organization primarily in?
8%
□ L e a rn in g In s t itu t io n
■ R e g u la to ry b o d y
□ H o s p ita l i ty
□ M a n u fa c tu r in g a n d s e rv ic e s
■ A d v o c a c y
□ F in a n c e
Figure 3-1: Which sector is your organization primarily in?
Page 34

The purpose Q.l was to know about the respondent’s organizational sector. It’s partially used to
describe the environment of the respondent.
Q2: How long have you been involved in 1CTproject development?
Experience in project development
□ 1 - 5 y e a rs
■ 6 - 1 0 y e a rs
□ 1 1 - 1 5 y e a rs
□ O v e r 15 y e a rs
Figure 3-2: How long have you been involved in ICT project development?This question partially describes the respondent and it helps to validate the appropriateness of the
respondent to answer this survey. It is also included so that perhaps its implications can be
investigated for subsequent studies.
Q3: On average, how many projects have you undertaken?
Average no.of projects participated
9% 0% 13 %
26%
Figure 3-3: On average, how many projects have you undertaken?In the figure 4-3 above, the respondents have good knowledge and experience on the basis of their
Participation in different software projects. It means they are the right people with right knowledge
to lead me towards achieving the objectives of the survey.
Q4 List some o f the projects you have undertaken and the outcome
Page 35
□ None
■ 1 - 5□ 6-10
□ 11-16
■ Over 15

P ro j e c t O u t c o m e
□ s u c c e s s2 5 % 1 4 %
■ c h a lle n g e d
6 2 %□ fa ilu r e
Figure 3-4: Project outcomesThe working estimates from the survey suggest that more than half (62%) of Information system
development projects were partial failures. This figures may not necessary be used as evidence that
very few Information system development projects are total failures. This is because most of the
organizations surveyed feared on admitting total failure of their systems.
Q5: With respect to the failed IS projects, the respondents were asked to rate the factors below
from 1 (most frequent) to 10 (least frequent) as to why the organization’s IS failures may occur.
Frequency (No. of Respondents)
Factor 1 2 3 4 5 6 7 8 9 10
Lack of top management commitment to the project 18 0 0 0 0 0 0 0 0 0
Incomplete/Changing Requirements 16 0 1 1 0 0 0 0 0 0
Poor Relationship Management 2 14 0 1 1 0 0 0 0 0
Improper Project Management 0 1 2 14 0 0 1 0 0 0
Poor Planning 2 6 0 0 0 1 6 1 1 1
Scope 0 1 0 1 13 2 0 1 0 0
Inappropriate Technology base 7 0 0 0 0 0 3 4 1 3
External Dependencies-foreign 3 1 2 1 3 0 2 0 4 2
Under Funding and Bad Estimations 0 0 2 1 0 14 0 0 1 0
Scheduling- artificial deadlines 4 0 0 0 0 0 1 13 0 0
Poor Personnel training/skills 0 2 0 0 0 9 0 1 2 4
Lack of effective Development process/'4
methodology
1 0 0 1 0 0 4 11 0 1
Table 3-2: Factors that lead to failures from survey
In this question, the causes of failure mentioned in the literature review were used. Lack of top
management commitment to the project had the highest number of respondents who chose one as
the most frequent cause of failurePage 36
S>

Generally, all the factors are important in the success or failure of an Information system software
project but with the help of respondent’s response, it’s possible to see which factors are more
important in respondents’ point of view.
Q6 For the IS projects that fail, at what stage are they likely to fail?
Development stage
78% 78%
56% 67%
□ D uring p rob lem sc o p in g
and incep tion
■ D uring re qu ire m en ts an a lys is
□ D uring d e s ig n
□ D uring cod in g
■ D uring tes tin g
□ D uring im plem entation and
m a in tenance
Figure 3-5: percentage of Yes Responses for stages at which IS projects failAs can be deduced figure 4-5 above, 89% of the respondents agreed that information systems
projects fail at the requirement analysis stage. This can be due to the fact that if the scope of project
could not be visualized by all of the stakeholders at the start of the process then the system analysts
may be influenced to overlook or not fully understand the requirements of different users.
Q7: Which o f the following system development practices do you carry out during an information system development project?
Page 37
V

P e r c e n t a g e o f Y e s r e s p o n s e s t o ISD p r a c t i c e s
44% 28%
28%
□ E ffe c tiv e deve lopm en t
p roce ss /m e th o d o lo g y
■ R isk m anagem ent e g. s ta f f tu rn o v e r
□ A d e q u a te p lanning
□ Defin ition o f ro les and
respons ib ilitie s
■ u se o f ap p ro p ria te tech no log y
□ Tra in ing o f u se rs
■ C ontinuous s u p p o rt w hen s y s te m is in use
Figure 3-6: Percentage of Yes Responses to ISD practices
This question sought to answer that Objective two of this research, i.e. to find out the common
practices in Information system development projects. The results show that most organizations
look at planning for their projects as part of the solution though not necessarily as an enabling tool
to avoid failures
The second part of the survey draws on the results from the first part. In this section, the
respondents were asked their point of view on the causes of software failure for each of the
subcategories under the main categories. Answer to each factor was chosen one out of five options:
‘very unlikely, ‘Unlikely, ‘Possible, ‘likely and ‘very likely’ which according to Likert scale are
coded by values from 1 to 5. To simplify the analysis of this data, the responses to each factor are
divided into two groups of those: ‘likely and ‘very likely’ (group A) and the group of those ‘very
unlikely, ‘unlikely, and ‘possible’, (group B). The analysis is shown in the appendix C.
3.3. Analysis of user perceptions on failure
The Information System failure itself is often influenced by the perception of people who are
involved in it (Peterson et al., 2002; Poonand Wagner, 2001). This necessitated the need to capture
the users’ perception of failure. This research examined both IT Practitioners’ perspectives and
User perspectives to get the causes of failure in IS projects. Users have greatest influence on system
design and their views may address both the system concerns and the strategic needs of the
Organization. The individuals in the user groups had varied degrees of interaction with IS specialists
ar>d all had participated in the ISD project in some manner. Getting this kind of users was important
Page 38
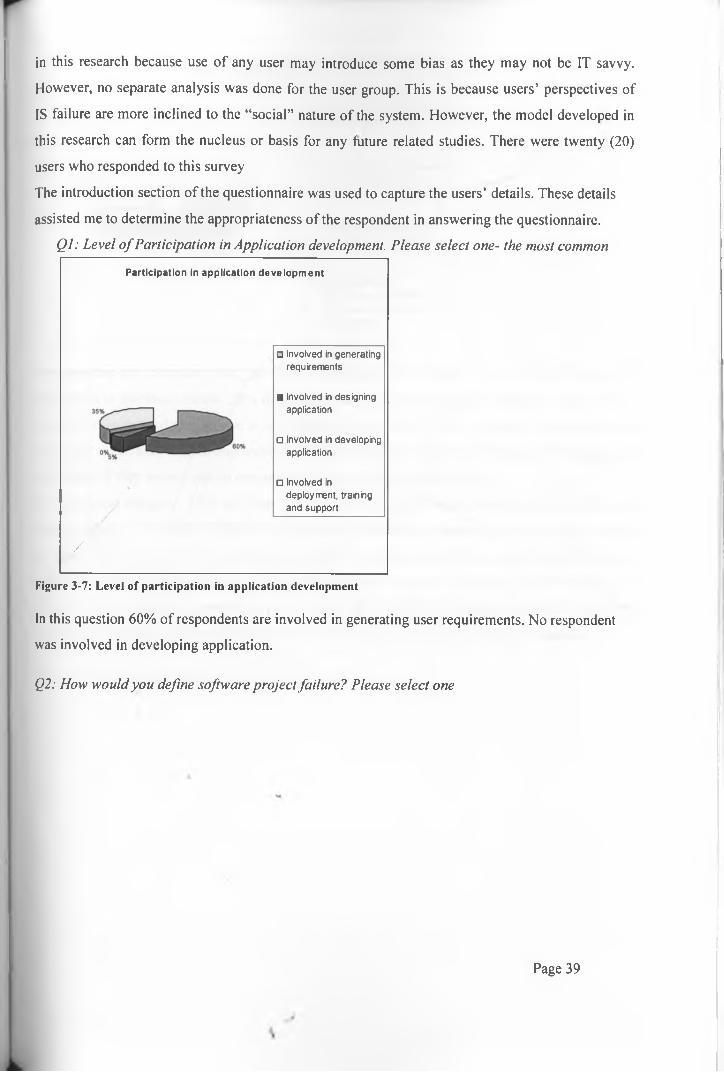
in this research because use of any user may introduce some bias as they may not be IT savvy.
However, no separate analysis was done for the user group. This is because users’ perspectives of
IS failure are more inclined to the “social” nature of the system. However, the model developed in
this research can form the nucleus or basis for any future related studies. There were twenty (20)
users who responded to this survey
The introduction section of the questionnaire was used to capture the users’ details. These details
assisted me to determine the appropriateness of the respondent in answering the questionnaire.
Ql: Level o f Participation in Application development. Please select one- the most common
Participation in application development
□ Invo lved in genera ting requirem ents
■ Invo lved in designing application
□ Invo lved in developing application
□ Invo lved in deploym ent, tra ining and support
/
Figure 3-7: Level of participation in application development
In this question 60% of respondents are involved in generating user requirements. No respondent
was involved in developing application.
Q2: How would you define software project failure? Please select one
Page 39

define project failure
□ A c c o rd in g to sp e c ifica tio n
bu t w as no t on time
■ A c c o rd in g to sp e c ifica tio n
bu t la ck som e quality a sp e c ts
□ A c c o rd in g to sp e c ifica tio n
bu t w as o v e r bu dge ted
□ Not a cc o rd in g to sp e c ifica tio n bu t fu lfills
time, quality and budge t requ irem en ts
This question was to capture users’ perception of failure. This was made with the help of mentioned
definitions in literature review. 25% respondents are agreed that a project is failure when it never
comes within defined time. Time is an important factor since “lack of project management and
planning” make the projects impossible to finish within defined time. Planning and Management
are useless if they are not able to manage the timely completion of a project.
In the second category, 35% said that they consider a project failure when it never fulfills the
quality aspects of a project. Quality is a necessary element as company pay to get high quality
projects. 10% respondents considered that a project is not successful if it’s never completed within
defined budget. At the end, there was an option which is inverse of above three and that is “A
project is not according to specifications but fulfils time, quality and budget parameters” and 30%
agreed that a project is defined failure when it never fulfils basic requirement specifications.
Q3: Opinions about application systems. Please select one.
Page 40

opinions about application systems
□ Enough c o n tro l o v e r th e look & fe e l o f in te rfa c e
■ Too m uch time taken aw ay
fro m re g u la r w o rk
□ S ys te m has be com e a burden
□ C on fid e n ce in da ta has
inc re a se d
■ A b le to re d u c e m anpow er
□ Took a long time to s tab ilize
■ Has been good fo r th e to ta l
o rgan iza tion
Figure 3-8: Opinions on application systems
This question was used to capture the users’ attitude towards application systems. Both positive and
negative opinions are captured.
Q4: Problems encountered in the recent application systems
Problems encountered
□ Not e n ough s u p p o rt
■ In s u ffic ie n t tes tin g
□ C anno t do job
□ Inadequate u s e r skills
■ Not up to e xp e c ta tio n
□ In s u ffic ie n t tra in ing
■ S low p e rfo rm a n c e
□ In s u ffic ie n t b u dge t
Figure 3-9: problems encounteredThe question was asked so as to act as a lead question to causes of software project failures. The
highest number of respondents (30%) said that the major problem was lack of enough support.
Q5: Probable cause o f these problems
Page 41

Figure 3-10: Probable causes of problems
In figure 4-10 above, the survey respondents gave 25% in favor of “users not sufficiently involved”
as a major cause of failure. 20% respondents selected “expectations not stated” as a second major
cause of software project failure.
3.4. Calculation of relative importance scores for the factors
Assigning relative importance scores to the factors of failures was an uphill task. This is due to the
fact that determination of relative importance scores in research work is a result of thorough
deliberations by a body of experts which was not feasible in this case. This is an individual
academic project. These relative importance scores were arbitrarily selected by the researcher based
on the frequency of responses for each factor of failure to yield a score of one hundred (100) points.
These scores were used in the prototype system used to calculate the project success potential.
In the IS sphere Model for IS failure, Feghali, T. and Zbib, I.J. (2007) calculated the values of the
factors of failure based on responses from a survey. The CHAOS Report surveyed IT executive
managers. For the purposes of project comparison, The Standish Group used the project success
criteria from the surveyed IT managers to create a success potential chart and project failure criteria
to create a Failure Potential chart. Each of the factors of failure and success were given
values/scores based on the input from the surveyed IT managers. The tables 4-3 and 4-4 below list
the criterion in order of importance with their appropriate points as used by the CHAOS report.
.SUCCESS CRITERIA POINTS_Jj User Involvement 19^Executive Management Support 16■iClear Statement of Requirements 15
Page 42
»

4. Proper Planning 115. Realistic Expectations 106. Smaller Project Milestones 97. Competent Staff 88. Ownership 69. Clear Vision & Objectives 310. Hard-Working, Focused Staff 3TOTAL 100Table 3-3: CHAOS success points adapted from Standish Chaos Report
FAILURE CRITERIA POINTS1. Incomplete Requirements 13.12. Lack of User Involvement 12.43. Lack of Resources 10.64. Unrealistic Expectations 9.95. Lack of Executive Support 9.36. Changing Requirements & Specifications 8.77. Lack of Planning 8.18. Didn’t Need It Any Longer 7.59. Lack of IT Management 6.210. Technology Illiteracy 4.311. Other 9.9TOTAL 100Table 3-4: Chaos failure points adapted from Standish Chaos report
Standish Chaos report points were derived from the percentage of responses to the factors of failure
and/or success. The report further calculated the success potential of the project by getting sum of
values for all the factors.
To calculate the values/scores for factors of failure for this research, the same design as the
CHAOS report was used, thus the scores for the factors of failure used in this research were also
devised from the survey. In similarity with IS Sphere Model for IS failure by Feghali, T. and Zbib,
I.J. (2007), the scores for the failure factors were calculated based on the input from the
respondents in the survey. This approach was preferred because of its simplicity.
The scores for the factors of failure in this research were formulated from the Likert scale which
usually has one a scale of (1) to five (5). Each of the choices of the Likert Scale has points one (1)
to five (5). Since the questionnaire required responses to be from one (1) most frequent to ten (10),
the least frequent, the scale was expanded to one (1) to ten (10). The most frequent choice one (1)
was assigned ten (10) points and the least frequent choice ten (10) had one (1) point. The number of
responses for each factor was multiplied with the corresponding points and total score (sum)
calculated.
Page 43

This resulted in the points as shown in the column score in Table 4-5 below. The total score for all
points was calculated; in this case the total was one thousand, three hundred and seventy three
(1373). A relative importance score was then calculated as a percentage of the total scores as shown
in the last column of Table 4-5 below.
Example to show calculation o f the relative score fo r the factor o f lack o f top management
commitment is shown below:
i. Get the score
Score = (18*10) + (0*9)+(0*8)+(0*7)+(0*6)+ (0*)5+ (0*4)+ (0*3)+ (0*2)+ (0* 1)
=180+0+0+0+0+0+0+0+0+0+0=180
ii. Get the relative importance score as a percentage
Relative score = (180/1373)* 100
=13%
Factor/Points 1 2 3 4 5 6 7 8 9 10 Score RelativeimportanceScore
1. Lack of top management commitment to the project
18 0 0 0 0 0 0 0 0 0 180 13%
2. Incomplete/Changing Requirements 16 0 1 1 0 0 0 0 0 0 175 13%
3. Poor Relationship Management 2 14 0 1 1 0 0 0 0 0 159 12%
4. Improper Project Management 0 1 2 14 0 0 1 0 0 0 127 9%
5. Poor Planning 2 6 0 0 0 1 6 1 1 1 109 8%
6. Scope 0 1 0 1 13 2 0 1 0 0 107 8%
7. Inappropriate Technology base 7 0 0 0 0 0 3 4 1 3 99 7%
8. External Dependencies-foreign 3 1 2 1 3 0 2 0 4 2 98 7%
9. Under Funding and Bad Estimations 0 0 2 1 0 14 0 0 1 0 95 7%
10. Scheduling- artificial deadlines 4 0 0 0 0 0 1 13 0 0 83 6%
11. Poor Personnel training/skills 0 2 0 0 0 9 0 1 2 4 74 5%
12. Lack of effective Development process/ methodology
1 0 0 1 0 0 4 11 0 1 67 5%
TOTAL 1373 100.00%
Table 3-5: Relative importance scores of the factors of failures from survey responses
3.5. Framework for the Proposed IS failure Model
The proposed model clearly defined the factors related to ISP failures. The main data set on which
the framework for the proposed IS failure Model was based was on data collected in a survey of
factors that contribute to ISP failures and the literature review. These are grouped into twelve main
Page 44

categories. Each category also has indicators (subcategories) for failure under it and this sum up to
34 indicators as shown in table below:
Factors of Failures and their Indicators1) Top management commitment to the project 7) Inappropriate Technology base
la) Lack of top management commitment to the project 7a) Introduction of New Technologylb) Inadequate supervision from top managers 7b) Inappropriate technologylc) Lack of Consultants support that last right through
the project8) External Dependencies-foreign
2) Incomplete/Changing Requirements 8a) Importation of foreign packages2a) Lack of Frozen Requirements 9) Under Funding and Bad Estimations2b) New and/or Unfamiliar Subject Matter for Both
Users and Developers9a) Under Funding of Development projects
2c) Inadequate documentation of user requirements 9b) Bad Estimations3) Poor Relationship Management 10) Poor Scheduling
3a) Poor Communication among team members 10a) Artificial deadlines3b) Unrealistic user expectations 11) Poor Personnel training/skills3c) Low level of Cooperation from Users 1 la) Lack of Required Knowledge/Skills in
the Project Personnel.3d) Growing Sophistication of Users lib) Lack of “People Skills” in Project
Leadership3e) Lack of necessary knowledge of the application
among the users assigned11c) Poor Team Relationships
3f) Inappropriate experience of the users 1 Id) Insufficient/Inappropriate Staffing3g) User resistance during the project implementation lie) Staffing Volatility
4) Improper Project Management 12) Development process/ methodology4a) Improper change management 12a) Lack of Effective Development
Process/Methodology4b) Lack of effective project management skills 12b) Lack of quality standards4c) Lack of Effective project management methodology4d) Improper definition of roles and responsibilities4e) Poor risk management
5) Poor Planning5a) No Planning or Inadequate Planning
6) Scope6a) Unclear/Misunderstood Scope/Objectives6b) Scope Creep
Table 3-6: Categories and related indicators of factors for failure
3.6. Dimensions and Descriptions of the proposed modelA-
The Table 4-7 below shows the dimensions/categories of failure, their related indicators and a
small description of each of the indicator is also illustrated. This broader categorization was done to
incorporate the unique responses from the survey and, some of the factors that may not have been
represented in the earlier studies.
bimensions/Indicators Description
' Top management commitment to the project
Page 45

1.1 Lack of top management commitment to the project
This includes oversight by executives and lack of visibility of their
commitment, lack of committing required resources and not
changing policies as needed. A climate of change in the business
and organizational environment also creates instability in the
project. There can also be unstable corporate environment which
includes competitive pressures that radically alter user
requirements, and sometimes making the entire project obsolete.
1.2 Inadequate supervision from top managers
Laying blame for “lack of client responsibility” on the project
leader rather than on the users.
1.3 Lack of Consultants support that last right through the project
Consultant adequate support creates a reliable environment for
upper management and employees to become familiar with a new
IS
2 Incomplete/Changing Requirements
2.1 Lack of Frozen Because the needs of the users change, the requirements change.
Requirements Consequently the system will never be moved into production
because none of the requirements are ever completed.
Alternatively, freezing a subset of the functionality and delivering
allows for the completion of the system and update releases as
required.
2.2 New and/or Unfamiliar Lack of domain knowledge leads to poor requirements definition
Subject Matter for Both
Users and Developers
2.3 Inadequate documentation
of user requirements
Sometimes the ISP experiences misunderstanding of the
requirements. This is due to not thoroughly defining the
requirements of the new system before starting, consequently not
understanding the true work effort, skill sets and technology
required to complete the project. Lack of domain knowledge for
A- Both Users and Developers may also lead to poor requirements
definition. There can also be inadequate documentation of user
requirements.
3 Poor Relationship Management
3.1 Poor Communication Without an adequate level of communication skills, the
among team members communication and interaction between the users and IS personnel
may be difficult. Communication skills of both the users and IS
Page 46

personnel can affect the level of knowledge exchange during
development.
3.2 Unrealistic user Expectations determine the actual success or failure of a project.
expectations Expectations mismatched with deliverable - too high or too low -
can cause problems. Expectations must be correctly identified and
constantly reinforced in order to avoid failure
3.3 Lack of Cooperation from
Users
Users refuse to provide requirements and/or refuse to do
acceptance testing.
3.4 Growing Sophistication of
Users
Users are more knowledgeable, have seen sophisticated
applications, apply previous observations to existing project
3.5 Lack of necessary
knowledge of the
application among the
users assigned
These may influence information systems development (ISD)
project outcome by increasing the amount of work required or the
level of difficulty involved.
3.6 Lack of appropriate
experience of the user
representatives
Users assigned who lack necessary knowledge of the application or
the organization
3.7 User resistance during the
project implementation
Certain individuals do not want to conform the change because of
general phobia of computers or they are worried their jobs are
Threatened
4 Improper Project Management
4.1 Improper change
Management
Each process needs a process to manage change so that scope and
budget are controlled. Scope creep is a function of ineffective
change management and of not clearly identifying what equals
success.
4.2 Lack of Effective Project
Management Skills
A.
Project teams are formed and the project manager does not have
the power or skills to succeed. Project administration must be
properly addressed.
4.3 Lack of Effective Project
Management
Methodology
The team employs no change control, no project planning or other
necessary skills or processes.
4-4 Improper Definition of
Roles and Responsibilities
Members of the project team and the organization are unclear as to
their roles and responsibilities.
4-5 Poor Risk Management Countering the wrong risks.
Page 47
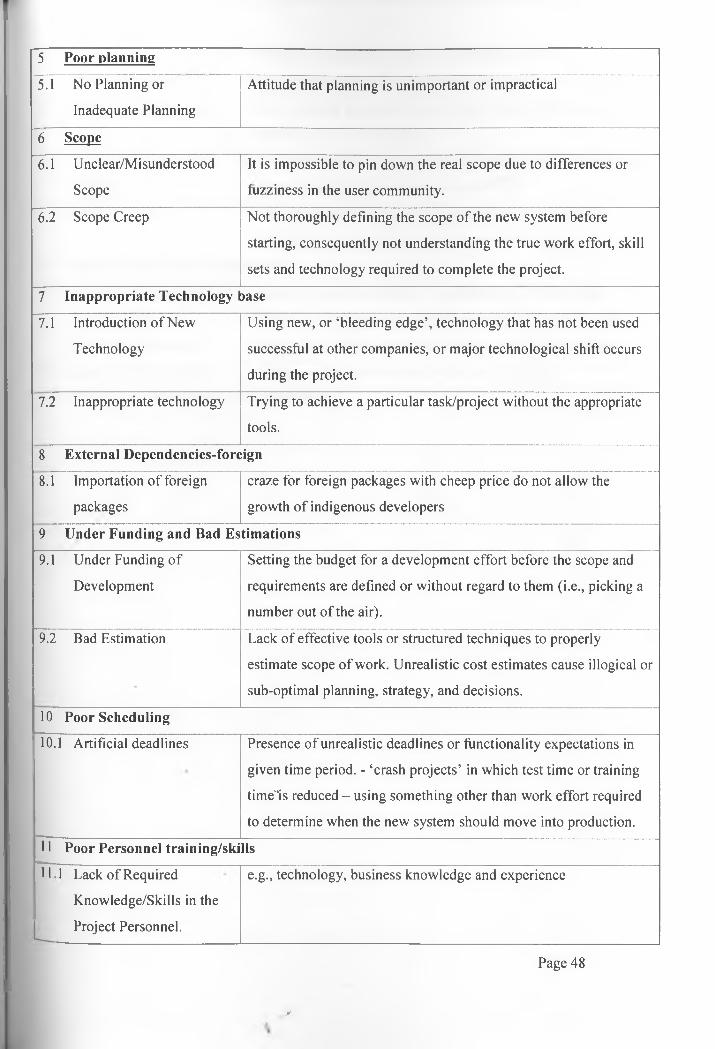
5 Poor planning
5.1 No Planning or
Inadequate Planning
Attitude that planning is unimportant or impractical
6 Scope
6.1 Unclear/Misunderstood
Scope
It is impossible to pin down the real scope due to differences or
fuzziness in the user community.
6.2 Scope Creep Not thoroughly defining the scope of the new system before
starting, consequently not understanding the true work effort, skill
sets and technology required to complete the project.
7 Inappropriate Technology base
7.1 Introduction of New
Technology
Using new, or ‘bleeding edge’, technology that has not been used
successful at other companies, or major technological shift occurs
during the project.
7.2 Inappropriate technology Trying to achieve a particular task/project without the appropriate
tools.
8 External Dependencies-foreign
8.1 Importation of foreign
packages
craze for foreign packages with cheep price do not allow the
growth of indigenous developers
9 Under Funding and Bad Estimations
9.1 Under Funding of
Development
Setting the budget for a development effort before the scope and
requirements are defined or without regard to them (i.e., picking a
number out of the air).
9.2 Bad Estimation Lack of effective tools or structured techniques to properly
estimate scope of work. Unrealistic cost estimates cause illogical or
sub-optimal planning, strategy, and decisions.
10 Poor Scheduling
10.1 Artificial deadlines Presence of unrealistic deadlines or functionality expectations in
given time period. - ‘crash projects’ in which test time or training
timers reduced - using something other than work effort required
to determine when the new system should move into production.
11 Poor Personnel training/skills
111 Lack of Required
Knowledge/Skills in the
Project Personnel.
e.g., technology, business knowledge and experience
>
Page 48

11.2 Lack of “People Skills” in
Project Leadership
PM tries to “manage” schedules, technology, requirements, etc.,
ignoring that management is dealing with people on the team.
11.3 Poor Team Relationships Strains existing in the team due to such things as burnout or
conflicting egos and attitudes.
11.4 Insufficient/Inappropriate
Staffing
Not enough people or people with wrong skills/insufficient skills
assigned to project, regardless of availability
11.5 Staffing Volatility At some point in the project, losing the key project manager,
analysts or technicians (especially in new technology).
12 Development process/methodology
12.1 Lack of Effective
Development
Process/Methodology
Leading to quality problems - Documentation, Software and
Testing—poor estimating — insufficient time for up-front work,
e.g., design—little flexibility for change—insufficient testing.
12.2 Lack of quality standards no literature for development process or techniques
Table 3-7: Proposed IS failure model and descriptions
/
Page 49
V

4. CHAPTER 5: DISCUSSIONS
In this chapter, discussion of objective results and the evaluation of the model designed in Chapter
4 are presented. This evaluation comprises of testing, results of the testing and a discussion of the
results.
4.1. Discussions
4.1.1. Overview
This survey revealed that even though causes of failure are known, they are still repeated. There is
need to develop a model of common factors of failure. The factors were then given relative
importance scores based on the survey responses. From this a system that can help to test the
viability of a software project was developed.
4.1.2. Objective one results
Objective one: To investigate various system development practices by different organizations.
The most common system development practices revealed were adequate planning, training of
users and continuous support of the system. Most of the respondents do not have effective
development methodology.
4.1.3. Objective two results
In the study, objective two was to find out the factors that lead to IS development project failures in
Kenyan organizations
The categories of the factors of failure discovered in the study were:
❖ Top management commitment to the project
❖ Incomplete/Changing Requirements
❖ Poor Relationship Management
❖ Improper Project Management
❖ Poor Planning
❖ Scope
❖ Inappropriate Technology base
❖ External Dependencies-foreign
❖ Under Funding and Bad Estimations
❖ Poor Scheduling
Page 50
❖ Poor Personnel training/skills
❖ Development process/ methodology
Several indicators that form the category of failure were also discovered.
The investigation of these indicators included the following:
❖ An extensive literature review identified some aspects of the software development process
failures (Chapter 2).
❖ Questionnaires responses and interviews with software practitioners (programmers,
database developers, system analysts, etc.) and Information System users identified aspects
of the development process that practitioners considered inconsequential to project success.
4.1.4. Objective three results
The third objective: To devise a model o f indicators o f ISDP failures.
Both the literature review and questionnaire responses with practitioners provided support for the
creation of a model that included some of the factors of failure in the software development
process. Through the survey, the respondents were asked to consider a particular project that they
had worked on, with emphasis on several aspects related to top management commitment to the
project, Incomplete/Changing Requirements, Poor Relationship Management, Improper Project
Management, Poor Planning, Scope, Inappropriate Technology base, External dependencies-
foreign, Under Funding and Bad Estimations, Poor Scheduling, Poor Personnel training/skills and
Development process/ methodology
The research model developed is an Information System Failure Model. The prototype system
developed can be used by IS stakeholders in assessing the viability of their projects before
undertaking them or during the process.
4.1.5. Objective four results
The last objective: to develop a prototype system that can be used to assess the viability o f a
software project.
Using appropriate tools and techniques, a Project Viability Assessment system was developed. TheA.
system can be used by IS practitioners and IS users to determine the success potential of a software
development project. This system was used to evaluate the Information System Failure model.
Some of the questionnaire respondents’ data collected from the survey was used in the system for
evaluation.
Page 51

4.2. Evaluation of the Model
Evaluation of systems is usually done over years of practical use and in fact a complete evaluation
of a system success requires multiple measures [Klein and Jiang 2001; Jiang, et al 2001], However,
this is a complicated undertaking. . The projects with which use of such models are evaluated, are
followed through many years to determine their satisfaction.
The proposed IS Failure Model and the prototype Software Project Assessment Viability system
however, do not have the privilege of time. Tentative evaluation for the purpose of this report has to
be done.
A prototype system was created to evaluate the model. Testing, therefore, involved using the data
already collected in the survey in the designed system. This data was not used in the development
of the model. It mainly consists of some of the responses from the survey. The prescribed outcome
given in the survey (from respondents) was compared with the outcome of the system. Every match
was a score for the model.
Out of the reported projects, 70% had a positive match with the output indicated on the
questionnaire. That is the software project output indicated on the respondents’ questionnaire
matched the output prescribed by the prototype system.
CATEGORY NUMBER & PERCENTAGE
Matching 70%
Not matching 30%
Total 100%
Table 4-1: Evaluation Results
Even though, these results may not be as impressive and may not be used widely as the widely
referenced Standish Chaos study, they are reasonably remarkable.
The use of the computerized system to calculate the success potential gives a better visual view of
how the software project may go.4.
4.3. Limitations of the study
The accuracy of the interviews and questionnaire results in this entire study, rely on honesty of the
participants. It is worth noting that information pertaining to project failure and disillusionment is
not openly discussed and eliciting candid responses is not easy. A prototype of the model was
evaluated for accuracy and in comparison to the questionnaires’ responses was found to be 70%
accurate. Even though the STANDISH CHAOS study is most often used by researchers and thus
Page 52

rated highly effective, the IS Prototype system developed from the IS Failure Model in this study
does not rate badly as some of its functionalities are crude and can be improved immensely. For
example, a more exciting group of questions on the factors and indicators of failure can be used. It
is also quick and may need a session of less than half an hour. It can also be used by both technical
experts and novice users thus do not need one to be highly trained
It was also a challenge in coming up with the relative importance scores and rules to be used on the
system. The rules have discussions to the apparent calculated success potential. These rules were
supposed to be as generic as possible as to apply in all situations related to Software development
processes.
The other challenge most respondents of the questionnaire were from technical side, especially
developers. It can affect the results and analysis of my survey.
The research took a general stance and hence there was no distinction concerning the nature of
businesses the organizations are into or whether they were public or private sectors
/
Page 53
\

5. CHAPTER 6: CONCLUSION AND RECOMMENDATIONS
In this chapter, conclusion and recommendations were drawn on the basis of literature review and
survey analysis. This chapter is divided into the following parts:
❖ Conclusion -On the basis of presented research study
❖ Recommendations for further research-Possible areas for future research
5.1. Conclusions
This research project managed to achieve the objectives set. The main purpose of this research was
to find, categorize, illustrate and devise a model for factors and indicators of information system
and project failure based on a literature review and survey of organizations in Kenya. From this, it
was possible to clearly define factors of IS failure and their related indicators. The study led to the
conclusion that some of the factors of IS failure in the Kenyan context can be categorized into the
twelve dimensions. The proposed IS-Failure model binds all dimensions and their indicators
together.
The model discussed in this project is expected to be used to:
❖ Provide a basis for ICT personnel to assess their software development processes
❖ Contribute to the body of knowledge on factors that affect software development process
failures
5.2. Recommendations for Further research
This research study, has taken a general stance by making no distinctions concerning the nature of
businesses the organizations are into or their being from public or private sectors. Furthermore most
of the respondents were IT practitioners especially developers. On this basis, the major failure
factors identified and their corresponding recommendations seem to be valid from IT practitioners
stand and regardless the type of organizations. This consequently creates future research proposal
for further investigation. Thus a study can be done considering these distinctions.
Also to follow up on this research, one would develop more detailed tools (surveys, job aids, and
data) for every indicator listed in this model, for validity and reliability purposes.
Page 54

5.3. REFERENCES
1. BENTLEY LONNIE D., WHITEN JEFFREY L., DITTMAN KEVIN C.: System Analysis
and design Methods 5th Edition. Chapters 1-3
2. BROOKS, FREDERICK P., Jr., The Mythical Man-Month, Addison-Wesley, Reading, MA
(1995).
3. CHAPMAN DAVID How to do Research at the MIT AI Lab. Available Online
http://www.cs.indiana.edu/mit.research.how.to/section3.12.html (1998)
4. CONRAD KIMBERLY, HAVELKA DOUGLAS, GLASSBERG BONNIE “Project Success
Model for Information system Development (2002)
5. FEGHALI, T. AND ZBIB, I.J. ‘Global information systems failure sphere: a forecasting
model’, J. Global Business Advancement, Vol. 1, No. 1, pp.140-152. (2007)
6. GARDNER, D. J. How to avoid IT project Failures. Consulting to Management (2000).
7. GICHOYA D “Factors Affecting the Successful Implementation of ICT Projects in
Government” The Electronic Journal of e-Government Volume 3 Issue 4, pp 175-184,
available online at www.ejeg.com (2005)
8. HEEKS, R, E-government for Development. Available online:
http://www.egov4dev.org/index.shtml (2008),
9. HEEKS, R., Causes of E-Government Success and Failure [Homepage of IDPM, University
of Manchester], [Online], Available: http://www.e-devexchange.org/eGov/causefactor.htm
(2004)
10. HENDERSON DAVE “Issues with auditing the system development process” Information
systems control journal, Volume 6, pp 42-44. (2008)
11. HORINE, G. M. Absolute Beginner's Guide to Project Management (2005).
12. JIANG, JAMES AND GARY KLEIN, Software Development Risks To Project effectiveness,
Journal of Systems and Software, Volume 52, Number 1 (2000).
13. KERZNER, H. Project Management: A Systems Approach to Planning, Scheduling and
Controlling (8th Ed.), (2003).4.
14. LINBERG, KURT R., Software Developer Perceptions about Software Project Failure: A
Case Study, The Journal of Systems and Software, Vol. 49, (1999).
15. MITULLAH W AND WAEMA T. State of ICTs and Local Governance in Kenya: Needs
analysis and Research Priorities. Available online:
http://unpan 1 .un.org/intradoc/groups/public/documents/CAFRAD/UNPAN021416.pdf
(2005) .
16. MOUSSA, A. AND R. SCHWARE, Informatics in Africa. World Development (1992)
Page 55
17. PROCACCINO J. DREW, Quantitative Models for Early Prediction of Software
Development Success: A Practitioner’s Perspective. (2002)
18. SAUER CHRIS, Why Information Systems Fail: A Case Study Approach. Henley-on-
Thames: Alfred Waller, 1993.
19. STANDISH GROUP, CHAOS Available online:
http://www.standishgroup.com/visitor/voyages.htm (1994).
20. H.STEPHEN , MAEVE C., D. JAMES, Management Information Systems for the
Information age 2nd ed. Chap. 5 (2000)
21. YEO, K.T Critical failure factors in information system projects. International
Journal of Project Management, (2002)
Page 56

6. APPENDIX
The user manual was created to act as a guide to help users operate the system exclusively. The
manual consists of description of the various modules of the system, screenshots and flow of
operations in a simplified manner.
Logon Process
PVAS presents the user with a friendly logon screen as shown below. The user is invited to specify
his/her name and password to access the system. If the user is accessing for the first time, the user
is required to set his/her own unique password.
6.1. Appendix A -User Manual -System Description
Figure 6-1 Login Screen
Menu
Page 57

The menu is represented on the left side of the screen. It consists of three menu items. Each menu
item is descriptive of the function it offers. Depending on the user rights some of this menu items
may be inactive. E.g. Non administrators group may have some of the menu links inactive.
System users ’ link
Creation of users and their roles are performed from this link. Modification of rights and privileges
are also carried out here. The administrator starts by creating users. A default password-p@sswOrd-
is also set automatically. The password must be changed by user at first logon.
The administrator also sets the role of the users here. The role determines the rights the user will
have while using the system. The user rights can also be changed by the administrator here.
Figure 6-2 System users
System Parameters
This link is only used by the system administrators. The administrators can change the system
questions and relative importance scores of the factors. To use this link proceed as follows:
❖ Select the option you would like to edit-edit questions or edit relative scores.
❖ Edit the question or the relative score appropriately.
❖ Click on set updated values button.
❖ A message is displayed showing update successful.
❖ One can only edit one of the options at a time.
Page 58
*_ y

£1 mse project eith er *21 Document 1 - M oose / *r eject: J-'Urkigeiiwr.t
E d i t Q u e s t io n *
E d i t R e l a t i v e S c o re *
ylbat Is the likelihood that:
R e la t iv e S c o re ;
%7 The project may/is lacking the appropriate technology and tools
R e la t iv e S co reLack of top mgmt support may be/have been countered in the project B
2 .The user requirements are not. well defined 8 The project entirely depends on foreign companies
R e la t iv e S co re
■R e la t iv e S co re ;
%3 .The relationship management of the project itakeholders is poor 9 The project is/may experience under funding
and has bad estimations
l The definition of roles and responsibilities in the project is Improper 10. The project may experience time and
schedule constraints
5.There may be no project planning11. The required competencies are/were lacking in the project
6.The project scope is undefined and objectives were/are misunderstood
12. The project lacks an effective development methodology and process
/Figure 6-3 Parameters
Compute Project Viability
This button is used by all registered users who want to gauge the success potential of their projects.
Once clicked, a set of questions is presented. The user is required to select the answers
appropriately from the choices given. A next button is used by user to move to the next page for
more questions. Once through, the user clicks on the finish button and a report of the success
potential calculated is displayed.
Page 59
_ y

Figure 6-4 Computation welcome screen
Figure 6-5: Computation
A report is then displayed indicating the success potential of your project (depending on your
answers) and some necessary advice you may take.
Page 60

Display Results4 . Tne a e r i n i n o n or roies ana------------responsibilities in the project is improper5. There ma y be no project planning
Possible
Possible
7.2
4.8
6.The project scope is undefined and objectives were/are misunderstood
Very Unlikely 8
7.The project may/is lacking the appropriate technology and tools
Very Unlikely 7
8.DThe project entirely depends on foreign companies
Likely 2.8
9.DThe project is/may experience under funding and has bad estimations
Very Likely 1.4
lO.DThe project may experience time and schedule constraints
Very Likely 1.2
ll.DThe required competencies are/were lacking in the project
Likely 2
12.DThe project lacks an effective development methodology and process
Unlikely 4
The Success Potential of Your Project is 6 0 2 %This potential is indicates that, the project is likely succeed. Pay attention to areas that you suspect could your project from not reaching the highest potential
toaffect
V
Figure 6-6: Report
Page 61

6.2. Appendix B- Program Code
Code to connect to databasePublic Function Connect_string() As String
Dim conString As String = String.Empty conString = "Data Source=.\SQLEXPRESS;"constring &= "AttachDbFilename=" & Application.StartupPath &
"\Proj_Man.mdf;"conString &= "Integrated Security=True;User Instance=True"
Return conString
End FunctionCode to gather the parameters from the database
Dim pConnec As String = String.Empty Dim pCom As String = String.Empty Dim pReader As SqlDataReader Dim pcommand As SqlCommand Dim pTrans As New Data_Trans
pConnec = pTrans.Connect_string() pCom = "SELECT * FROM paramet"
Trypcommand = New SqlCommand()With pcommand
.Connection = New SqlConnection(pConnec)
.Connection.Open()
.CommandType = CommandType.Text
.CommandText = pCompReader = .ExecuteReader(CommandBehavior.SingleRow)
End WithIf pReader.HasRows Then
While pReader.Read With pReader
mgt = CDec(.Item(0)) mreqs = CDec(.Item(l)) mcomp = CDec(.Item(2)) mself = CDec(.Item(3)) mCon = CInt(.Item(4))
End With End While
End IfpReader.Close()
Catch exO As SqlExceptionMsgBox("Error: " & exO.Message & " Occured.", MsgBoxStyle.Critical, "SQL " & Me.Text)
Catch ex As ExceptionMsgBox("Error: " & ex.Source & " Occured.", MsgBoxStyle.Critical, Me.Text)
FinallypReader = Nothing pCom = Nothing GC.Collect()
End Try End Sub
Code to perform the calculationsPublic Function Factor(ByVal percl As Decimal, ByVal vail As Integer, ByVal confactor As Integer) As Decimal
Dim percentile As Decimal = percl Dim answer As Integer = vail Dim fact As Integer = confactor
Page 62

Dim Sn As DecimalSn = (percl * vail / confactor)Return Sn
End Function
Private Sub gp_method_Validating(ByVal sender As Object, ByVal e As System.ComponentModel.CancelEventArgs) Handles gp_method. Validating
If Me.methl.Checked = True Then x l2 = 1ml2 = Me.methl.Text
Elself Me.meth2.Checked = True Then xl2 = 2ml2 = Me.meth2.Text
Elself Me.meth3.Checked = True Then xl2 = 3ml2 = Me.meth3.Text
Elself Me.meth4.Checked = True Then xl2 = 4ml2 = Me.meth4.Text
Else xl2 = 5ml2 = Me.meth5.Text
End IfS12 = Factorfmmeth, xl2, mCon)
End Sub
Page 63
\

6.3. Appendix C: Questionnaire analysis
Question/Percentage Response A in %ages Bin%ages
1) Lack of top management commitment to the projectla) Lack of top management commitment to the project? 100 0lb) Inadequate supervision from top managers 66 34lc) Lack of Consultants support that last right through the
project?77 23
2) Incomplete/Changing Requirements2a) Lack of Frozen Requirements 90 102b) New and/or Unfamiliar Subject Matter for Both Users and
Developers87 13
2c) Inadequate documentation of user requirements 62 383) Poor Relationship Management
3a) Poor Communication among team members 65 353b) Unrealistic user expectations 80 203c) Low level of Cooperation from Users 84 163d) Growing Sophistication of Users 77 233e) Lack of necessary knowledge of the application among the
users assigned70 30
3f) Inappropriate experience of the users 76 243g) User resistance during the project implementation 88 12
4) Improper Project Management4a) Improper change management 56 444b) Lack of effective project management skills 60 404c) Lack of Effective project management methodology 67 334d) Improper definition of roles and responsibilities 88 124e) Poor risk management 84 16
5) Poor Planning5a) No Planning or Inadequate Planning 70 30
6) Scope6a) Unclear/Misunderstood Scope/Objectives 66 346b) Scope Creep 70 30
7) Inappropriate Technology base7a) Introduction of New Technology 70 307b) Inappropriate technology 65 35
8) External Dependencies-foreign8a) Importation of foreign packages 68 32
9) Under Funding and Bad Estimations9a) Under Funding of Development projects 66 349b) Bad Estimations 64 36
10) Poor Scheduling10a) Artificial deadlines 63 37
11) Poor Personnel training/skills1 la) Lack of Required Knowledge/Skills in the Project
Personnel.70 30
lib) Lack of “People Skills” in Project Leadership 67 33
Page 64

11c) Poor Team Relationships 59 411 Id) Insufficient/Inappropriate Staffing 62 381 le) Staffing Volatility 44 56
12) Development process/ methodology12a) Lack of Effective Development Process/Methodology 70 3012b) Lack of quality standards 50 50
Page 65
\

6.4. Appendix D-Sample Questionnaires
OUESTIONAIREIntroductionThis questionnaire is prepared and sent to you to enable us gather information relating to ICT
development projects in Kenyan organizations. The objective of this study is to gain in-depth
understanding of factors affecting success of Information system development projects and out of
this, come up with recommendations which could be shared among various users later on. In order
for me to achieve this objective, I would be most grateful if you could take a while and respond to
this questionnaire. I wish to assure you that the information gathered will be considered strictly
confidential and will therefore not be used for any other purpose other than seeking to fulfill
academic requirements for award of a degree.
Please feel free to contact me on my email address: e [email protected] or my phones Tel:
2769000 Cell: 0733918908 or 0721361650 should any of the questions not be clear to you.
1) Which sector is your organization primarily in?
Learning InstitutionRegulatory bodyTransportHealthAgricultureHospitalityT elecommunicationAdvocacyFinanceManufacturing and services
2) How long have you been involved in ICT project development?
Less than one year
1 - 5 years 6 - 10 years 11-15 years Over 15 years
3) On average, how many projects have you undertaken?
None 1 -5 6- 10 11 -15 Over 16
Page 66
„ y

4) List some software projects you have undertaken. (Use additional paper if necessary)
No. Yearplanned
Organization/ministry
projectname
Scheduledtime
Actualtimetaken
Budgetedcost
Actualcost
Outcome (Did the project succeed or fail? Explain)
1
2
3i
4
5
6
7
8
9
10
Page 67

5) With respect to the failed IS projects, rate the factors below 1 (most frequent) to ten (least frequent) as to why the Organization’s IS failure ma occur.
Factor 1 2 3 4 5 6 7 8 9 10Lack of top management commitment to the projectIncomplete/Changing RequirementsPoor Relationship ManagementImproper Project ManagementPoor PlanningScopeInappropriate Technology baseExternal Dependencies-foreignUnder Funding and Bad EstimationsScheduling- artificial deadlinesPoor Personnel training/skillsLack of effective Development process/ methodology
6) For the IS projects that fail, at what stage do they fail?
Development stage Yes NoDuring problem scoping and inceptionDuring requirements analysisDuring designDuring codingDuring testingDuring implementation and maintenance
Page 68

7) Which of the following system development practices do you carry out during an informationsystem development project?
Practice Yes No
Effective development process/methodology
Risk management e.g. staff turnover
Adequate planning
Definition of roles and responsibilities
use of appropriate technology
Training of users
Continuous support when system is in use
Section two: Causes of Software Project Failures
1) Top Management Support:
Very likely Likely Possible Unlikely Very Unlikely
1 b) Inadequate supervision from top managersVery likely Likely Possible Unlikely Very Unlikely
lc) Lack of Consultants support that last right through the project?
Very likely Likely Possible Unlikely Very Unlikely
2) Relationship management2a) Unrealistic user expectations
Very likely Likely Possible Unlikely Very Unlikely
2b) Low level of Cooperation from Users
Very likely Likely Possible Unlikely Very Unlikely
2c) Growing Sophistication of Users
Very likely Likely Possible Unlikely Very Unlikely
Page 69

2d) Lack of necessary knowledge of the application among the users assigned
Very likely Likely Possible Unlikely Very Unlikely
2e) Inappropriate experience of the users
Very likely Likely Possible Unlikely Very Unlikely
2f) User resistance during the project implementation
Very likely Likely Possible Unlikely Very Unlikely
3) Project Planning and Management3a) The project manager does not have enough skills and expertise in managing the project
Very likely Likely Possible Unlikely Very Unlikely
3b) Poor project planning
Very likely Likely Possible Unlikely Very Unlikely
3c) The Project planning process does not include operational resources
Very likely Likely Possible Unlikely Very Unlikely
4) Requirements and Scone4a) No user requirements.
Very likely Likely Possible Unlikely Very Unlikely
4b) ‘Unfrozen’ user requirements
Very likely Likely Possible Unlikely Very Unlikely
4c) The scope of the project is not well-defined and understood
Very likely Likely Possible Unlikely Very Unlikely*
5) Funding and Scheduling Estimations5a) Inadequate funding to support all the phases of the project
Page 70

Very likelv Likely Possible Unlikely Very Unlikely
5b) No effective tools or structured techniques to properly estimate scope of work.
Very likely Likely Possible Unlikely Very Unlikely
6) Development Process6a) Lack of a prescribed software development procedure
Very likely Likely Possible Unlikely Very Unlikely
6b) No follow up to ensure that the system has been accepted and well understood by the end- users
Very likely Likely Possible Unlikely Very Unlikely
7) Personnel7a) The staff in the team have no skills required to perform their roles
Very likely Likely Possible Unlikely Very Unlikely
7b) In the projects undertaken, does everyone work together
Very likely Likely Possible Unlikely Very Unlikely
7c) Losing the key project manager, analysts or technicians at any stage in the project.Very likely Likely Possible Unlikely Very Unlikely
8) Technology8a) The technology being used in the project is not familiar to all the stakeholders
Very likely Likely Possible Unlikely Very Unlikely
8b) The tools/technology inappropriate for the project being undertakenVery likely Likely Possible Unlikely Very Unlikely
Project questionnaire fo r users
a) Details
Page 71

Department Work section
Ql: Level o f Participation in Application development. Please selectInvolved in generating requirementsInvolved in designing applicationInvolved in developing applicationInvolved in deployment, training and support
one- the most common
Q2: How would you define software project failure? Please select oneAccording to specification but was not on timeAccording to specification but lack some quality aspectsAccording to specification but was over budgetedNot according to specification but fulfills time, quality and budget requirements
Q3: Opinions about application systems. Please select one.Enough control over the look & feel of interfaceToo much time taken away from regular workSystem has become a burdenConfidence in data has increasedAble to reduce manpowerTook a long time to stabilizeHas been good for the total organization
Q4: Problems encountered in the recent application systems Not enough supportInsufficient testingCannot do jobInadequate user skillsNot up to expectationInsufficient trainingSlow performanceInsufficient budget
Q5: Probable cause o f these problemsSpecifications not clear -
Expectations not statedRequirements changedInsufficient study analysisUsers not sufficiently involvedInsufficient assessment of costRevision of budget allocation
Page 72